 Bara’ W. Al-Mistarehi
 Ahmad H. Alomari
 Rana Imam
 Tasneem K. Alnaasan
95% of researchers rate our articles as excellent or good
Learn more about the work of our research integrity team to safeguard the quality of each article we publish.
Find out more
ORIGINAL RESEARCH article
Front. Built Environ. , 15 June 2022
Sec. Computational Methods in Structural Engineering
Volume 8 - 2022 | https://doi.org/10.3389/fbuil.2022.917017
This article is part of the Research Topic Machine Learning Applications in Civil Engineering View all 10 articles
Traffic accidents are considered the leading cause of death for the age group (5–29). They cause approximately 1.3 million deaths every year. Different factors cause traffic accidents; one of them is speeding violations. This work studied speeding violations and the factors that affect them in Irbid, Jordan. Several factors related to the driver, environment, vehicle, road, and weather conditions were studied. The analysis results showed that age, vehicle type, speed limit, day of the week, season, accident year, accident time, license category, and light condition affect speeding violations. To be more specific, young drivers, morning rush hours, clear visibility during daylight, the winter season, slippery roads (due to rain, snow, or ice at low temperatures), and a speed limit of 40 km/h in residential areas; were all associated with a high percentage of speeding violations. Seven hot spots for speeding violations in Irbid were specified, and the free flow speed was measured using the radar and video at these hot spots. The 85th percentile speed was estimated, and the results for all locations were less than the speed limit. In addition to that, the radar and video measurements were compared to specify the most accurate method. The results did not show any difference between the measurements.
With the increasing demand for commercial shipments, people, and mobility by air, marine, and land, there is an urgent need not just to raise the capacity of the roads connecting the various service providers and infrastructure between the different types of transport modes (Belokurov et al., 2020; Dulebenets, 2020; Elmi et al., 2022). There is also a necessity to discover new policies to manage traffic flow and passenger movements, evolve public transport, and shift the dependency on passenger cars toward a shared mobility future with better use of intelligent transportation systems (Enoch et al., 2020; Albayrak et al., 2020; Rahimi et al., 2021). On the other hand, the increasing traffic volumes (passenger and freight) on roadways result in higher exposure for road users and an increased risk of accidents associated with the driver, environment, vehicle, road, and weather conditions. Traffic accidents are considered the leading cause of death for the age group (5–29). They cause approximately 1.3 million deaths every year (WHO and World Health Organization, 2021). In Jordan, traffic accidents are among the top ten causes of death (CDC, 2014). According to the Annual Report for Traffic Accidents in Jordan for the year 2019, there were 161,511 traffic accidents that resulted in 643 deaths, 792 severe injuries, 6062 moderate injuries, and 10,159 slight injuries. The cost of these accidents was estimated to be 324 million Jordanian Dinars (PSD and Jordanian Public Security Directorate, 2019; Alomari et al., 2021a; Bara’W et al., 2021; Al-Mistarehi et al., 2021; Hazaymeh et al., 2022).
Speeding is one of the causes of traffic accidents. According to a study of 345 Ghanaian drivers, speeding behavior dominated the drivers’ behaviors compared with overtaking. Speeding behavior increases as the influence of the motivational factors increases, such as the presence of friends, feeling comfortable while speeding, and previous experience in driving (Atombo et al., 2016). In Riyadh, Saudi Arabia, speeding is the first and main cause of severe injury accidents and Property Damage Only (PDO) accidents (Al-Ghamdi, 2003). Also, high speed is responsible for the high percentage of pedestrian fatalities in Kuwait (Koushki et al., 2001). In Jordan, it was revealed that when the difference between the design speed and the speed limit is greater than 10 km/h, there would be an increase in the speed variance and its safety severity (Alomari et al., 2021b; Alomari et al., 2021c). Obaidat et al. (2008) studied speeding in Jordan as one of the most dangerous driver behaviors. The most important reasons behind this behavior were an emergency, running late for work, traffic jams, road grade, terrain type, social culture, low-speed limit, and wrong overtaking. Mujalli (2018) studied the main factors that lead to traffic accidents. The researcher found that speeding is one of the violations that can lead to traffic accidents with high severe injuries or fatalities. Jadaan et al. (2021) studied driving behavior in Amman, Jordan. Their study revealed that speeding is the most frequent traffic violation. Results showed that 30% of drivers ignore speed limits late at night and early morning. Almost 36% of the respondents reported that speed cameras are the most effective tool for traffic enforcement. Atieh et al. (2020) examined Jordanian speeding behavior in Amman, Jordan. The results showed that speeding is significantly influenced by three factors: being late for work, being alone in the vehicle, and emergencies. Also, it was found that 23.1% of respondents mentioned that speeding is a habit for them. Another study in Jordan conducted by Bener et al. (2019) indicated that excessive speed, mobile phone usage, and driving skills increase accidents. Mobile phones and excessive speed were the most vital factors that cause accidents.
Al-Omari et al. (2013) investigated the influence of vehicle and driver on the vehicle’s speed in Jordan. It was found that higher speeds are associated with male and young adult drivers, passenger cars, new vehicles, and seat belt usage. On the other hand, loading vehicles and increasing the number of occupants in a vehicle were associated with lower speeds. Zamanov (2012) studied the factors that increase the percentage of speeding violations. Regression and analysis of variance (ANOVA) were used to analyze the data. It was revealed that the driver’s age and gender were the most influential factors. Also, street lighting and median width affected speeding violations. Shawky et al. (2017) studied the effects of different factors on speeding violations to specify the best positions of speed cameras on highway in Abu Dhabi, United Arab Emirates (UAE). A negative binomial analysis was conducted to predict speeding violations. The examined variables were related to roads, traffic information, and camera characteristics. The results indicated that speed limits influenced speeding violations at a 95% confidence level. Also, speeding violations increased during weekends on rural highways because of the road-based trips between different cities. Wu and Hsu (2019) studied speeding violations in northern Taiwan using the association rule algorithm. Different factors, such as gender, age, violation area, and day of the week were investigated. The outcomes indicated that female drivers and those in the age group (18–24) were more likely to violate speed limits. Also, midnight and dawn time had a significant influence on speeding violations. (Inada et al., 2021) used time series to examine collisions caused by speed-related traffic violations in Japan during the COVID-19 lockdown period. They found no proof that the number of fatal accidents caused by speeding went up during the lockdown. According to Bolsunovskaya et al. (2021), 90% of accidents result from drivers violating the speed limit and other travel rules. They designed an information system structure to photograph and videotape traffic speed violations. A performance evaluation conducted at the conclusion demonstrated that developing an information system is cost-effective and will pay for itself in the shortest possible time. The developed complex outperforms existing systems in terms of precision and data reliability.
Javid and Al-Roushdi (2019) examined drivers’ speeding behaviors in Oman. A questionnaire was used to study the effect of drivers’ attitudes on speeding behavior. Three hundred samples were analyzed using multivariate statistical analysis. The outcomes indicated that young and male drivers were more likely to violate speed. Driving culture, the driver’s personality, and situational constraints were associated with drivers’ speeding behavior. Cheng et al. (2019) employed a binary logistic regression method to study speeding violations in Wujiang, China. The findings revealed that license plate, rainfall, speeding area, and season all impacted speeding violations. A decision tree was used to specify the factors that influence speeding violations. It was found that heavy rain, autumn, and foreign licenses were associated with a high level of speeding violations. Sutela and Aaltonen (2020) investigated speeding sanction rates in Finland in terms of weather conditions and temporal characteristics. Generalized additive models were used for the analysis. The outcomes revealed that rainfall reduced the rate of speeding sanctions. Lunchtime (11 a.m.–3 p.m.) scored the highest speeding sanction rates. (Ambo et al., 2020) investigated the factors that led to different types of traffic violations, such as speeding and illegal parking, in Luzhou, China. A multinomial logistic regression model was developed. The marginal impact and odd ratio were estimated to determine the effect of independent variables on the dependent one. The outcomes showed that buses and vehicles used for passenger transport were associated with speeding violations. Also, the odd ratios for the morning and rainy weather were more than one. This indicates that these variables had a significant effect on speeding violations.
A very limited number of researchers studied speeding violations, and no previous study used traffic accident data, cameras, radar, or machine learning to study these violations. Machine learning has been used extensively in various civil engineering fields and applications. In structural engineering, Gene Expression Programming (GEP) was used by Murad Zuhair (2021) to predict the bidirectional shear strength of columns subjected to biaxial cyclic loads based on a database collected from different experimental studies found in the literature. In pavement evaluation, (Imam et al., 2021) adopted GEP for the first time to predict the Pavement Condition Index (PCI) from the International Roughness Index (IRI) using data that was half compiled from the existing literature and the other half was measured and collected in the field by the authors. Using genetic algorithms and artificial neural networks, (Hanandeh, 2022a) developed a mathematical model to estimate the quality index of flexible pavements. According to the results, the genetic algorithm model outperforms the neural network in performance. As for geotechnical engineering, (Tarawneh and Imam, 2014) developed Artificial Neural Network (ANN) models to predict pile setup for three pile types (pipe, concrete, and H-pile) using 169 dynamic load tests obtained from the published literature and the authors’ files. An evaluation framework for the unconfined compressive strength (UCS) of soils was developed by Al Bodour et al. (2022) using gene expression programming and deep learning methods. The study found the main soil parameters, gave applicable models for figuring out UCS, found essential links between UCS and the void ratio, and found the clay content breakpoint. Circular Failure of Soil Slopes was studied using Classification and Predictive Gene Expression Programming Schemes by Hanandeh (2022b). Higher unit weight, cohesion, and internal friction angle increased safety, whereas higher slope height, incline, and pore pressure decreased safety. In traffic safety, (Al-Mistarehi et al., 2022) used R Studio and ArcGIS to forecast the severity of traffic collisions using machine learning models: random forest, decision tree, and Boost tree algorithms. The random forest model was the optimal algorithm for forecasting crash severity levels. Kuşkapan et al. (2021) used spatial analysis and machine learning algorithms to investigate speed violations by heavy vehicles on highways. The naive bayes (NB) algorithm outperformed support vector machines (SVM) and k-nearest neighbors (KNN) algorithms in terms of both effectiveness and error scales. Decision Trees are used in this research to investigate speeding violations in Irbid and identify the factors that influence this type of violation.
The data for this work was obtained from the Jordan Traffic Institute (JTI) from 2015to 2019 (PSD and Jordanian Public Security Directorate, 2019). A total of 17,237 records were analyzed by applying two types of decision trees: classification and regression tree (CART) and J48 algorithms, using the WEKA 3.8.4 program (Witten et al., 2016). Humans, vehicles, and roadways are the subjects of traffic safety investigations (Alomari and Taamneh, 2020). It is essential to look at these three elements to determine what causes speeding violations, accidents, and the best solutions for each high-risk area with a high accident rate. This study investigated different variables related to the vehicle, driver, roadway, and environment. The most critical studied characteristics were identified after referring to several previous studies discussed in the literature in the introduction section. Table 1 shows these factors and their categories.
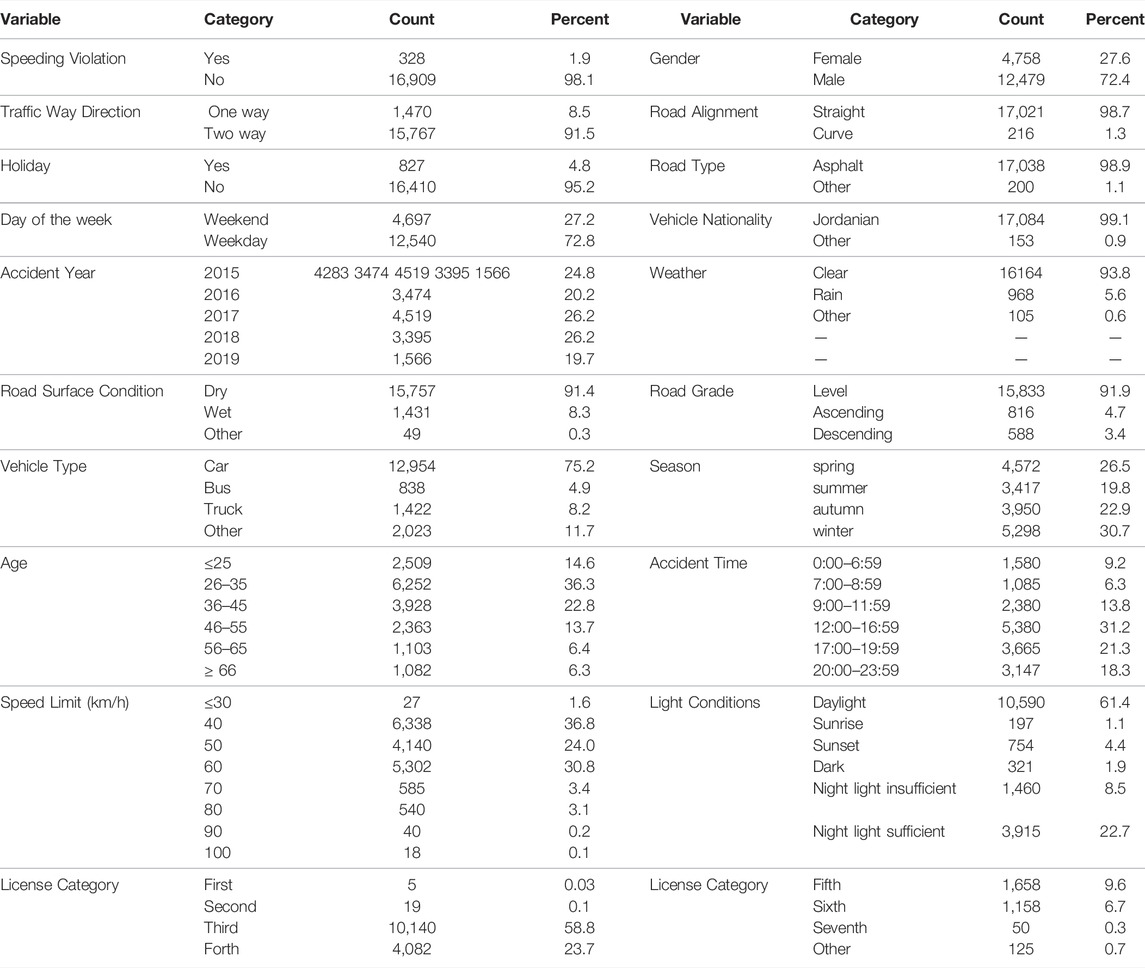
TABLE 1. Variables description.
A decision tree is a machine learning algorithm consisting of branches and nodes that can handle regression and classification problems. It starts with the root node, which splits into child nodes and depends on splitting the data into small subsets to reach a decision. It is a tree-structured classifier, where internal nodes represent the features of a dataset, branches represent the decision rules, and each leaf node represents the outcome. The tree uses splitting criteria to minimize node impurities such as gain ratio and Gini index. The pruning technique is used to increase model precision. There are different types of decision trees, such as classification and regression trees (CART) and J48 algorithms. CART is one of the most common decision tree types. It uses the Gini index as splitting criteria and the cost-complexity model for tree pruning. J48 is the version of the C4.5 algorithms in the WEKA program. It uses the splitting criterion that depends on information gain and the single-pass algorithm for tree pruning (Saravana et al., 2018; Shah et al., 2020; Nathanail et al., 2019).
In order to determine the locations where the speed measurements will be taken in the field, the history of traffic accidents in Irbid city from 2015 to 2019 was scanned and explored for the most frequent areas of traffic accidents that were caused by excessive speeds. Based on the available accident data extracted from the Jordan Traffic Institute (JTI) at the Jordanian Public Security Directorate (PSD and Jordanian Public Security Directorate, 2019), seven streets with the most frequent traffic accidents due to excessive speed were specified: Fawzi Almulki, Prince Hasan, Al-Hashmi, King Hussein, King Abdallah II, Petra, and Irbid-Alhoson Streets. Vehicles’ speeds were measured in September 2021 using a radar gun and a phone camera between 9:00 and 11:00 a.m. The measurements were taken in clear weather, daylight, on dry pavement, and away from interruptions. No traffic law enforcement campaigns were conducted during measurements. One hundred speed records were obtained for each site and each method. Figure 1 shows the hot spot locations for speeding violations.
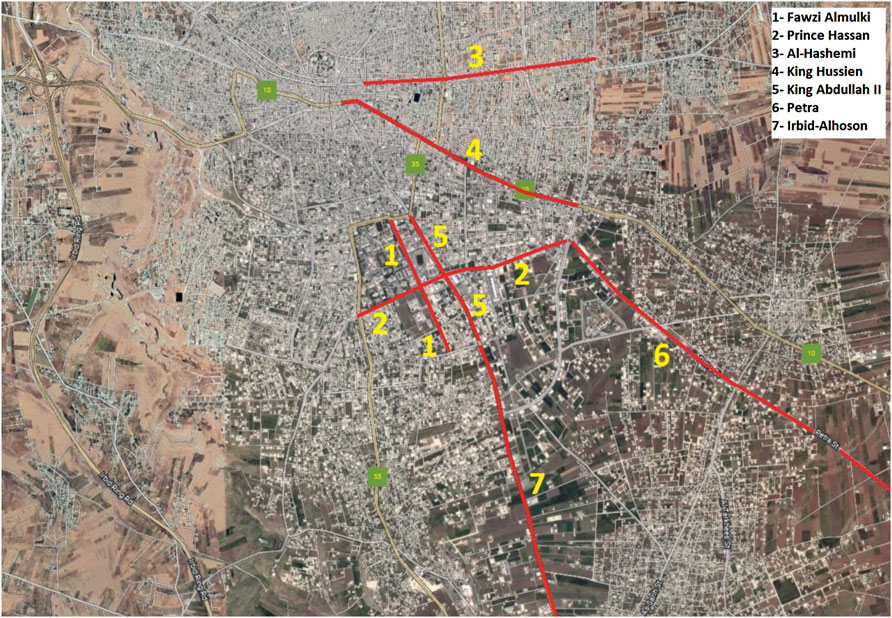
FIGURE 1. Aerial photo for the hot spot locations (Google Map).
Radar measurements were taken at points that are safe and have a clear line of sight on the roadside. Speeds for going and on-coming traffic were measured by firing the laser towards the target vehicle and recording the value that appears on the radar’s screen. To obtain speed measurements from the videos, the distance between two definite points on the site was measured using a measuring tape; Table 2 shows these lengths. Figure 2 shows samples for the studied streets.
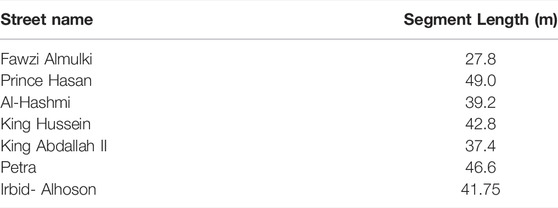
TABLE 2. Segments lengths for speed measurements by video.
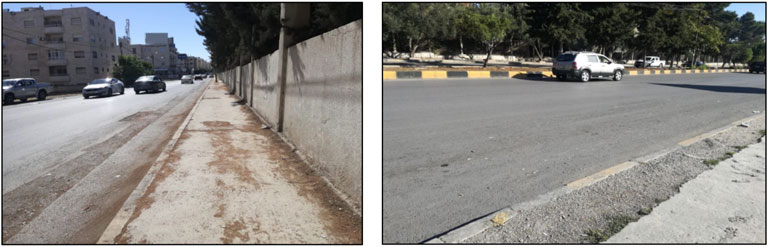
FIGURE 2. Fawzi Almulki street (left) and Prince Hasan street (right).
The time that a vehicle needs to pass the two definite points was measured by using a stopwatch. By knowing the distance and the time, the speed of each vehicle was calculated by the following equation:
Where:
– Speed: vehicle speed (km/h)
– Distance: distance traveled by a vehicle between the two definite points (m)
– Time: time a vehicle needs to pass the two definite points (second)
– 3.6: speed conversion factor from (m/sec) to (km/h).
The important influencing factors were specified using the CART algorithm in the SPSS software. Age, vehicle type, speed limit, day of the week, season, accident year, accident time, license category, and light conditions affect speeding violations. Age groups (26–35) and (36–45) were associated with high speeding violations levels; this result is matched with Al-Omari et al., Tseng, Liang and Xiao’s (Al-Omari et al., 2013; Tseng, 2013; Liang and Xiao, 2020) studies. This is because young drivers underestimate the speeding risk and overestimate their driving abilities, so they tend to drive at higher speeds. Another influencing factor is the vehicle type. Passenger cars violate speed more than other types of vehicles, and this is similar to Al-Omari et al. (2013), Balasubramanian and Sivasankaran (2021) concluded that light motor and two-wheeler vehicles increase speeding violations because of the high number of registered vehicles. The Annual Report of Traffic Accidents for 2019 mentioned that Jordan’s number of registered vehicles increased from 1,412,817 in 2015 to 1,677,061 in 2019 (PSD and Jordanian Public Security Directorate, 2019).
The CART results showed a relationship between speeding violations and speed limits. A speed limit of 40 km/h affects speeding violations. Most speeding violations in Irbid are near residential areas and close to intersections where speed limits are relatively low. Regarding accident time, the speeding violations increase during the period (7:00–8:59), which is known as rush time, and that is similar to (Ambo et al., 2020) and (Zhang et al., 2014) results. In the morning, drivers are in a hurry to avoid being late to work, so they tend to increase their speed. Another influencing factor is the accident year. The years 2015 and 2016 were associated with high percentages of speeding violations. A decrease in speeding violations happened during the years from 2017 to 2019; this may be because of implementing some countermeasures that increase road safety, such as installing radar cameras and red-light cameras. Regarding the day of the week factor, weekdays experienced high-speed levels. This result is not compatible with (Shawky et al., 2017) studies. Balasubramanian and Sivasankaran (2021) concluded that there is no relation between weekdays and speeding, while Shawky et al., 2017) concluded that speeding violations increased during the weekends because of the road-based trips between different cities. Increasing speeding violations in Irbid on weekdays can be linked with the accident time factor, where most violations occur at rush hour on weekdays.
The season is another influencing factor. A high percentage of speeding violations was noticed in the winter; this result contradicts (Zhang et al., 2014) study, which indicated no relationship between season and speeding violations. Slippery roads in winter because of ice, snow, or rain with low temperatures increase braking distance, which increases the probability of speeding (Li et al., 2021). Some factors do not strongly correlate with speeding violations, such as light conditions and license category. Regarding light conditions, daylight affected speeding violations. This result is consistent with (Balasubramanian and Sivasankaran, 2021) results. The clear visibility at daylight encourages driving at high-speed levels. The third category was associated with speeding violations for the license category factor. This factor can be linked with the vehicle type factor since drivers with third category licenses drive passenger cars.
CART and J48 algorithms were applied to assess their efficiencies in predicting speeding violations. Accuracy, Kappa statistic, F-measure, and Root Mean Squared Error (RMSE) are the evaluation metrics for assessing the performance of the classifiers. Table 3 shows the evaluation metrics for these classifiers.
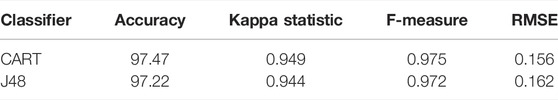
TABLE 3. Classifiers’ evaluation metrics.
According to Table 3, all evaluation metrics are nearly identical. The classifiers’ accuracy scores of 97.47 for CART and 97.22 for J48 are both excellent. The Kappa statistic and F-measure results are greater than 0.5 for both algorithms, showing that the predicted values are very close to the true ones. The Kappa statistic values are 0.949 and 0.944, and the F-measure values are 0.975 and 0.972 for CART and J48, respectively. The RMSE results are relatively low, at 0.156 and 0.162 for CART and J48, respectively. The results for the two classifiers showed excellent performance, which means that these algorithms can predict speeding violations efficiently.
As shown in Table 4, the radar and video readings have 50th and 85th percentile speeds, respectively. Five streets have a speed limit of 60 km/h, which are Fawzi Almulki, Prince Hasan, Al-Hashmi, King Hussein, and King Abdallah II streets. The 50th and 85th percentile speeds for the radar measurements ranged between (34.2–51.6) km/h and (43–58) km/h, respectively. For the video, the percentiles ranged between 42.95 and 48.7 km/h and 49.6–56.8 km/h, respectively. As it was evident from these ranges, especially the 85th percentile speed, the vehicles’ speeds do not exceed the speed limit of 60 km/h. This means that the speed limits are suitable for most drivers. Another observation to support this result is the low percentage of violators. The highest percentage (17%) was for Prince Hasan Street, which is not high. Figure 3 shows the 85th percentile speeds for the radar and the video readings.
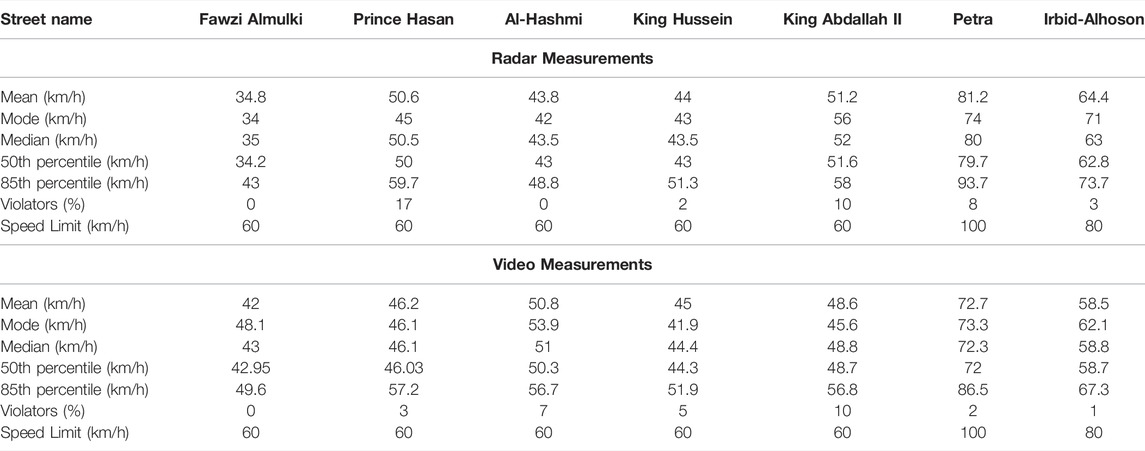
TABLE 4. Descriptive statistics for radar and video measurements.
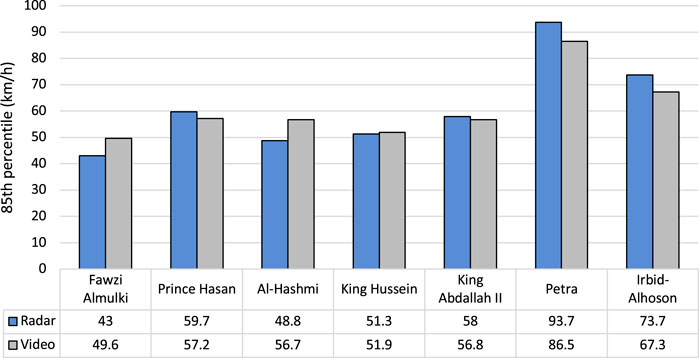
FIGURE 3. 85th percentile speeds (km/h).
The speed limit on Petra Street is 100 km/h. The 50th percentiles for the two methods are 79.7 km/h and 72 km/h; however, 93.7 km/h and 86.52 km/h are the 85th percentile speeds for each approach. Speeds in the 50th and 85th percentiles are below the limit. The proportion of people who have broken the law (8%) is also low. These comparisons and observations indicate that the speed limit is considered suitable, safe, and acceptable for most vehicles.
Irbid-Alhoson Street has a speed limit of 80 km per hour. The radar speed limit for Irbid-Alhoson Street is 80 km per hour in the 50th and 85th percentiles. Radar readings show that the 50th and 85th percentiles are 62.8 and 73.7 km/h, respectively. The values for the video measurements are 58.7 km/h and 67.3 km/h, respectively. The values are considered acceptable by comparing these percentiles with the 80 km/h speed limit because they are less than the speed limit. From the values of the speed percentiles and the low violators’ percentage of 3%, it can be concluded that the speed limit is suitable for the traffic stream. Therefore, speed limits at all locations are suitable and acceptable. This is further supported by the low number of traffic accidents at these sites.
A comparison between the radar and the video was conducted for each site and for all sites together to specify the most accurate method. The Independent Samples t-test was applied to examine the data for each site. The normal distribution of the data was checked using the Kolmogorov-Smirnov test for each site at a 95% confidence level. The test hypotheses are: Ho (the distribution is normal), and H1 (the distribution is not normal).
As shown in Table 5, a comparison between the two approaches using the Kolmogorov-Smirnov test was performed. All of the numbers are greater than or equal to 0.05. (i.e., all the distributions are normal). Since all distributions are normal, the Independent Samples t-test could be applied at a 95% confidence level. The hypotheses are: Ho (the two distributions have equal means, and there is no difference between the radar and the video), and H1 (the two distributions do not have equal means, and there is a difference between the radar and the video).
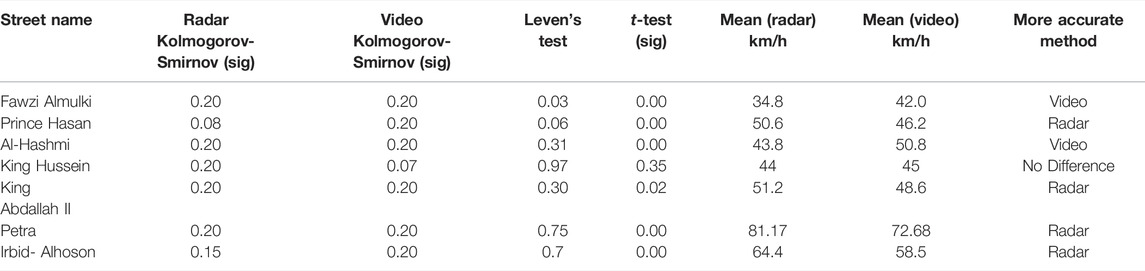
TABLE 5. Kolmogorov-Smirnov test and independent samples t-Test results for each street.
Also, Leven’s test for equality of variances was conducted. The test hypotheses are: Ho (the variances are equal), and H1 (the variances are not equal). Table 5 also presents Leven’s and t-test results. Leven’s test results indicate that the variances are equal for all streets (p-value > 0.05), except Fawzi Almulki Street (p-value < 0.05). For Fawzi Almulki Street, the t-test value for unequal variances was taken. The p-values for the t-test are less than 0.05 for all streets except King Hussein Street. For values less than 0.05, the alternative hypothesis is accepted (i.e., there is a difference in performance between the radar and the video). The more accurate method is the one that achieved the highest mean. The radar is more accurate than the video at four locations: Prince Hasan, King Abdallah II, Petra, and Irbid-Alhoson Streets. On the other hand, the video outperforms the radar at Fawzi Almulki and Al-Hashmi streets. For King Hussein Street, the p-value for the t-test (0.35) is more than 0.05; we accept the null hypothesis (i.e., there is no difference in performance between the radar and the video at this location). This difference in performance can be attributed to the nature of each method. During the measurement process, drivers may have noticed the radar, which may have affected their speed. There may be many mistakes when measuring the distance and time, which makes the video readings less accurate.
The data for all locations were examined together. To determine the suitability of the Independent Samples t-test, the Kolmogorov-Smirnov test was used to check the normal distribution of the data. Table 6 shows the Kolmogorov-Smirnov test results. The values for the two distributions are 0.00, which is less than 0.05 (i.e., the distributions are not normal); hence, the Independent Samples t-test cannot be applied here. The Mann-Whitney U test was applied to specify which method is more accurate at a 95% confidence level.
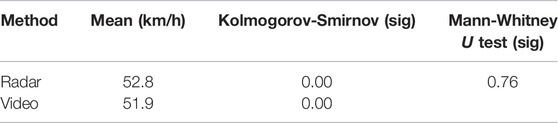
TABLE 6. Mann-Whitney U test, results for all readings.
The similarity between sample distributions is a key assumption in Mann-Whitey U tests. The radar and video measurements are shown in Figure 4. The null and alternative hypotheses for the Mann-Whitney U test are: Ho (there is no difference between the radar and the video in measuring speed), and H1 (there is a difference between the radar and the video in measuring speed).
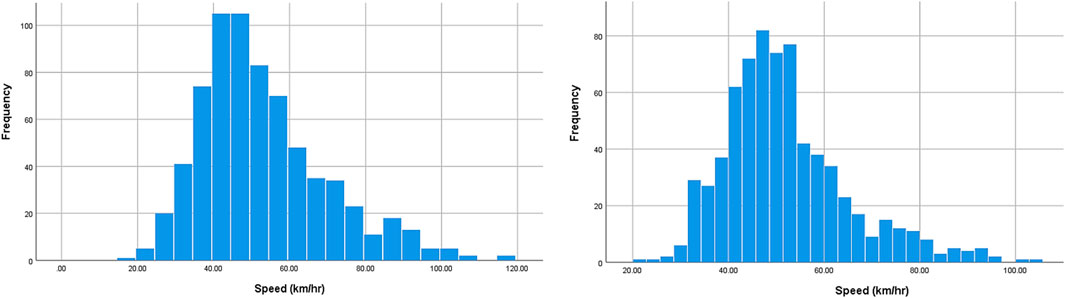
FIGURE 4. Data distribution, Radar (left), Video (right).
As seen in Table 6, the Mann-Whitney U test result (0.76) is greater than 0.05; the null hypothesis is accepted (i.e., there is no difference between the radar and the video in measuring speed). Although there were differences in performance between the two methods when the data were analyzed separately, these differences disappeared when the data were examined together. According to this, the accuracy of the two approaches is reasonably similar.
This research aimed to study speeding violations and the factors that affect them in Irbid city, Jordan using phone camera, radar, and machine learning. In addition to that, seven hot spots (streets with the most frequent traffic accidents) for speeding violations were specified to assess speed limits at these locations. A total of 17,237 records were analyzed by applying two types of decision trees: CART and J48 algorithms, using the WEKA software. Different variables related to the vehicle, driver, roadway, and environment were investigated.
The significant influencing factors were specified using CART algorithm. Speeding violations were affected by age, vehicle type, speed limit, day of the week, season, accident year, accident time, license category, and lighting conditions. Young drivers tend to underestimate speeding risks and overestimate their driving abilities. Age groups (26–35) and (36–45) were associated with speeding violations, with violators’ percentages equal to (36.3%) and (31.4%), respectively. Also, winter was associated with a high percentage of speeding violations. Slippery roads due to rain, snow, or ice at low temperatures increase braking distance, which increases speeding violations. Besides, speed limits affect speeding violations. The speed limit of 40 km/h at residential areas and near intersections was associated with speeding violations. Additionally, speeding violations experienced a rise during the morning rush hours (7:00–9:00 a.m.), where drivers hurry to avoid being late to work. Moreover, increasing the number of cars, morning rush hours during weekdays, and clear visibility during daylight increased speeding violations. Furthermore, results showed that CART and J48 algorithms predicted speeding violations efficiently. Finally, Mann-Whitney U test results did not show any significant difference between the radar and the video. These two methods almost have the same accuracy.
This research utilized CART and J48 algorithms to examine speeding violations. For future research, it is recommended to employ a variety of machine learning algorithms as well as other programs or programming languages to analyze speeding violations. Using established statistical and machine learning techniques, speed violations could also be investigated to compare how well each method predicts speeding violations. Moreover, advanced optimization algorithms can be used in various fields as solution approaches to challenging decision problems, including online learning and learning automatons (LA) based on a decomposition-based multi-objective optimization framework (Zhao and Zhang, 2020), scheduling (Abd Elaziz et al., 2021), multi-objective optimization (Dulebenets et al., 2020; Liu et al., 2020), medicine (D’Angelo et al., 2019), and transportation (Chong and Osorio, 2018). Future recommendations could be based on studies that look at how well-advanced optimization algorithms work and how well they can predict factors that lead to speeding violations.
The raw data supporting the conclusion of this article will be made available by the authors, without undue reservation.
All authors listed have made a substantial, direct, and intellectual contribution to the work and approved it for publication.
The authors declare that the research was conducted in the absence of any commercial or financial relationships that could be construed as a potential conflict of interest.
The handling editor YM declared a shared affiliation with the author RI at the time of review.
All claims expressed in this article are solely those of the authors and do not necessarily represent those of their affiliated organizations, or those of the publisher, the editors and the reviewers. Any product that may be evaluated in this article, or claim that may be made by its manufacturer, is not guaranteed or endorsed by the publisher.
Abd Elaziz, M., Abualigah, L., and Attiya, I. (2021). Advanced Optimization Technique for Scheduling IoT Tasks in Cloud-Fog Computing Environments. Future Gener. Comput. Syst. 124, 142–154. doi:10.1016/j.future.2021.05.026
Al Bodour, W., Hanandeh, S., Hajij, M., and Murad, Y. (2022). Development of Evaluation Framework for the Unconfined Compressive Strength of Soils Based on the Fundamental Soil Parameters Using Gene Expression Programming and Deep Learning Methods. J. Mater. Civ. Eng. 34 (2), 04021452. doi:10.1061/(asce)mt.1943-5533.0004087
Albayrak, M. B., Özcan, İ. Ç., Can, R., and Dobruszkes, F. (2020). The Determinants of Air Passenger Traffic at Turkish Airports. J. Air Transp. Manag. 86, 101818. doi:10.1016/j.jairtraman.2020.101818
Al-Ghamdi, A. S. (2003). Analysis of Traffic Accidents at Urban Intersections in Riyadh. Accid. Analysis Prev. 35 (5), 717–724. doi:10.1016/s0001-4575(02)00050-7
Al-Mistarehi, B. W., Alomari, A. H., Obaidat, M. T., and Al-Jammal, A. A. (2021). Driver Performance through the Yellow Phase Using Video Cameras at Urban Signalized Intersections. Transp. Probl. 16 (1), 51–64. doi:10.21307/tp-2021-005
Al-Mistarehi, B. W., Alomari, A. H., Imam, R., and Mashaqba, M. (2022). Using Machine Learning Models to Forecast Severity Level of Traffic Crashes by R Studio and ArcGIS. Front. Built Environ. 8, 860805. doi:10.3389/fbuil.2022.860805
Alomari, A. H., and Taamneh, M. M. (2020). Front-Seat Seatbelt Compliance in Jordan: An Observational Study. Adv. Transp. Stud. 2020 (52), 101–116. http://www.atsinternationaljournal.com/index.php/2020-issues/lii-november-2020/1167-front-seat-seatbelt-compliance-in-jordan-an-observational-study
Al-Omari, B., Al-Ja'afari, A., and Abu-Lebdeh, G. (2013). “Effect of Driver & Vehicle Characteristics on Speeds at a Tangent Section of a Rural Highway in Jordan,” in 2013 5th International Conference on Modeling, Simulation and Applied Optimization (ICMSAO), 1–4. doi:10.1109/ICMSAO.2013.6552655
Alomari, A., Aldalalah, M., Al-Dalaika, M. A.-D., Sawae, G., Sawae, S., and Al-Alawneh, D. (2021a). Evaluation of Urban Public Transport: A Case Study of Yarmouk University. Saudi J. Civ. Eng. 5 (1), 8–17. doi:10.36348/sjce.2021.v05i01.002
Alomari, A. H., Al-Omari, B. H., Al-Adwan, M. E., and Sandt, A. (2021b). Investigating and Modeling Speed Variability on Multilane Highways. Adv. Transp. Stud. 54, 5–16.
Alomari, A. H., Al-Omari, B. H., and Al-Adwan, M. E. (2021c). Analysis of Speed Variance on Multilane Highways in Jordan. in Proceedings of the 1st International Congress on Engineering Technologies. CRC Press, 206–216. doi:10.1201/9781003178255-27
Ambo, T. B., Ma, J., and Fu, C. (2020). Investigating Influence Factors of Traffic Violation Using Multinomial Logit Method. Int. J. Inj. Control Saf. Promot. 28 (1), 78–85. doi:10.1080/17457300.2020.1843499
Atieh, A. A., Naghawi, H., and Jadaan, K. (2020).Analysis of the Speeding Behaviour of Jordanian Drivers. Resil. Sustain. Transp. Syst. Rest. VA Am. Soc. Civ. Eng. 2020, 28–34. doi:10.1061/9780784482902.004
Atombo, C., Wu, C., Zhong, M., and Zhang, H. (2016). Investigating the Motivational Factors Influencing Drivers Intentions to Unsafe Driving Behaviours: Speeding and Overtaking Violations. Transp. Res. Part F Traffic Psychol. Behav. 43, 104–121. doi:10.1016/j.trf.2016.09.029
Balasubramanian, V., and Sivasankaran, S. K. (2021). Analysis of Factors Associated with Exceeding Lawful Speed Traffic Violations in Indian Metropolitan City. J. Transp. Saf. Secur. 13 (2), 206–222. doi:10.1080/19439962.2019.1626962
Bara’W, A. M., Alomari, A. H., and Al Zoubi, M. S. (2021). Investigation of Saturation Flow Rate Using Video Camera at Signalized Intersections in Jordan. Open Eng. 11 (1), 216–226. doi:10.1515/eng-2021-0021
Belokurov, V., Spodarev, R., and Belokurov, S. (2020). Determining Passenger Traffic as Important Factor in Urban Public Transport System. Transp. Res. Procedia 50, 52–58. doi:10.1016/j.trpro.2020.10.007
Bener, A., Jadaan, K., Crundall, D., and Calvi, A. (2019). The Effect of Aggressive Driver Behaviour, Violation and Error on Vehicle Crashes Involvement in Jordan. Int. J. Crashworthiness 25 (3), 276–283. doi:10.1080/13588265.2019.1583422
Bolsunovskaya, M., Leksashov, A., Shirokova, S., and Tsygan, V. (2021). Development of an Information System Structure for Photo-Video Recording of Traffic Violations, E3S Web Conf, 244, 07007. doi:10.1051/e3sconf/202124407007
CDC (2014). CDC Global Health – Jordan. [online] Available at: https://www.cdc.gov/globalhealth/countries/jordan/default.htm(Accessed February 15, 2022).
Cheng, Z., Lu, J., Zu, Z., and Li, Y. (2019). Speeding Violation Type Prediction Based on Decision Tree Method: A Case Study in Wujiang, China. J. Adv. Transp. 2019, 1–10. doi:10.1155/2019/8650845
Chong, L., and Osorio, C. (2018). A Simulation-Based Optimization Algorithm for Dynamic Large-Scale Urban Transportation Problems. Transp. Sci. 52 (3), 637–656. doi:10.1287/trsc.2016.0717
D’Angelo, G., Pilla, R., Tascini, C., and Rampone, S. (2019). A Proposal for Distinguishing between Bacterial and Viral Meningitis Using Genetic Programming and Decision Trees. Soft Comput. 23 (22), 11775–11791. doi:10.1007/s00500-018-03729-y
Dulebenets, M. A., Pasha, J., Kavoosi, M., Abioye, O. F., Ozguven, E. E., Moses, R., ., , Boot, W. R., and Sando, T. (2020). Multiobjective Optimization Model for Emergency Evacuation Planning in Geographical Locations with Vulnerable Population Groups. J. Manage. Eng. 36 (2), 04019043. doi:10.1061/(asce)me.1943-5479.0000730
Dulebenets, M. A. (2020). An Adaptive Island Evolutionary Algorithm for the Berth Scheduling Problem. Memetic Comp. 12 (1), 51–72. doi:10.1007/s12293-019-00292-3
Elmi, Z., Singh, P., Meriga, V. K., Goniewicz, K., Borowska-Stefańska, M., Wiśniewski, S., et al. (2022). Uncertainties in Liner Shipping and Ship Schedule Recovery: A State-Of-The-Art Review. J. Mar.Sci. Eng. 10 (5), 563. doi:10.3390/jmse10050563
Enoch, M. P., Cross, R., Potter, N., Davidson, C., Taylor, S., Brown, R., ., , Huang, H., Parsons, J., Tucker, S., Wynne, E., Grieg, D., Campbell, G., Jackson, A., and Potter, S. (2020). Future Local Passenger Transport System Scenarios and Implications for Policy and Practice. Transp. policy 90, 52–67. doi:10.1016/j.tranpol.2020.02.009
Hanandeh, S. (2022a). Introducing Mathematical Modeling to Estimate Pavement Quality Index of Flexible Pavements Based on Genetic Algorithm and Artificial Neural Networks. Case Stud. Constr. Mater. 16, e00991. doi:10.1016/j.cscm.2022.e00991
Hanandeh, S. (2022b). Evaluation Circular Failure of Soil Slopes Using Classification and Predictive GEP Schemes. Front. Built Environ. 8, 1–11. doi:10.3389/fbuil.2022.858020
Hazaymeh, K., Almagbile, A., and Alomari, A. H. (2022). Spatiotemporal Analysis of Traffic Accidents Hotspots Based on Geospatial Techniques. ISPRS Int. J. Geo-Infor. 11 (4), 260. doi:10.3390/ijgi11040260
Imam, R., Murad, Y., Asi, I., and Shatnawi, A. (2021). Predicting Pavement Condition Index from International Roughness Index Using Gene Expression Programming. Innov. Infrastruct. Solutions 6 (3), 139. doi:10.1007/s41062-021-00504-1
Inada, H., Ashraf, L., and Campbell, S. (2021). COVID-19 Lockdown and Fatal Motor Vehicle Collisions Due to Speed-Related Traffic Violations in Japan: a Time-Series Study. Inj. Prev. 27 (1), 98–100. doi:10.1136/injuryprev-2020-043947
Jadaan, K., Albeetar, N., Abuhalimeh, D., and Naji, Y. (2021). Analysis of Driver Behavior in Amman Using Manchester Driver Behavior Questionnaire. Acta Tech. Jaurinensis 14 (4), 440–454. doi:10.14513/actatechjaur.00599
Javid, M. A., and Al-Roushdi, A. F. A. (2019). Causal Factors of Driver's Speeding Behaviour, a Case Study in Oman: Role of Norms, Personality, and Exposure Aspects. Int. J. Civ. Eng. 17 (9), 1409–1419. doi:10.1007/s40999-019-00403-8
Koushki, P., Al-Saleh, O., Yaseen, S., and Ali, M. (2021). “On Fatal and Injurious Pedestrian Accidents,” in Presented at the 80th Annual Meeting of the Transportation Research Board, Washington, D.C, January. 2001.
Kuşkapan, E., Çodur, M. Y., and Atalay, A. (2021). Speed Violation Analysis of Heavy Vehicles on Highways Using Spatial Analysis and Machine Learning Algorithms. Accid. Analysis Prev. 155, 106098. doi:10.1016/j.aap.2021.106098
Li, Y., Li, M., Yuan, J., Lu, J., and Abdel-Aty, M. (2021). Analysis and Prediction of Intersection Traffic Violations Using Automated Enforcement System Data. Accid. Analysis Prev. 162, 106422. doi:10.1016/j.aap.2021.106422
Liang, Z., and Xiao, Y. (2020). Analysis of Factors Influencing Expressway Speeding Behavior in China. Plos One 15 (9), e0238359. doi:10.1371/journal.pone.0238359
Liu, Z.-Z., Wang, Y., and Huang, P.-Q. (2020). AnD: A Many-Objective Evolutionary Algorithm with Angle-Based Selection and Shift-Based Density Estimation. Inf. Sci. 509, 400–419. doi:10.1016/j.ins.2018.06.063
Mujalli, R. O. (2018). Modeling Risk of Road Crashes Using Aggregated Data. Jordan J. Civ. Eng. 12(1), 45–60. https://jjce.just.edu.jo/issues/show_paper.php?pid=4150
Murad Zuhair, Y. (2021). Predictive Model for Bidirectional Shear Strength of Reinforced Concrete Columns Subjected to Biaxial Cyclic Loading. Eng. Struct. 244, 112781. doi:10.1016/j.engstruct.2021.112781
Nathanail, E. G., Prevedouros, P. D., Mintu Miah, M., and De Melo Barros, R. (2021). Predicting the Impact of Text-Reading Using Decision Trees. In EPIA Conference on Artificial Intelligence. doi:10.1007/978-3-030-30241-2_57
Obaidat, M. T., Al-Khateeb, G., Khedaywi, T., and Bannoura, B. (2008). “Evaluation of Drivers’ Behavioral Mistakes in Jordan,” in Fifth Traffic Safety Conference in Jordan, Jorden, 22–24.
PSD, Jordanian Public Security Directorate (2019). Annual Report of Traffic Accidents for Jordan. Amman: Public Security Directorate. Available at: https://www.psd.gov.jo/images/docs/TraddicRep2019.pdf (Accessed April 30, 2021).
Rahimi, A. M., Dulebenets, M. A., and Mazaheri, A. (2021). Evaluation of Microsimulation Models for Roadway Segments with Different Functional Classifications in Northern Iran. Infrastructures 6 (3), 46. doi:10.3390/infrastructures6030046
Saravana, N., Gayathri, V., and thri, V. G. (2018). Performance and Classification Evaluation of J48 Algorithm and Kendall's Based J48 Algorithm (KNJ48). Int. J.Comput.Trends. Technol. 59 (2), 73–80. doi:10.14445/22312803/ijctt-v59p112
Shah, T. N., Khan, M. Z., Ali, M., Khan, B., and Idress, N. C. A. R. T., J-48graft, J48, ID3 (2020). Decision Stump and Random Forest: A Comparative Study. Univ. Swabi J. (USJ); Open access. 2020, 1–6. http://www.uoswabi.edu.pk/data/downloads/1125.pdf
Shawky, M., Sahnoon, I., and Al-Zaidy, A. (2017). Predicting Speed-Related Traffic Violations on Rural Highways. In Proceedings of the 2nd World Congress on Civil, Structural, and Environmental Engineering (CSEE'17), Spain. doi:10.11159/icte17.117
Sutela, M., and Aaltonen, M. (2020). Effects of Temporal Characteristics and Weather Conditions on Speeding Sanction Rates in Automatic Traffic Enforcement. Police J. 94 (4), 590–615. doi:10.1177/0032258x20977024
Tarawneh, B., and Imam, R. (2014). Regression versus Artificial Neural Networks: Predicting Pile Setup from Empirical Data. KSCE J. Civ. Eng. 18 (4), 1018–1027. doi:10.1007/s12205-014-0072-7
Tseng, C.-M. (2013). Speeding Violations Related to a Driver's Social-Economic Demographics and the Most Frequent Driving Purpose in Taiwan's Male Population. Saf. Sci. 57, 236–242. doi:10.1016/j.ssci.2013.02.005
WHO, World Health Organization (2021). Road Traffic Injuries. [online] Available at: https://www.who.int/news-room/fact-sheets/detail/road-traffic-injuries (Accessed February 15, 2022).
Witten, I. H., Frank, E., Hall, M. A., and Pal, C. J. (2016). The WEKA Workbench. Online Appendix for “Data Mining: Practical Machine Learning Tools and Techniques”. Morgan Kaufmann. doi:10.1016/C2015-0-02071-8
Wu, Y. W., and Hsu, T. P. (2019). Mining Characteristics of Speeding and Red Light Running Violations Using Association Rules. J. East. Asia Soc. Transp. Stud. 13, 2111–2125. .
Zamanov, M. S. (2012). Development of a Prediction Model for Speed Limit Violations on Tangent Road Sections. Master's Thesis. Gelderland: Delft University of Technology.
Zhang, G., Yau, K. K. W., and Gong, X. (2014). Traffic Violations in Guangdong Province of china: Speeding and Drunk Driving. Accid. Analysis Prev. 64, 30–40. doi:10.1016/j.aap.2013.11.002
Keywords: speeding violations, speed limit, radar, machine learning, classification and regression tree, traffic accidents
Citation: Al-Mistarehi BW, Alomari AH, Imam R and Alnaasan TK (2022) Investigating the Factors Affecting Speeding Violations in Jordan Using Phone Camera, Radar, and Machine Learning. Front. Built Environ. 8:917017. doi: 10.3389/fbuil.2022.917017
Received: 10 April 2022; Accepted: 25 May 2022;
Published: 15 June 2022.
Edited by:
Yasmin Murad, The University of Jordan, JordanReviewed by:
Maxim A. Dulebenets, Florida Agricultural and Mechanical University, United StatesCopyright © 2022 Al-Mistarehi, Alomari, Imam and Alnaasan. This is an open-access article distributed under the terms of the Creative Commons Attribution License (CC BY). The use, distribution or reproduction in other forums is permitted, provided the original author(s) and the copyright owner(s) are credited and that the original publication in this journal is cited, in accordance with accepted academic practice. No use, distribution or reproduction is permitted which does not comply with these terms.
*Correspondence: Bara’ W. Al-Mistarehi, YndtaXN0YXJlaGlAanVzdC5lZHUuam8=
Disclaimer: All claims expressed in this article are solely those of the authors and do not necessarily represent those of their affiliated organizations, or those of the publisher, the editors and the reviewers. Any product that may be evaluated in this article or claim that may be made by its manufacturer is not guaranteed or endorsed by the publisher.
Research integrity at Frontiers
Learn more about the work of our research integrity team to safeguard the quality of each article we publish.