 Yong Wang
 Zhenxing Chen1
 Zhaohui Huang
 Aolin Gu
 Yajun Zhang
- 1State Key Laboratory for Geomechanics and Deep Underground Engineering, China University of Mining and Technology, Xuzhou, China
- 2Department of Civil and Environmental Engineering, Brunel University London, Uxbridge, United Kingdom
- 3Sichuan Fire Research Institute of Emergency Management Department, Chengdu, China
This paper proposed one new method to determine the residual ultimate loads of the fire-damaged beam-slab specimens. Based on the conventional yield line method, the stiffness and deflection of the edge beam was considered to establish the theoretical method, and the residual ultimate loads of several beam-slab specimens in the literature were analyzed, and the predicted results were compared to the experimental results. Results show that the conventional simply-supported and fixed-end yield line method tended to underestimate or overestimate the residual ultimate loads of the specimens, and the present method can reasonably predict the ultimate loads of the beam-slab specimens.
1 Introduction
In recent years, several experimental and theoretical studies on the post-fire performance of the concrete slabs have received considerable attention (Tom et al., 2017; Hajiloo and Green, 2018; Nguyen et al., 2018; Shachar and Dancygier, 2020; Wang et al., 2020; Wang et al., 2021a; Thomas et al., 2021), including the isolated concrete two-way slabs, three-span continuous slabs, the one-way concrete slabs and GFRP (Glass-Fiber Reinforced Plastic) slabs. Results show that most of the concrete slabs did not collapse after fire, and possibly repairs and strengthening operations should be proposed. However, it is noted that most researchers focused on the residual behavior of the simply supported slabs or continuous slabs. In fact, the simply supported slabs are less common in the real buildings. In other words, the effect of the edge beams on the residual performance of the slab panels needs to be investigated based on the further experimental results and theoretical analysis. Thus, one of the authors (Chen, 2022) conducted the residual strength of the two-span fire-damaged beam-slab specimens and the reference specimens (4900 mm × 2400 mm×70 mm). The results show that compared to the reinforcement layout, the reinforcement ratio has considerable effect on the ultimate loads of the beam-slab specimens, increasing the reinforcement ratio of the panel led to its higher carrying capacity and the brittle failure easily appeared.
Apart from the simply-supported slabs and continuous slabs tests, several tensile membrane methods were developed to predict the ultimate loading capacities of two-way concrete slabs, including Bailey’s method (Bailey and Toh, 2007), Li’s method (Li et al., 2007), Dong’s method (Dong and Fang, 2010), Omer’s method (Omer et al., 2010), Burgess’s method (Burgess and Sahin, 2018), the steel strain difference method (Wang et al., 2018) and the ellipse equation method (Wang et al., 2021b). However, each method has its own advantages and shortcomings, as discussed in Ref. (Wang et al., 2021a; Wang et al., 2021b). Particularly, the common character is that these analytical approaches were based on an implicit assumption that the vertical supports along the slab panel boundaries do not deform, and they do not consider the interactions between the slab and the protected edge beams of the slab panel. However, in reality, the edge beams often deform, and thus this assumption is not always valid. Otherwise, the load-bearing capacity of the beam-slab slab system will be overestimated due to the overestimated internal force work. Recently, Nguyen and Tan (Nguyen and Tan, 2015) proposed a semi-analytical model to predict the load-bearing capacity of the composite beam-slab specimens, and the vertical deflection of the protected edge steel beams were considered. However, as discussed in Ref. (Nguyen and Tan, 2015), when calculating the lower-bound yield-line load, a potential drawback of this model is that it does not consider the interactions between the slab and the interior beams. Meanwhile, this method is suitable for the composite beam-slab specimens in fire, and may be not suitable for the conventional reinforced concrete beam-slab systems. It can be seen that the new theoretical approach should be further established to determine the ultimate loads of the reinforced concrete beam-slab panel.
In all, the objective of this paper is to propose a simple method to determine the residual ultimate load of the fire-damaged beam-slab panels reported in Ref. (Chen, 2022). For this method, the stiffness and deflection of the beam were considered based on the conventional yield-line method.
2 Post-fire Strength Tests
2.1 Test Specimens
As discussed in Ref. (Chen, 2022), five beam-slab specimens (4900 mm × 2400 mm × 70 mm) with different reinforcement ratios and layouts were tested. Three specimens (named Specimens S1 to S3) were subjected to the same ISO834 fire scenarios (3 h). For Specimens S1 to S3, each interior beam L7 was directly heated during each test, and then the burners were shut-off. The residual strength tests (named Slabs S1-PF to S3-PF) were then conducted. In addition, two unheated specimens (Specimens S4 and S5) were the reference specimens. The details of each specimen are presented in Figure 1A–D. Other details of the fire tests are available in Ref. (Chen, 2022).
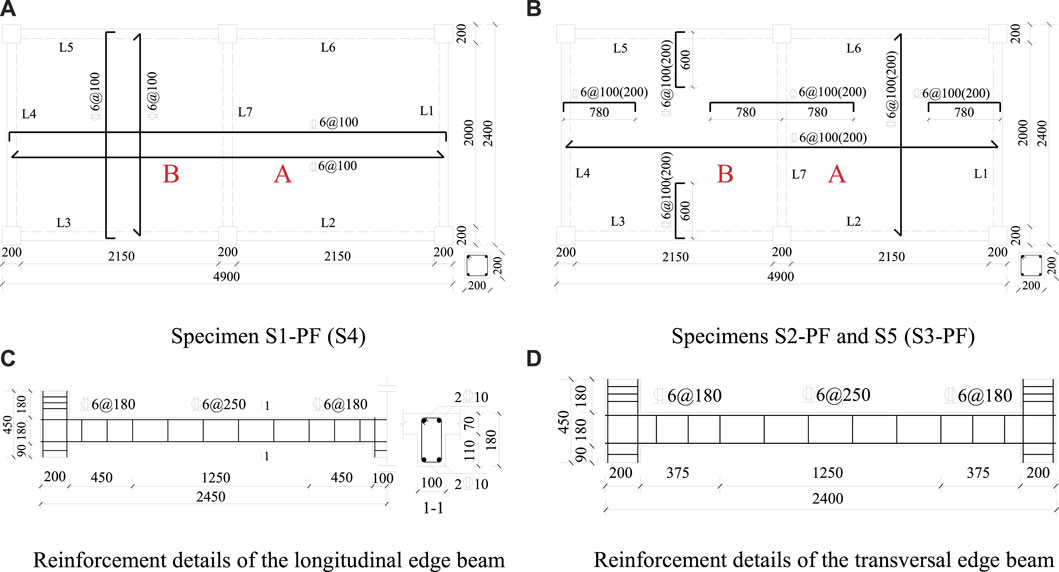
FIGURE 1. Details of steel reinforcement layouts in the five specimens (all dimensions in mm).(A) Specimen S1-PF (S4) (B) Specimens S2-PF and S5 (S3-PF) (C) Reinforcement details of the longitudinal edge beam (D) Reinforcement details of the transversal edge beam.
After the fire tests, the residual load-carrying capacities of Specimens S1-PF to S3-PF, as well as two reference Specimens S4 and S5, were investigated. The vertical mid-span deflection of each panel (Points V-A and V-B) was measured, as shown in Figure 2A,B. The material properties and the experienced maximum temperatures of the specimens, as shown in Table 1.
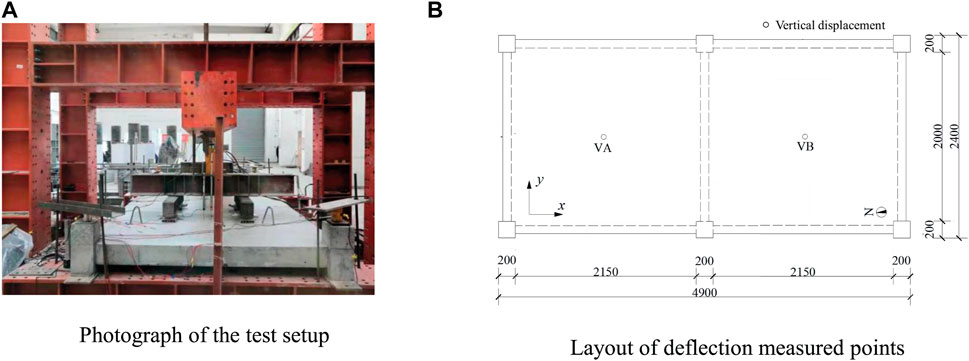
FIGURE 2. Details of the test setup and the measured points (A) Photograph of the test setup (B) Layout of deflection measured points.
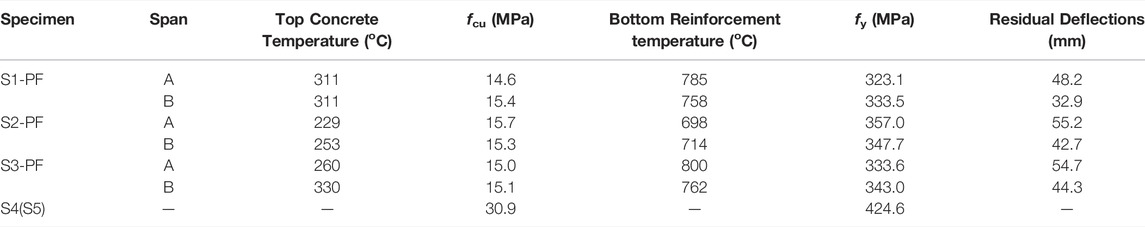
TABLE 1. Maximum experienced temperature and residual deflections of the specimens.
2.2 Residual Test Results
Figure 3A–E show the load-mid-span deflection curve of each panel in five specimens (Chen, 2022). On one hand, the limit loads of Specimens S1-PF, S2-PF, S3-PF, S4 and S5 were 130, 120, 70, 140 and 140 kN, respectively. In addition, for the fire-damaged specimens (the reference specimens), the limit deflection of these panels ranged from 70.9 mm (108.7) to 105.4 mm (160.5), with the average value of 94.3 mm (131.5). On the other hand, for the panels, the flexural failure (concrete crushing at the corners) and local punching shear failure appeared, and for the beams, the flexural-shear cracks appeared near to the connection as well as the concrete crushing at the column end. In all, for the fire-damaged specimens, they still had higher limit carrying capacities and ductility, and the specimens with higher reinforcement ratio have larger residual carrying capacities.
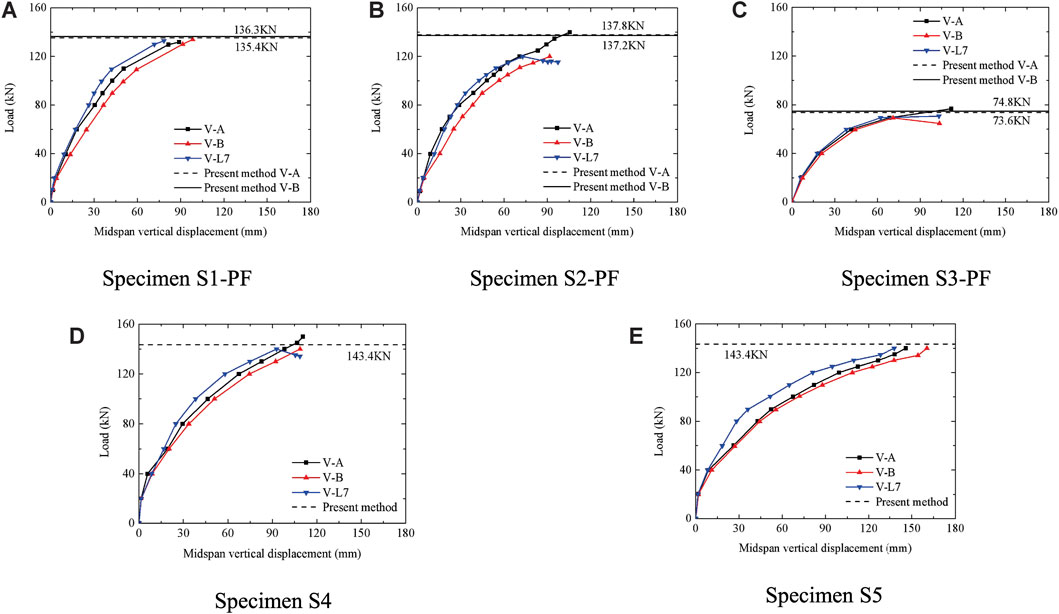
FIGURE 3. Vertical deflection-load curves of five specimens (A) Specimen S1-PF (B) Specimen S2-PF (C) Specimen S3-PF (D) Specimen S4 (E) Specimen S5.
3 Proposed Method
According to the conventional yield line theory, the stiffness and deflection of the beam was considered to establish the new theoretical method, and the residual ultimate load of the beam-slab specimens can be solved.
3.1 Basic Assumption
In this paper, the basic assumptions are as follows:
1) According to the observed cracking patterns of the test specimens (Chen, 2022), the yield line failure model was assumed (Shen et al., 1993) in this paper, as shown in Figure 4A. The position parameters ξ、ξ′ and η do not change with the vertical deformation of the specimens.
2) When the bending stiffness of the beam is large, the negative bending moment (Mu) at the slab edge and the positive bending moment in the middle span can sufficiently develop. However, when the bending stiffness of the edge beam is small, the linear interpolation method is used to determine the bending moment of each panel, and the bending moment is assumed to be (1-x)Mu, and x is the ratio between the mid-span deformation of the beam and the mid-span deformation of the slab (x1, y1, x2 and y2).
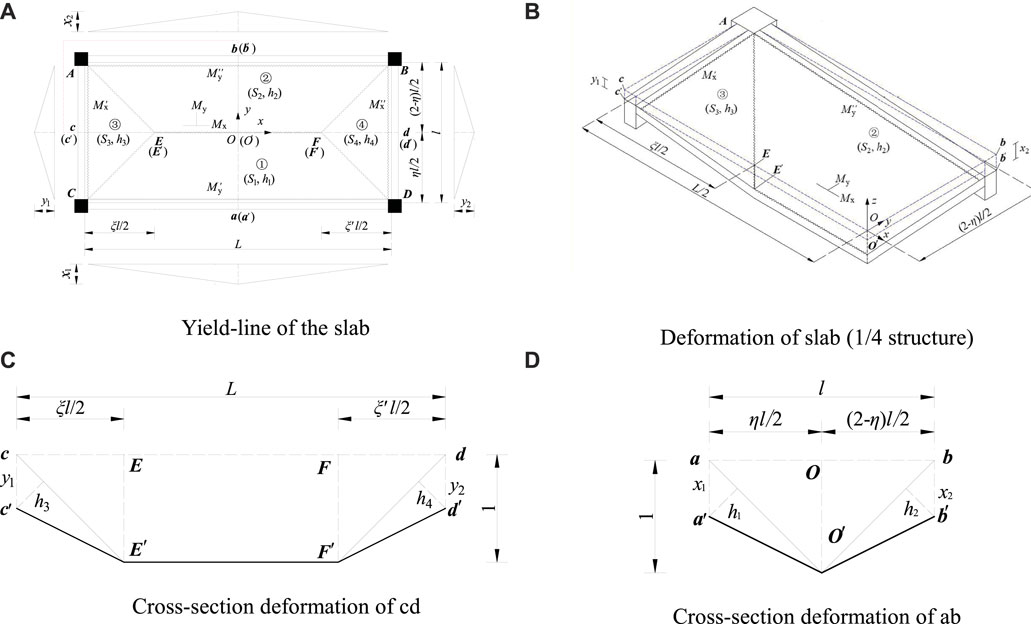
FIGURE 4. Failure modes of the specimens (A) Yield-line of the slab (B) Deformation of slab (1/4 structure) (C) Cross-section deformation of cd (D) Cross-section deformation of ab.
3.2 Key Parameters
3.2.1 Bending Moment Ratio (M1′/M1)
As shown in Figure 5A–C, the boundary of the secondary beam can be assumed as a fixed support (Figure 5B) and the spring support (Figure 5C), according to the torsion stiffness of the main beam.
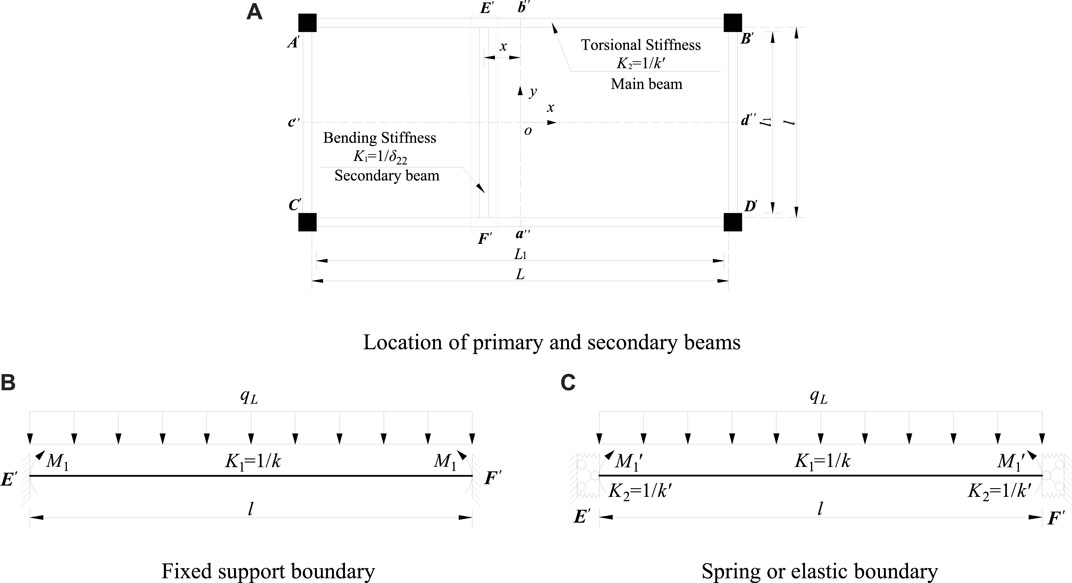
FIGURE 5. Simplified models for negative bending of slab edge under elastic condition (A) Location of primary and secondary beams (B) Fixed support boundary (C) Spring or elastic boundary.
As shown in Figure 5B, the negative bending moment (M1) at the fixed support is
As shown in Figure 5C, the negative bending moment
Where l (l1) are the width of the slab (short-span beam); L (L1) are the length of the slab (long-span beam); E is the elastic modulus; I is the inertia moment of the secondary beam; x is the distance (Figure 5A); G is shear modulus; β is the torsional coefficient of the rectangular section member (Table 2). h and b are height and width of the beam, respectively.

TABLE 2. Torsional coefficient β of rectangular section component (Liu, 1985).
According to Eqs 1, 2, the ratio (
3.2.2 Ratios αy and αx
As shown in Figure 6A, the panel is divided into a series of the strips. According to Eqs 1, 2, the negative moment of each strip under the elastic support can be calculated as well as the total negative moment (
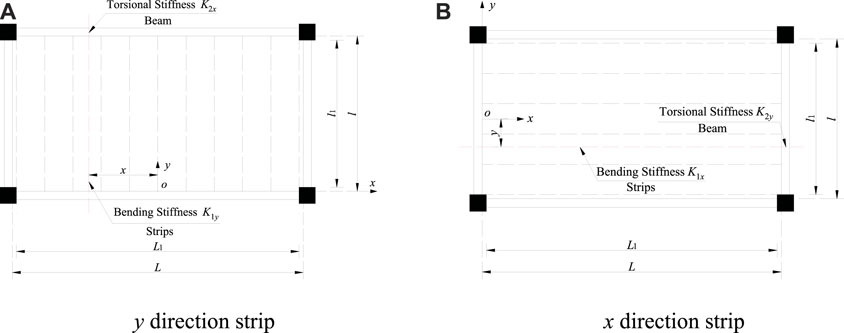
FIGURE 6. Strap division of the panel (A) y direction strip (B) x direction strip.
As shown in Figure 6A, for y direction, the negative bending moment M1y under fixed support boundary is defined as:
where D is the flexural stiffness of the slab, h´ is the thickness, μ is the Poisson’s ratio.
For y direction, the negative bending moment
where x is the distance from the center of the strip to the center of the beam O (Figure 6A).
Therefore, the moment ratio (αy) is
Similarly, for x direction, the negative bending moment under fixed support is:
For x direction, the negative bending moment under elastic support is:
where y is the distance from the center of the strip to the center of the beam O (Figure 6B).
Therefore, the moment ratio αx is
3.3 Boundary Conditions
As shown in Figure 7A–D, the boundary conditions of one beam include several cases, including two ends fixed, one end fixed and one end simply supported and two sides simply supported. In addition, the load type included two cases, including the trapezoidal load type and the triangular load type, and the details can be found in Ref. (Chen, 2022).
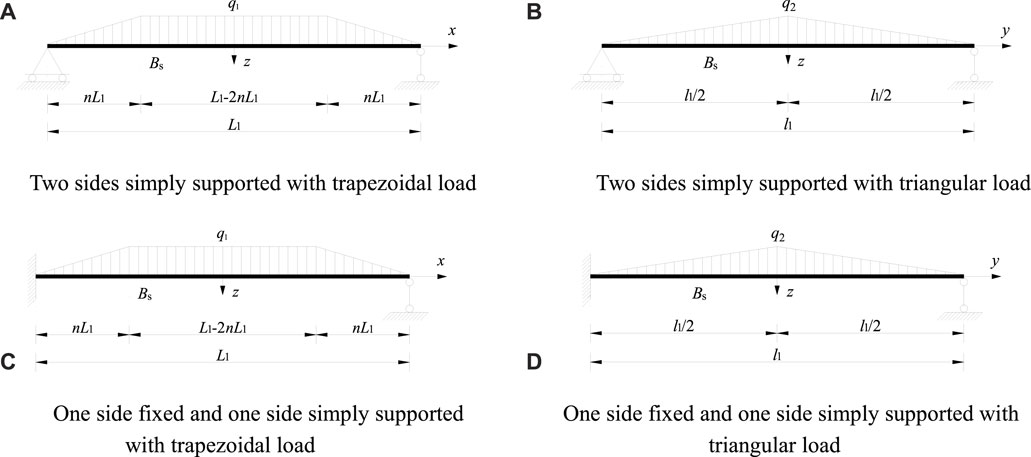
FIGURE 7. Load distribution of the beams under different constraints (A) Two sides simply supported with trapezoidal load (B) Two sides simply supported with triangular load (C) One side fixed and one side simply supported with trapezoidal load (D) One side fixed and one side simply supported with triangular load.
According to Ref. (Chinese National Standard, 2015), the short-term stiffness Bs of reinforced concrete members is
where Es is the elastic modulus of reinforcement; Ec is elastic modulus of concrete; As is the cross-section area of longitudinal reinforcement in tension zone; h0 is the effective height of the beam; ψ is the parameter. aE = Es/Ec; ρ is the reinforcement ratio; rf′ is the ratio.
The stiffness reduction coefficient of the beam is calculated as (Shen, 1993):
where Mu is the ultimate bending moment; M0 is the bending moment.
According the stiffness reduction coefficient α0, the short-term stiffness Bs´is:
For different boundary conditions, the mid-span deflection of the beam is:
(1) Two sides simply supported
As shown in Figure 7A, under the trapezoidal load, the mid-span deformation of the beam is:
where wmax(a) is the maximum displacement of the mid-span, q is the ultimate load of the slab; q1 is the load transferred from the slab to the long side of the beam (Figure 7A). n is the parameter.
As shown in Figure 7B, under the triangular load, the mid-span deformation of the beam is:
where wmax(b) is the maximum displacement of the mid-span, q is the ultimate load of the slab; q2 is the load transferred from the slab to the short side of the beam (Figure 7B).
(2) One side fixed and one side simply supported
The cross-section bending moment is defined as:
The rotation angle and the deflection of the beam can be expressed as:
The bending moment is defined as:
Similarly, the rotation angle and the deflection of the beam can be expressed as:
The bending moment is defined as:
Similarly, the rotation angle and the deflection can be expressed as:
The boundary conditions are:
According to the above boundary conditions, the mid-span deflection of the beam is defined as:
As shown in Figure 7D, under the triangular load, the mid-span deflection of the beam is:
3.4 Ultimate Loads
According to the principle of virtual work, the external work of the specimen is:
where x1、x2、y1 and y2 are the ratio between the beam’s ultimate displacement w (wmax(a)∼wmax(f)) and the slab’s ultimate displacement (l/20); η, ξ and ξ′ are the position parameters.
The internal work done by each slab yield line is defined as
If D = W, we have
3.5 Calculation Process
According to the above equations, the calculation process of the model is as follows:
(1) Firstly, it is assumed that all beams are not damaged.
The vertical deformation of the beams is not considered, i.e., x1, x2, y1 and y2 are 0. Only the torsional stiffness effect of the edge beam is considered, and the torsional stiffness effect of the interior beam is not considered.
The torsional stiffness (k’x and k’y) of the edge beam is calculated as well as the ratio (αx and αy). Then, according to Eq. 27, the ratio (β1, β′1, β2 and β′2) is calculated. The ultimate load of the slab (q) can be obtained by Eq. 28.
(2) Secondly, it is assumed that all beams are not damaged.
The vertical deformation of all beams are not 0. In other words, the ratios of the mid-span ultimate displacement of the beam (w (wmax(a)∼wmax(d))) and l/20 (x1、x2、y1、y2), and repeat Step (1), the ultimate load of the slab (q1) is calculated by Eq. 28.
(3) Thirdly, it is assumed that all beams are damaged.
The torsional stiffness of the edge beam is considered, and the parameters (k’x and k’y) are calculated as well as the bending moment ratios (αx and αy). Next, according to Eq. 27, the ratio (β1、β′1、β2、β′2) is calculated. Based on the three methods discussed in the literature (Xing, 1993; Huang et al., 2013), the minimum value of the limit load (q´) is obtained.
(4) If q1 is less than q´, the beam will not fail, only the panel fails. According to Step (2), recalculate the ultimate load (q2) of the panel. Note that, q in step 2 is replaced with q1.
(5) If q1 is larger than the q´, both the beam and slab are damaged. For the short-term stiffness (Bs), the parameter α0 is 0.4. According to step 2, q in step 2 is replaced by q1, the ultimate load of the slab is q3. In this case, if q3 is less than q´, the ultimate load is q3. If q3 is larger than q´, the ultimate load is q´.
The flow chart of the present method is shown in Figure 8.

FIGURE 8. Flow chart of the present method.
3.6 Comparable Analysis
Table 3 shows the calculated and experimental values of the ultimate load of concrete slabs calculated by the three methods, including the yield-line method (four edges with simply supported), the yield-line method (four edges with fixed-end) and the present methods. On one hand, for two yield-line methods, the ratios (Ps/Ptest and Pf/Ptest) are 0.835 and 1.629, respectively. The reason is that the effect of the boundary condition was underestimated or overestimated. On the other hand, for the present method, the ratio (Psp/Ptest) is 1.029.
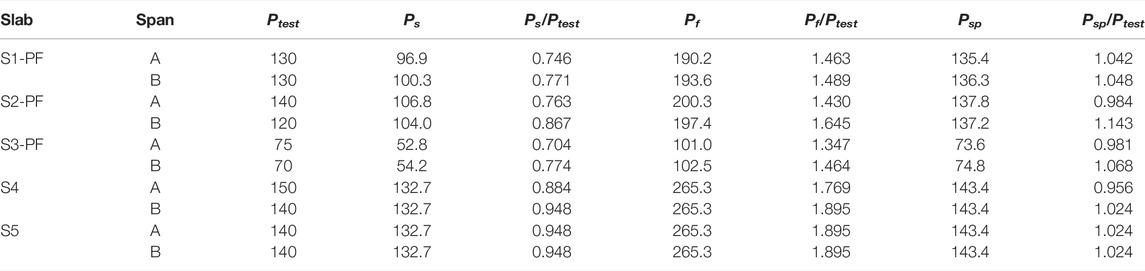
TABLE 3. Comparisons between the experimental results and predicted results of the specimens.
4 Conclusion
Based on the conventional yield line method, the influence of the edge beam’s torsional and flexural stiffness was considered to predict the residual ultimate loads of the fire-damaged beam-slab specimens, and the influence factors were proposed in this paper. Results show that the conventional simply-supported and fixed yield line method tended to underestimate or overestimate the ultimate loads of the specimens, and the reason is that the effect of the boundary restraint and deflection of the beam was not considered. In contrast, the present method can reasonably predict the ultimate loads of the beam-slab specimens, since the effect of the edge beam deflections was considered.
Data Availability Statement
The raw data supporting the conclusions of this article will be made available by the authors, without undue reservation.
Author Contributions
YW: Conceptualization, methodology, formal analysis, investigation, writing—original draft. ZC: Investigation, data curation. ZH: Supervision, methodology, writing—review and editing. AG: Investigation. GH: Formal analysis. WL: Validation. YZ: Investigation. BZ: Investigation and Editing.
Conflict of Interest
The authors declare that the research was conducted in the absence of any commercial or financial relationships that could be construed as a potential conflict of interest.
Publisher’s Note
All claims expressed in this article are solely those of the authors and do not necessarily represent those of their affiliated organizations, or those of the publisher, the editors and the reviewers. Any product that may be evaluated in this article, or claim that may be made by its manufacturer, is not guaranteed or endorsed by the publisher.
References
Bailey, C. G., and Toh, W. S. (2007). Small-Scale Concrete Slab Tests at Ambient and Elevated Temperatures. Eng. Struct. 29, 2775–2791. doi:10.1016/j.engstruct.2007.01.023
Burgess, I., and Sahin, M. (2018). Tensile Membrane Action of Lightly-Reinforced Rectangular Composite Slabs in Fire. Structures 16, 176–197. doi:10.1016/j.istruc.2018.09.011
Chen, Z. X. (2022). Studies on the Fire-Resistant Performance of the Concrete Floor Considering the Effect of the Edge Beams. Thesis. Xuzhou: China University of Mining and Technology.
Chinese National Standard (2015). Code for Design of Concrete Structures: GB50010-2010[S]. Beijing: China Architecture & Building Press. (in Chinese).
Dong, Y.-L., and Fang, Y.-Y. (2010). Determination of Tensile Membrane Effects by Segment Equilibrium. Mag. Concr. Res. 62 (1), 17–23. doi:10.1680/macr.2008.62.1.17
Hajiloo, H., and Green, M. F. (2018). Post-Fire Residual Properties of GFRP Reinforced Concrete Slabs: A Holistic Investigation. Compos. Struct. 201, 398–413. doi:10.1016/j.compstruct.2018.06.047
Huang, X., Liang, X., Liang, M., Deng, M., Zhu, A., Xu, Y., et al. (2013). Experimental and Theoretical Studies on Interaction of Beam and Slab for Cast-In-Situ Reinforced Concrete Floor Structure [J]. J. Build. Struct. 34 (5), 63–71. (in Chinese). doi:10.14006/j.jzjgxb.2013.05.007
Li, G.-Q., Guo, S.-X., and Zhou, H.-S. (2007). Modeling of Membrane Action in Floor Slabs Subjected to Fire. Eng. Struct. 29, 880–887. doi:10.1016/j.engstruct.2006.06.025
Nguyen, M.-P., Nguyen, T.-T., and Tan, K.-H. (2018). Temperature Profile and Resistance of Flat Decking Composite Slabs in- and Post-fire. Fire Saf. J. 98, 109–119. doi:10.1016/j.firesaf.2018.04.001
Nguyen, T.-T., and Tan, K.-H. (2015). Ultimate Load of Composite Floors in Fire with Flexible Supporting Edge Beams. J. Constr. Steel Res. 109, 47–60. doi:10.1016/j.jcsr.2015.03.004
Omer, E., Izzuddin, B. A., and Elghazouli, A. Y. (2010). Failure of Unrestrained Lightly Reinforced Concrete Slabs under Fire, Part I: Analytical Models. Eng. Struct. 32 (9), 2631–2646. doi:10.1016/j.engstruct.2010.04.039
Shachar, Y. M., and Dancygier, A. N. (2020). Assessment of Reinforced Concrete Slabs Post-Fire Performance. Fire Saf. J. 111, 102932. doi:10.1016/j.firesaf.2019.102932
Shen, J., Wang, C., Jiang, J., et al. (1993). Reinforced Concrete Finite Element and Limit Analysis of Slab and Shell [M]. Beijing: Journal Publishing Center of Tsinghua University Press. (in Chinese).
Thomas, T., Ruben, V. C., Robby, C., and Wouter, D. C. (2021). Burnout Resistance of Concrete Slabs: Probabilistic Assessment and Global Resistance Factor Calibration. Fire Saf. J. 119, 103242. doi:10.1016/j.firesaf.2020.103242
Tom, M., Ruben, V. C., and Thomas, G. (2017). Assessment of Damage and Residual Load Bearing Capacity of a Concrete Slab after Fire: Applied Reliability-Based Methodology. Eng. Struct. 150, 969–985. doi:10.1016/j.engstruct.2017.07.078
Wang, Y., Chen, Z., Jiang, Y., Huang, Z., Zhang, Y., Huang, Y., et al. (2020). Residual Properties of Three-Span Continuous Reinforced Concrete Slabs Subjected to Different Compartment Fires. Eng. Struct. 208, 110352. doi:10.1016/j.engstruct.2020.110352
Wang, Y., Guo, W., Huang, Z., Long, B., Yuan, G., Shi, W., et al. (2018). Analytical Model for Predicting the Load-Deflection Curve of Post-fire Reinforced-Concrete Slab. Fire Saf. J. 101, 63–83. doi:10.1016/j.firesaf.2018.09.002
Wang, Y., Wang, G., Huang, Z., Huang, Y., Jiang, Y., Zhang, Y., et al. (2021). An Analytical Method for Determining the Tensile Membrane Action of RC Slab Panels. Eng. Struct. 245, 112895. doi:10.1016/j.engstruct.2021.112895
Wang, Y., Wang, G., Huang, Z., Huang, Y., Wang, B., Gu, A., et al. (2021). Experimental Studies and Theoretical Analysis of the Residual Properties of Three-Span Small-Scale Continuous Concrete Slabs after a Fire. Fire Saf. J. 126, 103481. doi:10.1016/j.firesaf.2021.103481
Xing, H. (1993). Research on Analytical Methods for Cast-In-Situ Reinforced Concrete Floor Structure [D]. Xi'an: Xi’an University of Architecture and Technology. (in Chinese).
Notation
M1', M1, M1y', M1y, M1x', M1x bending moment
L, l length and width of the slab panel
L1, l1 long-span and short-span of the beam
Ib, Is inertia moment of beam and slab
G shear modulus
E elasticity modulus
D flexural stiffness of the slab
h, b height and width of the beam
h´ thickness of slab
K1 bending stiffness of secondary beam
K2, K2x, K2y torsional stiffness of main beam
K1x, K1y bending stiffness of strips
μ Poisson’s ratio
αx, αy moment ratio of x and y direction
Bs short-term stiffness of reinforced concrete members
α0 stiffness reduction coefficient
Bs´ short-term stiffness according the stiffness reduction coefficient
wmax(a)∼wmax(d) deflection
x1、y1、x2、y2 the ratio between the beam’s ultimate displacement w (wmax(a)∼wmax(d)) and the slab’s ultimate displacement (l/20)
η、ξ、ξ′ position parameters of yield line
q ultimate load
Mx, My ultimate bending moment of plate per unit width in x and y direction
λ aspect ratio of slab
β1、β′1、β2、β′2 ratio of bending moment
Keywords: beam-slab specimen, post fire, deflection, residual strength, failure mode
Citation: Wang Y, Chen Z, Huang Z, Gu A, Han G, Liu W, Zhang Y and Zhong B (2022) An Analytical Method for Determining the Residual Strength of Reinforced Concrete Beam-Slab Specimens. Front. Built Environ. 8:874372. doi: 10.3389/fbuil.2022.874372
Received: 12 February 2022; Accepted: 22 April 2022;
Published: 08 July 2022.
Edited by:
Zhong Tao, Western Sydney University, AustraliaReviewed by:
Shao-Bo Kang, Chongqing University, ChinaJun-Jie Zeng, Guangdong University of Technology, China
Copyright © 2022 Wang, Chen, Huang, Gu, Han, Liu, Zhang and Zhong. This is an open-access article distributed under the terms of the Creative Commons Attribution License (CC BY). The use, distribution or reproduction in other forums is permitted, provided the original author(s) and the copyright owner(s) are credited and that the original publication in this journal is cited, in accordance with accepted academic practice. No use, distribution or reproduction is permitted which does not comply with these terms.
*Correspondence: Yong Wang, eW9uZ3dhbmdAY3VtdC5lZHUuY24mI3gwMDAyNjtoYWlyc3A=