- 1Smart Building Research Group, Ryerson University, Department Architectural Science, Toronto, ON, Canada
- 2FuseForward, Vancouver, BC, Canada
- 3Engineering, Construction & Real Estate, AWS, New York, NY, United States
Cognitive Digital Twins (CDTs) are defined as capable of achieving some elements of cognition, notably memory (encoding and retrieval), perception (creating useful data representations), and reasoning (outlier and event detection). This paper presents the development of a CDT, populated by construction information, facility management data, and data streamed from the Building Automation System (BAS). Advanced machine learning was enabled by access to both real-time and historical data coupled with scalable cloud-based computational resources. Streaming data to the cloud has been implemented in existing architectures; to address security concerns from exposing building equipment to undesirable access, a secure streaming architecture from BACnet equipment to our research cloud is presented. Real-time data is uploaded to a high-performance scalable time-series database, while the ontology is stored on a relational database. Both data sources are integrated with Building Information Models (BIM) to aggregate, explore, and visualize information on demand. This paper presents a case study of a Digital Twin (DT) of an academic building where various capabilities of CDTs are demonstrated through a series of proof-of-concept examples. Drawing from our experience enhancing this implementation with elements of cognition, we present a development framework and reference architecture to guide future whole-building CDT research.
1 Introduction
The fourth industrial revolution, which has led to both Industry 4.0 (Lasi, et al., 2014) and Construction 4.0 (Klinc and Turk 2019), is that of cyber-physical systems and digital technologies (Sawhney, et al., 2020). Digital twins (DTs) are repeatedly identified as a key enabler of this transition (Al Faruque, et al., 2021). The manufacturing sector led the early development on digital twins (Fuller, et al., 2020), following the premise that machine-to-machine (M2M) communication within factories and across supply chains would drive fewer errors, less rework, and improved productivity for everyone involved. As available computing resources and connectivity between devices and systems have increased, higher data volumes can be obtained and analyzed, enabling the development of DTs. The past 5 years have seen increased interest in DTs within the construction sector (Khajavi, et al., 2019; Caramia et al., 2021), where they form the digital layer of Construction 4.0 alongside BIM and cloud-based common data environments (Sawhney, et al., 2020).
Both the definition and expectations for DT functionality have evolved significantly over the past decade (Fuller, et al., 2020). Much of what used to be considered a DT—i.e., an automatically updated digital representation of a physical object—is now considered only a ‘digital shadow’ when the DT does not influence the physical object in return (Fuller, et al., 2020; Sepasgozar 2021). The evolution of the Cognitive Digital Twin (CDT) concept, see (Abburu, et al., 2020; Fuller, et al., 2020; Al Faruque, et al., 2021), further extends this. CDTs are distinguishable by six key functionalities defined by Al Faruque et al. (2021):
1) Perception: the process of forming useful representations of data related to the physical twin and its physical environment for further processing.
2) Attention: the process of focusing selectively on a task or a goal or certain sensory information either by intent or driven by environmental signals and circumstances.
3) Memory: a single process that: holds information briefly while working with it (working memory), remembers episodes of the physical twin’s life (episodic memory), and knowledge of facts of the environment and its interaction with the physical twin (semantic memory). This remembering includes: encoding information (learning it by perceiving and relating it to past knowledge), storing and maintaining it, and retrieving it when needed.
4) Reasoning: drawing conclusions consistent with a starting point: a perception of the physical twin and its environment, a set of assertions, a memory, or some mixture thereof.
5) Problem solving: the process of finding a solution for a given problem or achieving a given objective from a starting point.
6) Learning: the process of transforming experience of the physical twin into reusable knowledge for new experiences.
Several challenges have been identified in the literature that must be overcome to fully implement CDTs. In their systematic literature review, Semeraro et al. (2021) identify the improvement of sustainability performance for each DT application context; the development of standards-based interoperability to support the interconnection of multiple DTs and systems; and the modularization of DT development to improve DT flexibility and re-usability. The questions of applicability, interoperability, and integrability were core to Yitmen et al.’s (2021) investigation to develop an adapted model of CDTs for building lifecycle management. They defined these CDTs as DTs with physics-based and analytical data-driven models endowed with cognitive abilities, expert knowledge, problem solving, and understanding, rendering it capable of responding to unpredicted and unknown situations. This definition echoes that of Eirinakis, et al. (2020) who summarized CDTs as an expansion of DTs that are able to detect anomalies, learn behaviour, and identify physical (system) changes to improve asset performance. Drawing from both the academic literature and a series of expert interviews, Yitmen et al. (2021) proposed a CDT architecture consisting of four layers: 1) the Model Management layer combining physics-based, analytical, and information-driven models; 2) the Service Management layer combining the available data and machine learning services to support the CDT; 3) the User Interaction layer to permit human navigation of the CDT; and 4) the Cognitive Twin management layer to model the physical system’s behaviour, identify opportunities for improvement, and modify the CDT to better reflect the current reality. This paper complements and extends this body of research, presenting the development of a full-building CDT through a case study along with a reference architecture and development framework to guide future research.
This paper is structured as-follows. Section 2 presents a review of the literature, highlighting the state of the art in CDTs and Industry 4.0, summarizing the key challenges in the development of CGTs specific to the Buildings domain, and identifying enabling research to help overcome them. Section 3 presents the overall research methodology used to develop the CDT and situates the current research in a longer-term project. Section 4 presents the case study: the implementation approach and the results obtained. Section 5 summarizes the lessons learned from this effort into a framework for CDT for Building Operations, discussing best practices identified for each element. Finally, Section 6 concludes this study, identifying the key findings, current study limitations, and recommendations for future research. Through this study, this paper provides the scaffolding to support CDT development at scale.
2 Background
2.1 Cognitive Digital Twins and Construction 4.0
The manufacturing sector has led the development of CDTs with significant research arising in this domain over the past 3 years (Zheng et al., 2021). Several literature reviews have highlighted the development of CDTs and the areas for further research e.g. (Abburu, et al., 2020; Semeraro et al., 2021).
Two concepts are valuable in supporting the development of CDTs: Digital Thread and Autonomous systems. The Digital Thread is a framework that allows an integrated view of a physical entity’s definition throughout its lifecycle across traditionally siloed functions. The Digital Thread can be considered the IT infrastructure backbone by which the information is collected, stored, and disseminated across different functions. Within this context, Digital Twins are users of the information in the Digital Thread and are also themselves stored as models within the Digital Thread for re-use by other functions (Singh and Willcox 2018).
The combination of Digital Thread and the notion of promise of connectivity across the manufacturing supply chain has spurred research on autonomous operations or autonomous systems. An Autonomous System is self-governing, self-sufficient, and independent in achieving its targeted outcome. Such outcomes can include mobility (autonomous vehicles, aerial taxis), smart electricity grids (demand response), robotics (situational awareness, computer vision), supply chain (intelligent inventory management), Industrial Internet (digital twins of industrial equipment; see (Li, et al., 2017)), healthcare (diagnostic imaging, precision medicine, drug discovery), and software and internet services (NLP, recommendation engines, sentiment analysis, chat bots). In the context of physical-digital systems, the autonomous system must gather information, create a solution based on this information, and execute a task to achieve an objective with a feedback loop to self-correct. The autonomous system is designed to make independent decisions in an ever-evolving, non-deterministic environment. Typically, it will use probabilistic modeling and learning. For example, multiple decades of effort have been devoted to the goal of reducing the number of people required to run complex safety-critical facilities such as oil platforms and power plants. Digital Twins that accurately reflect a facility’s behavior would be able to perform probabilistic estimations (Agrell et al., 2021) with different scenarios and are considered key technology in developing fully autonomous systems considered Cognitive Digital Twins (CDT).
2.2 Key Challenges and Potential Solutions in the Development of Cognitive Digital Twins
Significant challenges are associated with the development of CDTs. These are described for key functionalities (Al Faruque, et al., 2021) in the following sections.
2.2.1 Perception
The CDT must perceive the various events occurring in the physical building. To achieve this, the physical building is equipped with sensor networks that periodically report all variables of interest (sensor measurements, meter readings and command points from the BAS; facility management records, etc.) required to digitally replicate the building state. To acquire data from these heterogeneous sources and standardize its format, three technical elements are required: 1) a coherent and interoperable data model, 2) the ability to acquire stream data from the various IoT devices and sensor networks into this model, and 3) data security.
Building data is challenging to structure due to its diversity (multiple sources, formats, and vendors) and complexity (interconnectedness of systems and elements). Two approaches are used to structure building data from sensor networks: linked data and ontologies. Linked data stores the data from individual points separately, relying on an external software such as BIM to integrate this data into a common environment; see Tang et al. (2019), and Lu et al. (2019) for summaries of how BIM can enable the integration of IoT data into a DT. Ontologies provide robust data structures, and several broad ontologies have been developed to integrate Building Automation System (BAS) and Internet of Things (IoT) data (Bhattacharya et al., 2015).
Several ontology comparisons have been undertaken to evaluate their potential for digital twins of buildings, notably within a Smart and Ongoing Commissioning (SOCx) context. Quinn and McArthur (2021) conducted a detailed analysis of two industry-led ontologies, Brick and Haystack, with IFC and the W3C ontology ecosystem (BOT, SAREF, etc.) to compare their relative completeness (ability to describe each building element), expressiveness (ability to describe relationships between elements), interoperability, and usability (practical impacts), recommending Brick for Smart Building applications. In a systematic review of SOCx-applicable ontologies, Gilani et al. (2020) noted that the majority of existing ontologies were built using the W3C ecosystem ontologies and most often used SPARQL Protocol and RDF (Resource Description Framework) Query Language (SPARQL) for queries. Several ontologies incorporating cognitive functions were further identified, notably the context-aware architectures proposed by Uribe et al. (2015) and Han et al. (2015), Hu et al.’s (2018) ontology to support automated time-series analysis for evaluating building performance, and Li et al.’s (2019) KPI ontology permitting multi-scale observation and performance analysis. Gilani et al. (2020) identified six key requirements for future SOCx ontologies that are also highly relevant to CDTs: 1) Inclusion of both static and dynamic data types to support context-aware decision making and real-time data analytics; 2) full description of available data and their relationships; 3) a modular approach ensuring compatibility with existing ontologies and re-use wherever possible; 4) adoption of a linked-data approach; 5) case study implementation; and 6) full documentation to permit its extension and maintenance.
Static data may be obtained from BIM and other building sources, but time-series data must be acquired in real-time. Data streaming requires a unique approach because of both the heterogeneity of data as noted above and the siloing of data in different, proprietary, and closed systems (Misic et al., 2021). The BAS provides a wealth of building performance data, integrating both the controllers and sensors for all HVAC equipment in the building using the BACNet protocol (ASHRAE 1995), connected through field controllers, which in turn connect to network devices. Historical (trended) data is often limited due to computational cost but is extremely valuable to support reasoning and learning. It is often richer than streamed data because most BAS servers use higher storage granularity (e.g., 5 min instead of 10 min) and this is readily achievable as those servers are hosted in the same subnet as the HVAC controllers. The same granularity is often not achievable in streaming as only limited bandwidth is available. This said, retrieving trended data depends on the availability of export tools. Often vendors’ BAS servers use proprietary databases (e.g., MS SQL Server) requiring credentials. To limit computational cost, time limits must also be placed on trended data.
Maintaining network security, particularly when connecting third-party IoT devices, is another core requirement for resilient CDTs (Farahat, et al., 2019). Typically, HVAC controllers are hosted on a private subnet but streaming may open a breach for undesirable external access. An appropriate firewall is necessary to prevent cyberattacks (e.g., DDOS) that may reduce the efficiency of the network. IoT sensors beyond the HVAC subnet also pose real security issues as they are often connected to the building WiFi network, equipped with open source kernels (e.g., Raspberry Pi) and disseminated in various locations in the buildings. Their network should thus be physically isolated from the central IT system.
As most IoT devices are resource constrained, Yaqoob, et al. (2017) recommend lightweight security mechanisms with minimal intelligence to recognize and counteract potential threats. They also suggest that IoT systems must follow a secure booting process, access control rules, device authentication procedures, and firewalling, and must be able to accept updates and patches of security software in a non-disruptive way. (Li et al., 2016). classify security issues in IoT environments into three categories: data confidentiality, privacy and trust.
2.2.2 Attention
Once the CDT has perceived the network, it must determine which data warrants its attention. Implementing this functionality requires determining how to filter out irrelevant data and format relevant data. Handling various types of data, assessing the data volume, and encoding data for streaming (Misic et al., 2021) has been investigated. Previous research has indicated the value of Kafka for edge computing during data streaming (Ramprasad, et al., 2018). Buffers should be implemented in the edge machine (EM) as well as the cloud to handle intermittent connections, connection issues, and error detection. Outlier detection algorithms using machine learning (Basu and Meckesheimer 2007; Li, et al., 2009) have proved valuable for stripping out erroneous data prior to ingestion by DTs (Miller et al., 2015).
Recorded observations are often aggregated as statistics (e.g., median, percentiles, standard deviation) and processed by ML models defined in the supervised learning framework if data is previously labelled by experts (e.g., deep models, regression, classifiers), or in the unsupervised learning framework when no or few labeled data points are available.
2.2.3 Memory
As the store of past and present states of the building, memory is a crucial CDT component. It is materialized in sensor values, actuators states, parameters, and settings, all associated with timestamps. Memory is the main reservoir of data that serves for visualization, learning and reasoning. Ingestion services support the memory function by processing the receiving buffer and uploading records to the time series database. A time series database refers to any database able to store a high volume of timestamped data in real time. NoSQL databases are good choices as they have flexible schemas and can be scaled horizontally (Oti et al., 2018), however, for increased performance, databases that can natively handle queries on timestamps are usually preferred. The use of distributed cloud resources considerably helps in storing time series data, in its simplest implementation, a table or index can be associated with data streamed from one building (Kang, et al., 2016). The time series database has to reply in a reasonable time to queries from the digital twin users (Kang, et al., 2016; Lv, et al., 2019), and at the same time keep data integrity by detecting duplicate records and checking identifiers against the ontology model.
The full exploitation of data requires metadata that can be stored in a traditional relational database that reflects the ontology model of the building or campus (Quinn and McArthur, 2021). Querying any resource starts by sending appropriate requests to the ontology database to retrieve the list of points associated with the query, a second query is then sent to the time series database to retrieve the temporal data.
Memory and its supporting services reside in a data lake (Miloslavskaya and Alexander, 2016). A cloud-hosted data lake provides quasi-infinite resources for computing and storage and allows to balance loads and allocate new resources to the memory cluster in a transparent and efficient way. Depending on the type of computation performed on the data, cloud providers offer object, file, or block storage for both throughput and transaction-intensive workloads. Memory has several levels ranging from the raw data received from streaming to the episodic memory that handles aggregated sensor data for defined episodes or periods, e.g., week, season (Al Faruque, et al., 2021). Visualizations are necessary to fully benefit from a CDT’s memory as they constitute a way to interactively display the content of all memories, for example with a 3D model viewer coupled with data extracted from the ontology and the time series databases.
Many challenges are related to memory, such as: the heterogeneity of data originating from various sources, the need to ensure a secure and reliable data transmission, and the need to feed a queue that efficiently ingests data from all sources. For CDT success, low latency in processing queries from data consumers, analytic dashboards and machine learning models is critical.
2.2.4 Reasoning and Problem Solving
Reasoning and problem solving is a key difference between traditional DTs and CDTs. This capability allows a CDT to apply reasoning by taking a set of recent observations from thousands of points, transform them into relevant indicators and compare them with existing KPIs to make decisions. Reasoning can be based on induction or deduction, and can use probabilistic frameworks such as Bayesian networks for conditional relationships (Al Faruque, et al., 2021). Reasoning often relies on existing data from episodic or semantic memory; it uses simple or complex rules or machine learning algorithms to provide insights on the problem in hand. For cost effectiveness, cloud resources are periodically invoked to run models then revoked after data processing. Such flexibility is only achievable on cloud structures that can scale resources in and out in a very short time.
Recent CDT frameworks have recommended graph learning to support this function (Mortlock, et al., 2021; Zheng et al., 2021). Predictive algorithms with demonstrated value for reasoning and problem solving in the building domain include random forest (Smarra, et al., 2018; Shohet, et al., 2020) convolutional neural networks (El Mokhtari and McArthur 2021), deep reinforcement learning (Mocanu, et al., 2018; Liu, et al., 2020), particle swarm (Delgarm, et al., 2016) and LSTM (El Mokhtari and McArthur 2021). Several optimization approaches have been compared for their applicability for buildings (Waibel, et al., 2019; Si, et al., 2019; Magnier and Haghihat, 2020) with a high frequency of researchers adopting Bayesian optimization (Khosravi, et al., 2019; Lu et al., 2021; Stock et al., 2021).
2.2.5 Learning
The last concept of CDT is learning, defined by (Al Faruque, et al., 2021) as transforming the experience of the physical twin into reusable knowledge for a new experience. While reasoning is based on previous knowledge, its outcomes are recorded as new learned experiences. The main focus of learning is summarizing reasoning and problem-solving results and providing the best ways to save them for further exploitation in subsequent episodes in the building lifetime. Learning is also interrelated with memory as new experiences are stored in the episodic or semantic memories, while resulting knowledge is stored in other memories called knowledge memory. Knowledge can be stored as a set of rules, full models, sets of parameters or statistics.
Knowledge can also be modeled as a network, for example, the Bayesian network created from the fault detection study noted previously. Knowledge is not immutable; the content of this memory must be updated from new learning experiences. A weighted combination of old and recent data - with more weight given to recent experiences - can be used to update the knowledge memory and reflect new behaviors that may have never been observed. The learning may require human feedback in case brand new behaviors are observed, indeed, models may not be able to distinguish between new experiences and faulty ones, in this case human expertise can solve the issue by manually labeling faulty behaviors.
Lee et al. (2020) proposed an architecture relying on learning agents monitoring the performance of actual and digital models and using transfer learning to enhance model building and increase efficiency by retrieving knowledge/data from a base model. From another perspective, knowledge graphs (Nguyen et al., 2020) were employed to enable formal, semantic, and structured representation of knowledge. In some cases, knowledge graphs are associated with ontologies to create a knowledge base or a knowledge management system where a reasoner is executed to derive new knowledge (Ehrlinger and Wöß., 2016). Abburu et al. (2020) described the task of creating a functional and comprehensive knowledge base as the most challenging task for CDTs to realize the cognitive capability and summarized the associated challenges as: 1) knowledge representation, 2) knowledge acquisition and 3) knowledge update. The last is the most complex, consisting of knowledge extension, forgetting, evolution, and discovery of the right time to apply the needed changes. For this, two strategies are recommended: usage-driven based on experts’ feedback and structure-driven and based on detecting conflicting rules by ontology reasoners (Abburu, et al., 2020).
3 Research Methodology
This research was conducted through a series of proof of concepts (POCs) applied to a full-scale case study of a mixed-use academic building. A multi-disciplinary Smart Campus Digital Twin (SCDT) for the Ryerson University campus has been developed, integrating 66 campus buildings with various degrees of data, as summarized in Table 1.
Within the SCDT, the Daphne Cockwell Complex (DCC; Figure 1) is the most developed and was used to create the initial CDT. Built from the as-built BIM model, it was enhanced with the addition of semantic data from the space management database (new parameters mapped to rooms) and BAS points (new parameters mapped to rooms, systems and equipment as appropriate). To facilitate the latter while minimizing computational cost of the CDT, new equipment families were created with simplified geometry and assigned unique equipment identifiers, rather than the ‘type’ tagging in the initial BIM. Additional equipment parameters provided additional information such as make and model descriptions provide full equipment geometric information and system associations. Together, this semantic, geometric, and topological information necessary to support a comprehensive quasi real-time context-aware decision platform for campus management that provides a virtual simulation environment for physical buildings.

FIGURE 1. DCC at ryerson university Ryerson, 2019; (c) Perkins + Will.
DCC consists of a 16,300 m2 (175,000sf) academic podium with lab space, classrooms, offices, and a 19-storey residential tower housing 332 student rooms in 2- and 4-bedroom apartments. Developed by the university to be a ‘living lab’, the building incorporates “a comprehensive sub-metering system that collects real-time data about energy consumption and climate control (that) can be used to identify opportunities to improve sustainability and inform decisions for future buildings” (Ryerson University, 2019), integrated into the BAS (Johnson Controls ‘Metasys’ system). Because of this extensive additional metering and monitoring, a wealth of data is available to support the development of a broad array of CDT use cases, despite the DCC having not being designed as a fully-integrated Smart Building. The DCC CDT is supported by a global DT platform enabled with IoT devices and sensor networks permitting complex analysis of system performance, operational awareness, and energy optimization. This is achieved through online diagnostics and complex event processing and prediction of future behaviour with machine learning algorithms. This CDT is a proof of concept for any campus context related to assets such as university campuses, hospitals, and industrial plants, and can be further extended to smart neighbourhoods and smart cities.
The CDT implementation methodology relies on the five components discussed above: perception, attention, memory, reasoning & problem solving, and learning. These components are distributed over two segments securely linked over the internet. The first is the physical building equipped with the HVAC installation and edge hardware to collect and processes sensory data, while the data lake is the second segment where building structured and unstructured data is stored. The data lake is part of a Virtual Private Network (VPC) in Amazon Web Services (AWS) cloud and allocates extensible resources to process, store and visualize data. It also provides endpoints for a variety of end user applications, two of them are described in the case study. Throughout the next section, we present the detailed development of the CDT, the key decisions made and rationale for each.
4 Case Study
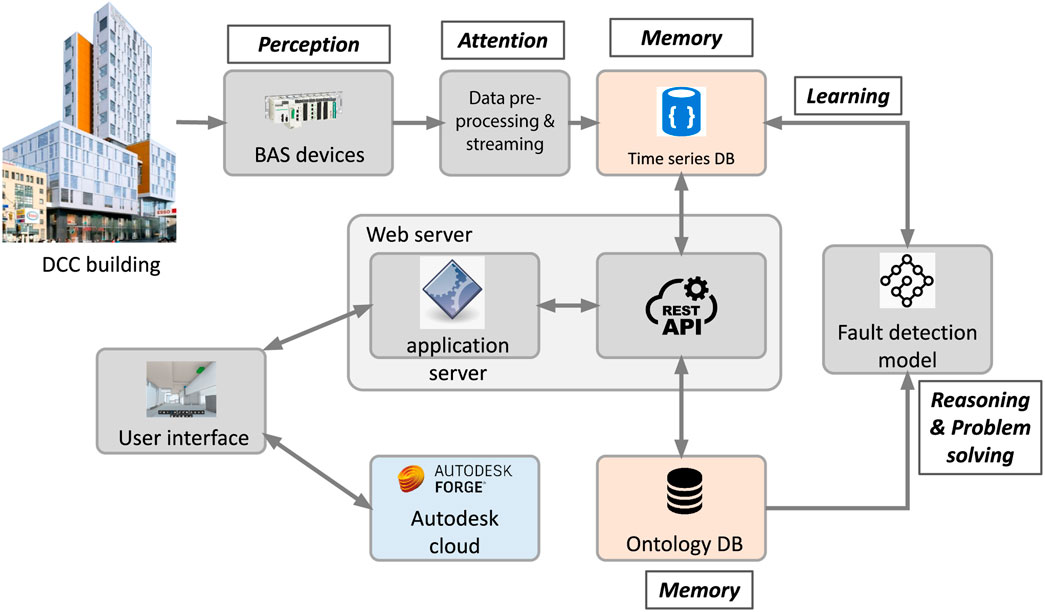
This section provides insight on the issues addressed in the CDT development, summarized in Figure 2, and details the technical solutions implemented for each within the case study building (DCC).
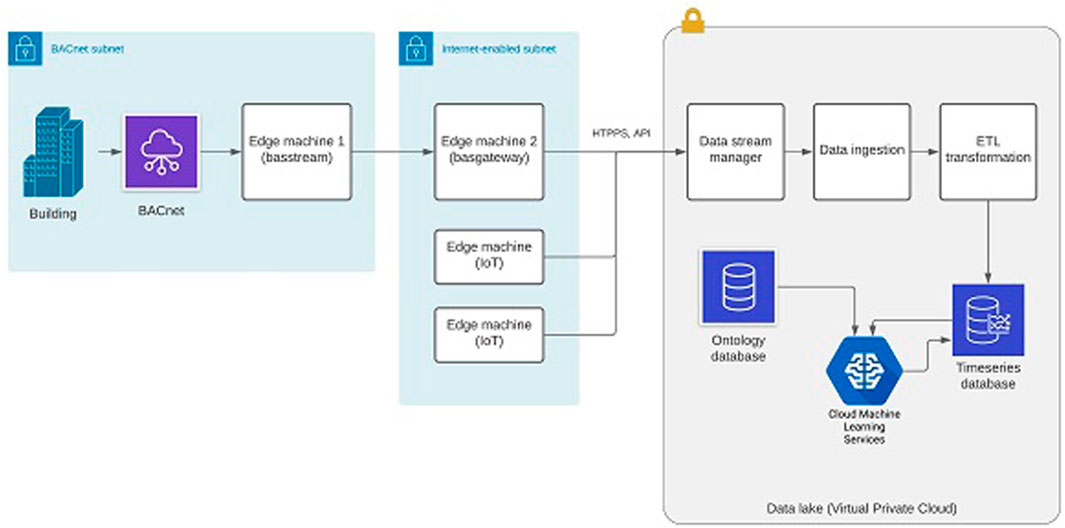
To help contextualize the relationships between the various elements, the data streaming approach and a sample KPI visualization are shown in Figures 3, 4, below.
4.1 Perception
To implement the perception functionality, the SCDT needed to perceive the various events occurring in the physical building. To determine the types of data to consider, KPIs were developed with the FM team to define DT goals for simulation, event detection, and learning. These informed the data model development, which had to include three basic types of data: static data such as space utilization reports, historical (trended) data, and dynamic data. Static data sources relevant to each KPI was identified and mapped directly into the SCDT BIMs using the Lean-Agile process (McArthur and Bortoluzzi 2018). Historical data was obtained from the BAS, using the “Export utility” tool to parse the HVAC equipment hierarchy and selectively export subsets of data; this batch processing was required because it became evident that large data exports (over 500 MB) can critically impact on the BAS server. Dynamic data was either batch exported (e.g. from the work order system) or streamed as discussed below.
The implementation of the data model and secure streaming are summarized in the following sections.
4.1.1 Ontology/Data Model
To create a comprehensive, coherent, and interoperable data model, a W3C-compatible approach was used, drawing from the simplicity of the BOT ontology and integrating Brick semantic relationships as the core of the data model. By simplifying the asset class hierarchy, this approach allowed the same SQL tables {asset, asset type, relationship, relationship type, location, location type, measurement, measurement type, etc.} to be used across domains. Here, ‘asset’ is used for all physical components, for example it can designate either a piece of equipment or its subcomponent (e.g., the return fan in an air-handling unit). The ontology includes an assets hierarchy that specifies how assets relate to each other (e.g., is part of, contains), the relationships between assets and locations (e.g., serves, is located in), and point relationships (e.g., measures, is controlled by). This ontology model was physicalized in a relational database (mySQL) to support different kinds of queries involving locations, asset hierarchy, and end points.
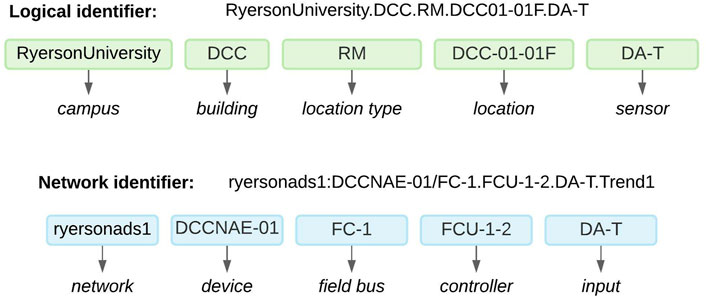
Figure 5 illustrates an example of a logical identifier where one can easily identify the campus name (RyersonUniversity), the building name (DCC), the location type (RM: Room), the location reference (DCC01-01F), and the sensor type (DA-T: Discharge air temperature). These differ from the points’ network address as-obtained from the data streaming protocol.
4.1.2 Data Streaming
Streamed data was defined using a unique identifier (the pointID that includes both source and point identifier) and a querying type (polling or change of value (COV)). The BACnet service on the EM collects data from these COV notifications or periodical polls, which is read by EMs in near-real time. These EMs support the handling of different protocols, securely send data to the cloud, and manage buffering and streaming to a time-series database. One of the most important challenges found in our implementation was to support different protocols (BACnet, TCP, HTTPS, MQTT) to collect and stream data, defining appropriate polling periods and handling COV appropriately. Data is collected and processed by EMs on site before streaming. Data collection strategy and protocols are implemented in the EM as well. While a single EM was required here, multiple parallel EMs may be necessary to manage siloed data sources; all need to communicate with the cloud queue to publish data that often needs to be normalized from all sources and respect predefined schemas.
The first EM (basstream) is on the same private network as the BAS and supports the BACnet protocol (see Figure 6). When first added to the subnet, basstream was configured by: 1) discovering all devices in the network, 2) retrieving all controllers’ points, 3) determining points that support the Change Of Value (COV) protocol, and 4) saving all discovered devices and points in a local database. Once configured, the Amazon Kinesis family of services was used for data streaming.
Because the BAS was located on the critical systems network for the campus, the security of data streaming was critical. The solution depicted in Figure 6 ensures a reliable and secured tunnel for streaming data over the internet with one or more EMs in the building and a managed service for streaming on the cloud side. Basstream stores data in a local buffer and has a unidirectional tunnel of communication with the second machine basgateway placed on an internet-enabled segment. This machine manages a second buffer, formats data, then sends it through a secured connection to the cloud. Standalone IoT devices in Figure 6 provide a solution to stream data from sensors not supporting the BACnet protocol.
The various buffers (the two EMs and the cloud) ingest data asynchronously providing resilience against temporary node failure. The implemented notification system alerts system administrators of any streaming exceptions or decrease in ingestion volume or speed. Securing data is another important aspect, the current implementation uses HTTPS API calls to managed cloud services which proved to be more efficient than a previous VPN-based solution. Because basstream is located on a private wired network, it is protected from external attacks such as DDoS (Distributed Denial of Service), sniffing, fake network message or replay attack (Li et al., 2016). Basgateway and other IoT devices do not use wireless communication and are behind the corporate router. All communication with the data lake (AWS cloud) is encrypted with the TLS (Transport Layer Security) protocol version 1.2 and leverages the AWS Identity and Access Management (IAM) for device authentication. AWS IAM assigns unique credentials, controls permissions for devices or groups of devices streaming data to the cloud (Varia and Mathew, 2014).
4.2 Attention
To determine which data is most critical, the attention function filters is the total sum of all operations applied to data from perception to memory and was implemented using EMs in the case study.
4.2.1 Data Filtering and Transformation
Because EMs have the advantage of being close to the data source (HVAC equipment), they can query points for their current values, retry querying the same point multiple times if readings are erroneous, periodically check if all points and devices in the network are alive (pinging IP addresses, querying last values), and apply prior transformations to data (e.g., rounding float values, converting categorical into ordinal values). Unresponsive points are communicated and stored. EMs also apply proper formatting to records to make them compatible with the streaming manager requirements (e.g., adding time zone, adding BACnet controller ID).
4.2.2 Aggregation
Because most building analytics involve comparing the building performance at different time scales, jobs are programmed to run periodically to aggregate data. Calculated max/min, mean, percentiles, standard deviation, counts, etc., are stored for each subset (sensors, controllers commands, rooms, floors) in the episodic memory in the time series database to enable analytics to be run on aggregated data.
4.3 Memory
Multiple levels of memory were defined as-follows to support the full range of required CDT functionality:
1) Transient memory: contains data that is still processed from the perception stage into the EM buffers, streaming pipeline and cloud queue
2) Working memory: contains data after ingestion and storage in the cloud, this memory exists in the form of time stamped events
3) Episodic memory: generated from data ingested from the working memory at the end of each predefined episode
4) Semantic memory: where rich experiences from interrelated assets and points are recorded and serve to characterize known events and their impact at a large scale (e.g. student entering or leaving the building, break time, lunch time, working days, weekends). Semantic memory is fed by learning models that ingest working and episodic data to retrieve summarized knowledge, which can be used in building KPIs, event or fault detection, etc.
The streaming manager is based on Amazon Kinesis and represents the transient memory. It directs the data flow to an Amazon S3 bucket (or any equivalent cloud block storage). In parallel, appropriate cloud services ingest records, apply ETL (Extract, Transform, Load) transformations before uploading the data sequentially to the time series database - Elasticsearch in our implementation. Elasticsearch encompasses the working, episodic and semantic memories. It is a distributed, scalable, free, and open search and analytics engine for structured and unstructured data handling queries over time intervals. Queries are based on REST APIs that can be sent over the HTTPS protocol. SDKs are available for most of the programming languages.
4.3.1 Data Lake Structure
. In the architecture depicted in Figure 6, the ontology model is a relational database that processes queries in SQL. The second database is the so-called time series database that falls into the category of NoSQL databases. Data in Elasticsearch is organized into indices (the equivalent of databases in the relational model) that allow to partition data according to their intended use. Different indices can be associated with each type of memory in a CDT: working, episodic, and semantic. Additional indices may include other unstructured data such as technical data, documents, initial parameters, etc. Latency was reduced by allocating sufficient hardware resources and cache size, optimizing queries and avoiding complex aggregations.
4.3.2 Visualizations
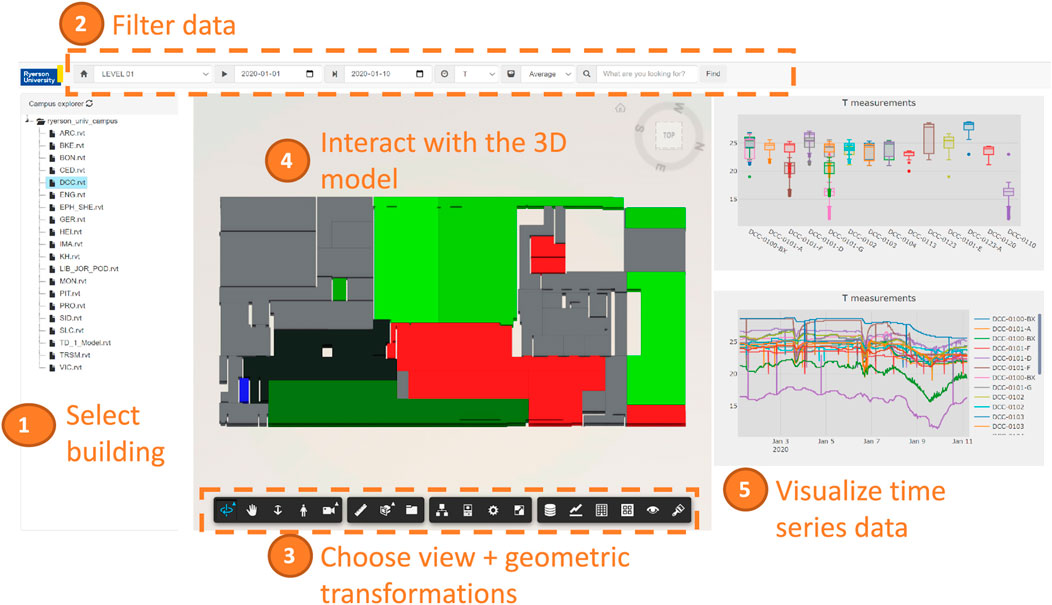
Dashboards are delivered by a web server hosted in the cloud that extracts data from the data lake, and loads the 3D model securely from another cloud (Autodesk Forge). Users can select a building from the campus, select the building floor, the date interval and other filters such as the desired variables and the aggregation type. A 3D view enables geometric transformations as well as a set of tools to show and filter static data stored in the BIM (e.g., Revit model). Alternately, the room view of this dashboard (Figure 7) updates the rooms color in the model to reflect their average temperature and highlights rooms in red if their average temperature was above the accepted level, in blue if it was below the normal range, or in shades of green (brighter means higher temperatures) if it was in the normal range. The charts show the variation of the temperature as a function of time or in box plots for easy comparison between rooms.
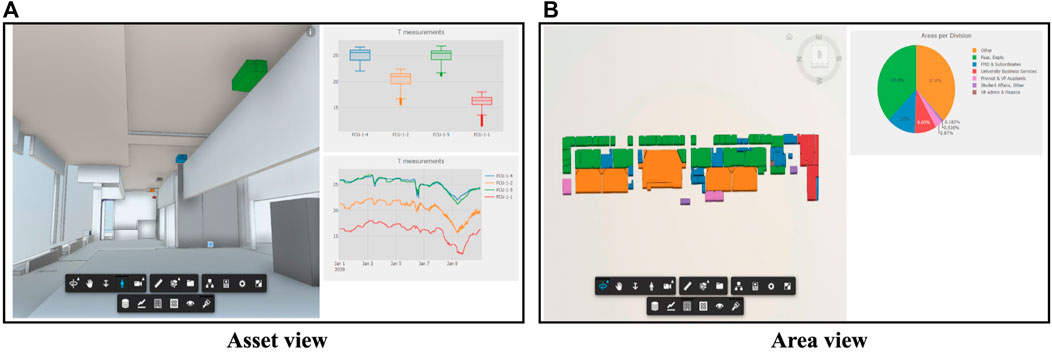
Figure 8 depicts two additional views of the CDT. In the asset view (Figure 8A) where the user can walk virtually inside the building, select one or multiple assets, and display the recorded data on the graphics to the right. In the area view (Figure 8B) to the right highlights rooms according to static data stored in the 3D model like in this case the division owning the space. The interaction between the user and this dashboard is translated by the web application into API (Application Programming Interface) calls (Figure 3). APIs ensure data protection by exposing a limited set of functionalities to client applications. Two APIs were developed. The first allows querying the ontology database based on user selection (e.g., query the list of temperature sensors of the selected building floor), the second serves to query sensor data from the time series database (e.g., retrieve temperature readings in the user selected date/time interval).
4.4 Reasoning & Problem Solving
Two reasoning POCs were developed to implement different aspects of fault detection. The first is reactive, mapping occupant dissatisfaction tracked through work order complaints to identify areas of concern. These analytics both helps prioritize responses and supports root cause analysis. This is complemented by the latter, which applies reasoning to proactively monitor building systems and equipment to identify early signs of failures or deviations from their normal range of observations that could contribute to occupant dissatisfaction.
In the following, these two applications of analytics and fault detection will be described.
4.4.1 Work Order Analytics
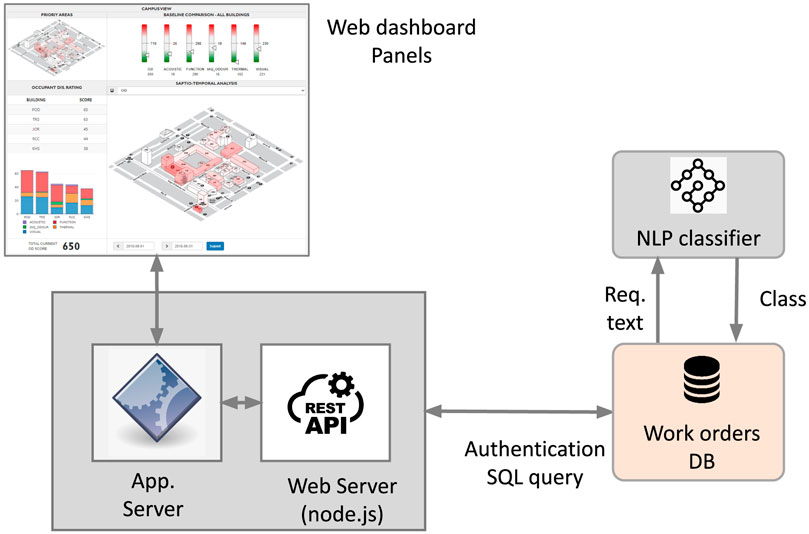
Analyzing the satisfaction of campus occupants is a key priority of the FM team. Satisfaction of campus occupants is a key priority of the FM team. By applying the core principles of the CDT, the occupant satisfaction dashboard depicted in Figures 4, 9 was implemented. Data is extracted from a table/index in the time series database referred to as work orders DB. This table receives in real time all occupants’ complaints recorded from emails or phone calls at the Facility Management Department (FMD) after being filtered and converted to work orders. A Natural Language Processing (NLP) model using a Convolutional Neural Network (CNN) classifies each work order and assigns it to one of the following categories: Acoustic, Function, indoor air quality/Odor, Thermal, or Visual. This model was trained previously on labeled orders by FMD operators. As new orders are generated by FM, they are automatically labelled by the classifier and stored in the time series database. The web application is hosted in the cloud and shows a dashboard that provides analytics on customer satisfaction based on the time stamped data in the time series database.
This figure presents three views: the campus view (Figure 9A) shows KPIs for a given month where buildings are highlighted with shades of color that depend on the general indicator called OD (Occupant dissatisfaction). Darker shades indicate higher OD values, in other words, buildings with higher numbers of complaints. A group of indicators on the top panel displays the campus performance for each complaint class. The three-color-coded indicators red, white and green respectively show whether the current month is worse, similar or better than the last 6-month average. The details of the top five buildings in terms of complaints are shown as stacked bar plots in the left panel. When clicking on any building, the same metrics are displayed per floor (Figure 9B), and when clicking on a floor, metrics are shown per room (Figure 9C). A 3D viewer color-codes the rooms to visualize the degree of severity with regards to the selected metric.
4.4.2 Fault Detection
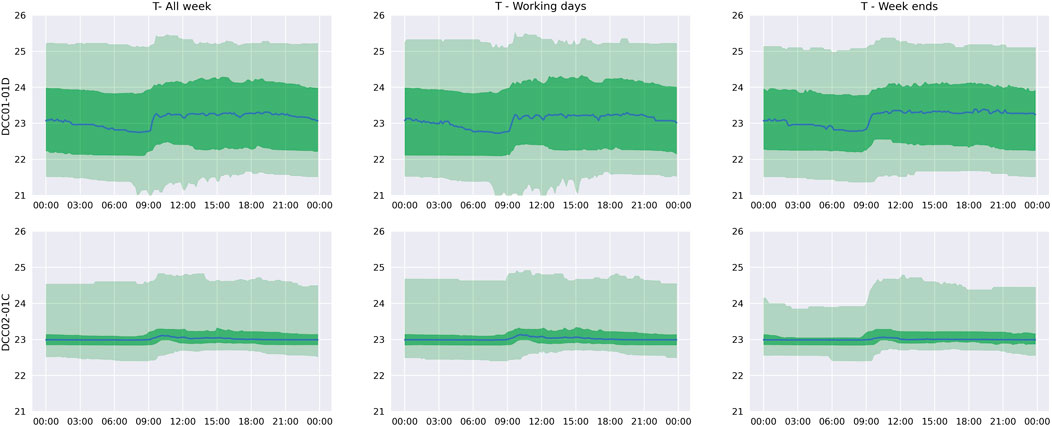
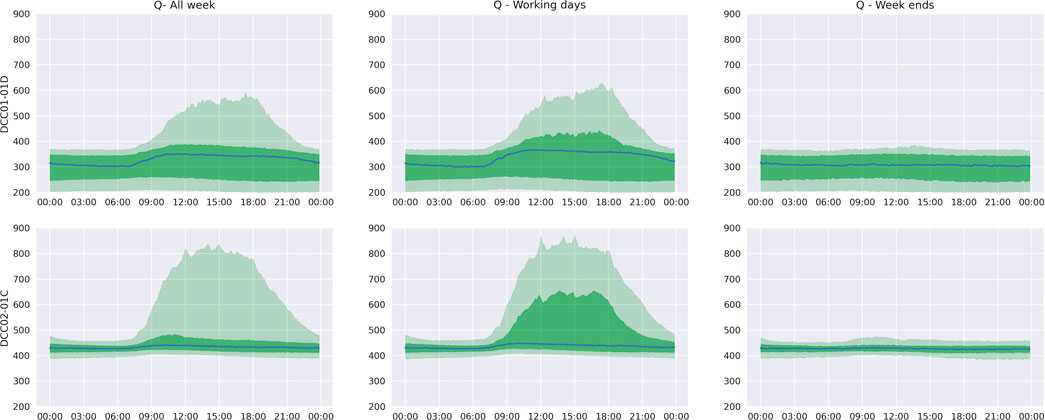
Fault detection is a second application where machine learning algorithms and analytics can be efficiently applied to monitor the behavior of building equipment and sensors. Having different instances of the same equipment is helpful for the CDT to learn the normal behavior by equipment type over a defined period of time, then compare new observations with those previously recorded. A simple method to monitor temperature and CO2 levels in rooms compares current observations with such recorded profiles. Figure 10 shows the temperature daily profile recorded for two rooms from the last 2 years of data. The light green interval shows the 5th to 95th percentiles, the dark green zone is delimited by the 25th - 75th percentiles, while the blue line is the median. The second and third columns represent the same profile for working days and weekends. One can observe more variance in the first room observations than the second, which suggests more activity in the first room. A basic anomaly detection algorithm consists in comparing the temperature observations at any time with this profile recorded in the CDT memory, then raise a warning when the measured temperature is between the 5th and 25th or the 75th and 95th percentiles, and generate an alert when the temperature is below the 5th percentile or above the 95th as these observations are unlikely to occur.
Figure 11 shows similar profiles for CO2 levels. It is important to note the use of appropriate CO2 level profiles for working days and weekends as percentiles are different due to absence of occupants during the weekend.
The application of this simple yet powerful algorithm for reasoning allowed the CDT to detect a failure in a CO2 sensor that was sending continuous erroneous readings due to dust accumulation. In a second case, anomalous ambient and discharge air temperatures were detected in the machine room, and the fault was due to a damaged belt in the associated Fan Coil unit. In a third case, higher temperatures were observed in one of the learning areas of the building, and the issue was related to a broken window causing external hot air infiltration.
A more elaborated ML method was applied to building data to classify and cluster BAS data; this was published in (El Mokhtari and McArthur 2021). This method uses Convolutional Neural Networks to learn time series patterns characterizing each HVAC equipment and is applied to recognize faults in Fan Coil Units. Refer to this study for further details. An additional study is underway to explore the use of Bayesian Networks for probabilistic fault detection and classification.
4.5 Learning
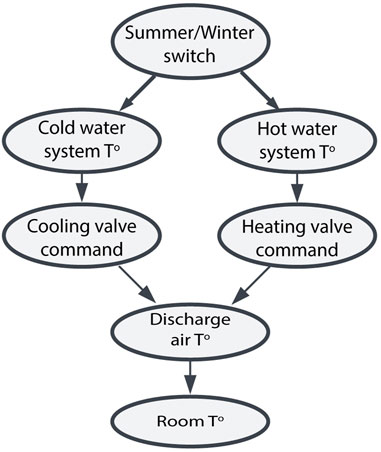
The focus of learning in the case study is fault detection. Statistical knowledge developed from rooms, equipment, groups of both are stored daily, weekly, monthly, and bi-annually is used to detect deviations from the normal range of values. Semantic knowledge for fault detection is also stored by running clustering algorithms over multiple variables related to the same asset, saving the model parameters in the knowledge memory. Figure 12 is an example of a knowledge graph instantiated as a Bayesian network learning the operational behavior of an HVAC equipment. Edges represent conditional probabilities between nodes and their predecessors. These probabilities are continually updated from streamed data and can serve many purposes such as fault detection.
In this case study, knowledge resulting from machine learning models was internalized by updating each sensor’s daily profile for workdays and weekends. Two years of data were stored and recent data assigned a higher weighting with profiles updated daily. New profiles are stored as a list of 144 rows (1 row for a 10-min period) with 5 values for each row (5th, 25th, 50th, 75th and 95th percentiles). The parameters of the CNN in the NLP classifier are saved in the knowledge memory. Occasionally, this classifier is retrained when new labeled instances are provided by FMD, and its set of parameters updated in the knowledge memory.
It is clear that knowledge data is unstructured, therefore it will be stored in a NoSQL database in the data lake (e.g. MongoDB) where parameters are directly recorded in CSV or JSON formats, while binary files (e.g. neural network weights) will be serialized prior to being stored in the database.
5 Recommendations for Cognitive DT Development
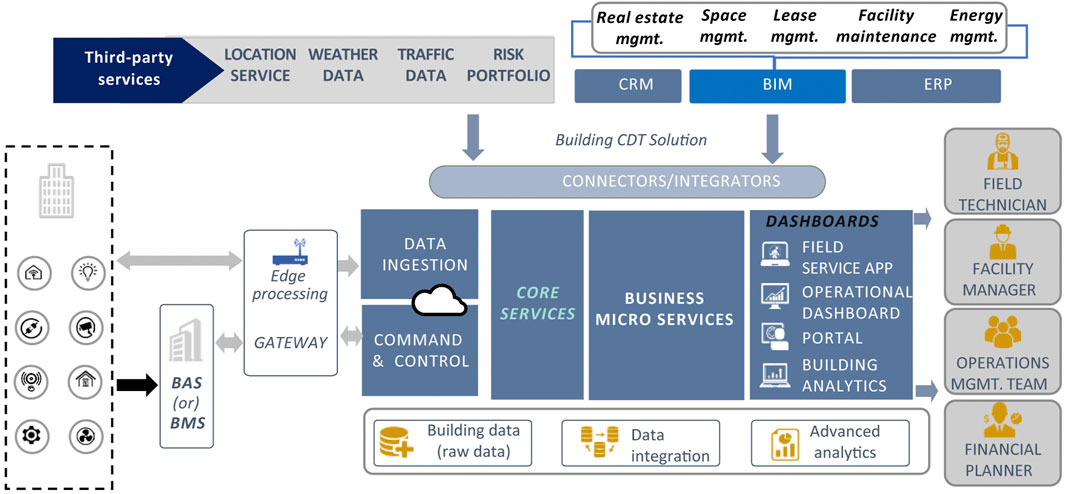
Based on the case study, a standardized architecture for Building CDTs is illustrated in Figure 13.
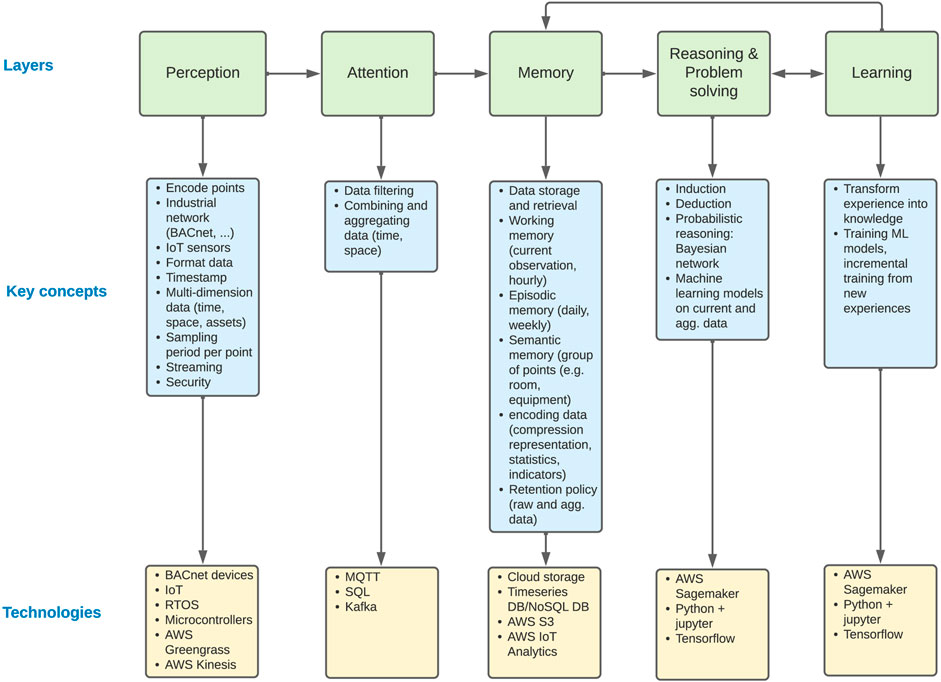
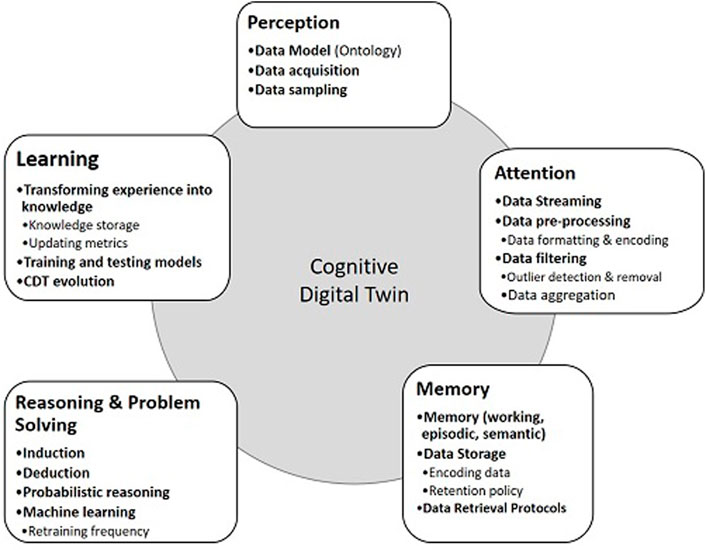
To support this architecture, a generalized framework has been developed to define the key attributes and functions required for CDT development, as presented in Figure 14.
The key technologies and approaches identified in this case study and recommended to support this framework described in the following sections.
5.1 Perception
The three biggest challenges for perception of a CDT are to identify, collect, and structure the relevant information. Data identification consisted of itemizing the computer-aided FM data available for the campus, discovering the BAS points, and integrating additional IoT sensors required to supplement the research. Accessing BAS legacy data has historically been inefficient, both due to proprietary encoding of BACNet data beyond the field controllers and because of inconsistent data point classification or nomenclatures. New cloud services such as AWS IoT Core/GreenGrass address the former by facilitating the discovery of—and COV data streaming from - BACNet devices on a connected network. Classification of these points used the CNN and LSTM approach developed in previous research (El Mokhtari and McArthur 2021). For non-digital data, cloud-hosted computer vision and pattern recognition services are of significant value, permitting image and video processing. By locating these at the edge, automated inspection and defect detection results are obtained with minimal latency, allowing for root cause analysis of unexpected changes in system behaviour and the triggering of corrective action. Data structuring remains the most effort-intensive task, but this can be minimized by the use of established ontologies (Brick, W3C, etc.) or simplified versions thereof.
5.2 Attention
The CDT use case revealed many challenges related to attention that can be summarized in two areas: data and edge computing. In the first area, the key question is to determine how much data is enough to digitally replicate the physical building. Selection of relevant sensory points as well as their sampling rate are a key prerequisite in CDT modeling. Outlier detection and removal as well as aggregation schedules (e.g., hourly, daily) are then defined to provide consistent data streaming with different time-scaled views.
The second area is related to the design of the edge computing network. EMs are a vital part in collection and streaming data to the cloud and require several considerations prior to their design and deployment:
1) Design: The number of EMs and their processing capability depend on the number of sensors managed by each EM, their type, and the volume of data they generate. Computational power is also dictated by the pre-processing needed for each data packet.
2) Communication: EMs must support communication protocols compatible with sensors and the cloud (e.g., BACnet, HTTPS, TCP). As EMs live in the edge separating sensor networks and the cloud, they may become vulnerable points. Exchange with the cloud streaming manager must be encrypted and proper firewall rules instantiated in the main building routers. Security prequisites include: authorizing the minimum number of ports in firewall, exchanges based on encrypted certificates and time-limited tokens instead of user/password-based connections.
3) Management: EMs must implement basic management routines for proper streaming. Local buffers for collected data must be sized proportional to the daily streamed volume. A good buffer ranges between 1 day to many days’ worth of data depending on the connection quality. All operations must be logged locally with logs accessed remotely with a notification service implemented to inform the streaming manager and human operators of failures or exceptions. EMs must also handle poor connections with sensors (retries and timeouts) and notify for dead sensors. Additionally, regular updates must be planned for EMs. EMs software core requires regular updates to avoid vulnerabilities and version mismatches. Some streaming managers can update the streaming core in the EM remotely (e.g., AWS IoT Core/Greengrass). Rules related to data management must comply and be updated after any ontology model’s upgrade. Other technologies such as FreeRTOS also provide operating system capabilities to microcontrollers, making small, low-power edge devices easy to program, deploy, secure, connect, and manage. Continuous health indicator monitoring including resources usage such as CPU, memory, disk space, disk I/O, and log sizes is also recommended.
5.3 Memory
The challenges found in relation to memory can be classified in three categories: data lake design, data ingestion, and visualization. Data lake is often addressed first as it contains all data models as well as streaming and ingestion services. As explained previously, the CDT in this case is implemented with cloud managed services which is a good choice in terms of efficiency, availability, scalability, and cost. The Time series database is a non-relational data store (e.g., NoSQL database) that requires support for time-based queries, high availability and low latency, horizontal scaling, as well as a seamless data movement from working memory to other memories (episodic, semantic) or archives for obsolete data. For the episodic and semantic memories, episodes length has to be defined as well as the relationships between variables and what semantics mean in the CDT use case. A significant side of the data lake operations is the streaming management, data ingestion, and ETL processing that are implemented in the cloud and edge machines. Managed services (e.g., AWS Kinesis, AWS IoT Core, AWS Glue) can seamlessly handle these transformations. Retention policies must be defined for all memories: how far in the past should the CDT recall events with all details? Is a compressed version of the data in the episodic or semantic memories sufficient? Those memories can have longer retention periods (up to 10 years), while working memory would require a shorter retention period (two to 5 years) before archiving. CDT can suffer from cold start (Lika et al., 2014) problem when no historical data is available. This will preclude learning algorithms from running until enough data is available (e.g., 2 months to 6 months of data collecting). It is important to find any existing data stored in BAS servers or other local databases and export it to the working memory to avoid this issue.
Visualizing data is important in communication on monitoring. Solutions can vary from open source viewers such as GLTF/Open GL, full software packages (e.g. Autodesk Revit, Grafana, MS PowerBI, Tableau), cloud storage + viewer API (e.g., Autodesk Forge, ESRI) or fully managed services (e.g., AWS IoT TwinMaker). The first three solutions will require simultaneous access to the data lake to overlay data on the building 3D model.
5.4 Reasoning & Problem Solving
The challenges related to reasoning and problem solving are related to the definition of the various models to enrich the cognition layer. Unsupervised learning has more applications compared to supervised as most data is not labelled. In fault detection, faults are rarely labeled in raw data, therefore, models need to apply statistical methods or unsupervised learning algorithm to define the edge between acceptable and anomalous behaviour. Reinforcement learning is only possible to apply on emulators built around existing data. Because the learning model needs to run periodically on episodes/subsets of data and store results in episodic and semantic memory, each learning algorithm requires the allocation of scalable resources and specific time for training and testing. In this case also, managed services (e.g., AWS SageMaker) allow a good balance in terms of cost and efficiency, especially given that many learning models require over a year of data to avoid bias and poor operation. For each such model, performance should be monitored and documented to establish the minimum data collection period required for acceptable performance.
5.5 Learning
The key questions to be answered while implementing learning relate to the models’ retraining frequency, defining metrics to detect when models need to learn new knowledge, and developing knowledge storage and management protocols.
For the retraining frequency, a balance of computational cost and algorithm accuracy must be considered; varying this frequency, storing the trends, and learning the resultant relationship effects permits its optimum to be determined. The knowledge accuracy dictates whether it can be used with confidence to predict future events or make reliable simulations. Expert feedback is of great value in interpreting this, supplementing insights from trend analysis with operational insight to inform retraining frequency and providing human-in-the-loop insight to interpret and determine actions for low confidence results.
Metrics need to be defined based on the accuracy of the models that generated the results. KPIs developed in associated with the FM team inform the development of such KPIs and acceptable accuracy thresholds.
Finally, knowledge storage and management practices include defining strategies to identify and forget obsolete knowledge while updating existing knowledge. This knowledge can be stored as model parameters, analytics by location and asset, semantic relationships, set of deducted rules, or full models. Because knowledge is unstructured by definition, it can be stored in various formats; of these, NoSQL databases and knowledge graphs offer particular value.
5.6 Maximizing Cognitive Digital Twin Effectiveness and Efficiency
The business outcomes of CDTs can be classified in two categories: improving operational efficiency and providing new capabilities. Efficiency includes optimizing operations and predicting failures, reducing energy usage and costs, and improving building user experience. Collaboration with FM teams is invaluable to inform the appropriate KPIs and associated metrics and gain access to the data sources necessary to support CDT development.
Regarding computational cost issues, CDTs allow for incremental buildout as different systems are brought online and integrated into a single solution. The outlined framework allows for CDTs to be adapted to changing business needs without upfront budget commitments. This allows organizations to plan their deployments and provision only the ingestion, storage, and computing capacity needed to bring critical capabilities to life. It is noteworthy that cloud providers typically use sublinear pricing, unit costs are lower with higher volume of usage so volume forecasting is recommended to identify the cost-optimal cloud approach.
6 Conclusion
This paper explores the key concepts and challenges of designing and implementing Cognitive Digital Twins (CDTs). Framed by Al Faruque, et al.’s (2021) identification of essential cognition capabilities—perception, attention, memory, reasoning, problem solving and learning—we present a full-building case study with POCs relevant to each. For each POC, we present its implementation to address the barriers to CDT development identified in the literature: data modeling, collection and secure streaming, low-latency storage, appropriate reasoning and problem solving, and learning. We found that by using paired EMs to provide robust and secure data streaming, cloud services provided the best advantages in terms of scalability, availability, performance, and maintenance of CDTs. Further, cloud-managed artificial intelligence (AI) and machine learning (ML) services are particularly valuable, enabling DT designers and builders to easily add the cognitive layers of the CDTs.
Based on the lessons learned from this implementation, we developed a reference architecture and a development framework to support future research into CDTs, including recommendations for key attributes, functions, and technologies. In doing so, we provide insight on the applicability, interoperability, and integrability of CDT concepts, demonstrated in a full-scale case study, addressing the current discourse regarding how to incorporate and implement cognitive attributes for buildings.
6.1 Limitations
While the CDT presented here went through several stages in its development, there are several limitations that prevent it from being considered it as a complete and generalizable case study. The first is the use of a single cloud platform (AWS) for the case study, which necessarily biased the investigation toward the services available on this platform. Other providers may offer cloud services that might equally or better serve the purpose of cognition in this CDT. Additionally, while some use cases are implemented at the campus scale, BAS data is only available to a single building, narrowing the CDT implementation significantly. Finally, the presented CDT is preliminary, integrating limited data and use cases.
6.2 Future Work
The expansion of the CDT across the full campus is in-progress, including the integration of transportation and infrastructure elements as well as BAS data streaming from additional campus buildings. These will permit the CDT to be expanded and address broader range of use cases and shed new light on challenges and constraints arising at this scale. To enable this scaling, the CDT data model is being translated into neo4j (a graphDB) to reduce computational cost and simplify quality checking. Other future research will incorporate new types of data sources—for example design and sourcing decision-making processes and embodied carbon data—to integrate carbon-reduction KPIs into the CDT. Learning is also being expanded through the scaling of the Bayesian Network FDD proof-of-concept to the building scale and through the development of an autonomous SOCx system. The latter requires not only learning but new developments in M2M communication to permit machines to inform each other of performance status and adjust their behaviour independently.
Publisher’s Note
All claims expressed in this article are solely those of the authors and do not necessarily represent those of their affiliated organizations, or those of the publisher, the editors and the reviewers. Any product that may be evaluated in this article, or claim that may be made by its manufacturer, is not guaranteed or endorsed by the publisher.
Data Availability Statement
The original contributions presented in the study are included in the article/Supplementary Material, further inquiries can be directed to the corresponding author.
Author Contributions
KE conducted the majority of the CDT implementation and wrote the majority (60%) of the first draft of the paper. IP provided industry-specific insight and contributed (5%) to the paper. JM is the Principal Investigator for this project, providing overall direction, wrote 35% of paper, and finalized its content.
Funding
This research has been funded by the Natural Science and Engineering Research Council (NSERC) Alliance Grant (ALLRP- 544569–19) and FuseForward.
Conflict of Interest
KE was employed by FuseForward. IP is employed by Amazon Web Services (AWS).
The remaining author declares that the research was conducted in the absence of any commercial or financial relationships that could be construed as a potential conflict of interest.
Publisher’s Note
All claims expressed in this article are solely those of the authors and do not necessarily represent those of their affiliated organizations, or those of the publisher, the editors and the reviewers. Any product that may be evaluated in this article, or claim that may be made by its manufacturer, is not guaranteed or endorsed by the publisher.
Acknowledgments
The collaboration of Jean-Francois Landry and the wider Facilities Management Department at Ryerson University has been invaluable to this research. Portions of the research builds on the FuseForward technology for managing and automating the delivery of complex systems, as described in US patents US9406022 and US8595258, entitled “Method and System for Managing Complex Systems Knowledge” (Damm 2013; Damm 2016).
References
Abburu, S., Berre, A. J., Jacoby, M., Roman, D., Stojanovic, L., and Stojanovic, N. (2020). “Cognitive Digital Twins for the Process Industry,” in Proceedings of the The Twelfth International Conference on Advanced Cognitive Technologies and Applications (COGNITIVE 2020) (Nice, France: IEEE), 25–29.
Agrell, C., Dahl, K. R., and Hafver, A. (2021). Optimal Sequential Decision Making with Probabilistic Digital Twins. arXiv. pre-print 2103.07405. doi:10.48550/arXiv.2103.07405
Al Faruque, M. A., Muthirayan, D., Yu, S. Y., and Khargonekar, P. P. (2021). “Cognitive Digital Twin for Manufacturing Systems,” in Design, Automation & Test in Europe Conference & Exhibition (IEEE), 440–445.
ASHRAE (1995). Standard 135-1995: Bacnet-A Data Communication Protocol for Building Automation and Control Networks. Atlanta, Georgia, USA: American Society of Heating, Refrigerating and Air-Conditioning Engineers.
Basu, S., and Meckesheimer, M. (2007). Automatic Outlier Detection for Time Series: an Application to Sensor Data. Knowl. Inf. Syst. 11 (2), 137–154. doi:10.1007/s10115-006-0026-6
Bhattacharya, A., Ploennigs, J., and Culler, D. (2015). Short Paper: Analyzing Metadata Schemas for Buildings: The Good, the Bad, and the Ugly. SL, ACM, 33–34.
Caramia, G., Corallo, A., and Mangialardi, G. (2021). “The Digital Twin in the AEC/FM Industry: a Literature Review,” in Proc. of the Conference CIB W78 (Luxembourg: CIB W78), 11–15.
Damm, M. (2013). Method and System for Managing Complex Systems Knowledge. United States of America Patent. 2016. US9406022 and US8595258.
Damm, M. (2016). Method and System for Managing Complex Systems Knowledge. United States of America, Patent No. US8595258..
Delgarm, N., Sajadi, B., Kowsary, F., and Delgarm, S. (2016). Multi-objective Optimization of the Building Energy Performance: A Simulation-Based Approach by Means of Particle Swarm Optimization (PSO). Appl. energy 170, 293–303. doi:10.1016/j.apenergy.2016.02.141
Ehrlinger, L., and Wöß., W. (2016). Towards a Definition of Knowledge Graphs. Semant. Posters, Demos, Success. 48 (1-4), 2. Available at http://ceur-ws.org/Vol-1695/paper4.pdf
Eirinakis, P., Kalaboukas, K., Lounis, S., Mourtos, I., Rožanec, J. M., Stojanovic, N., et al. (2020). “Enhancing Cognition for Digital Twins,” in 2020 IEEE International Conference on Engineering, Technology and Innovation (ICE/ITMC) (Cardiff: IEEE), 1–7. doi:10.1109/ice/itmc49519.2020.9198492
El Mokhtari, K., and McArthur, J. J. (2021). “A Data-Driven Approach to Automatically Label BAS Points,” in Proceedings of the 38th International Conference of CIB W78 (Luxembourg: CIB W78), 70–79.
Farahat, I. S., Tolba, A. S., Elhoseny, M., and Eladrosy, W. (2019). “Data Security and Challenges in Smart Cities,” in Security in Smart Cities: Models, Applications, and Challenges (Cham, Switzerland: Springer), 117–142. doi:10.1007/978-3-030-01560-2_6
Fuller, A., Fan, Z., Day, C., and Barlow, C. (2020). Digital Twin: Enabling Technologies, Challenges and Open Research. IEEE access 8, 108952–108971. doi:10.1109/access.2020.2998358
Gilani, S., Quinn, C., and McArthur, J. J. (2020). A Review of Ontologies within the Domain of Smart and Ongoing Commissioning. Build. Environ. 182, 107099. doi:10.1016/j.buildenv.2020.107099
Han, J., Jeong, Y., and Lee, I. (2015). “A Rule-Based Ontology Reasoning System for Context-Aware Building Energy Management,” in 2015 IEEE International Conference on Computer and Information Technology; Ubiquitous Computing and Communications; Dependable, Autonomic and Secure Computing; Pervasive Intelligence and Computing (Liverpool: IEEE), 2134–2142. doi:10.1109/cit/iucc/dasc/picom.2015.317
Hu, S., Corry, E., Horrigan, M., Hoare, C., Dos Reis, M., and O’Donnell, J. (2018). Building Performance Evaluation Using OpenMath and Linked Data. Energy Build. 174, 484–494. doi:10.1016/j.enbuild.2018.07.007
Kang, Y.-S., Park, I.-H., Rhee, J., and Lee, Y.-H. (2016). MongoDB-based Repository Design for IoT-Generated RFID/sensor Big Data. IEEE Sensors J. 16 (2), 485–497. doi:10.1109/JSEN.2015.2483499
Khajavi, S. H., Motlagh, N. H., Jaribion, A., Werner, L. C., and Holmstrom, J. (2019). Digital Twin: Vision, Benefits, Boundaries, and Creation for Buildings. IEEE access 7, 147406–147419. doi:10.1109/access.2019.2946515
Khosravi, M., Eichler, A., Schmid, N., Smith, R. S., and Heer, P. (2019). “Controller Tuning by Bayesian Optimization an Application to a Heat Pump,” in 18th European Control Conference (ECC) (Napoli: IEEE), 1467–1472. doi:10.23919/ecc.2019.8795801
Klinc, R., and Turk, Ž. (2019). Construction 4.0–digital Transformation of One of the Oldest Industries. Econ. Bus. Rev. 21 (3), 393–410. doi:10.15458/ebr.92
Lasi, H., Fettke, P., Kemper, H.-G., Feld, T., and Hoffmann, M. (2014). Industry 4.0. Bus. Inf. Syst. Eng. 6 (4), 239–242. doi:10.1007/s12599-014-0334-4
Lee, J., Azamfar, M., Singh, J., and Siahpour, S. (2020). Integration of Digital Twin and Deep Learning in Cyber‐physical Systems: towards Smart Manufacturing. IET Collab. Intell. Manuf. 2 (1), 34–36. doi:10.1049/iet-cim.2020.0009
Li, J.-Q., Yu, F. R., Deng, G., Luo, C., Ming, Z., and Yan, Q. (2017). Industrial Internet: A Survey on the Enabling Technologies, Applications, and Challenges. IEEE Commun. Surv. Tutorials 19 (3), 1504–1526. doi:10.1109/comst.2017.2691349
Li, S., Tryfonas, T., and Li, H. (2016). The Internet of Things: a Security Point of View. Internet Res. 26 (2), 337–359. doi:10.1108/IntR-07-2014-0173
Li, X., Bowers, C. P., and Schnier, T. (2009). Classification of Energy Consumption in Buildings with Outlier Detection. IEEE Trans. Industrial Electron. 57 (11), 3639–3644. doi:10.1109/TIE.2009.2027926
Li, Y., García-Castro, R., Mihindukulasooriya, N., O'Donnell, J., and Vega-Sánchez, S. (2019). Enhancing Energy Management at District and Building Levels via an EM-KPI Ontology. Automation Constr. 99, 152–167. doi:10.1016/j.autcon.2018.12.010
Lika, B., Kolomvatsos, K., and Hadjiefthymiades, S. (2014). Facing the Cold Start Problem in Recommender Systems. Expert Syst. Appl. 41 (4), 2065–2073. doi:10.1016/j.eswa.2013.09.005
Liu, T., Tan, Z., Xu, C., Chen, H., and Li, Z. (2020). Study on Deep Reinforcement Learning Techniques for Building Energy Consumption Forecasting. Energy Build. 208, 109675. doi:10.1016/j.enbuild.2019.109675
Lu, Q., González, L. D., Kumar, R., and Zavala, V. M. (2021). Bayesian Optimization with Reference Models: A Case Study in MPC for HVAC Central Plants. Comput. Chem. Eng. 154, 107491. doi:10.1016/j.compchemeng.2021.107491
Lu, Q., Xie, X., Heaton, J., Parlikad, A. K., and Schooling, J. (2019). From BIM towards Digital Twin: Strategy and Future Development for Smart Asset Management. Service Oriented, Holonic and Multi-Agent Manufacturing Systems for Industry of the Future (Valencia: Springer) 853, 392–404. doi:10.1007/978-3-030-27477-1_30
Lv, Z., Li, X., Lv, H., and Xiu, W. (2019). BIM Big Data Storage in WebVRGIS. IEEE Trans. Industrial Inf. 16 (4), 2566–2573. doi:10.1109/TII.2019.2916689
Magnier, L., and Haghighat, F. (2010). Multiobjective Optimization of Building Design Using TRNSYS Simulations, Genetic Algorithm, and Artificial Neural Network. Build. Environ. 45, 739–746. doi:10.1016/j.buildenv.2009.08.016
McArthur, J. J., and Bortoluzzi, B. (2018). Lean-Agile FM-BIM: a Demonstrated Approach. Facilities 36 (13/14), 676–695. doi:10.1108/f-04-2017-0045
Miller, C., Nagy, Z., and Schlueter, A. (2015). Automated Daily Pattern Filtering of Measured Building Performance Data. Automation Constr. 49, 1–17. doi:10.1016/j.autcon.2014.09.004
Miloslavskaya, N., and Tolstoy, A. (2016). Big Data, Fast Data and Data Lake Concepts. Procedia Comput. Sci. 88, 300–305. doi:10.1016/j.procs.2016.07.439
Misic, T., Gilani, S., and McArthur, J. J. (2021). “BAS Data Streaming for Smart Building Analytics,” in Proceedings of the 37th CIB W78 Information Technology for Construction Conference (CIB W78) (São Paulo: CIB W78), 430–439. doi:10.46421/2706-6568.37.2020.paper031
Mocanu, E., Mocanu, D. C., Nguyen, P. H., Liotta, A., Webber, M. E., Gibescu, M., et al. (2018). On-line Building Energy Optimization Using Deep Reinforcement Learning. IEEE Trans. smart grid 10 (4), 3698–3708. doi:10.1109/TSG.2018.2834219
Mortlock, T., Muthirayan, D., Yu, S. Y., Khargonekar, P. P., and Al Faruque, M. A. (2021). Graph Learning for Cognitive Digital Twins in Manufacturing Systems. IEEE Trans. Emerg. Top. Comput. 10, 34–45. doi:10.1109/TETC.2021.3132251
Nguyen, H. L., Vu, D. T., and Jung, J. J. (2020). Knowledge Graph Fusion for Smart Systems: A Survey. Inf. Fusion 61, 56–70. doi:10.1016/j.inffus.2020.03.014
Oti, A. H., Tah, J. H. M., and Abanda, F. H. (2018). Integration of Lessons Learned Knowledge in Building Information Modeling. J. Constr. Eng. Manage. 144 (9), 04018081. doi:10.1061/(asce)co.1943-7862.0001537
Quinn, C., and McArthur, J. J. (2021). A Case Study Comparing the Completeness and Expressiveness of Two Industry Recognized Ontologies. Adv. Eng. Inf. 47, 101233. doi:10.1016/j.aei.2020.101233
Ramprasad, B., McArthur, J. J., Fokaefs, M., Barna, C., Damm, M., and Litoiu, M. (2018). “Leveraging Existing Sensor Networks as IoT Devices for Smart Buildings,” in 2018 IEEE 4th World Forum on Internet of Things (WF-IoT) (Singapore: IEEE), 452–457. doi:10.1109/WF-IoT.2018.8355121
Ryerson University (2019). Daphne Cockwell Health Sciences Complex. Available at https://www.ryerson.ca/facilities-management-development/campus-development/completed-spaces/daphne-cockwell-health-sciences-complex/.
Sawhney, A., Riley, M., Irizarry, J., and Pérez, C. T. (2020). “A Proposed Framework for Construction 4.0 Based on a Review of Literature,” in Associated Schools of Construction Proceedings of the 56th Annual International Conference (Liverpool: ASC), 1 301–309.
Semeraro, C., Lezoche, M., Panetto, H., and Dassisti, M. (2021). Digital Twin Paradigm: A Systematic Literature Review. Comput. Industry 130, 103469. doi:10.1016/j.compind.2021.103469
Sepasgozar, S. M. E. (2021). Differentiating Digital Twin from Digital Shadow: Elucidating a Paradigm Shift to Expedite a Smart, Sustainable Built Environment. Buildings 11 (151), 1–16. doi:10.3390/buildings11040151
Shohet, R., Kandil, M. S., Wang, Y., and McArthur, J. J. (2020). Fault Detection for Non-condensing Boilers Using Simulated Building Automation System Sensor Data. Adv. Eng. Inf. 46, 101176. doi:10.1016/j.aei.2020.101176
Si, B., Tian, Z., Jin, X., Zhou, X., and Shi, X. (2019). Ineffectiveness of Optimization Algorithms in Building Energy Optimization and Possible Causes. Renew. Energy 134, 1295–1306. doi:10.1016/j.renene.2018.09.057
Singh, V., and Willcox, K. E. (2018). Engineering Design with Digital Thread. AIAA J. 56 (11), 4515–4528. doi:10.2514/1.j057255
Smarra, F., Jain, A., De Rubeis, T., Ambrosini, D., D’Innocenzo, A., and Mangharam, R. (2018). Data-driven Model Predictive Control Using Random Forests for Building Energy Optimization and Climate Control. Appl. energy 226, 1252–1272. doi:10.1016/j.apenergy.2018.02.126
Stock, M., Kandil, M., and McArthur, J. J. (2021). “HVAC Performance Evaluation and Optimization Algorithms Development for Large Buildings,” in Proceedings of Building Simulation 2021 (Bruges: IBPSA).
Tang, S., Shelden, D. R., Eastman, C. M., Pishdad-Bozorgi, P., and Gao, X. (2019). A Review of Building Information Modeling (BIM) and the Internet of Things (IoT) Devices Integration: Present Status and Future Trends. Automation Constr. 101, 127–139. doi:10.1016/j.autcon.2019.01.020
Uribe, O. H., Adil, M., Garcia-Alegre, M. C., and Guinea, D. (2015). “A Context-Awareness Architecture for Managing Thermal Energy in an nZEB Building,” in 2015 IEEE First International Smart Cities Conference (ISC2), 1–6.
Varia, J., and Mathew, S. (2014). Overview of Amazon Web Services. Seattle: Amazon Web Services (AWS).
Waibel, C., Wortmann, T., Evins, R., and Carmeliet, J. (2019). Building Energy Optimization: An Extensive Benchmark of Global Search Algorithms. Energy Build. 187, 218–240. doi:10.1016/j.enbuild.2019.01.048
Yaqoob, I., Ahmed, E., Hashem, I. A. T., Ahmed, A. I. A., Gani, A., Imran, M., et al. (2017). Internet of Things Architecture: Recent Advances, Taxonomy, Requirements, and Open Challenges. IEEE Wirel. Commun. 24 (3), 10–16. doi:10.1109/mwc.2017.1600421
Yitmen, I., Alizadehsalehi, S., Akıner, İ., and Akıner, M. E. (2021). An Adapted Model of Cognitive Digital Twins for Building Lifecycle Management. Appl. Sci. 11 (9), 4276. doi:10.3390/app11094276
Keywords: cognitive digital twin, smart building, data visualization, data streaming, IoT
Citation: El Mokhtari K, Panushev I and McArthur JJ (2022) Development of a Cognitive Digital Twin for Building Management and Operations. Front. Built Environ. 8:856873. doi: 10.3389/fbuil.2022.856873
Received: 17 January 2022; Accepted: 19 April 2022;
Published: 16 May 2022.
Edited by:
Ibrahim Yitmen, Jönköping University, SwedenReviewed by:
Mohamed Hamdy, Norwegian University of Science and Technology, NorwayDennis Shelden, Rensselaer Polytechnic Institute, United States
Ümit Işıkdağ, Mimar Sinan Fine Arts University, Turkey
Copyright © 2022 El Mokhtari, Panushev and McArthur. This is an open-access article distributed under the terms of the Creative Commons Attribution License (CC BY). The use, distribution or reproduction in other forums is permitted, provided the original author(s) and the copyright owner(s) are credited and that the original publication in this journal is cited, in accordance with accepted academic practice. No use, distribution or reproduction is permitted which does not comply with these terms.
*Correspondence: J. J. McArthur, amptY2FydGh1ckByeWVyc29uLmNh
 Karim El Mokhtari
 Ivan Panushev
 J. J. McArthur
