 Xin Li
 Yanrong Li
- Department of Earth Sciences and Engineering, Taiyuan University of Technology, Taiyuan, China
Standard penetration test (SPT) is an important in situ measurement for field investigation of geotechnical and geological engineering. The drilling approaches for implementation of SPT can be classified into dry, wet, and water circulation drillings according to the amount of water used during drilling process. However, the influences of these drilling methods on the SPT results remain unclear, especially when being used in loess–paleosol sequence that is water sensitive. In this study, SPT tests were conducted in a typical loess stratum in the Loess Plateau of China. The difference of SPT N values under the above three drilling methods was compared together with the analysis of characteristics of samples from SPT sampler. The results showed that the N value exhibits positive correlation with dry density of the soil and negative correlation with moisture content. In shallow soil, the average N value under water circulation drilling was slightly higher than that of dry and wet drilling. This is because that the residual soil at the bottom of the drillhole caused by water circulation drilling provides additional penetration resistance. In deep soil, the difference of average N values among all three drilling methods was minimal although the structure of the samples from the SPT sampler differs from one another, indicating the determination of soil density on the SPT result. Empirical equations were proposed for the estimation of unconfined compressive strength of loess–paleosol sequence on the basis of SPT N values under the three drilling methods. Considering the efficiency of drilling and stability of SPT results, it is suggested that wet drilling is the most applicable method for implementation of SPT in the field investigation of loess–paleosol sequence.
Introduction
Loess refers to a grayish yellow or brownish yellow deposit formed by wind transport under arid and semiarid climatic conditions since Quaternary (Li et al., 2019). Standard penetration test (SPT), as an efficiency in situ measurement, is commonly used in the engineering geological investigation for obtaining the parameters required for engineering design given its simplicity and economy (Broms and Flodin, 1988). SPT is suitable for clay, silt, and sand soil (Chang, 2018). It is performed through freely falling a 63.5-kg donut-type hammer from a height of 762 mm to drive a standard split-spoon sampler to penetrate into the target soil layer (YS5213-2000, 2000). The first 150-mm penetration is not counted for later calculation, given that this soil layer would have been disturbed by the boring of the hole. The SPT N value is the blow number required to drive the sampler over the depth from 150 to 450 mm (Terzaghi et al., 1996; Chang, 2018). The SPT N value can comprehensively reflects the structure and basic physical and mechanical properties of the measured soil layer (Yagiz et al., 2008; Mayne et al., 2009; Chai et al., 2011; Macrobert, 2017), and it is commonly used to classify soil types and estimate soil strength (Jiang et al., 2010), e.g., unconfined compressive strength (Terzaghi et al., 1996), given that the SPT N value and unconfined compressive strength have a positive correlation (Terzaghi et al., 1996).
A drillhole is needed to perform SPT in deep soil. The current hole-making techniques mainly include percussive, vibration, wash, and rotary drillings (Tai, 2005). The first three drilling methods use impact force, vibration force, or high-pressure water injection to break the strata, consequently resulting in large disturbance at the hole bottom and therefore affecting the measured SPT N values. Rotary drilling is more suitable for SPT than the other hole-making techniques, because it uses axial pressure and rotation to drill the bit to cut soil and imposes less disturbance to the hole bottom (Tai, 2005).
At present, rotary drilling can be classified into dry drilling (DD), wet drilling (WD), and water circulation drilling (WCD), according to the water consumption during drilling. No water is consumed during DD. The moisture content of the hole bottom soil is generally reduced due to the drilling-induced heat. WD refers to adding water to the drill pipe each time when the drill tool is lowered. The amount of water added is limited not to exceed plastic limit of the soil. The water infiltrates into the soil, cools the drill bit, and reduces drilling resistance so that to gain a relatively fast drilling footage. During WCD, water is circulated through the hole bottom and therefore infiltration of water into the bottom soil cannot be avoided. The change of moisture content induced by the above three drilling methods disturbs the hole bottom soil, resulting in deviation of measured SPT N value. However, the degree of such disturbance of each method remains unclear, especially when being used in loess–paleosol sequence that is water sensitive (Fattah et al., 2017; Hayal et al., 2020).
In this study, SPT was conducted in a typical loess–paleosol sequence in the Loess Plateau of China. DD, DW, and WCD methods were used to prepare drillholes for the implementation of SPT. Comparison of the obtained SPT N values from different drilling methods was carried out together with the analysis of physical properties and structure characteristics of the samples from SPT sampler (SS).
Methods
The drilling site is located on the north side of a large gully 3 km east of Shenyugou Village, Jingle County, China, with a complete Quaternary loess–paleosol sequence. The investigation is arranged (Figure 1) with seven drillholes and two exploratory pits. The spacing between holes is 5–10 m to avoid interference from adjacent drillholes. Drillholes DD1, DD2, and DD3 were drilled with DD method, WD1 and WD2 with WD, and WCD1 and WCD2 with WCD. T1 and T2 are exploration pits dug with a mechanical excavator. The drilling was conducted according to the requirements of “Technical Specification for Engineering Geological Prospecting and Sampling of Constructions” (JGJ/T 87-2012, 2011).
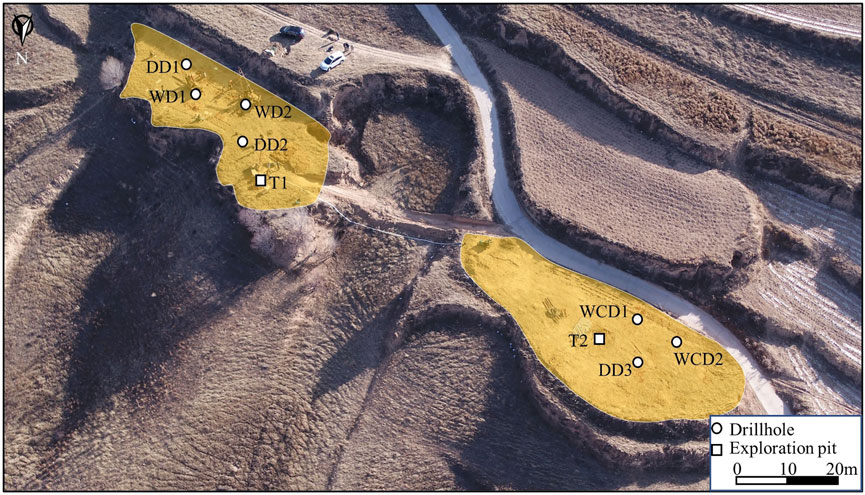
FIGURE 1. Site investigation with seven drillholes (DD1, DD2, DD3, WD1, WD2, WCD1, and WCD2) for SPT tests and two exploration pits (T1 and T2) for collection of undisturbed samples.
The SPT was conducted at every 2 m from the ground surface down to 30 m in the drillholes (Figure 2A), and the SPT N value of each test was recorded. The SS was photographed and placed in a split pipe with the same diameter as that of the sampler (Figure 2B). Foam cotton was plugged at both ends of the split pipe to avoid disturbance of sample during transportation to the laboratory. Undisturbed blocky samples of 10 × 10 × 20 cm were collected in the exploratory pit (Figure 2C) at the same depth as the SPT for comparison analysis (Figure 2D).
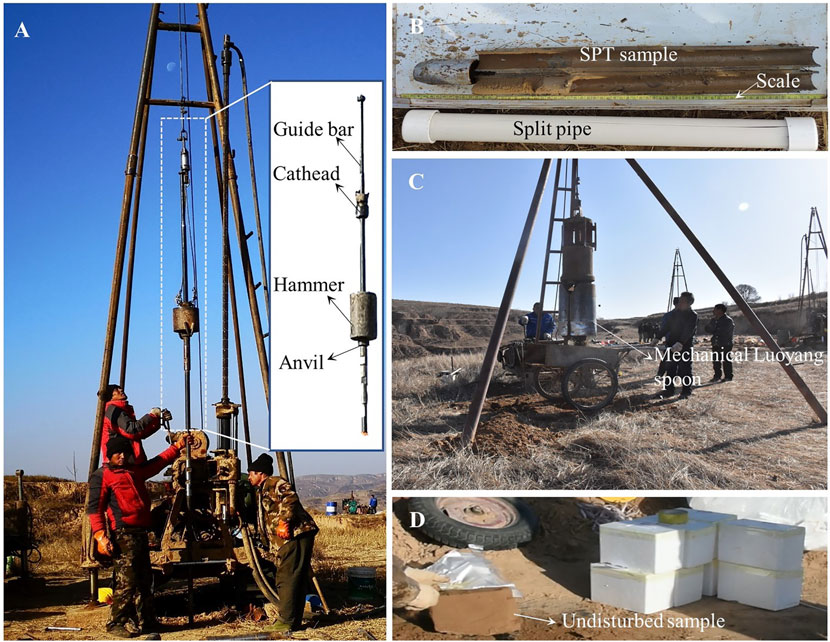
FIGURE 2. Field test and sampling: (A) SPT, (B) SPT sample, (C) excavation of exploratory pit, and (D) undisturbed blocky sample from pit.
Figure 3 shows the profile of the strata. Within the investigated depth of 0–30 m, there exists Holocene loess (Q4, 0–0.7 m), Late Pleistocene loess (Q3, 0.7–17 m), and Middle Pleistocene loess (Q2, 17–30 m). SSs under different drilling methods and undisturbed samples (USs) from exploration pit were tested for moisture content, dry density, and unconfined compressive strength in accordance with the “Standard for Soil Test Method” (GB/T 50123-2019, 2019). A total of 432 specimens (three duplicated specimens per depth) were tested for moisture content with oven dry method and 288 specimens (two duplicated specimens per depth) were tested for dry density via laser scanning method (with a resolution of 0.01 mm). The specimens for unconfined compressive strength test were prepared from USs using a wire cutter to transform them into cylindrical columns of 50 (diameter) × 100 (height) mm, and a total of 64 specimens (two parallel samples at each depth) were measured. The ends of the cylindrical specimen were polished to be smooth and coated with Vaseline. The uniaxial compression tests were conducted using a universal testing machine at a constant displacement rate of 0.2 mm/min.
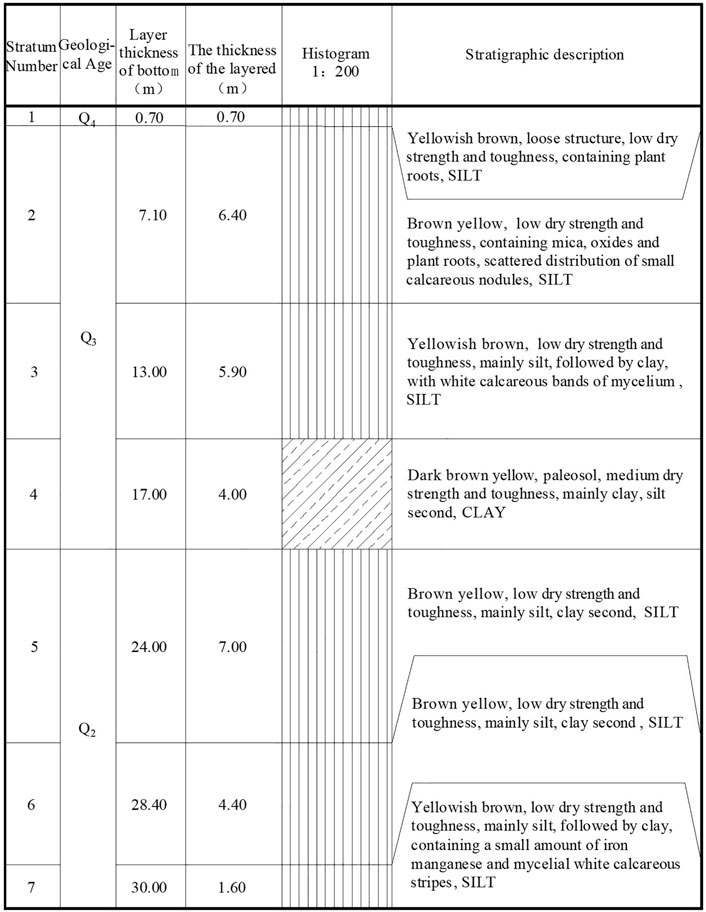
FIGURE 3. Drillhole log of the investigation site.
Results
SPT N Value
As shown in Figure 4A, the average SPT N value under each drilling method increased with depth. The average SPT N value under WCD was slightly greater than that under DD and WD, whereas the difference in average SPT N value between DD and WD is minimal.
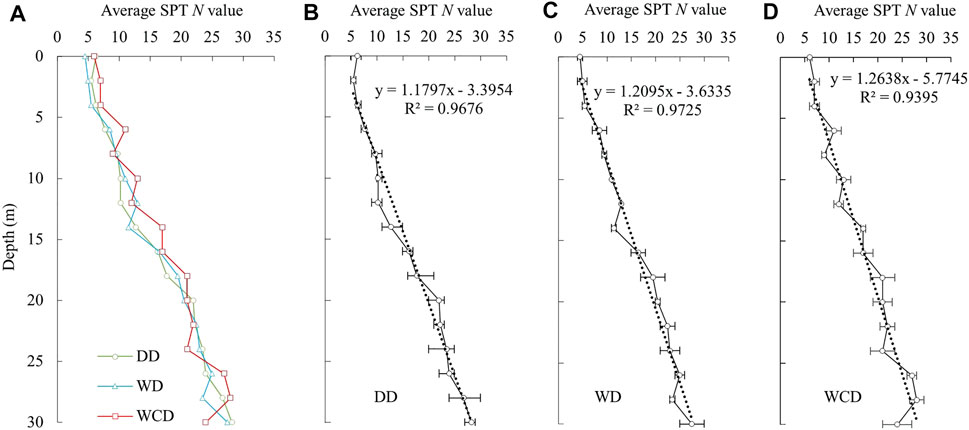
FIGURE 4. Change of SPT N values with depth: (A) average N value of three drilling methods, (B) DD, (C) WD, and (D) WCD.
The error bars in Figures 4B–D represent the range of SPT N values of the measured soil layer. The variation of N value for shallow soil was less than that for deep soil, and the variation under WD was the smallest among the three drilling methods, indicating a relatively stable measurement using WD method.
Disturbance in Moisture Content
On the basis of the measurement of US from exploration pits, the moisture content of soil increased rapidly with depth within 8 m and then increased slowly down to 30 m (Figure 5A). Great fluctuations were found in the soil layer near 14 m depth. The variation trend of moisture content of SS with depth under the three drilling methods was basically the same as that of US (Figure 5A). However, there were obvious differences in moisture content between SS and US at the same depth (Figure 5A). The moisture content was shifted by around −1.02%, 1.93%, and 3.90% in the cases of DD, WD, and WCD, respectively, compared to US (Figures 5B–D), indicating that consumption of water during drilling changes moisture content of the hole bottom soil.
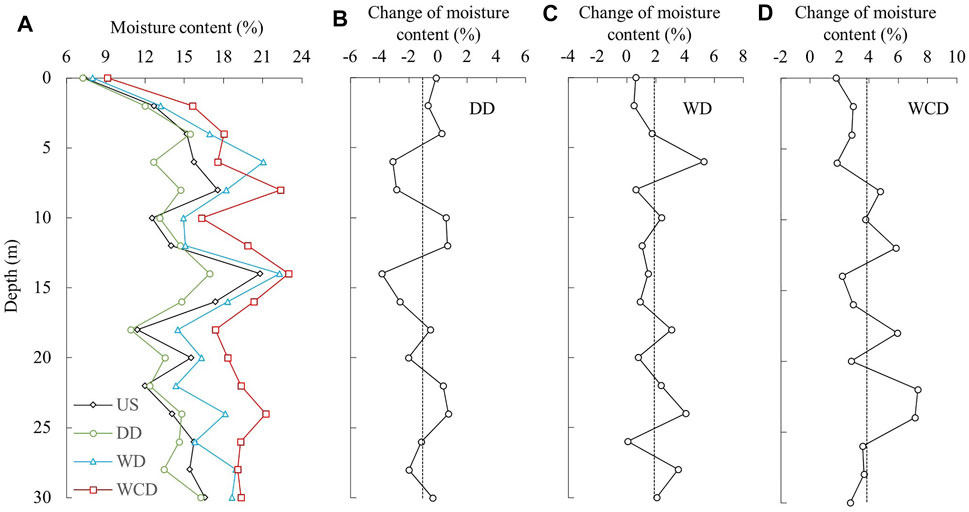
FIGURE 5. Change of moisture content induced by drilling: (A) measured moisture content of US and SS from drillholes drilled using DD, WD, and WCD methods, and (B–D) are the difference in moisture content between US and SS of different drilling methods. The dotted line represents the average value.
Disturbance in Dry Density
The dry density of SS was measured on the middle section of the sample from the sampler. Figure 6A shows that the dry density of US and SS under each drilling method increased with depth. Compared with the US, the dry density of SS was much higher, increasing by about 0.37 g/cm3, and the increment of dry density under WCD method was more stable than that under the other two drilling methods (Figures 6B–D). In addition, the increment of dry density under all three drilling methods tended to decrease with depth (Figures 6B–D). The above results reveal that the soil penetrated into the sampler has been compacted. The shallow soil is more compacted than the deep soil, whereas the drilling method has ignorable effect on disturbance of dry density of SS.
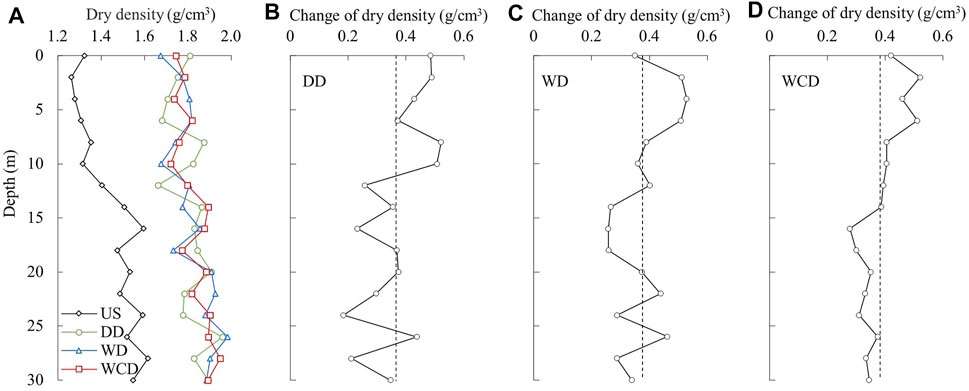
FIGURE 6. Change of dry density induced by drilling: (A) measured dry density of US and SS from drillholes drilled using DD, WD, and WCD methods, and (B–D) the difference in dry density between US and SS of different drilling methods. The dotted line represents the average value.
After each SPT test, the standard split-spoon sampler removed from the drill pipe was placed horizontally and opened, and the total length of the sample inside was measured (Figure 2B). As shown in Figure 7, the length of SS was less than the penetration depth of 45 cm, which is consistent with the dry density of SS being much greater than that of US (Figure 6). The length of SS was positively correlated with dry density of US (Figure 7), indicating that the degree of SPT penetration-induced disturbance on soil structure decreases with the increase of in situ soil density. The average length of SS under DD, WD, and WCD was about 22.18, 19.25, and 18.01 cm, respectively, showing that the length of SS under DD was the largest, followed by that under WD and WCD.

FIGURE 7. Relationship between the length of SPT sample and dry density of undisturbed sample.
Discussion
Structure of SPT Sample
The structure of SPT sample presents a clear zoning characteristic (Figure 8), which can be divided into strongly disturbed zone (SDZ), relatively complete zone (RCZ), and compacted zone (CZ) from top to bottom. The SDZ is characterized by small pieces of sample under DD, it is generally composed of an isolated hard block with concave bedding layers under WD, and it is mud under WCD. The RCZ presents a dense block without obvious bedding under the three drilling methods. The CZ is characterized by highly compacted convex beddings, which get most obvious under WCD.
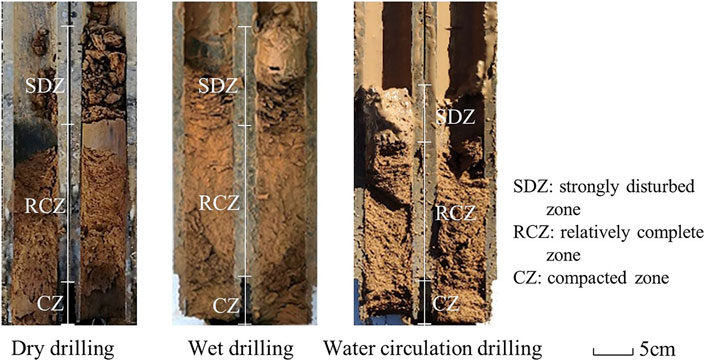
FIGURE 8. Typical structure characteristics of SPT samples under the three drilling methods.
As shown in Figure 9, the average proportion of sample length of the three zones (SDZ, RCZ, and CZ) was 45.01%, 47.21%, and 7.78% for DD; 37.95%, 52.49%, and 9.56% for WD; and 29.87%, 55.82%, and 13.31% for WCD, respectively. The SDZ had the largest proportion under DD, and this proportion decreased with depth. For WCD, the proportion of SDZ was the smallest, but the proportion of CZ was the largest, and it increased with depth. For WD, the proportion of three zones changed little with depth, especially the proportion of RCZ was the most stable. The above observations indicate that the degree of disturbance in soil structure caused by SPT penetration under DD is greater than that under WD and WCD.
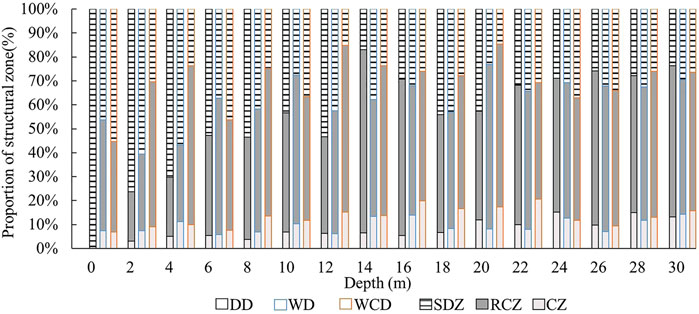
FIGURE 9. Proportion of structural zones of SPT sample under different drilling methods.
Mechanical Analysis
Figure 10 presents a schematic diagram of forces acting on sampler and SPT sample. The equilibrium equations of forces at static state can be expressed as follows:
Pw exists only under WCD. G and F are constant during the whole process of SPT. fs1 and FN1 are determined by physical and mechanical properties of the measured soil. fs and fs’ increase with penetration depth (Dai, 1989). The SS is compacted due to the existence of fs’, and this phenomenon is intensified with the increased soil pressure acting on the inner wall of the sampler, resulting in the length of SPT sample less than the penetration depth. Furthermore, the compactness of SPT sample increases from top to bottom, and the loose topsoil is strongly disturbed under high-frequency vibration caused by hammer force F (Deger, 2014). Under DD, the SDZ sample is broken into pieces, and the SDZ sample is an isolated hard block under WD. This is due to the water used in WD, which makes the SDZ section plastic. The SDZ sample under WCD is muddy due to the immersion of water of hole bottom soil and the existence of overlying water pressure Pw. The Pw is also the main reason for the shortest length SPT sample under WCD among all three drilling methods.
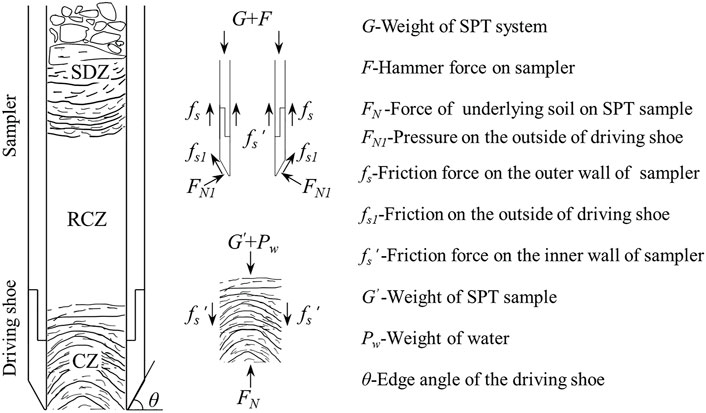
FIGURE 10. Mechanical analysis of SPT sampling.
During penetration, the convex bedding develops in the sample, especially in the CZ section, under the upward thrust FN of the newly penetrated soil. This is because the periphery of sample is easily affected by fs’, resulting in greater upward displacement at the center of the sample. The concave bedding in the SDZ sample evolved from the convex bedding due to the sample settlement caused by the vibration of the sampler. The RCZ sample is a transition zone with relatively complete structure and less bedding. The convex bedding is most obvious under WCD because the Pw weakens the impact of vibration on the sample, whereas the concave bedding is most obvious under WD because the hard block formed at the top constantly hit the center of the sample.
The penetration resistance (i.e., the resultant of fs, fs’, fs1, and FN1) of the sampler determines the SPT N value. Under WCD, the residual soil formed at the bottom of the drillhole due to the sinking of suspended coarse particles provides additional penetration resistance by increasing the fs, resulting in a slightly higher SPT N value than that under the other drilling methods.
Application Evaluation
The SPT N value is commonly used to estimate the unconfined compressive strength of soil (Terzaghi et al., 1996; YS5213-2000, 2000). Because different lengths of rods lead to different transmission efficiency of hammering energy in SPT, it affects the measured SPT N value. In this study, rod length correction of SPT N value under different drilling methods was performed according to “Specification for Standard Penetration Test” (YS5213-2000, 2000). Univariate regression analysis was conducted by taking unconfined compressive strength (qu) of US as dependent variable and the corrected SPT N value (Ncor) as independent variable. The correlations were shown in Figure 11 and Eqs 3–5 for DD, WD, and WCD drillings, respectively. These equations can be applied to estimate the unconfined compressive strength of loess. Among them, SPT N values under DD have the highest correlation coefficient.
In our tests on the loess strata, the wall of drillhole is prone to collapse during WCD, whereas the collapse of hole rarely occurs during DD and WD drillings. This is because that loess has strong collapsibility and the use of a large amount of water during WCD leads to destruction of loess structure (Al-Obaidi et al., 2018; Fattah et al., 2019). In terms of drilling efficiency, DD, WD, and WCD took averagely 0.6, 0.4, and 0.35 h to proceed 1 m, respectively, and the drilling velocity with WD or WCD is 30% higher than that with DD. In addition, the disturbance degree of soil structure caused by SPT under DD is much greater than that under WD and WCD. Considering that the SPT N value has little difference under all three drilling methods and that the measured N value under WD is relatively stable, it is suggested that WD is an applicable method to implement SPT in loess regions.
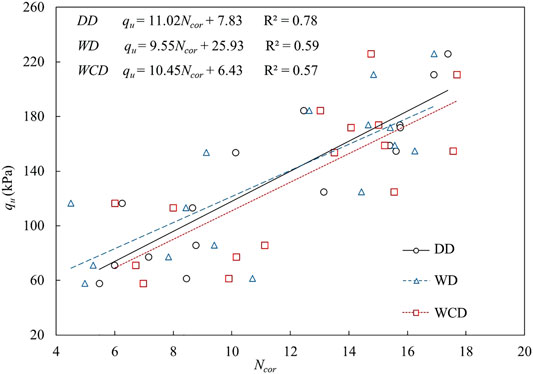
FIGURE 11. Correlation between qu and Ncor.
Conclusion
SPTs in drillholes under dry, wet, and water circular drilling methods were carried out in a typical loess stratum of Chinese Loess Plateau. The measured SPT N value and the physical property and structure of SS the under three drilling methods were compared and analyzed. The main conclusions are summarized as follows.
1) The residual soil at the bottom of the drillhole caused by WCD increases the friction on the outer wall of the sampler. As a result, the SPT N value under WCD was slightly greater than that under DD and WD.
2) The WCD caused great disturbance to moisture content of the SPT sample. During penetration, SPT sample is compressed by friction and vibration, resulting in a sample length shorter than the penetration depth. The structure of SPT sample under DD was the most disturbed because the sample is easily broken under the action of high-frequency vibration.
3) Empirical equations were established for estimating the unconfined compressive strength of loess based on SPT N value under all three drilling methods.
4) WD method is suggested for the implementation of SPT in loess strata by considering the stability of SPT N value, soil disturbance degree, and drilling efficiency.
Data Availability Statement
The original contributions presented in the study are included in the article/Supplementary Material, further inquiries can be directed to the corresponding author.
Author Contributions
YL conceived the project and designed the experiment. XL and DL conducted field and laboratory tests. SH and WZ jointly collected and interpreted the test data. YL developed the theoretical analysis. YL and XL wrote the paper.
Funding
This study was supported by the following: National Natural Science Foundation of China (No. 41877276), Key Program of National Natural Science Foundation of China (No. 41630640), Major Program of the National Natural Science Foundation of China (No. 41790445), 2014 Fund Program for the Scientific Activities of Selected Returned Overseas Professionals in Shanxi Province, Shanxi Scholarship Council of China, Outstanding Innovative Teams of Higher Learning Institutions of Shanxi, Research Project for Young Sanjin Scholarship of Shanxi, Collaborative Innovation Center for Geohazard Process and Prevention at Taiyuan University of Technology, and Recruitment Program for Young Professionals of China.
Conflict of Interest
The authors declare that the research was conducted in the absence of any commercial or financial relationships that could be construed as a potential conflict of interest.
Publisher’s Note
All claims expressed in this article are solely those of the authors and do not necessarily represent those of their affiliated organizations or those of the publisher, the editors, and the reviewers. Any product that may be evaluated in this article, or claim that may be made by its manufacturer, is not guaranteed or endorsed by the publisher.
References
Al-Obaidi, A., Fattah, M. Y., and Al-Dorry, M. K. (2018). Variation of Suction during Wetting of Unsaturated Collapsible Gypseous Soils. Int. J. Eng. Techn. 7, 79–85. doi:10.14419/ijet.v7i4.37.23621
Broms, B., and Flodin, F. (1988). “History of Soil Penetration Testing,” in Proc 1st International Symposium on Penetration Testing. ISOPT-1: Orlando, 157–220. doi:10.1016/0148-9062(90)95075-C
Chai, J. F., Chen, Z. Y., and Tao, X. G. (2011). Qualitative Analysis of Influencing Factors of SPT Penetration Number. Highway 3, 147–150.
Dai, Y. (1989). The Main Measures to Improve the Precision of Standard Penetration Test. Hydrogeology Eng. Geology. 1, 55–59.
Deger, T. T. (2014). Overburden Stress Normalization and Rod Length Corrections for the Standard Penetration Test (SPT). Dissertation/doctor’s Thesis. Berkeley: University of California.
Fattah, M. Y., Hameedi, M. K., Hameedi, M. K., and Aswad, M. F. (2017). Determination of Collapse Potential of Gypseous Soil from Field and Laboratory Tests. Diyala J. Eng. Sci. 10, 75–85. doi:10.24237/djes.2017.10207
Fattah, M. Y., Obead, I. H., and Omran, H. A. (2019). A Study on Leaching of Collapsible Gypseous Soils. Int. J. Geotechnical Eng. 16, 44–54. doi:10.1080/19386362.2019.1647664
GB/T 50123-2019 (2019). Standard for Soil Test Method. Beijing: China Architecture & Building Press.
Hayal, A. L., Al-Gharrawi, A. M. B., and Fattah, M. Y. (2020). Collapse Problem Treatment of Gypseous Soil by Nanomaterials. EPI Int. J. Eng. 33, 1737–1742. doi:10.5829/IJE.2020.33.09C.06
JGJ/T 87-2012 (2011). Technical Specification for Engineering Geological Prospecting and Sampling of Constructions. Beijing: China Architecture & Building Press.
Jiang, J. P., Li, X. Z., and Luo, G. Y. (2010). Experimental Study on Correlativity between SPT and Physical and Mechanical Parameters of Foundation Soil of Nanjing Subway. J. China Railw. Soc. 1, 123–127. doi:10.3969/j.issn.1001-8360.2010.01.022
Li, Y., Shi, W., Aydin, A., Beroya-Eitner, M. A., and Gao, G. (2020). Loess Genesis and Worldwide Distribution. Earth-Science Rev. 201, 102947. doi:10.1016/j.earscirev.2019.102947
Macrobert, C. J. (2017). Interpreting DPSH Penetration Values in Sand Soils. J. S. Afr. Inst. Civ. Eng. 59, 11–15. doi:10.17159/2309-8775/2017/v59n3a2
Mayne, P. W., Coop, M. R., Springman, S. M., Huang, A-B., and Zornberg, J. G. (2009). Geomaterial Behavior and Testing. Proc. 17th Int. Conf. Soil Mech. Geotechnical Eng. 4, 2777–2872. doi:10.3233/978-1-60750-031-5-2777
Tai, G. H. (2005). The Study of Examination Effect of the Drilling Technology to Standard Penetration testDissertation/master’s Thesis. Beijing: China University of Geosciences.
Terzaghi, K., Peck, R. B., and Mesri, G. (1996). Soil Mechanics in Engineering Practice. New York: John Wiley & Sons.
Yagiz, S., Akyol, E., and Sen, G. (2008). Relationship between the Standard Penetration Test and the Pressuremeter Test on sandy Silty Clays: a Case Study from Denizli. Bull. Eng. Geol. Environ. 67, 405–410. doi:10.1007/s10064-008-0153-2
Keywords: SPT, dry drilling, wet drilling, water circulation drilling, loess–paleosol sequence
Citation: Li X, Li Y, Lv D, He S and Zhang W (2022) Influence of Drilling Methods on the Results of Standard Penetration Test in Loess–Paleosol Sequence. Front. Built Environ. 8:846815. doi: 10.3389/fbuil.2022.846815
Received: 08 January 2022; Accepted: 21 February 2022;
Published: 18 March 2022.
Edited by:
Domenico Lombardi, The University of Manchester, United KingdomReviewed by:
Mohammed Y. Fattah, University of Technology, IraqPengpeng Ni, Sun Yat-sen University, China
Copyright © 2022 Li, Li, Lv, He and Zhang. This is an open-access article distributed under the terms of the Creative Commons Attribution License (CC BY). The use, distribution or reproduction in other forums is permitted, provided the original author(s) and the copyright owner(s) are credited and that the original publication in this journal is cited, in accordance with accepted academic practice. No use, distribution or reproduction is permitted which does not comply with these terms.
*Correspondence: Yanrong Li, bGkuZGVubmlzQGhvdG1haWwuY29t