 Stefano Silvestri
 Rovshan Allahverdiyev
 Enrico Marconi
94% of researchers rate our articles as excellent or good
Learn more about the work of our research integrity team to safeguard the quality of each article we publish.
Find out more
ORIGINAL RESEARCH article
Front. Built Environ., 13 April 2022
Sec. Earthquake Engineering
Volume 8 - 2022 | https://doi.org/10.3389/fbuil.2022.844804
The present study compares the dynamic properties and seismic performances offered by reinforced concrete frame structures characterized by different beams distribution. The understanding of the influence of beams distribution on spatial frames is not only useful when dealing with the seismic vulnerability assessment of existing buildings that may show unusual layouts of beams, such as alternating beams at each storey, but also when facing the design of new buildings with fluid viscous dampers for which some structural flexibility is required. A systematic study is described in this paper. Four (2-, 3-, 6-, and 10-storey) regular frame buildings with rectangular plan are considered as reference structures. Different models are developed according to various layouts of the primary beams, exploring alternatives to the full three-dimensional organisation of beams and frames. For instance: beams placed along the longitudinal direction at the odd storeys and placed along the transversal direction at the even storeys, and vice versa; alternating beams every one and two storeys; beams just placed along one direction. Modal analysis has been conducted to evaluate the influence of beams distribution on the dynamic properties (periods of vibration and modal participating mass ratios). Response spectrum analysis and linear time-history dynamic analysis have been carried out to assess the effects of beams distribution on the fundamental seismic response parameters (shear forces, bending moments, top-storey displacements, interstorey drifts, and floor accelerations). On the contrary of what could be expected, the results indicate that structures with beams alternating every storey may show interesting advantages in terms of reduced total base shear, almost comparable bending moments and accelerations, within a still balanced overall behaviour along the two directions, with respect to the complete three-dimensional frame. Two effects are recognized: the period effect and the static scheme effect. The former acting basically on the storey shear forces; the latter acting mainly on the bending moments.
In countries like Italy, most of the building stock dates back to the post-second world war, when most of the territory was classified as non-seismic, and thus now presents inadequate earthquake-resistant performances (Vona and Masi, 2004; Cacace et al., 2018). In detail, according to the official data of the 2011 census (http://dati-censimentopopolazione.istat.it), buildings realised in the years ‘50s, ‘60s, and ‘70s represent the 46% of the overall Italian residential building stock. Out of this 46%, 54% is characterised by a masonry structure, 30% by a reinforced concrete (RC) structure and 16% by other materials.
Existing RC multi-storey frame buildings realized before the enforcement of seismic design code prescriptions therefore represent approximately 14% of the current Italian residential building stock. They are often characterized by one-dimensional frames, with beams aligned only along one direction (usually, the longitudinal one) and floors working along the other direction (usually, the transversal one) (Pozzati and Ceccoli, 1977) (Figure 1A). Nevertheless, it could happen that existing buildings show unusual distribution of beams, such as beams placed along one direction at the odd storeys and placed along the other direction at the even storeys (Figure 1B). These uncommon structural solutions may be found of course rarely, but still they were used thanks to the foresight and understanding of the structural behavior of the designers of those times. Those practitioners anticipated the nowadays widely-recognized fundamental seismic need of providing lateral stiffness and strength along both the main directions of the building (Bachmann, 2003; Petrini et al., 2004; Ghersi and Lenza, 2009). Indeed, current seismic design practice involves the insertion of lateral-resisting systems along both directions [e.g., §4.2.1.3 “Bi-directional resistance and stiffness” of EN 1998-1 (CEN, 2004)], which, for frame structures, often leads to the full three-dimensional (3D) frame concept, with beams aligned along both directions at all storeys.
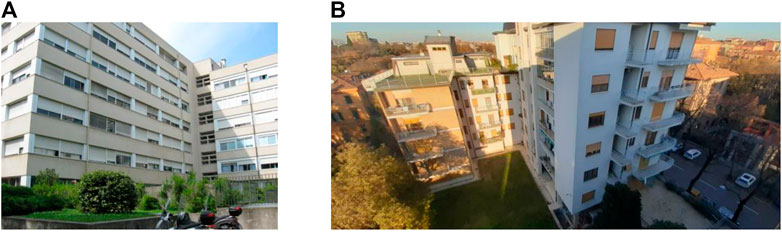
FIGURE 1. Illustrative examples of Italian RC frame buildings of the ‘50s, ‘60s, and ‘70s: (A) hospital building with one-directional frames (year of construction: 1971; location: Bologna, Italy), (B) residential building with alternating beams (year of construction: 1962; location: Modena, Italy).
To the knowledge of the authors, there are no systematic studies in the scientific literature regarding the comparison of different distributions of beams along the height of the building in terms of dynamic and seismic performances. The textbook by Pozzati and Ceccoli (1977), only accounting for static design with wind horizontal action, suggests that, for medium-rise buildings characterised by up to 6 or 7 storeys, the primary beams should be better aligned along the longitudinal direction. The textbook by Giangreco (2002) introduces the frame structural systems from an historical point of view and classifies RC frame buildings on the basis of the construction process, with specific focus on prefabricated systems. Masi (2003) evaluates the seismic vulnerability of planar frame types (bare frames, regularly infilled frames, and pilotis frames) representative of existing RC buildings designed only to vertical loads and widely present in the Italian building stock of the last century. The guidelines by Bachmann (2003) focus on the basic principles of seismic conceptual design of buildings, including among many others: to avoid soft storeys, asymmetries, and discontinuities in stiffness and resistance. Petrini et al. (2004) compare moment-resisting frames with braced frames, wall systems and mixed systems. Castellani and Faccioli (2008) highlight the importance of specific constructive details in terms of transversal reinforcement stirrups and concrete confinement, in order to achieve a ductile behavior of RC frames, and specifically warn about pilotis buildings. Ghersi and Lenza (2009) discuss the different contribution to the lateral stiffness and strength of beams with height emerging from the floor and of beams with height contained within the thickness of the floor. Even if rightly considered one of the most complete books in the earthquake engineering field, the textbook by Villaverde (2009) does not systematically treat and compare the structural typologies with respect to the most efficient design for earthquake forces. When dealing with RC multi-storey frame buildings, the textbook by Mezzina (2021) recalls the importance of a clear identification of the loads path to the ground and of structural regularity. Basically, since the seismic design provisions became critical, the full 3D frame concept was taken for granted and not anymore discussed, which is generally correct. However, a comparative study on different layouts of beams may reveal interesting results that could be useful for nowadays practitioners and may pave the way for alternative design concepts for both seismic design of new buildings and seismic retrofitting of existing buildings. The first case could be relevant to the application of seismic protection systems, such as fluid viscous dampers, when some structural flexibility would enhance their efficiency in mitigating earthquake effects, also exploiting the possibility of inserting dampers connecting floors which are 2 or 3 storeys apart (Silvestri and Trombetti, 2007). In the second case, in addition to providing new information about consequences of unusual beams layouts, some results could simulate the effects associated to damage due to plastic hinges formation at the end of the beams of a given storey aligned in a given direction (provided that the design has been developed according to the “weak beam-strong column” concept), to model the response to aftershocks of a building severely damaged by the mainshock of an earthquake sequence.
In this context, the objective of this paper is to investigate and compare the dynamic properties and seismic performances offered by RC spatial frame structures characterised by different beams distributions.
This is the first work that approaches the influence of beams distributions in frame buildings, by highlighting some unexpected good performances provided by structures with beams alternating every storey. The general aim is to share this idea to the scientific community, so that it could be further developed. In this respect, linear analyses are carried out on selected reference structures under several simplifying assumptions. The results obtained should be seen as a first “proof of concept” that would support and draw attention to this novel idea. Indeed, even if linear analyses could be not fully representative of the actual behavior of a specific building under strong ground motions, they provide more robust and general indications than non-linear analyses which strongly depend on the specific assumed parameters and have to be thus performed on a case-by-case basis. Nevertheless, as cautionary note, it should be clearly stated that, especially when dealing with strengthening interventions on existing RC buildings which are often characterised by non-linear response of the structural members due to limited strength, transposition of this idea into actual design should necessarily account for non-linear analyses including the specific features of the structure at hand. This would mean careful consideration of non-linear modelling (Paulay and Priestley, 1992; Bosco et al., 2009; Kreslin and Fajfar, 2010; Masi and Vona, 2012; Ferraioli, 2019), possible cracking of concrete (Priestley, 2003; López and Music, 2016; Álvarez et al., 2020), torsional response (Fajfar et al., 2005; Ghersi et al., 2007; De Stefano and Pintucchi, 2008), higher modes effects in irregular buildings (Maniatakis et al., 2013; Ferraioli, 2015), infill panels effects (Noh et al., 2017; Liberatore et al., 2018; Mazza, 2019), etc.
The paper is organised as follows. First, the reference structures are selected on the basis of the most common typology of regular frame buildings (The Reference Structures). Second, several models are defined for each reference structure depending on the distribution of the beams at each storey (The Considered Models). Then, dynamic properties of the identified models are obtained by means of classical modal analysis (Modal Analysis). Seismic performances under the “rare” earthquake of the identified models are obtained by means of (Response Spectrum Analysis) and (Linear Time-History Analysis) carried out with the Finite Element program SAP 2000 (CSI 2021).
The typical RC moment-resisting frame building typology commonly adopted in the ‘50s, ‘60s, and ‘70s in Italy for both residential private buildings and municipal public buildings of particular importance (such as hospitals) has been considered.
Four case-study buildings have been taken into account as reference structures: 2-storey, 3-storey, 6-storey, and 10-storey structures. In all cases, regularity is preserved in both plan and elevation (except for the lateral stiffness which is affected by the beams layout), the rectangular plan is 15 m × 10 m, the structural mesh is 5 m × 5 m, and the interstorey height is 3.20 m [the dimensions are comparable to those adopted by (Masi, 2003)]. All structures have the same geometrical and mechanical characteristics apart from the total number of storeys and consequently the size of the columns.
Preliminary static design has been developed according to the Italian regulations (NTC 2018). Concrete class C25/30 is assumed. Young modulus of the concrete is assumed equal to 29,420 N/mm2. The floor loads are reported in Table 1. The seismic weight of the typical floor is quantified as 6.80 kN/m2, whilst the seismic weight of the roof floor is equal to 6.20 kN/m2. ψ2 is the combination coefficient for the live loads for the seismic combination, according to EN 1998-1 (CEN 2004) and NTC 2018. The distributed loads on the perimeter beams corresponding to the self-weight of the non-structural infill walls, accounting for a 0.8 reduction factor due to window openings, are quantified as 8.70 kN/m. All the primary beams are characterized by 30 cm × 50 cm rectangular cross-section, whilst the secondary (perimeter) beams by 30 cm × 24 cm cross-section. The columns are fixed at the base and are characterized by square cross-sections, with dimensions depending on the floor level and on the total number of storeys, as detailed in Table 2.
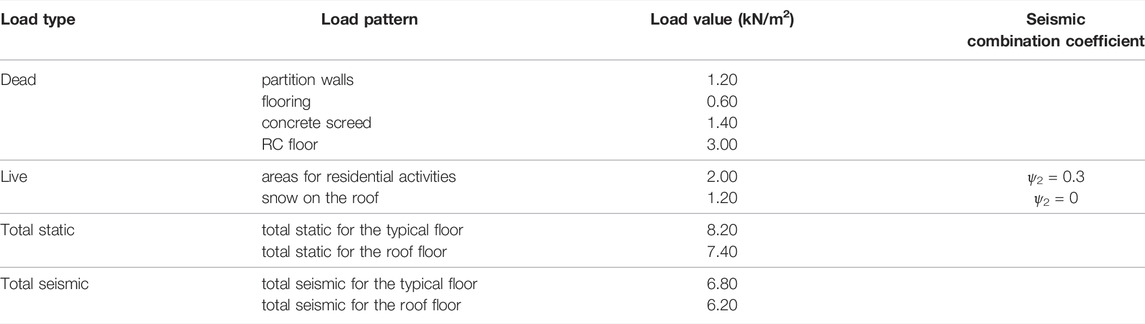
TABLE 1. Floor loads.
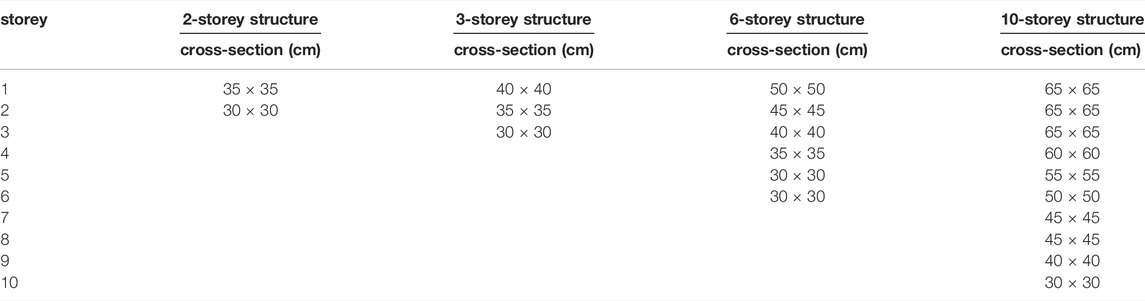
TABLE 2. Column cross-section dimensions for the four reference structures.
In this theoretical study, several simplifying assumptions are adopted to allow for a first clear understanding of the fundamental differences in the behaviour of the models introduced in the following section, that would have been otherwise mixed up and/or hidden by too many additional parameters:
• Linear modelling of the structural members is implemented.
• The beam-column joint regions are not specifically modelled, but are characterised by the same properties of the converging beams and columns up to the node. Neither simplified rigid joint behaviour, nor refined models (Bonacci and Pantazoupoulou, 1993; Calvi et al., 2002; Masi et al., 2009; Metelli et al., 2015) have been considered.
• The lateral stiffness and the strength provided by the infill panels are neglected, assuming the occurrence, at ULS, of extensive damage to exterior infill walls and interior partitions, that are thus supposed to act as fusible elements protecting the structural members, as also frequently occurred in L’Aquila in 2009 (Ricci et al., 2011; Rossetto et al., 2011; Trombetti et al., 2011). Accordingly, no reduction due to cracking (i.e., the typical 50% value provided by the NTC 2018) is taken into account for the flexural and shear stiffness properties of the structural members.
• The accidental eccentricity (i.e., the typical 5% value) is also neglected.
Considering such specific issues is beyond the scope of this first “ice-breaking” work on the topic.
Each reference structure has been modelled considering several beams layouts. Table 3 specifies the positioning of the primary beams along the two directions. The numbers indicate the storeys, while X and Y indicate the direction along which the primary beams are located. In detail:
• Models 1 and 2 are characterized by beams alternating at each storey. Models 1 show primary beams placed along the X-direction at the odd storeys and placed along the Y-direction at the even storeys. Models 2 show primary beams placed along the Y-direction at the odd storeys and placed along the X-direction at the even storeys. For instance, the first floor primary beams of Models 1 are placed only along the X-direction, whereas the first floor secondary beams are positioned orthogonally only on the facades as perimeter curbs.
• Models 3 and 4 have alternating beams every one and two storeys.
• Models all-X and all-Y are one-directional frame structures along the X- and Y-direction respectively. They correspond to the structural solutions of the widespread design practice of the ‘50s, ‘60s, and ‘70 s in Italy.
• Model 3D represents the full frame scheme where primary beams are placed in all possible positions. It corresponds to the structural solution of the current seismic design practice and is taken as reference for the comparative analysis. Being composed of primary beams in both X- and Y-directions, it is expected to be the stiffest among all considered models.

TABLE 3. The considered models and ranges of their total seismic weights.
Five models have been thus identified for the 2-storey structure and seven models for the 3-, the 6- and the 10-storey structures; they are detailed in Table 3. The last two rows of the table also report- the ranges of the total seismic weight for the building models, the minimum and the maximum value being always provided by the all-Y model and by the 3D model, respectively. The small difference (within 8%) is due to the self-weight of the beams.
As illustrative example, Figure 2 displays the three-dimensional view of Model 1 of the 6-storey structure, as well as the plan views of the odd- and even-storeys, and the prospects in the X-direction (longitudinal) and in the Y-direction (transversal). For Model 1: in the X-direction, primary beams are there only in the odd floors, while in the Y-direction primary beams are there only in the even floors.
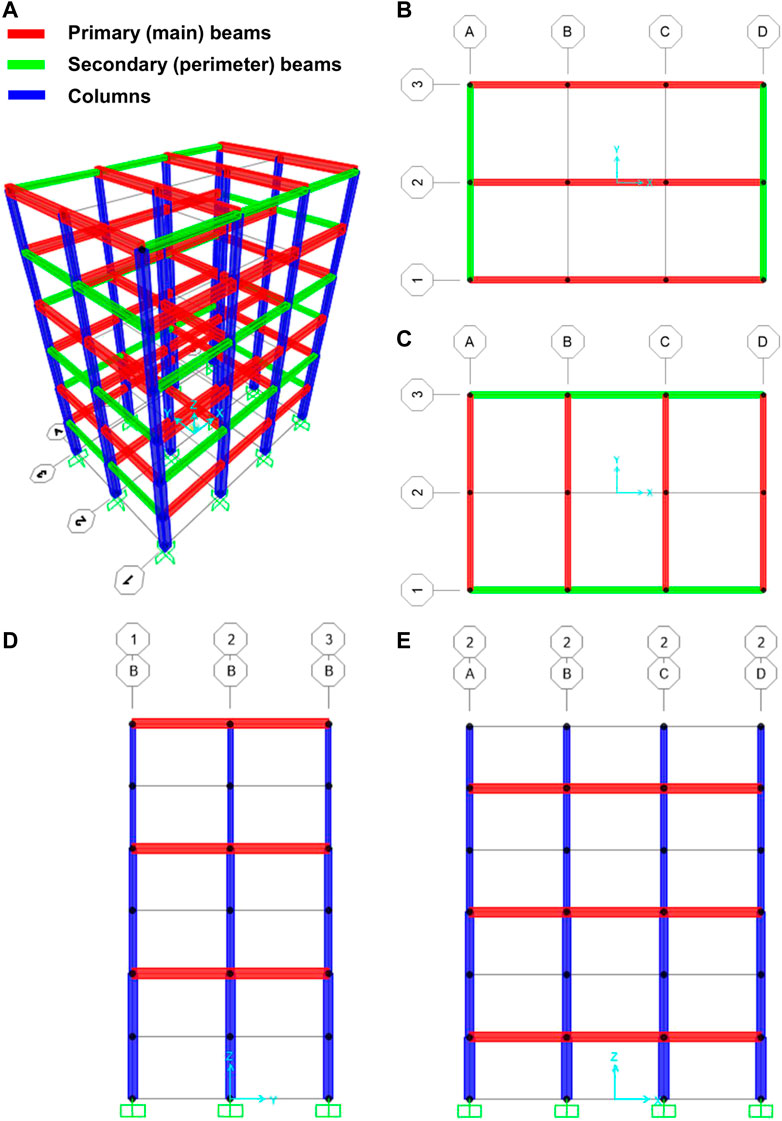
FIGURE 2. Model 1 of the 6-storey structure: (A) three-dimensional view; (B) odd-storey plan view; (C) even-storey plan view; (D) YZ prospect view for grid-line B; (E) XZ prospect for grid-line 2.
Modal analysis has been performed on all the considered models to determine the fundamental periods of vibration along the longitudinal (TX), transversal (TY), and rotational (Tθ) directions for the four reference structures. Figure 3 shows the obtained values of TX, TY, and Tθ, whilst Figure 4 shows the same values normalised with respect to the corresponding values (TX3D, TY3D, Tθ3D) of the reference 3D model, namely TX/TX3D, TY/TY3D, and Tθ/Tθ3D.
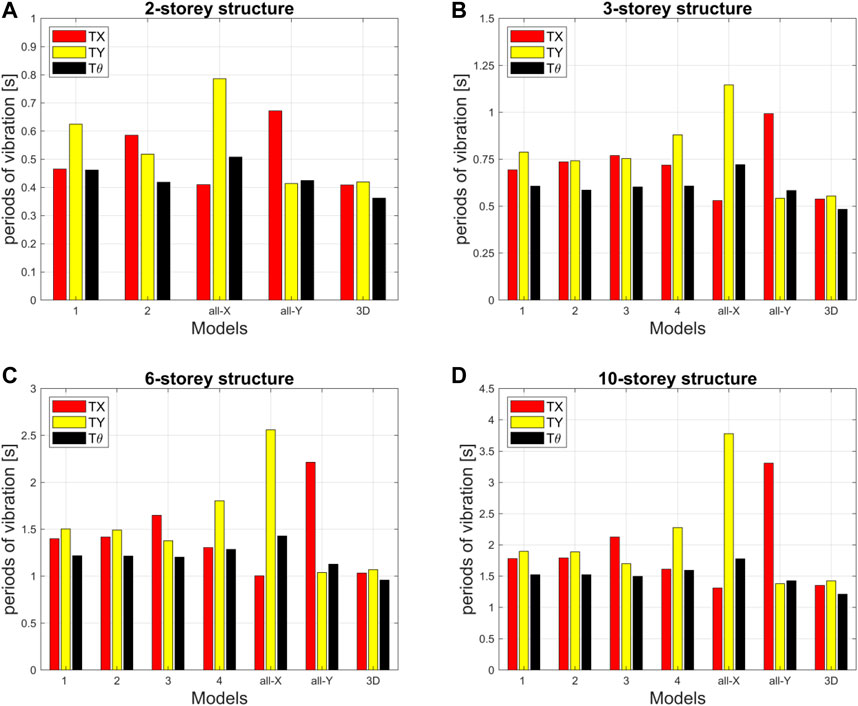
FIGURE 3. Periods of vibration for the considered models.
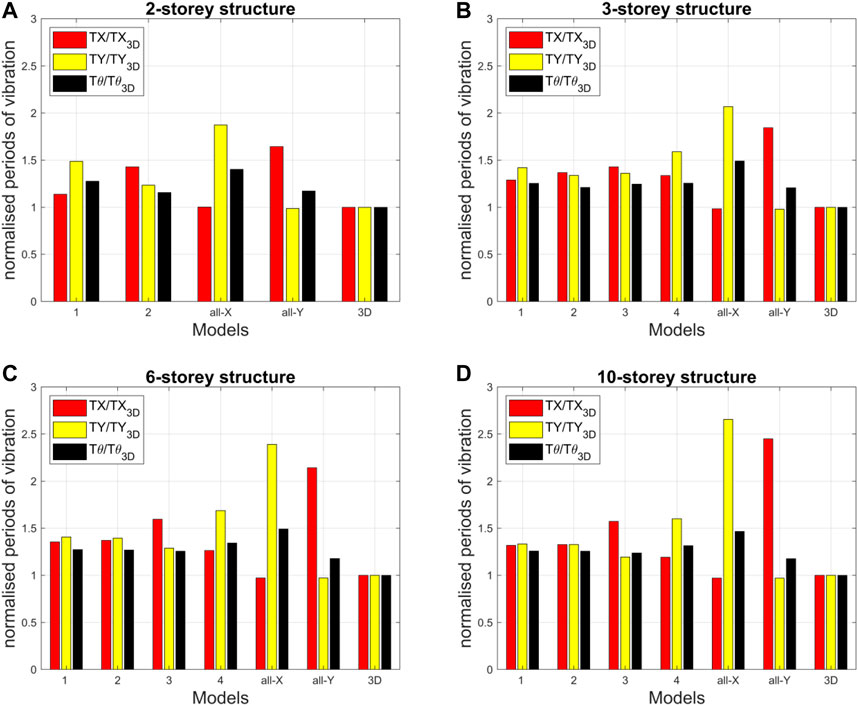
FIGURE 4. Normalised values of the periods of vibration for the considered models.
Regarding the rotational period, in general, it does not change much among the various models of the same structure. The maximum percentage increases with respect to the reference values of the 3D models are within +35%, except for the case of the all-X models for the four structures which lead to a +50% increase.
Regarding the longitudinal and transversal periods, the following observations can be made:
• The 3D models are characterized by very low periods along both directions.
• All-X and all-Y models are the stiffest ones along the X- and Y-direction and the least stiff ones along the Y- and X-direction, respectively. In the soft direction, the periods of such models may be slightly smaller than (2-storey structure), around (3-storey structure) or even larger than (6- and 10-storey structures) two times the reference values of the 3D models.
• The behavior of the alternating beams models depends on the total number of storeys.
• For the 2-storey structure, Models 1 and 2 reveal quite different TX and TY values, due to the global absence of 50% of beams in one direction.
• For the 3-storey structure, Models 1 and 4 show quite different TX and TY values, whilst Models 2 and 3 are quite balanced. This might be probably also due to the 3:2 plan aspect ratio of the selected structures.
• For the 6- and 10-storey structures, it is interesting to note that, with increasing total number of storeys, Models 1 and 2 (having alternating beams every single storey) are more balanced in both directions than Models 3 and 4 (having alternating beams every one and two storeys). The fundamental periods of Models 1 and 2 are 30%–40% larger than those of the reference 3D models.
Figure 5 shows the values of the modal participating mass ratios associated to the fundamental periods of vibration along the longitudinal (X), transversal (Y), and rotational (θ) directions for all models of the four reference structures. They are necessary to deeply understand the origin of the total base shear values reported later in RSA Results. It is worth noticing that all modal participating mass ratios for all models of the 6- and 10-storey structures are around 0.7 and very close to each other. In contrast, more dispersion is observed for the 2- and 3-storey structures, with the reference 3D models providing values around 0.8.
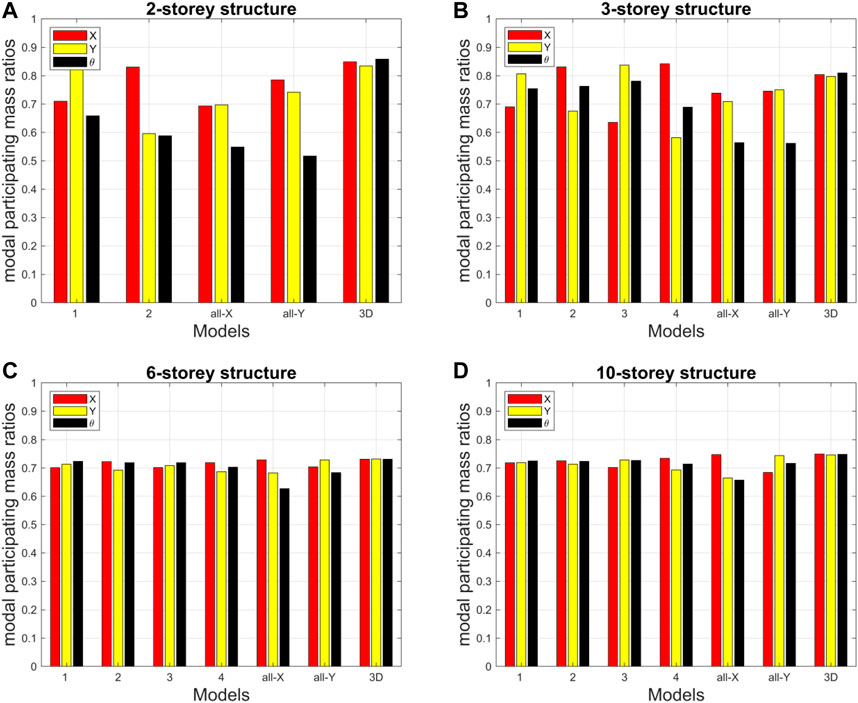
FIGURE 5. Modal participating mass ratios of the fundamental modes of vibration for the considered models.
Finally, Table 4 reports the total dynamic masses activated along the three directions by the first 12 modes, that are considered in the following Response Spectrum Analysis. Overall, the total dynamic mass percentage is around the 85% value prescribed by NTC 2018, and even larger, with few exceptions. It is interesting to note that, in general, with increasing total number of storeys, it tends to converge to the same value for the models presenting alternating beams, whilst it decreases for the reference 3D model. As a result of this trend, all models of the 10-storey structure are characterised by roughly the same total effective mass, indicating a kind of regularisation of the dynamic behaviour for high-rise buildings. This is also consistent with the similar values (all around 0.7) of the first three modal participating mass ratios reported in Figure 5.
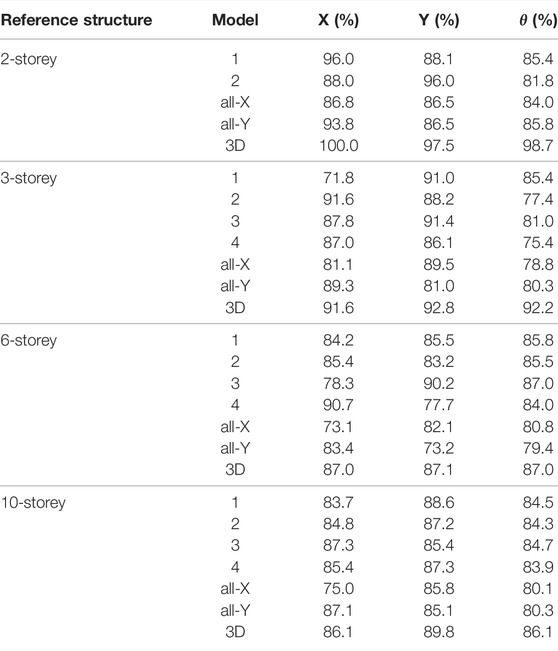
TABLE 4. Sum of the effective modal masses for the 12 modes taken into account.
Seismic performances are discussed with reference to the “rare” earthquake design level corresponding to a 10% probability of exceedance during the reference period, for which the seismic codes usually recommend the “life-safety” performance level (Bertero and Bertero, 2002). This falls within the so-called Ultimate Limit State (ULS) verifications, which are always mandatory as per NTC 2018.
Response Spectrum Analyses (RSA-X and RSA-Y) have been carried out separately along the X- and Y-directions for all models of the four reference structures, using as seismic input the design spectrum described hereafter. Separate analyses are justified by the symmetric configuration of the case-study buildings and by the choice of neglecting the accidental eccentricity, that avoid coupled effects due to rotation. No vertical component of the earthquake action has been considered. 12 modes are considered activating roughly 85% of total dynamic masses for all considered models, as per the results of Table 4. Complete Quadratic Combination (CQC) rule is adopted for combination of the modal effects. Provided that the aim is to focus on the differences of the seismic response of the considered models, the RSA results are presented without combining them with the effects of the vertical static loads.
The site of Bologna (Italy) and a reference period for the seismic action (i.e., nominal lifetime of the building multiplied by usage/importance coefficient) equal to 100 years have been assumed. In particular, the following seismic parameters have been considered to obtain the elastic spectrum of the horizontal component according to the Italian Code (NTC 2018): peak ground acceleration at bedrock corresponding to a 10% probability of exceedance in the reference period ag = 0.21 g, soil type C, topographic category T1, soil amplification factor S = 1.40, Tc* = 0.315 s, plateau amplification factor F0 = 2.393. Peak ground acceleration at surface level acting at the base of each structure was consequently equal to ag S = 0.293 g. Damping ratio was set equal to 5%. The so-called ULS design spectrum has been then derived assuming a behavior factor equal to q = 2 for all the considered models (plausible for existing RC buildings characterized by poor ductility capacities due to non-seismic construction details, according to §C8.5.5.2 of Circolare n. 7 by C.S.LL.PP. Consiglio Superiore dei Lavori Pubblici, 2019). This choice is explained as follows. Regularity in elevation might be not fully preserved for the models presenting alternative beams distributions. Such models could be theoretically characterized by a smaller behaviour factor with respect to the reference 3D models, but also not. As a matter of fact, it might highly depend on the total number of storeys and the specific cross-sections adopted; with increasing total number of storeys, relative differences in lateral stiffness and irregularity seem to reduce for models with beams alternating every storey (see also the results at the end of Modal Analysis). There are no studies available on this issue, which is also beyond the objective of this work. Therefore, for the sake of a fair comparison, the same behaviour factor value is taken for all models. The elastic and ULS design spectra are displayed in Figure 6.
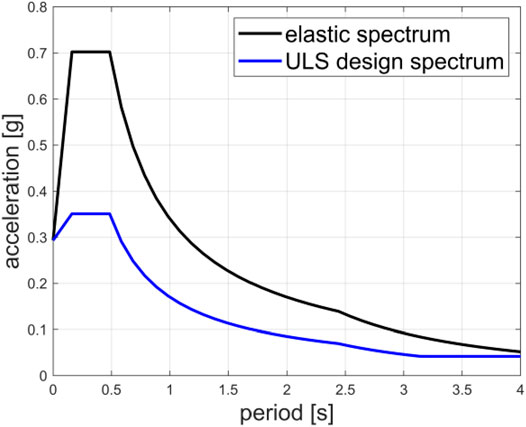
FIGURE 6. Response spectra.
Figure 7 reports the total base shear along the X-direction obtained by RSA-X (Vtot, base,X) and the total base shear along the Y-direction obtained by RSA-Y (Vtot, base,Y), for all models of the four structures.
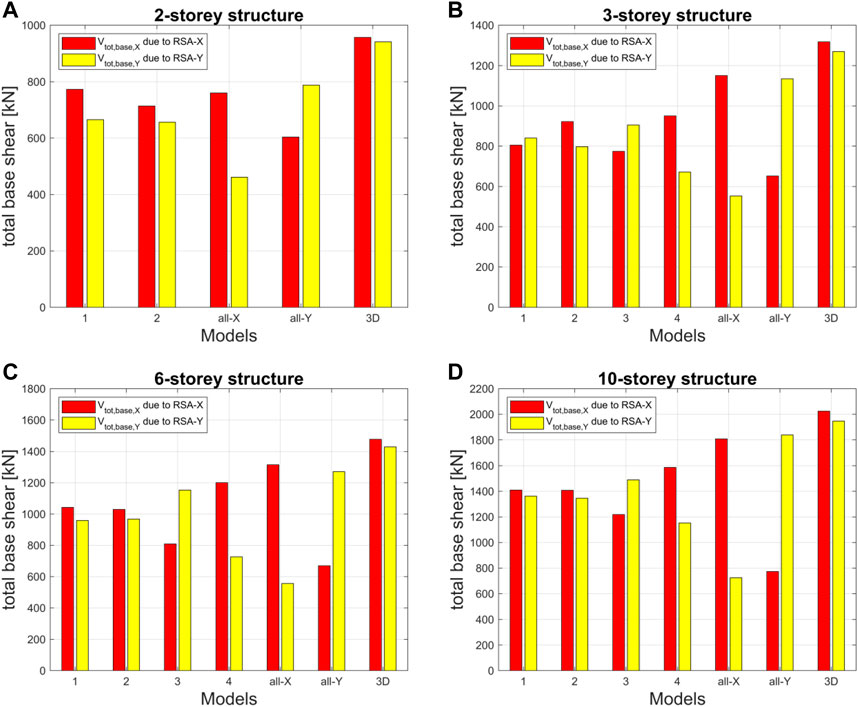
FIGURE 7. Total base shear for all models of the four structures: RSA-X vs. RSA-Y.
In general, from a qualitative point of view, since most periods are well beyond the plateau region of the design spectrum (limited by TC = 0.5 s), the lower the fundamental period along one direction, the higher the total base shear along the same direction, and vice versa. When comparing the total base shear along the X-direction with that along the Y-direction, in general the rule “lower period—higher total base shear” leads to a switch between the two directions, regarding the maximum values of the periods and the total base shear. The larger the total number of storeys, the more this expected trend is confirmed. However, there are few exceptions: Model 2 of the 2-storey structure and Model 1 of the 3-storey structure. For instance, Model 2 of the 2-storey structure shows its highest period along the X-direction, but also its highest total base shear along the same X-direction. This is justified by the large difference in the modal participating mass ratios of the first mode along X (83%) and of the first mode along Y (59%) and by the fact that the fundamental period values are approaching the plateau region of the spectrum (so that, in the modal combination, higher modes effects are likely to be associated to the same plateau spectral acceleration).
The following quantitative comparisons can then be made:
• For the all-X models, Vtot, base,X is larger than Vtot, base,Y, ranging from +65% (2-storey structure) to +150% (10-storey structure).
• For the all-Y models, Vtot, base,Y is larger than Vtot, base,X, ranging from +30% (2-storey structure) to +140% (10-storey structure).
• For the 3D models, the maximum difference between Vtot, base,X and Vtot, base,Y is within 4%, meaning that they are well balanced with respect to the seismic input direction.
• Models 1 and 2 (with beams alternating each storey) are also quite balanced, since the difference between Vtot, base,X and Vtot, base,Y is within 15% for the 2- and 3-storey structures, within 10% for the 6-storey structure and within 5% for the 10-storey structure. This trend clearly indicates that the higher the total number of storeys, the smaller the difference between the total base shear values along the two directions.
• Finally, Models 1 and 2 provide total base shear values that are, on average (considering both directions and the four reference structures), 30% smaller than those provided by the 3D models.
This last observation indicates that the models with beams alternating every storey provide interesting advantages in terms of reduced total base shear (i.e., they do not behave “that badly”, quite the contrary) with respect to the complete three-dimensional frame.
The top-storey longitudinal (δX) and transversal (δY) displacements are reported in Figure 8 for all models of the four reference structures. δX are obtained by RSA-X; δY are obtained by RSA-Y.
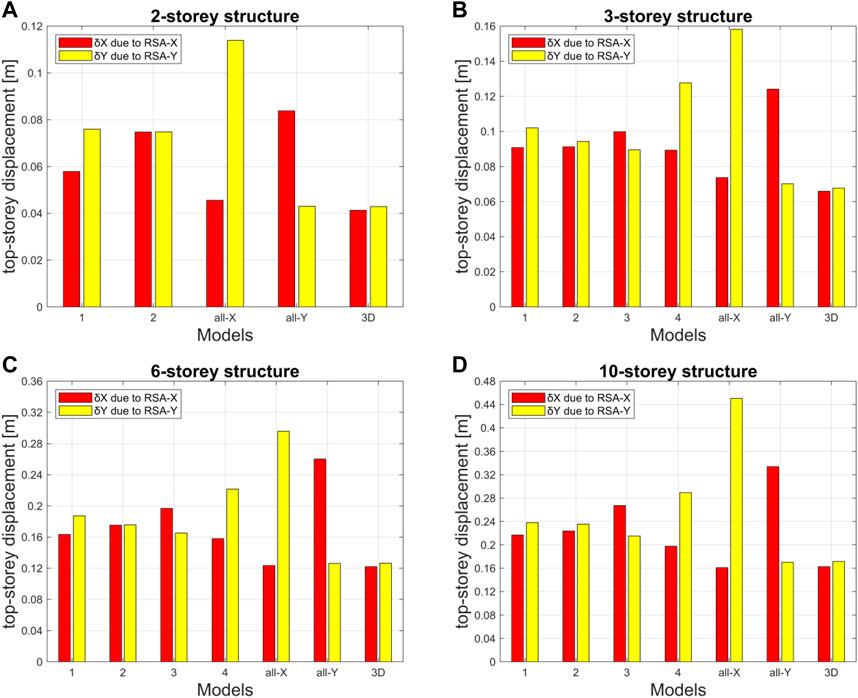
FIGURE 8. Top-storey displacement for all models of the four structures: RSA-X vs. RSA-Y.
Overall, for the 3D models, the displacements in the Y-direction are slightly larger than the ones in the X-direction. This result is consistent with the 3:2 aspect ratio of the rectangular plan-view assumed for all structures. The smallest displacements are displayed by the 3D models and by the all-X models in the X-direction and by the all-Y model in the Y-direction. Models 1 and 2 (alternating beams every single storey) show displacement values higher (up to around +75% for the 2-storey structure and around +50% for the other structures) than the ones of the reference 3D models. Models 3 and 4 show displacement values higher (up around +80%) than the ones of the reference 3D models. The all-X and all-Y models show values along their soft Y- and X-directions which are +110% and +135% of the ones of the 3D models, respectively.
A reference (internal) column B2 has then been selected in the 6-storey structure for comparison of local element forces. It is displayed in Figure 9.
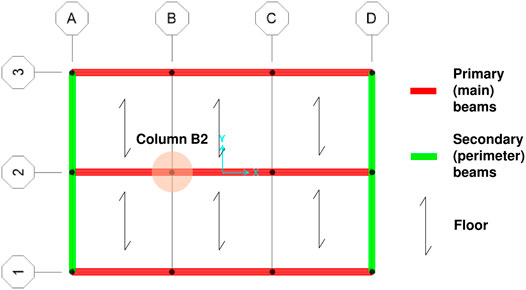
FIGURE 9. Location of the reference column B2 (odd-storey plan view of Model 1 of the 6-storey structure).
The shear forces (VX and VY) and bending moments (MX and MY) at the base of column B2 for all models of the 6-storey structure, for both RSA-X and RSA-Y cases, are reported in Figure 10. VX and MX are obtained by RSA-X; VY and MY are obtained by RSA-Y.
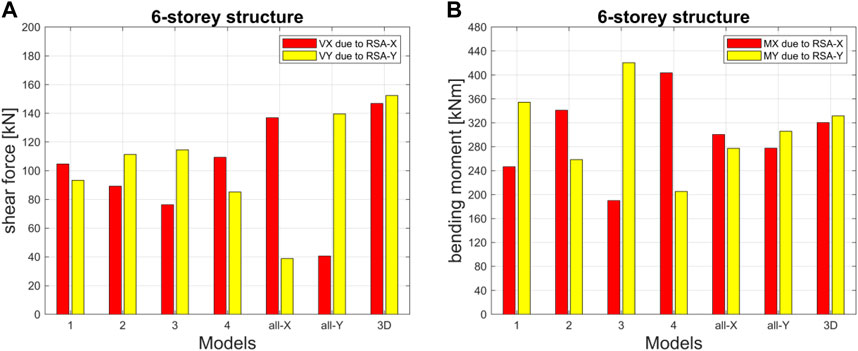
FIGURE 10. Internal forces at the base of the reference column B2 for all models of the 6-storey structure.
Regarding the base shear forces, the following observations can be made:
• Shear forces are higher for the seismic input along the direction characterized by small period of vibration, and vice versa (see VX for the all-X model and VY for the all-Y model, as compared with the periods of Figure 3).
• The 3D model shows the higher shear forces, which are comparable in the two directions.
• For all “mixed” models with alternating beams, intermediate results are obtained, with the rule “lower period-higher shear force” being always confirmed.
• In conclusion, the well-known period effect (the lower the period, the higher the spectral acceleration and thus the seismic forces, and vice versa) has been clearly recognized.
Regarding the base bending moments, the following observations can be made:
• The reference 3D model is balanced along the two directions, meaning that it shows comparable values of MX and MY.
• Overall, the largest differences between all the models and the reference 3D model are within +25% (MY of Model 3) and −38% (MX of Model 3, again).
• In contrast to shear forces results, all-X and all-Y models are balanced in terms of bending moments; comparable values of MX and MY are obtained. The reason is explained as follows. For the all-X model, the VY is low due to a high value of the period TY because of the absence of Y-oriented beams, so that no “full” stiff frame behavior is obtained along the Y-direction. However, the same absence of Y-oriented beams at each storey triggers off a static scheme in which each column works with an effective height which is far larger than the inter-storey height. Specifically, in the all-X model a cantilever scheme over the full height of the structure is activated for the columns in the Y-direction. This effect is hereafter referred to as static scheme effect.
• For the alternating beam models (Models 1 and 2), the static scheme effect (in this case: column elements working flexurally with effective height equal to double interstorey height, see Figure 11) is larger than the period effect, leading to higher bending moment for lower shear forces and vice versa.
• For Models 3 and 4, the period effect and the static scheme effect work both the same way; their combination leading to enhanced behavior discrepancies between the two directions.
• In conclusion, a static scheme effect is thus clearly recognized by comparing shear forces and bending moments. It can either counteract or boost the period effect, and consequently either attenuate or enhance the differences between the two directions, depending on the specific beams distribution.
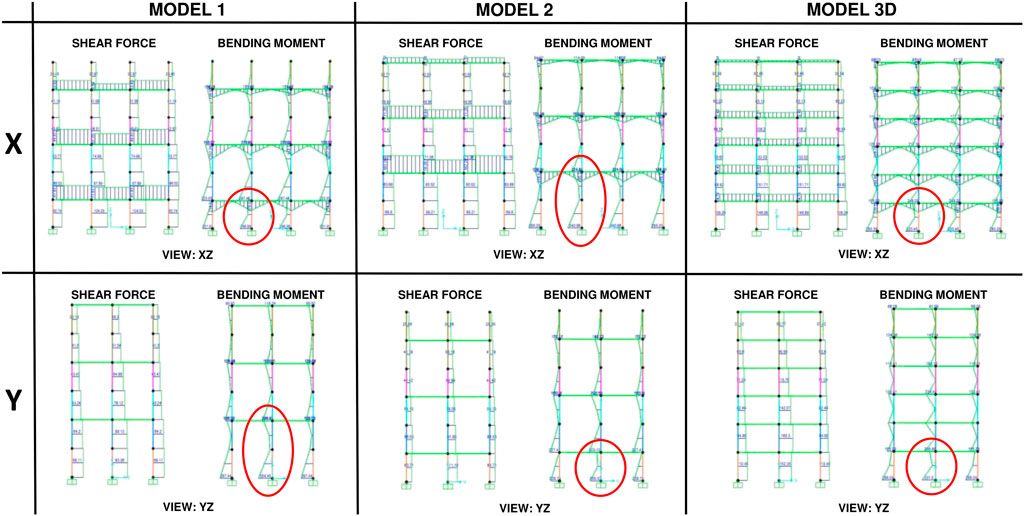
FIGURE 11. Shear force and bending moment diagrams for Models 1, 2 and 3D of the 6-storey structure and graphical interpretation of the static scheme effect.
Shear forces along the X-direction, bending moments along the X-direction and interstorey drifts along both X- and Y-directions at each storey of the reference column B2 are compared for the 6-storey structure and shown in Figure 12.
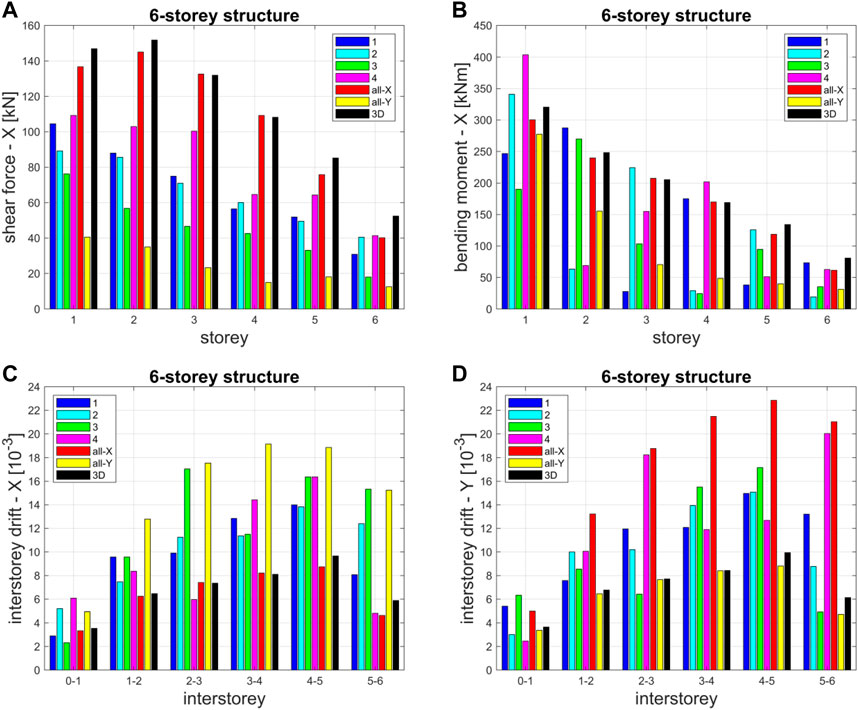
FIGURE 12. Internal forces (VX and MX in the X-direction) and interstorey drifts (in both X- and Y-directions), at each storey, for the reference column B2 for all models of the 6-storey structure.
On one hand, as expected, seismic shear forces regularly (except for some cases at the base level) decrease with increasing number of storeys for all considered models, with the 3D model always providing the highest shear force value at each storey.
On the other hand, regarding the bending moments, period effect and static scheme effect determine strange results combinations. First, even if, overall, seismic bending moments still decrease with increasing number of storeys, the highest bending moment values at each storey are given by different models depending on the considered floor. Second, for the here considered X-direction, while the all-X model tends, of course, to exhibit large bending moments (similar to those of the 3D model and larger than those of the all-Y model), the bending moment distributions of Models 1, 2, 3, and 4 suffer from stronger disturbances at the first and intermediate storeys with respect to the more regular shear forces distributions. The final result is that the 3D, all-X and all-Y models show an almost constant increase of the storey bending moment from the top to the bottom, whilst the alternating beams models are characterised by a scattered trend depending on the specific combination of the two aforementioned effects. However, it is worth pointing out that, even if the beneficial period effect is somehow compensated by the disadvantageous static scheme effect, Models 1 and 2 still show comparable values of bending moment with respect to the 3D model.
Regarding the interstorey drifts along the X-direction, the all-X and the 3D models provide the smallest values, whilst the all-Y model provides the largest values. Models 3 and 4 provide dispersed values depending on the storeys. It is interesting to discuss the variation of the interstorey drifts of Model 1 (with alternating beams every storey) along the height of the building: the first interstorey drift is even smaller (−15%) than the reference one of the 3D model (which in turn is similar to that of the all-X model); the second, the third, the fourth and the fifth interstorey drifts are quite larger (around +50%) than those of the 3D model; the sixth (upper) interstorey drift is affected by the top-storey cantilever static scheme.
Regarding the interstorey drifts along the Y-direction, similar considerations can be made by switching the X-direction with the Y-direction, and Model 1 with Model 2.
Two sets of linear dynamic Time-History Analysis (THA-X and THA-Y) have been carried out separately along the X- and Y-directions for all models of the four reference structures, using as seismic input the seven accelerograms described hereafter. The specific objective of this section is twofold: (i) to compare the RSA and THA results for the validation of the CQC modal superposition rule in the case of unusual beams layout, (ii) to obtain and compare acceleration time-histories.
Again, no vertical component of the earthquake action has been considered. Provided that the aim is to focus on the differences of the seismic response of the considered models, the THA results are presented without combining them with the effects of the vertical static loads.
For the sake of conciseness, only the results of the 6-storey structure are presented hereafter. However, similar results have been obtained for the other reference structures.
Seven artificial accelerograms have been generated using the earthquake generator software SIMQKE-1 (Vanmarcke and Gasparini, 1976; Vanmarcke et al., 1990) in order to be consistent with the elastic spectrum of Figure 6. These acceleration time-histories and their spectra are detailed in Figure 13.
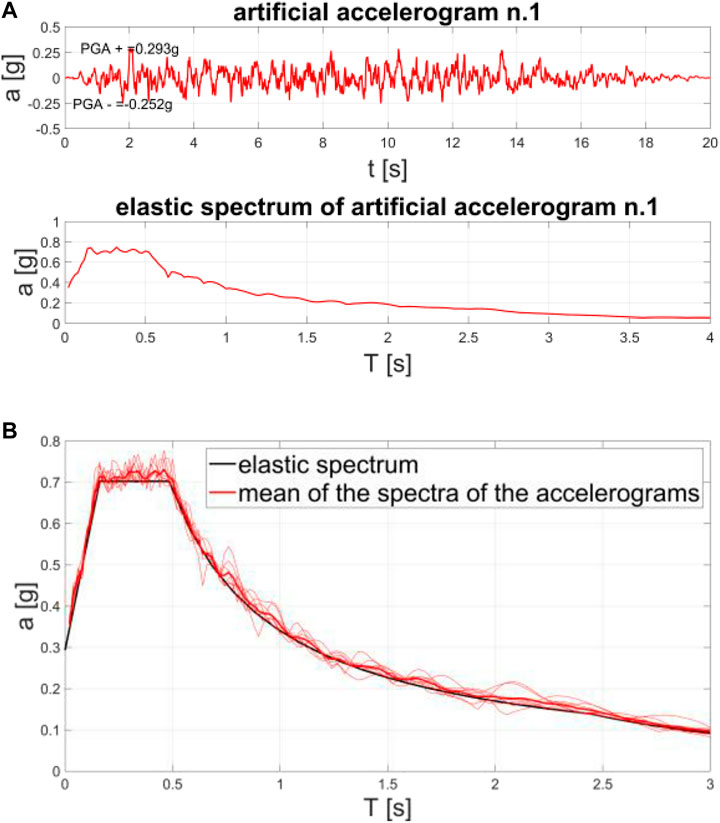
FIGURE 13. (A) Illustrative example of one of the seven artificial accelerograms with its corresponding response spectrum. (B) Spectral compatibility of the seven response spectra with the elastic spectrum.
In the following section, the THA results are presented in terms of mean value of the seven peak absolute values of each investigated response parameter (shear force, bending moment, top-storey displacement, etc.) obtained for each one of the seven artificial earthquakes. To account for ductility resources in linear time-history analyses and to allow for a fair comparison with the RSA results, the internal force values, such as shear forces and bending moments, obtained by THA are divided by the assumed behavior factor (q = 2), whilst the displacement and acceleration values obtained by RSA are multiplied by the assumed behavior factor (q = 2).
The results obtained by response spectrum and linear time history analyses are compared for all models of the 6-storey structure in terms of total base shear and other local response parameters for the reference column B2 (Figure 14). For this purpose, only the X-direction is considered, allowing for the RSA-X vs. THA-X comparison.
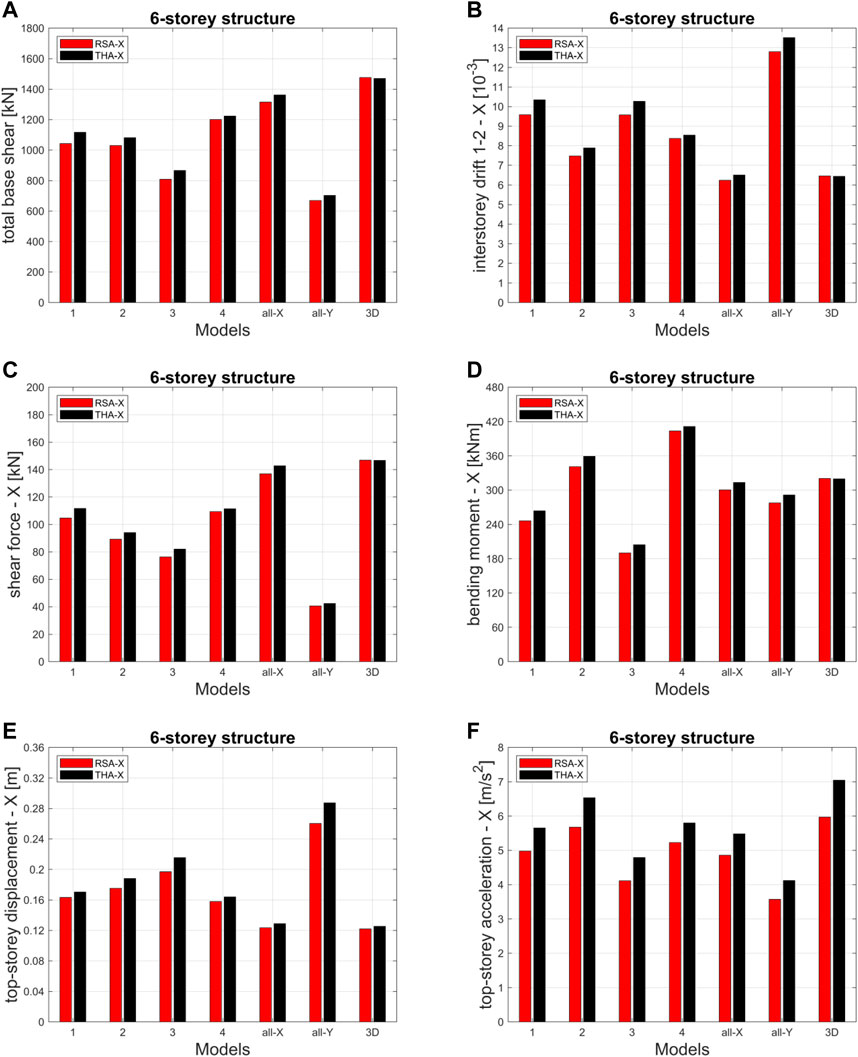
FIGURE 14. Total base shear and various response parameters for the reference column B2 for all models of the 6-storey structure: RSA-X vs. THA-X.
It can be immediately noticed that the THA-X provides results very similar to those obtained by the RSA-X, and, more precisely, slightly larger than them. The following specific observations can also be made.
Regarding the total base shear, the interstorey drift between the first and second floors, the shear force and the bending moment at the base of the reference column:
• The THA-X results of Models 1 and 3 are slightly larger than the corresponding RSA-X results of about 7%–8% for the above-mentioned response parameters.
• The THA-X results of Models 2, all-X and all-Y are slightly larger than the corresponding RSA-X results of about 4%–5% for the above-mentioned response parameters.
• The THA-X results of Model 4 are slightly larger than the corresponding RSA-X of about 2% for the above-mentioned response parameters.
• For the 3D Model, the THA-X values are substiantially equal to the RSA-X values.
Regarding the top-storey displacement of the reference column:
• The differences between RSA-X and THA-X results are slighlty larger than the ones observed for the other response parameters, reaching values of about 10% for Models 3 and all-Y.
• For the 3D model, the THA-X value is 3% larger than the RSA-X value.
Regarding the top-storey acceleration of the reference column:
• The highest top-storey accelerations are provided by the 3D model. Model 1 provides acceleration values similar to those of the all-X model.
• The differences between RSA-X and THA-X results are larger than the ones observed for the other response parameters, reaching values of about 15% for all models.
• The largest difference is observed for the 3D model, where the THA-X value is 18% larger than the RSA-X value.
Eventually, Figures 15A,B show the floor accelerations in both X- and Y-directions obtained from time history analysis for all models of the 6-storey structure. The following observations can be made:
• In general, all models experience low accelerations at the bottom floors and high accelerations at the top floors.
• The 3D model displays very high acceleration values at all storeys. Moreover, it provides the highest top-storey acceleration values in both directions.
• Models 1 and 2 display acceleration values similar to, and often smaller than, those of the 3D model at all storeys.
• Models 3 and 4 display high acceleration values at floors where there are beams (namely, storeys 2, 3, 5, and 6 for Model 4 along the X-direction; and storeys 2, 3, 5, and 6 for Model 3 along the Y-direction).
• The all-X and all-Y models provide quite high acceleration values only at the 5th and 6th storeys, along the X- and Y-direction, respectively.
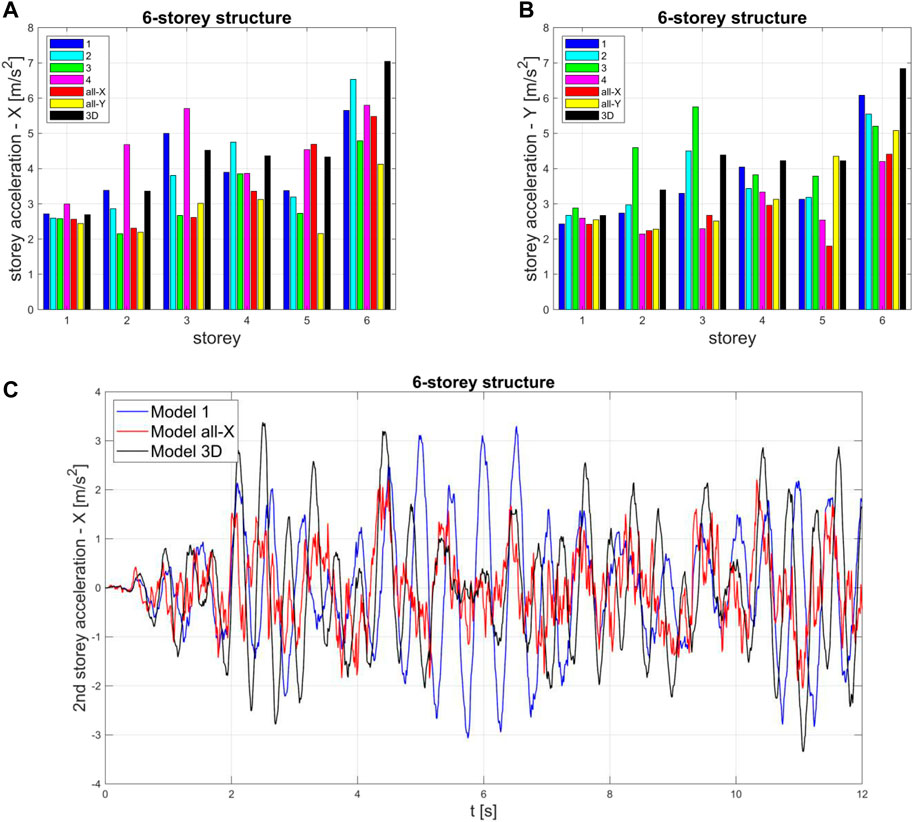
FIGURE 15. Storey accelerations for all models of the 6-storey structure: (A) peak values along the X-direction; (B) peak values along the Y-direction; (C) illustrative acceleration time-histories of Models 1, all-X and 3D for the 6-storey structure as subjected to the artificial accelerogram n. 1.
As illustrative example, Figure 15C reports the plots of the first 12 s of the 2nd storey acceleration time-history responses of Models 1, all-X and 3D of the 6-storey structure as subjected to the artificial accelerogram n. 1. A smoother response can be appreciated for Model 1 with respect to the more scattered ones of the all-X and 3D Models, due to the higher flexibility of Model 1. As already mentioned here above, the peak values of the Models 1 and 3D are close to each other.
The dynamic properties and seismic performances offered by RC spatial frame structures characterized by different beams distributions have been compared in this paper. In this theoretical study, linear analyses have been developed and several simplifying assumptions are adopted to allow for a first clear understanding of the fundamental differences induced by the various beams distributions, that would have been otherwise mixed up and/or hidden by consideration of several additional parameters necessary for refined modelling.
The results allow the following general observations to be made:
• 3D models exhibit affordable values of all response parameters and balanced behavior along both principal directions. However, total base shear and top-storey acceleration may reach high values.
• All-X and all-Y models show a good behavior (comparable to that of the reference 3D model) in their stiff direction along which the beams are positioned, whilst they lead to large displacements and interstorey drifts in their soft direction.
• Models having alternating beams every single storey behave in a relatively balanced way for all reference structures, but especially for the 6- and the 10-storey structures.
• Models having alternating beams every one and two storeys show almost unpredictable responses, that have to be considered on a case-by-case basis.
In conclusion:
• Two fundamental effects may be clearly recognized acting on the seismic response parameters: the period effect and the static scheme effect. The former acting basically on the base shear; the latter acting mainly on the base bending moment.
• For medium-rise buildings (e.g., 6-storey), the models characterised by beams alternating every single storey are characterised by uniform behaviour along the two directions and are not necessarily to be avoided a priori. Due to higher flexibility (balanced fundamental periods along the two directions which are 30%–40% larger than those of the reference 3D models), they lead to total base shear values that are roughly 30% smaller than those provided by the 3D model. Despite their unfavourable static scheme effect, they still show comparable values of bending moment with respect to the 3D model. Displacements and interstorey drifts are increased by about 50%, but accelerations are similar to, and often smaller than, those of the 3D model at all storeys.
This study has been conducted with a twofold objective: (i) to provide useful information for the seismic vulnerability assessment of existing buildings that can be sometimes characterised by unusual beams distributions, and (ii) to provide an original solution (model with primary beams alternating every single storey) to obtain a flexible, but overall balanced and almost feasible, frame structure for new medium-rise buildings to be designed, especially when fluid viscous dampers are envisaged and some structural flexibility could be helpful to enhance their mitigation of the seismic effects.
It is worth to end on a cautionary note: when seismic non-linear response of the specific structure at hand is expected, transposition of this idea into actual design should necessarily accounts for non-linear analyses including the specific features of the frame building and other aspects that were neglected on purpose in this first study, such as possible cracking of concrete, torsional response due to accidental eccentricity, higher modes effects, infill panels effects, etc.
The raw data supporting the conclusion of this article will be made available by the authors, without undue reservation.
All authors listed have made a substantial, direct, and intellectual contribution to the work and approved it for publication. SS: Conceptualization, Methodology, Software, Validation, Investigation, Visualization, Writing—review and editing, Supervision. RA: Software, Data curation, Writing—original draft, Visualization. EM: Software, Data curation, Writing—original draft.
The authors declare that the research was conducted in the absence of any commercial or financial relationships that could be construed as a potential conflict of interest.
All claims expressed in this article are solely those of the authors and do not necessarily represent those of their affiliated organizations, or those of the publisher, the editors and the reviewers. Any product that may be evaluated in this article, or claim that may be made by its manufacturer, is not guaranteed or endorsed by the publisher.
Álvarez, K. A., Medina, M. F., Morales, C. A., and Moreno, J. D. (2020). “Influence of Structural Cracking in the Seismic Response of Irregular Buildings,” in IOP Conference Series: Materials Science and Engineering, Volume 910, 3rd International Conference on Civil Engineering and Architecture (Compiègne, France: ICCEA) 28–30. https://iopscience.iop.org/article/10.1088/1757-899X/910/1/012009/pdf.
Bachmann, H. (2003). Seismic Conceptual Design of Buildings – Basic Pronicples for Engineers, Architects, Building Owners, and Authorties. Biel, bern, Switzerland: Swiss Federal Office for Water and Geology, BWG. https://www.bafu.admin.ch/dam/bafu/en/dokumente/erdbeben/uw-umwelt-wissen/erdbebengerechterentwurfvonhochbauten.pdf.download.pdf/seismic_conceptualdesignofbuildings.pdf.
Bertero, R. D., and Bertero, V. V. (2002). Performance-based Seismic Engineering: the Need for a Reliable Conceptual Comprehensive Approach. Earthquake Engng. Struct. Dyn. 31, 627–652. doi:10.1002/eqe.146
Bonacci, J., and Pantazoupoulou, S. (1993). Parametric Investigation of Joint Mechanics. Struct. J. 90 (1), 61–71.
Bosco, M., Ghersi, A., Ghersi, A., and Marino, E. M. (2009). On the Evaluation of Seismic Response of Structures by Nonlinear Static Methods. Earthquake Engng Struct. Dyn. 38, 1465–1482. doi:10.1002/eqe.911
Cacace, F., Zuccaro, G., De Gregorio, D., and Perelli, F. L. (2018). Building Inventory at National Scale by Evaluation of Seismic Vulnerability Classes Distribution Based on Census Data Analysis: BINC Procedure. Int. J. Disaster Risk Reduction 28 (6), 384–393. doi:10.1016/j.ijdrr.2018.03.016
Calvi, G. M., Magenes, G., and Pampanin, S. (2002). Relevance of Beam-Column Joint Damage and Collapse in RC Frame Assessment. J. Earthquake Eng. 6 (S1), 75–100. doi:10.1080/13632460209350433
Castellani, A., and Faccioli, E. (2008). Costruzioni in Zona Sismica. Milano, Italy: Ulrico Hoepli Editore.
CEN, Comité Européen de Normalisation (2004). Eurocode 8: Design of Structures for Earthquake Resistance – Part 1: General Rules, Seismic Actions and Rules for Buildings. Brussels, Belgium: European Committee for Standardization, Management Centre: rue de Stassart. EN 1998-1.
CSI, Computers and Structures Inc (2021). SAP2000 Ultimate. Version 23.1.0. Structural Analysis Program. Walnut Creek, CA 94596, USA: CSI, Structural and Earthquake Engineering Software. https://www.csiamerica.com/products/sap2000.
C.S.LL.PP. Consiglio Superiore dei Lavori Pubblici (2019). Circolare n. 7 del 21/01/2019: Istruzioni per l'applicazione dell'«Aggiornamento delle "Norme tecniche per le costruzioni"» di cui al decreto ministeriale 17 gennaio 2018. GU n.35 del 11-2-2019 - Supplemento. Ordinario n. 5. Roma, Italy: Ufficio Pubblicazione Leggi e Decreti - Via Arenula.
De Stefano, M., and Pintucchi, B. (2008). A Review of Research on Seismic Behaviour of Irregular Building Structures since 2002. Bull. Earthquake Eng. 6 (2), 285–308. doi:10.1007/s10518-007-9052-3
Fajfar, P., Marusic, D., and Perus, I. (2005). Torsional Effects in the Pushover-Based Seismic Analysis of Buildings. J. Earthquake Eng. 9 (6), 831–854. doi:10.1080/13632460509350568
Ferraioli, M. (2015). Case Study of Seismic Performance Assessment of Irregular RC Buildings: Hospital Structure of Avezzano (L'Aquila, Italy). Earthq. Eng. Eng. Vib. 14 (1), 141–156. doi:10.1007/s11803-015-0012-7
Ferraioli, M. (2019). Dynamic Increase Factor for Nonlinear Static Analysis of RC Frame Buildings against Progressive Collapse. Int. J. Civ Eng. 17, 281–303. doi:10.1007/s40999-017-0253-0
Ghersi, A., and Lenza, P. (2009). Edifici antisismici in cermento armato progettati secondo le istruzioni delle nuove normative. Palermo, Italy: Dario Flaccovio Editore. ISBN: 978-88-7758-879-1.
Ghersi, A., Marino, E. M., and Rossi, P. P. (2007). Static versus Modal Analysis: Influence on Inelastic Response of Multi-Storey Asymmetric Buildings. Bull. Earthquake Eng. 5 (4), 511–532. doi:10.1007/s10518-007-9046-1
Giangreco, E. (2002). Ingegneria Delle Strutture. Volume Primo: Basi Della Progettazione. Torino, Italy: UTET. http://dati-censimentopopolazione.istat.it.
Kreslin, M., and Fajfar, P. (2010). Seismic Evaluation of an Existing Complex RC Building. Bull. Earthquake Eng. 8 (2), 363–385. doi:10.1007/s10518-009-9155-0
Liberatore, L., Noto, F., Mollaioli, F., and Franchin, P. (2018). In-plane Response of Masonry Infill walls: Comprehensive Experimentally-Based Equivalent Strut Model for Deterministic and Probabilistic Analysis. Eng. Structures 167, 533–548. doi:10.1016/j.engstruct.2018.04.057
López, C., and Music, J. (2016). Period and Displacement Analysis of Reinforced concrete Buildings with Different Degrees of Stiffness in Their Resistance Elements. Works and Projects 9, 33–47. doi:10.4067/S0718-28132016000100003
Maniatakis, C. A., Psycharis, I. N., and Spyrakos, C. C. (2013). Effect of Higher Modes on the Seismic Response and Design of Moment-Resisting RC Frame Structures. Eng. Structures 56, 417–430. doi:10.1016/j.engstruct.2013.05.021
Masi, A., Santarsiero, G., Verderame, G. M., Russo, G., Martinelli, E., Pauletta, M., et al. (2009). in Capacity Models of Beam-Column Joints: Provisions of European and Italian Seismic Codes and Possible improvementsEurocode 8 Perspectives from the Italian Standpoint Workshop. Editor E. Cosenza (Napoli, Italy: Doppiavoce), 145–158.
Masi, A. (2003). Seismic Vulnerability Assessment of Gravity Load Designed R/C Frames. Bull. Earthq. Eng. 1, 371–395. doi:10.1023/B:BEEE.0000021426.31223.60
Masi, A., and Vona, M. (2012). Vulnerability Assessment of Gravity-Load Designed RC Buildings: Evaluation of Seismic Capacity through Non-linear Dynamic Analyses. Eng. Structures 45 (12), 257–269. doi:10.1016/j.engstruct.2012.06.043
Mazza, F. (2019). In-plane–out-of-plane Non-linear Model of Masonry Infills in the Seismic Analysis of r.c.-framed Buildings. Earthquake Eng. Struct. Dyn. 48 (4), 432–453. doi:10.1002/eqe.3143
Metelli, G., Messali, F., Beschi, C., and Riva, P. (2015). A Model for Beam-Column Corner Joints of Existing RC Frame Subjected to Cyclic Loading. Eng. Structures 89, 79–92. doi:10.1016/j.engstruct.2015.01.038
Mezzina, M. (2021). Fondamenti di tecnica delle costruzioni. Seconda edizione. Novara, Italy: Città Studi Edizioni.
Mohammad Noh, N., Liberatore, L., Mollaioli, F., and Tesfamariam, S. (2017). Modelling of Masonry Infilled RC Frames Subjected to Cyclic Loads: State of the Art Review and Modelling with OpenSees. Eng. Structures 150, 599–621. doi:10.1016/j.engstruct.2017.07.002
NTC (2018). Decreto Ministeriale del 17/01/2018: Norme Tecniche per le Costruzioni. Roma, Italy: Ministero delle Infrastrutture.
Paulay, T., and Priestley, M. (1992). Seismic Design of Reinforced concrete and Masonry Buildings. San Diego, USA: University of California, John Wiley & Sons, Inc.
Petrini, L., Pinho, R., and Calvi, G. M. (2004). Criteri di Progettazione Antisismica degli Edifici. Pavia, Italy: IUSS Press.
Pozzati, P., and Ceccoli, C. (1977). Teoria e tecnica delle strutture. Volume II: Sistemi di travi. Parte seconda: Applicazioni pratiche. Torino, Italy: UTET.
Priestley, M. J. N. (2003). “Myths and Fallacies in Earthquake Engineering, Revisited,” in The Ninth Mallet-Milne Lecture (Pavia: Rose School: IUSS Press).
Ricci, P., De Luca, F., and Verderame, G. M. (2011). 6th April 2009 L'Aquila Earthquake, Italy: Reinforced concrete Building Performance. Bull. Earthquake Eng. 9 (1), 285–305. doi:10.1007/s10518-010-9204-8
Rossetto, T., Peiris, N., Alarcon, J. E., So, E., Sargeant, S., Free, M., et al. (2011). Field Observations from the Aquila, Italy Earthquake of April 6, 2009. Bull. Earthquake Eng. 9, 11–37. doi:10.1007/s10518-010-9221-7
Silvestri, S., and Trombetti, T. (2007). Physical and Numerical Approaches for the Optimal Insertion of Seismic Viscous Dampers in Shear-type Structures. J. Earthquake Eng. 11 (5), 787–828. doi:10.1080/13632460601034155
Trombetti, T., Landi, L., Silvestri, S., Gasparini, G., and Ricci, I. (2011). “A Case Study of a Building in L’Aquila, Italy for Evaluating the Effects of Masonry Infills on the Seismic Behavior of R.C. Frame Structures,” in Proceedings of the 34th IABSE Symposium on “Large Structures and Infrastructures for Environmentally Constrained and Urbanized Areas”, Venice, September 22–24, 2010 (IABSEAIPC-IVBH).
Vanmarcke, E. H., Cornell, C. A., Gasparini, D. A., and Hou, S. (1990). "SIMQKE-I: Simulation of Earthquake Ground Motions," in The Earthquake Engineering Online Archive, National Information Service for Earthquake Engineering, PEER-NISEE Library. Berkeley, USA: University of California. https://nisee.berkeley.edu/elibrary/getpkg?id=SIMQKE1.
Vanmarcke, E. H., and Gasparini, D. A. (1976). Simulated Earthquake Motions Compatible with Prescribed Response Spectra. Cambridge, MA, USA: Dept. of Civil Engineering, Massachusetts Inst. of Technology. R76-4.
Villaverde, R. (2009). Fundamentals Concepts of Earthquake Engineering. Boca Raton, FL, USA: CRC Press, Taylor & Francis Group, 960.
Keywords: frame buildings, beams, modal analysis, response spectrum analysis, time-history analysis
Citation: Silvestri S, Allahverdiyev R and Marconi E (2022) Influence of Beams Distribution on the Dynamic and Seismic Linear Response of RC Frame Buildings. Front. Built Environ. 8:844804. doi: 10.3389/fbuil.2022.844804
Received: 28 December 2021; Accepted: 07 March 2022;
Published: 13 April 2022.
Edited by:
Fabio Mazza, University of Calabria, ItalyReviewed by:
Massimiliano Ferraioli, University of Campania Luigi Vanvitelli, ItalyCopyright © 2022 Silvestri, Allahverdiyev and Marconi. This is an open-access article distributed under the terms of the Creative Commons Attribution License (CC BY). The use, distribution or reproduction in other forums is permitted, provided the original author(s) and the copyright owner(s) are credited and that the original publication in this journal is cited, in accordance with accepted academic practice. No use, distribution or reproduction is permitted which does not comply with these terms.
*Correspondence: Stefano Silvestri, c3RlZmFuby5zaWx2ZXN0cmlAdW5pYm8uaXQ=
Disclaimer: All claims expressed in this article are solely those of the authors and do not necessarily represent those of their affiliated organizations, or those of the publisher, the editors and the reviewers. Any product that may be evaluated in this article or claim that may be made by its manufacturer is not guaranteed or endorsed by the publisher.
Research integrity at Frontiers
Learn more about the work of our research integrity team to safeguard the quality of each article we publish.