 Suraparb Keawsawasvong
 Sorawit Seehavong
 Chayut Ngamkhanong
95% of researchers rate our articles as excellent or good
Learn more about the work of our research integrity team to safeguard the quality of each article we publish.
Find out more
ORIGINAL RESEARCH article
Front. Built Environ. , 23 February 2022
Sec. Transportation and Transit Systems
Volume 8 - 2022 | https://doi.org/10.3389/fbuil.2022.837745
This article is part of the Research Topic Data Sciences in Transportation and Transit Systems View all 5 articles
An artificial neural network (ANN) model for predicting the stability of rectangular tunnels in rock masses based on the Hoek–Brown (HB) failure criterion is presented in this study. Since the safety assessment of the tunnel stability is one critical issue for civil engineers during the construction, it is very important to develop a reliable and accurate stability analysis of such problems. The finite element limit analysis (FELA) with the HB failure criterion is used to develop the numerical upper and lower bound solutions of the problem of rectangular tunnels in rock masses. A novel machine learning-aided prediction of this problem is then developed based on the datasets of the numerical bound solutions obtained from the FELA. The inputs consist of six dimensionless parameters including the cover-depth ratio of tunnels, the width ratio of tunnels, the normalized uniaxial compressive strength, the geological strength index, the mi parameter, and the degree of disturbance of rock masses. The results show that the optimal ANN models provide very great accuracy in predicting the stability of the rectangular tunnels based on the HB failure criterion. The solutions will provide a prompt assessment of tunnel stability in rock masses for geotechnical engineers during the construction of rock tunnels.
Tunnel safety has been a classic issue for geotechnical engineers during the processes of both construction and operation. It has been challenging to design and construct a large tunnel (e.g., highway tunnel and railway tunnel) especially in the area located on a weak ground. The catastrophic collapses of the tunnel due to the loss of stability and external disturbance have been found around the globe (Chung et al., 1995; Shin et al., 2006; Ngamkhanong et al., 2018; Ngamkhanong and Kaewunruen, 2018; Aygar and Gokceoglu, 2020). Therefore, it is very important to ensure the stability to prevent a collapse inside the tunnel during the construction process. To assess the stability of rock masses during the tunnel construction by an open-face conventional tunneling or a tunneling boring machine, the failure criterion for capturing the collapse of rocks is required to accurately compute the tunnel stability in rocks. The Hoek–Brown (HB) failure criterion is one of the famous criteria for capturing the failure behaviors of rock masses. The first version of this failure criterion was introduced by Hoek and Brown (1980) in the 1980s by employing the curve-fitting of triaxial test data of intact and jointed rocks. Later, in 2002, Hoek et al. (2002) updated the old version by accounting for the effect of highly fractured properties. A brief history and the development of this failure criterion can be found in the study by Hoek (Hoek, 2004; Hoek, 2007).
The HB failure criterion has a complex non-linear expression, where the dependency of shear strength of rock masses on the non-linearity of the minor principal compressive stress was taken into account. The input strength parameters for the HB failure criterion can be obtained from (i) uniaxial compressive tests of rock samples, (ii) mineralogical and geological examinations, (iii) characterization of rock discontinuities, and (iv) the degree of disturbance due to blast damage and stress relaxation. In the past, various works employed the HB failure criterion to investigate the stability of several rock engineering problems such as bearing capacity and shaft resistance of foundations (e.g., Serrano and Olalla, 1998a; Serrano and Olalla, 1998b; Yang and Yin, 2005; Merifield, et al., 2006; Saada et al., 2008; Clausen, 2013; Serrano et al., 2014; Serrano et al., 2015; Serrano et al., 2016; Chakraborty and Kumar, 2015; Keshavarz and Kumar, 2018; Alkhafaji et al., 2020; Wu et al., 2021), stability analysis of rock slopes (You et al., 2000; Yang et al., 2004; Li et al., 2008; Li et al., 2011; Shen et al., 2013; Shen and Karakus, 2014; Dongping et al., 2016), and underground openings and caverns (e.g., Sakurai, 1993; Carranza-Torres and Fairhurst, 1999; Martin and Maybee, 2000; Carranza-Torres, 2004; Swift and Reddish, 2005; Fraldi and Guarracino, 2009; Yang and Huang, 2011; Yang and Huang, 2013; Senent et al., 2013).
To estimate the stability of tunnels in rock masses, the finite element limit analysis (FELA) is one of the efficient techniques which has been commonly used to provide the stability solutions of the tunnels (Sloan, 2013). This technique employs plastic bounding theorems, finite element discretization, and non-linear programming. This technique consists of the associated upper and lower bound theorems (UB and LB) in conjunction with a perfectly plastic material with an associated flow rule. A true stability solution can be obtained by bracketing from UB (above) and LB solutions (below). The FELA with the HB failure criterion (Kumar and Rahaman, 2020) has been used to solve the tunnel stability by following the methods of Ukritchon and Keawsawasvong (2019a), Keawsawasvong and Ukritchon (2020), and Xiao et al. (2021) for a single circular, square, and rectangular tunnel in a rock mass, respectively. The solutions of the stability of a plane strain heading of tunnels were also studied by Ukritchon and Keawsawasvong (2019b). Moreover, the stability of unlined dual circular, square, and horseshoe tunnels in rock masses was also carried out by Zhang et al. (2019), Xiao et al. (2019), and Rahaman and Kumar (2020), respectively. However, these works only proposed the solutions of the tunnel stability in rock masses as tables and design charts which cannot be directly applied for arbitrary values of all considered parameters such as the HB parameters or the tunnel’s geometries without the approximation or the interpolation of the solutions. In addition, the previous study by Xiao et al. (2019) provided some numerical results for the stability of rectangular tunnels in rock masses. However, they did not comprehensively consider the impact of the degree of disturbance of rock masses on their numerical results (only demonstrating some examples). Therefore, a new procedure providing an accurate and reliable calculation of this stability problem should be carried out to accurately obtain the solutions of the stability of tunnels in rock masses by fully considering the effect of the degree of disturbance of rock masses.
Soft computing appeared as an alternative to the common analytic and numeric approaches, especially an artificial neural network (ANN) approach. This approach enables us to learn from a sufficiently dense dataset, and then configure a black-box-type prediction model in order to solve the problems in the form of a closed simple equation. The ANN approach has been used to identify various rock parameters from several empirical tests in the field of rock engineering (e.g., Yang and Zhang, 1997; Mert et al., 2011; Ocak and Seker, 2012; Gholami et al., 2013; Miah et al., 2020; Mohamad Ali Ridho et al., 2021). In addition, the soft computing of the bearing capacity of foundations on rock masses using the ANN approach has also been presented by a few researchers (Ziaee et al., 2015; Alavi and Sadrossadat, 2016; Millán et al., 2021). An extreme learning neural network and terminal steepest descent algorithm were carried out by Li et al. (2016) to predict the stability of rock slopes by adopting the dataset from the FELA with the HB failure criterion. For the application of tunnel stability, Naghadehi et al. (2019) utilized the ANN approach to estimate the face stability of mechanized shield tunneling in cohesive-frictional soils. To the best of the author’s knowledge, there is no previous study of the assessment of the stability of tunnels in Hoek–Brown rock masses using the ANN technique and the FELA solutions. The objective of this study is to develop a convenient tool based on the ANN approach for providing a prompt assessment of the stability of rectangular tunnels in Hoek–Brown rock masses.
The Hoek–Brown (HB) failure criterion is a well-recognized rock failure model accounting for the non-linearity of the minor principal (compressive) stress. The form of a power–law relationship between the major and minor principal stresses (i.e., σ1 and σ3) is the mathematical expression of the HB failure criterion. Taking tensile normal stresses as positive, the HB failure criterion can be expressed as (Hoek et al., 2002)
where σci is the uniaxial compressive strength of intact rock mass, and the parameters mb, s, and a are expressed in Equations 2–4.
In the previous equations, the geological strength index (GSI) has typical values from 10 to 100 (extremely poor rock mass to a perfectly intact rock mass). Also, DF represents the degree of disturbance, and it has typical values from 0 (undisturbed in-situ rock masses) to 1 (extremely disturbed in situ rock masses). Parameter mi is a material constant that is related to the frictional strength of an intact rock mass and has typical values from 5 to 30.
Figure 1 shows the problem definition of 2D unlined rectangular tunnels in a plane strain condition. Due to the assumption of the plane strain condition, the problem represents a very long unlined rectangular tunnel. The tunnels have a width (D), a length (B), and a cover depth (C) above their crown. The parameters of rock masses based on the Hoek–Brown failure criterion consist of GSI, DF, mi, σci, and unit weight, γ. A uniform surcharge pressure (σs) is applied over the rock surface as shown in Figure 1.

FIGURE 1. Problem definition of an unsupported infinitely long rectangular tunnel in a rock mass.
According to the aforementioned parameters, there are eight design parameters in this study (i.e., C, D, B, σci, GSI, DF, mi, and γ). The dimensionless output parameter of this problem is the stability factor denoted by σs/σci. Eq. 5 represents the stability factor as a function of six dimensionless parameters as follows:
where B/D represents the width ratio, C/D represents the cover depth ratio, DF represents the degree of disturbance, GSI represents the geological strength index, mi represents a material constant related to the frictional strength, and γD/σci represents the normalized uniaxial compressive strength.
In this study, a non-linear input–output mapping of the system of tunnels in rock masses is constructed using a neural network trained by an extreme learning algorithm. The training data are the FELA solutions of the tunnel stability factor.
The finite element limit analysis (FELA), which is the computational method based on a perfectly plastic material with an associated flow rule, employs the plastic bound theorems, finite element discretization, and mathematical optimization (Sloan, 2013; Keawsawasvong and Ukritchon, 2017; Ukritchon and Keawsawasvong, 2017; Krishnan et al., 2019; Ukritchon et al., 2019; Ukritchon and Keawsawasvong, 2020a; Ukritchon and Keawsawasvong, 2020b; Ukritchon et al., 2020; Keawsawasvong and Ukritchon, 2021). This FELA technique is carried out to derive the bracket of the true limit load from the targeted upper Bound (UB) and lower Bound (LB) solutions. A new computer software, namely, OptumG2 (OptumCE, 2020), is employed to compute the active collapse pressure (σs) of unlined rectangular tunnels in rock masses. The results will be used as datasets for constructing a machine learning model.
Figures 2A–C show three numerical models of unlined rectangular tunnels in rock masses for the cases of B/D = 0.5, 1, and 2, respectively, where the others are C/D = 2, γD/σci = 0, GSI = 80, DF = 0, and mi = 20. Due to the symmetry of the problem, only half of the domain is used in the modeling. The boundary conditions at the left plane of symmetry and the right plane are set to move only in the vertical direction. The boundary condition at the bottom plane is not allowed to move in both vertical and horizontal directions. The sizes of the domain are chosen to be sufficiently large in order to avoid any error from the problem size on the computed bound solutions. The tunnel is unlined, and there is no pressure applied on the periphery of the tunnel. At the rock surface, the uniform surcharge σs is applied overall the area. This surcharge at the active collapse state will be optimized and used as the output from the LB and UB FELA using OptumG2.
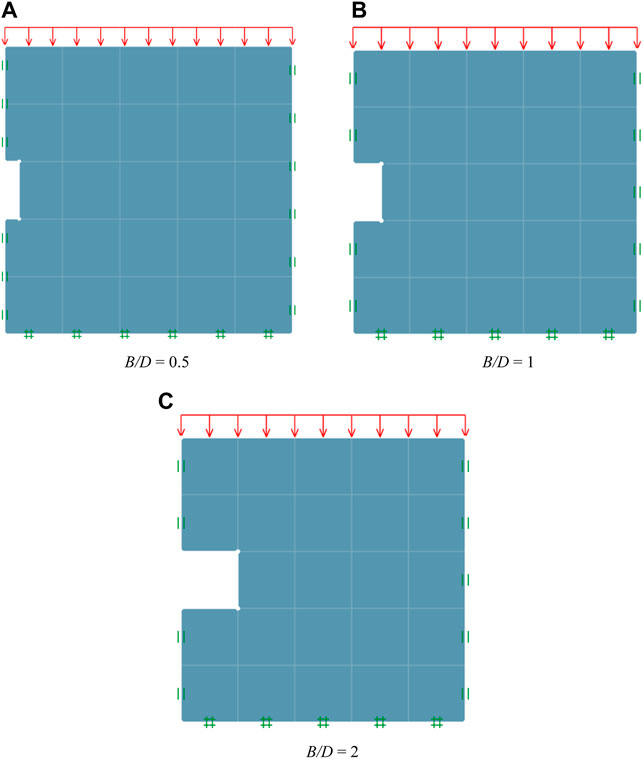
FIGURE 2. Model geometry for three unlined rectangular tunnels in rock mass (C/D = 2, γD/σci = 0, GSI = 80, DF = 0, and mi = 20). (A) B/D = 0.5. (B) B/D = 1. (C) B/D = 2.
The recent adaptivity meshing technique is also employed in this study to improve computational efficiency (e.g., Ciria et al., 2008). Using this adaptivity meshing technique, a number of elements are automatically added in the zones that contain large plastic shear strain. As a result, the differences between UB and LB solutions become smaller after a few iteration steps. The setting of the adaptivity meshing technique in this study is set as an initial mesh of 5,000 elements at the first step and then will be increased to 10,000 elements after three iterations of mesh adaptivity. Examples of typical adaptive meshes can be seen in Figures 3A–C for the cases of B/D = 0.5, 1, and 2, respectively. Examples of absolute velocity contours of an unlined rectangular tunnel in the rock mass are also shown in Figures 4A–C for the cases of B/D = 0.5, 1, and 2, respectively, which depict the associated failure mechanisms of this tunnel stability problem. All results of the tunnel stability obtained from the LB and UB FELA (about 2,160 solutions) will be averaged and then used as the training datasets in the machine learning approach as described later in the next section. The results of the stability index obtained by the FELA will be used in the output layer datasets in order to construct a machine learning model.
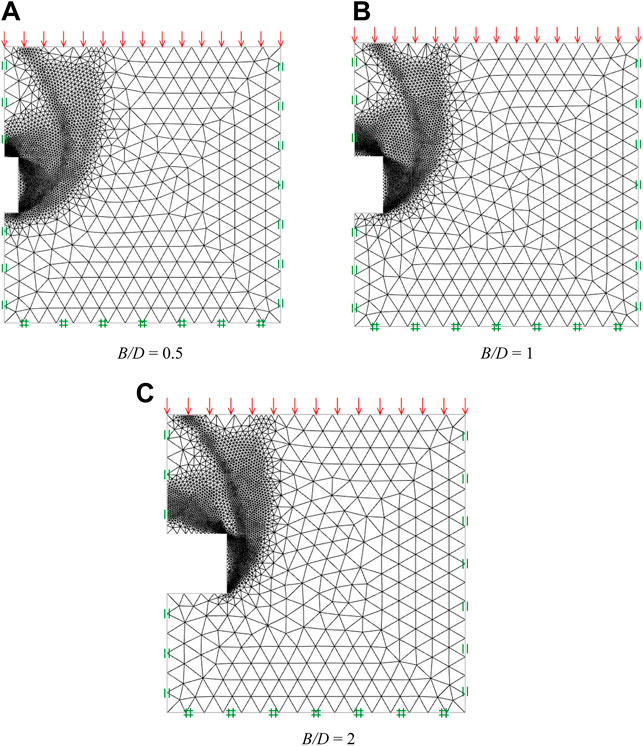
FIGURE 3. Typical adaptive meshes of unlined rectangular tunnels in rock mass (C/D = 2, γD/σci = 0, GSI = 80, DF = 0, and mi = 20). (A) B/D = 0.5. (B) B/D = 1. (C) B/D = 2.
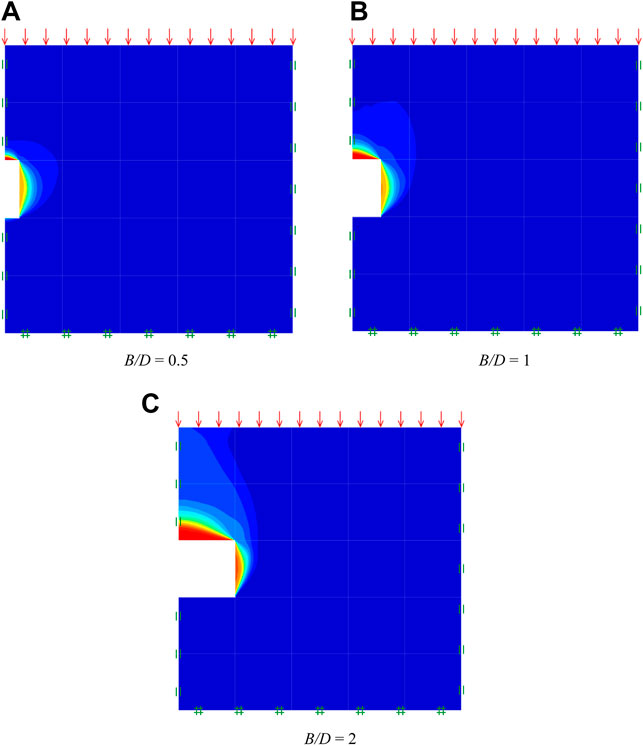
FIGURE 4. Absolute velocity contours of unlined rectangular tunnel in rock mass (C/D = 2, γD/σci = 0, GSI = 80, DF = 0, and mi = 20). (A) B/D = 0.5. (B) B/D = 1. (C) B/D = 2.
Table 1 concludes the ranges of dimensionless parameters considered in the FELA. It is important to note that these ranges cover realistic geometrical and geological properties of the tunnel and rock masses. The input includes major parameters: γD/σci, GSI, mi, DF, C/D, and B/D affecting the stability index that is analyzed using the FELA and applied as an output variable in machine learning models.
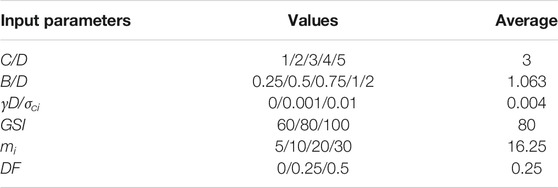
TABLE 1. Input parameters.
Linear regression is a linear approach for modeling the linear relationship between the dependent variable (scalar response) and one or more independent variables (also known as explanatory variables). The case of one dependent variable is called simple linear regression. In this study, there are six independent variables so that the process is called multiple linear regression. It is noted that this method is one of the most well-known and simplest algorithms in statistical analysis and machine learning.
The output is a dependent variable that can be calculated from the combination of the input or independent variables as shown in the following equation:
where
A regression model assumes that the linear relationship between dependent variable y and the p-vector of regressors x is linear. This relationship is modeled via a residual term or error variable
An artificial neural network (ANN) is also applied in this study. This method is a data prediction framework based on existing features created from the human mind structure. It simulates the processing mechanism of the human brain’s nervous system to complex information. A neural network is a computational model consisting of a large number of nodes (or neurons) connected to each other.
ANN consists of three layers: input layer, hidden layer, and output layer, as shown in Figure 5. The first layer is the input layer, where the feature vector is passed through. In this study, the input layer consists of six nodes representing γD/σci, GSI, mi, DF, C/D, and B/D. The second layer is the hidden layer, which consists of one or more threshold logic unit layers. Generally, the number of hidden layers and hidden neurons is chosen on the basis of a trial-and-error method until the best model is obtained. This layer aims to convert the information into content so that the output layer can be used to predict the data. It is within this layer that the weighted sums of the inputs are calculated and a step function is applied to it before being sent off as an output through the use of the rectified linear unit (ReLU) activation function, which provides non-linearity in the network. The final layer is the output layer presenting an independent variable or a predicted value. The output layer consists of one node presenting a predicted stability factor of rectangular tunnels in rock masses.
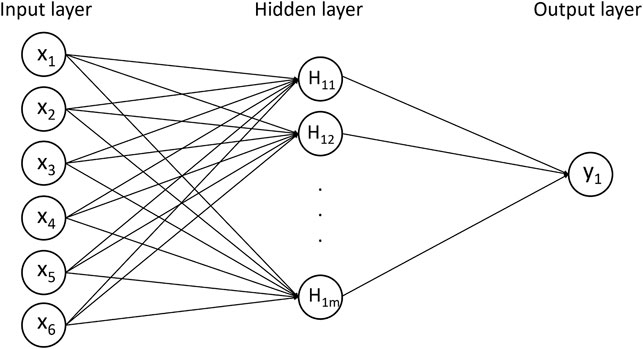
FIGURE 5. ANN architecture.
In the case of a limited number of datasets, splitting the method into train and test datasets is not reliable. A more general technique to offset any bias produced by the individual sample used for holdout is to repeat the entire procedure, training, and testing, with various random samples several times.
The general way of estimating either the accuracy or error of a machine learning technique given a single, fixed sample of data is to use stratified 10-fold cross-validation. The data are divided randomly into 10 parts with the class represented in approximately the same proportions as in the complete dataset. Each part is held out in turn and the learning scheme trained on the remaining nine-tenths before calculating the error rate is calculated on the holdout set. Hence, the learning procedure has been executed a total of 10 times on different training sets. The average of the 10 errors is finally calculated to yield overall error estimation. However, a single tenfold cross-validation might not be enough to get a reliable error estimate. Different tenfold cross-validation experiments with the same learning scheme and dataset often produce different results because of the effect of random datasets.
It is recommended to repeat the cross-validation process 10 times—that is, 10 times tenfold cross-validation—and average the results. This involves invoking the learning algorithm 100 times on datasets that are all nine-tenths the size of the original.
In order to investigate the performance of the trained models in this study, three statistical analyses named correlation coefficient (R), root mean squared error (RMSE), and mean absolute error (MAE) are employed.
The correlation coefficient measures the statistical correlation between the predicted value and actual value. The correlation coefficient ranges from 0 when there is no correlation to one for perfectly correlated results. However, a value that is less than zero signifies a negative relationship. Correlation is slightly different from the other measures because it is scale-independent in that, if a particular set of predictions is taken, the error is unchanged if all the predictions are multiplied by a constant factor and the actual values are left unchanged. This factor appears in every term of SPA in the numerator and in every term of SP in the denominator, thus canceling out. (This is not true for the relative error figures, despite normalization; if all the predictions are multiplied by a large constant, then the difference between the predicted and actual values will change dramatically, as will the percentage errors.) It is also different in that good performance leads to a large value of the correlation coefficient, whereas because the other methods measure error, good performance is indicated by small values.
where
The coefficient of determination (R-squared, R2) is the square of the coefficient of correlation. It is important to note that in the case of multiple variables, R2 can better quantify the strength of the developed model since r cannot be calculated when the variables are more than 1. Thus, this study uses R2 as one of the performance measures of the developed model.
In addition, the mean absolute error (MAE) is an average of the magnitude of the individual errors without taking account of their sign. The mean-squared error tends to exaggerate the effect of outliers—instances when the prediction error is larger than the others—but the absolute error does not have this effect. All sizes of error are treated evenly according to their magnitude. The equation for MAE is shown in
In addition, the mean-squared error (MSE) is the principal and most commonly used measure; sometimes, the square root (root mean-squared error, RMSE) is taken to give it the same dimensions as the predicted value itself. Many mathematical techniques use the mean-squared error because it tends to be the easiest measure to manipulate mathematically. It is, as mathematicians say, “well behaved.” However, RMSE is more widely used than MSE to evaluate the performance of the regression model with other random models as it has the same units as the dependent variable. Note that the lower MSE and RMSE value indicates a model with higher accuracy.
A multilinear regression model is first conducted, and the regression coefficients or weights are obtained. The coefficients are optimized by minimizing the error in WEKA software. The multiple linear regression equation is shown as follows:
where y represents the stability factor σs/σci, whereas
Figure 6 presents the comparison between the actual stability factor (average values from UB and LB solutions) obtained from the FELA and the predicted value obtained from the multiple linear regression. The performance of the developed equation can be accessed via statistical tests, R2, MAE, and RMSE which are found to be 0.8466, 3.2983, and 4.5924, respectively (see Table 2).
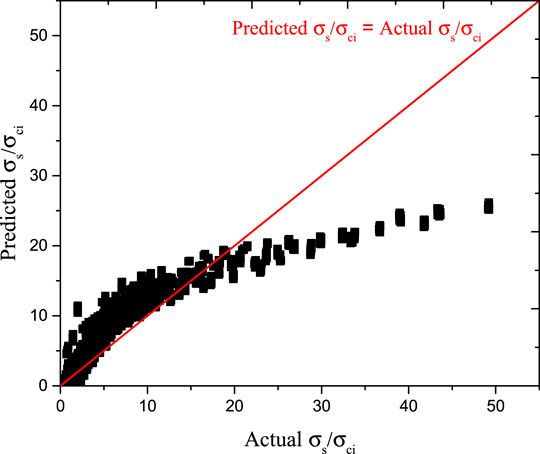
FIGURE 6. Comparison between actual and predicted
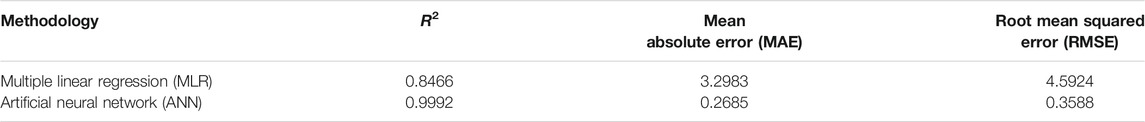
TABLE 2. Performance measures of each methodology.
In order to maximize the accuracy of the ANN models, the number of hidden layers and neurons should be optimized. In this study, one hidden layer is considered, while the number of hidden neurons is varied. Figure 7 presents the performance of ANN models for the stability factor of rectangular tunnels in rock masses. It is clear that the performance of ANN models is increased if the number of hidden neurons is increased. It should be noted that R2, MAE, and RMSE must be calculated as the R2 value alone cannot really show the performance of the models as the variation of MAE and RMSE can still be seen clearly. Figure 8 presents the performance of the models against the number of hidden neurons. It is found that when the number of hidden neurons is over 11, the performance of ANN models is likely to be stabilized. In this case, ANN with the architecture of 6-11-1 is chosen to be the optimal MLP model as it shows the lowest MAE and RMSE values among the other models, while R2 is the highest among the models. Table 2 also compares the performance between the MLR and MLP models. It is clear that the MLP model performs much better than the MLR model. This optimal MLP model with the architecture of 6-11-1 is used in the next section for the sensitivity analysis.
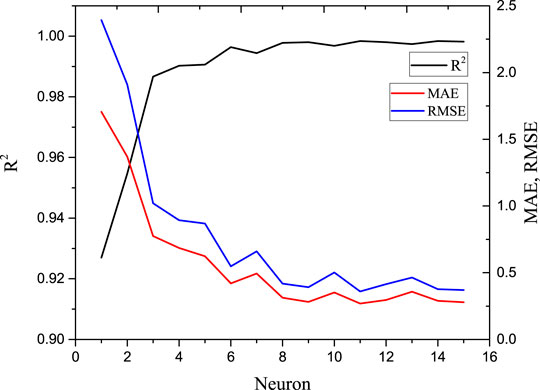
FIGURE 7. Performance evaluation of rectangular tunnel models against the number of hidden neurons.
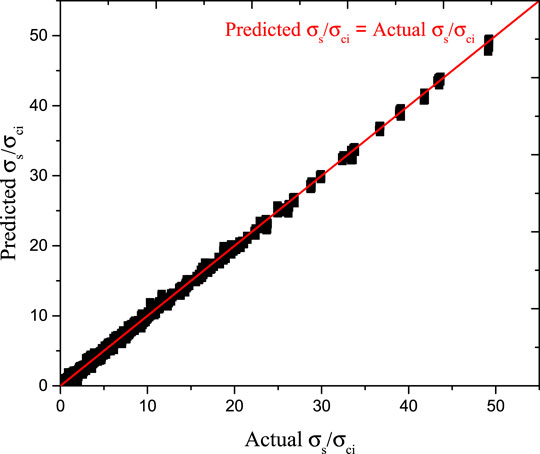
FIGURE 8. Comparison between actual and predicted
After obtaining the optimal ANN architecture, the approximate general functions can be employed considering the weighted inputs and the transfer function to create the outputs. The layer number defines the superscript on the weight matrix in multiple-layer networks, as seen in Figure 9. The proper notation is used in the two-layer tansig/purelin network. This network is useful for approximating general functions. Given a sufficient number of neurons in the hidden layer, it can arbitrarily approximate well any function with a finite number of discontinuities. In this section, the final weights of each parameter have been calculated in order to study the effects of each parameter on the stability index. Figure 9 shows an example of the dimension of weight matrix and bias of the optimal ANN model for the heading tunnel. Predictive Equation 11 can be developed based on the tansig function, weight, and bias from the ANN model.
where N is the number of hidden neurons, X is the number of input variables, and J is the number of input variables. The weight matrix (IW1 and IW2) and bias (b1i and b2) in the hidden and output layers corresponding to the optimal ANN models are obtained. Hidden weight (IW1) is obtained based on the number of input parameters (J) and hidden neurons (N). There is one weight for every input to neuron connection between the layers. Each neuron in the hidden layer has its own bias constant (b1i). As for the output weight matrix (IW2), the number of rows matches the number of hidden layer neurons (N) and the number of columns matches the number of output layer neurons (k). There is one column for every neuron in the output layer. In this case, the output layer contains only one column. Table 3 presents the neural network constants of the optimal ANN model including the weight matrix and bias for the stability index calculation of rectangular tunnels. These values obtained from the optimal ANN networks can be used to develop predictive equation functions and test on new datasets with different variations of parameters within required ranges.
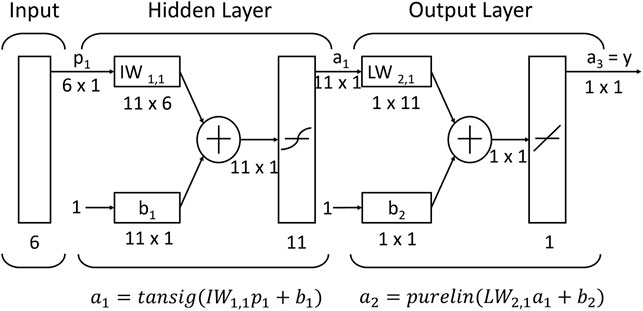
FIGURE 9. Multilayer networks with weight matrix.
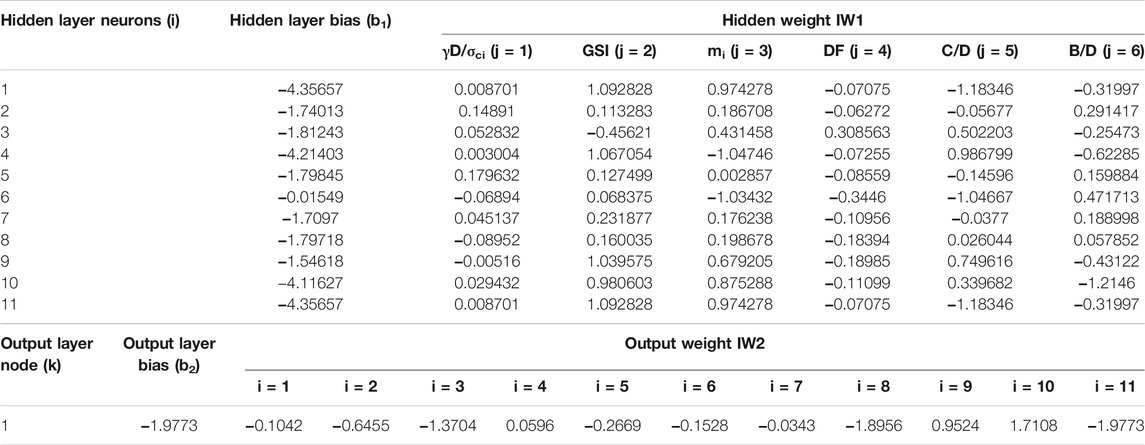
TABLE 3. Neural network constants of the optimal model for rectangular tunnel.
The sensitivity analysis of the stability of rectangular tunnels in rock masses using the ANN approach is presented next to portray the influences of all considered input dimensionless parameters (e.g., B/D, C/D, DF, GSI, mi, and γD/σci) on the stability factor (σs/σci). Figures 10A,B, respectively, show the effect of the width ratio B/D on the stability factor σs/σci for the cases of (γD/σci = 0, DF = 0, GSI = 80, and mi = 5 and 30). The non-linear relationship between σs/σci and B/D can be seen in Figure 10. It is found that an increase in B/D can decrease the geometrical arching effect resulting in the reduction of tunnel stability. As a result, a larger B/D ratio causes a smaller value of σs/σci. In Figure 10, the stability factor of the lowest case (B/D = 0.5) is higher than that of the highest case (B/D = 2), which is about 120–300%. The impact of cover depth ratio C/D on the stability factor σs/σci for the cases of γD/σci = 0, DF = 0, mi = 20, and GSI = 60 and 100 are shown in Figures 11A,B, respectively. A non-linear relationship between σs/σci and C/D is observed in Figure 11. A larger C/D value also yields an incensement of the geometrical arching effect which is positive in improving the tunnel stability factor (σs/σci). Generally, when B/D = 0.5 to 1, the case of the deepest cover depth (C/D = 5) has a larger stability factor about three to five times of the case of C/D = 1, as shown in Figure 11. However, when B/D = 2, the difference between the stability for the cases of C/D = 1 and 5 becomes very large about 40 times.
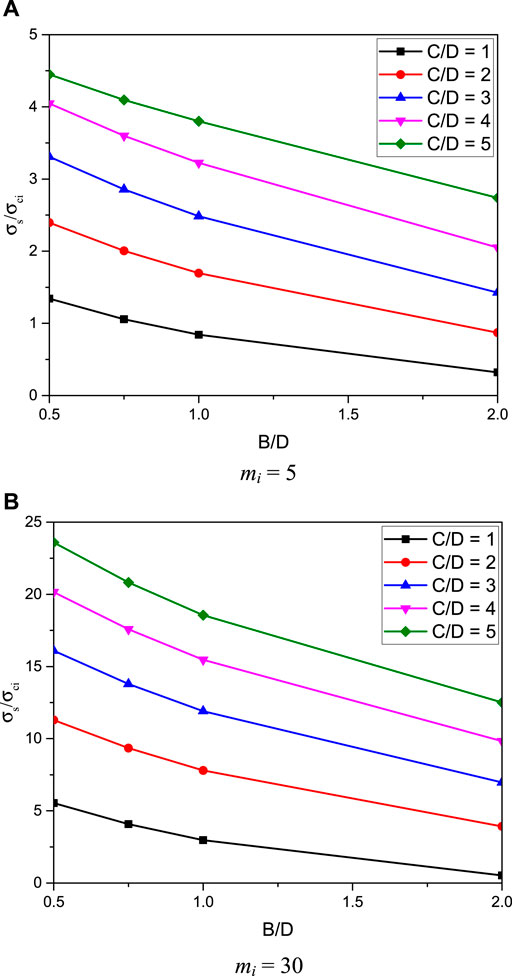
FIGURE 10. Influence of B/D on the stability solutions of rectangular tunnels (γD/σci = 0, GSI = 80, and DF = 0). (A) mi = 5. (B) mi = 30.
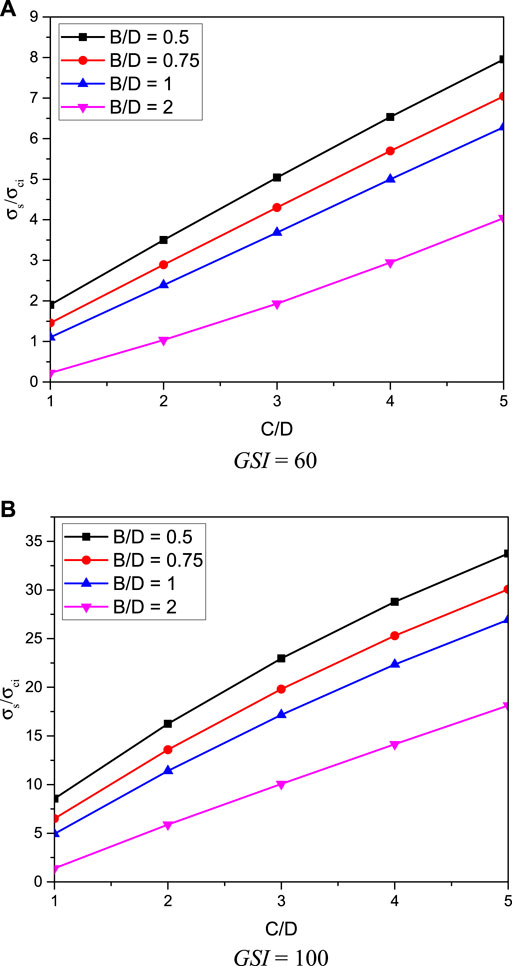
FIGURE 11. Influence of C/D on the stability solutions of rectangular tunnels (γD/σci = 0, mi = 20, and DF = 0). (A) GSI = 60. (B) GSI = 100.
The influences of Hoek–Brown parameters for rock masses including DF, GSI, mi, and γD/σci are presented next. From Figures 12A,B, the impact of geological strength index GSI on the stability factor σs/σci is illustrated for the cases of γD/σci = 0, C/D = 3, B/D = 0.75, and DF = 0.25 and 0.5, respectively. Numerical results in Figure 12 have shown that there is an exponential relationship between GSI and σs/σci, where an increase of GSI results in a non-linear increase of σs/σci for all mi values. Such results can be referred to the exponential function used in the model of the Hoek–Brown failure criterion as expressed in Eqs 2–4. It is due to the fact that a large GSI value is a highly undisturbed rock mass which yields an increase in the stability of rock tunnels. From Figure 12, it is also found that when the value of mi is large, the non-linearity of the σs/σci and GSI relationship is also high. The effect of the mi parameter on the stability factor σs/σci is presented in Figures 13A,B for the cases of DF = 0.25 and 0.5, respectively. The plots are for γD/σci = 0, C/D = 3, and B/D = 0.75. The results in Figure 13 show that the relationship between σs/σci and mi is linearly increasing. An increase of mi results in an increase of σs/σci for all B/D values. In a physical meaning, mi depends upon the mineralogy, composition, and grain size of the intact rock. From Figure 13, it can be observed that the slope of the σs/σci and mi line becomes higher when the value of GSI becomes larger, meaning that the impact of mi is more prominent when the GSI value is high. The influence of the degree of disturbance DF on the stability factor σs/σci is demonstrated in Figures 14A,B for the cases of GSI = 60 and 100, respectively, where the others are γD/σci = 0, C/D = 3, and mi = 20. A high value of DF represents a larger degree of disturbance meaning that the stability factor σs/σci is reduced. The slopes of the lines of DF effect decrease as the values of GSI increase (see Figures 14A,B). For the case of GSI = 60 (see Figure 14A), the structure of rock masses for this case is very blocky and has partially distributed masses so that the impact of DF is very high due to the low quality of rocks. On the other hand, when GSI = 100 (see Figure 14B), the structure of rock masses is perfectly intact with few very widely spaced discontinuities. As a result, the effect of DF on this perfectly intact rock on the stability factor is then smaller than that of blocky rocks. Finally, the influence of the normalized unit weight and the uniaxial compressive strength ratio γD/σci is presented in Figures 15A,B for the cases of DF = 0, GSI = 60, C/D = 3, and mi = 5 and 30, respectively. Obviously, all data are plotted horizontally, meaning that the increase of σci/γD does not significantly affect the results of σs/σci. This is because the stress induced by the unit weight γ of rock masses is low in comparison to that of σci for rock masses. Thus, the impact of γD/σci is negligible for the tunnel stability in rock masses.
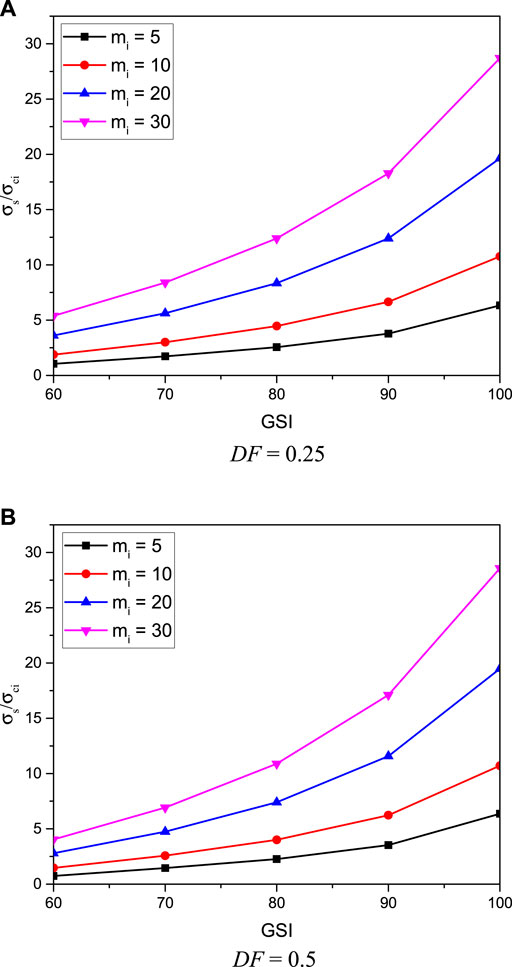
FIGURE 12. Influence of GSI on the stability solutions of rectangular tunnels (γD/σci = 0, C/D = 3, and B/D = 0.75). (A) DF = 0.25. (B) DF = 0.5.
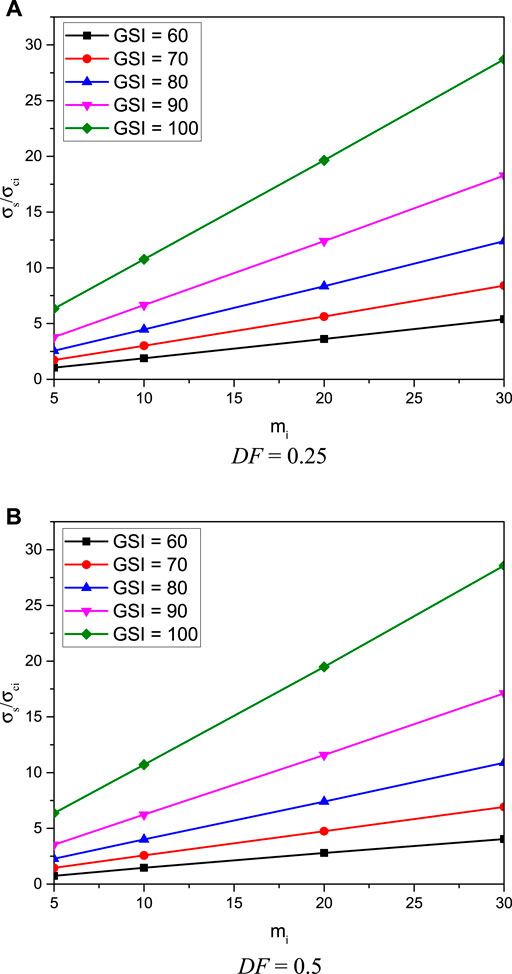
FIGURE 13. Influence of mi on the stability solutions of rectangular tunnels (γD/σci = 0, C/D = 3, and B/D = 0.75). (A) DF = 0.25. (B) DF = 0.5.
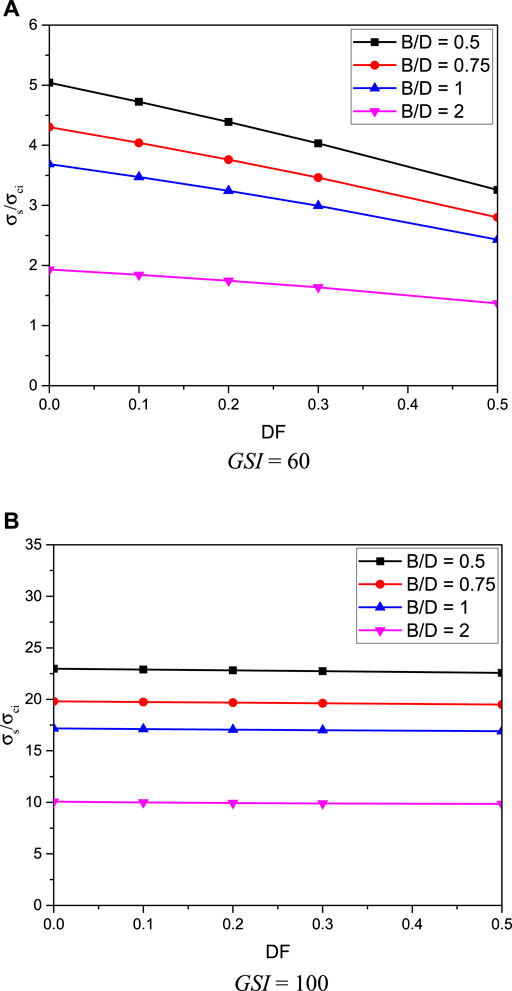
FIGURE 14. Influence of DF on the stability solutions of rectangular tunnels (γD/σci = 0, mi = 20 and C/D = 3). (A) GSI = 60. (B) GSI = 100.
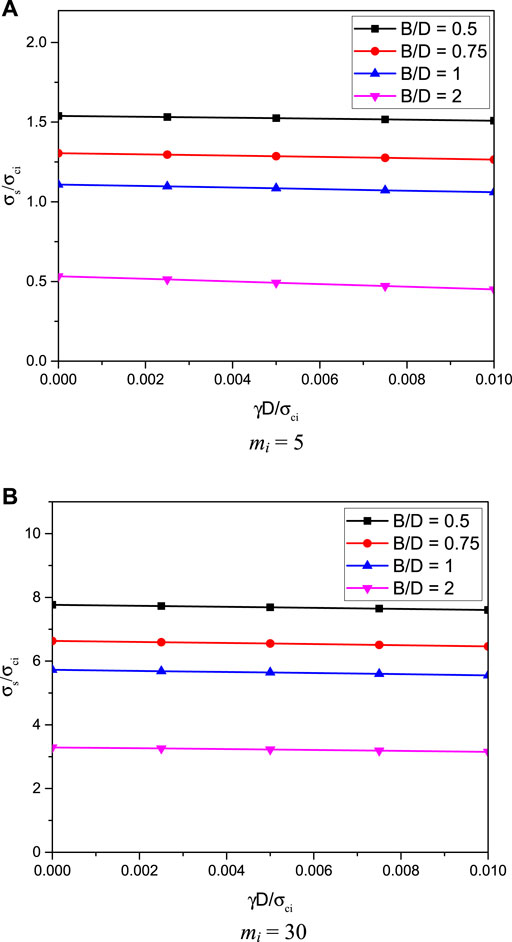
FIGURE 15. Influence of γD/σci on the stability solutions of rectangular tunnels (DF = 0, GSI = 60, and C/D = 3). (a) mi = 5. (b) mi = 30
To the authors’ knowledge, this study is the first to establish a machine learning aided design for predicting the stability factor of the rectangular tunnel that is located in a rock mass following the Hoek–Brown (HB) failure criterion. The stability factor of the problem is investigated in terms of six dimensionless parameters including the width ratio, cover depth ratio, degree of disturbance, geological strength index, material constant related to the frictional strength, and normalized uniaxial compressive strength. For practical engineers, it is time-consuming to develop the algorithm of FELA with the HB failure criterion for obtaining stability solutions of tunnels in rock masses. Moreover, proper software is not usually user-friendly, and additional resources capable of providing information useful for decision-making are required. This study provides the optimal machine learning models for predicting the stability factor of rectangular tunnels. It is notable that only one hidden layer is sufficient to create a high-performance neural network model as R2 is already high and MSE is extremely low, showing that the optimal model can be used to accurately predict the stability factor. The trained networks are obtained and can be further used to test new data for predicting the stability factor of the tunnel located in a rock mass using the weight matrix and bias derived in this study. However, the proposed ANN models should not be used when the values of parameters are out of the certain ranges presented in this study.
The original contributions presented in the study are included in the article/Supplementary Material; further inquiries can be directed to the corresponding author.
Conceptualization: SK, SS, and CN; investigation: SK, SS, and CN; methodology: SK, SS, and CN; data analysis: SK, SS, and CN; validation: SK, SS, and CN; visualization: SK, SS, and CN; draft: SK, SS, and CN; review and editing: SK, SS, and CN.
The authors wish to thank for the support from Thammasat University Research Unit in Structural and Foundation Engineering, Thammasat University. This research project is partially supported by grants for development of new faculty staff, Ratchadaphiseksomphot Fund, Chulalongkorn University. The last author is sincerely grateful to the European Commission for the financial sponsorship of the H2020-MSCA-RISE Project No. 691135 “RISEN: Rail Infrastructure Systems Engineering Network,” which enables a global research network that tackles the grand challenge of railway infrastructure resilience and advanced sensing in extreme environments (www.risen2rail.eu).
The authors declare that the research was conducted in the absence of any commercial or financial relationships that could be construed as a potential conflict of interest.
All claims expressed in this article are solely those of the authors and do not necessarily represent those of their affiliated organizations, or those of the publisher, the editors, and the reviewers. Any product that may be evaluated in this article, or claim that may be made by its manufacturer, is not guaranteed or endorsed by the publisher.
Alavi, A. H., and Sadrossadat, E. (2016). New Design Equations for Estimation of Ultimate Bearing Capacity of Shallow Foundations Resting on Rock Masses. Geosci. Front. 7, 91–99. doi:10.1016/j.gsf.2014.12.005
Alkhafaji, H., Imani, M., and Fahimifar, A. (2020). Ultimate Bearing Capacity of Rock Mass Foundations Subjected to Seepage Forces Using Modified Hoek-Brown Criterion. Rock Mech. Rock Eng. 53 (1), 251–268. doi:10.1007/s00603-019-01905-6
Aygar, E. B., and Gokceoglu, C. (2020). Problems Encountered during a Railway Tunnel Excavation in Squeezing and Swelling Materials and Possible Engineering Measures: A Case Study from Turkey. Sustainability 12 (3), 1166. doi:10.3390/su12031166
Carranza-Torres, C., and Fairhurst, C. (1999). The Elasto-Plastic Response of Underground Excavations in Rock Masses that Satisfy the Hoek-Brown Failure Criterion. Int. J. Rock Mech. Mining Sci. 36, 777–809. doi:10.1016/S0148-9062(99)00047-9
Carranza-Torres, C. (2004). Elasto-plastic Solution of Tunnel Problems Using the Generalized Form of the Hoek-Brown Failure Criterion. Int. J. Rock Mech. Mining Sci. 41, 480–481. doi:10.1016/j.ijrmms.2003.12.014
Chakraborty, M., and Kumar, J. (2015). Bearing Capacity of Circular Footings over Rock Mass by Using Axisymmetric Quasi Lower Bound Finite Element Limit Analysis. Comput. Geotechn. 70, 138–149. doi:10.1016/j.compgeo.2015.07.015
Chung, H. S., Paik, Y. S., Sohn, J. I., Choi, J. B., Kim, J. B., and Jang, C. S. (1995). “Performance of Remedial Treatment for Cave-In Collapse of a Subway Tunnel,” in Underground Construction in Soft Ground. Editors K. Fujita, and O. Kusakabe (New Delhi, India), 233–236.
Ciria, H., Peraire, J., and Bonet, J. (2008). Mesh Adaptive Computation of Upper and Lower Bounds in Limit Analysis. Int. J. Numer. Meth. Eng. 75, 899–944. doi:10.1002/nme.2275
Clausen, J. (2013). Bearing Capacity of Circular Footings on a Hoek-Brown Material. Int. J. Rock Mech. Mining Sci. 57, 34–41. doi:10.1016/j.ijrmms.2012.08.004
Dongping, D., Liang, L., Jian-feng, W., and Lian-heng, Z. (2016). Limit Equilibrium Method for Rock Slope Stability Analysis by Using the Generalized Hoek-Brown Criterion. Int. J. Rock Mech. Mining Sci. 89, 176–184. doi:10.1016/j.ijrmms.2016.09.007
Fraldi, M., and Guarracino, F. (2009). Limit Analysis of Collapse Mechanisms in Cavities and Tunnels According to the Hoek-Brown Failure Criterion. Int. J. Rock Mech. Mining Sci. 46, 665–673. doi:10.1016/j.ijrmms.2008.09.014
Gholami, R., Rasouli, V., and Alimoradi, A. (2013). Improved RMR Rock Mass Classification Using Artificial Intelligence Algorithms. Rock Mech. Rock Eng. 46, 1199–1209. doi:10.1007/s00603-012-0338-7
Hoek, E., and Brown, E. T. (1980). Empirical Strength Criterion for Rock Masses. J. Geotech. Engrg. Div. 106 (9), 1013–1035. doi:10.1061/AJGEB6.0001029
Hoek, E., Carranza-Torres, C., and Corkum, B. (2002). “Hoek–Brown Failure Criterion-2002 Edition,” in Proceedings of the North American Rock Mechanics Society Meeting in Toronto, 7-10 July, 2002. (Toronto, Canada).
Hoek, E. (2004). A Brief History of the Development of the Hoek–Brown Failure Criterion. Available at: http://www.rocscience.com Accessed: November 10, 2021.
Hoek, E. (2007). Practical Rock Engineering. Available at: http://www.rocscience.com Accessed: November 10, 2021.
Keawsawasvong, S., and Ukritchon, B. (2017). Undrained Lateral Capacity of I-Shaped concrete Piles. Songklanakarin J. Sci. Techn. 39 (6), 751–758. doi:10.14456/sjst-psu.2017.91
Keawsawasvong, S., and Ukritchon, B. (2020). Design Equation for Stability of Shallow Unlined Circular Tunnels in Hoek-Brown Rock Masses. Bull. Eng. Geol. Environ. 79, 4167–4190. doi:10.1007/s10064-020-01798-8
Keawsawasvong, S., and Ukritchon, B. (2021). Undrained Stability of Plane Strain Active Trapdoors in Anisotropic and Non-homogeneous Clays. Tunnel. Undergr. Space Techn. 107, 103628. doi:10.1016/j.tust.2020.103628
Keshavarz, A., and Kumar, J. (2018). Bearing Capacity of Foundations on Rock Mass Using the Method of Characteristics. Int. J. Numer. Anal. Methods Geomech. 42 (3), 542–557. doi:10.1002/nag.2754
Krishnan, K., Halder, K., and Chakraborty, D. (2019). Seismic Bearing Capacity of a Strip Footing over an Embankment of Anisotropic clay. Front. Built Environ. 5, 134. doi:10.3389/fbuil.2019.00134
Kumar, J., and Rahaman, O. (2020). Lower Bound Limit Analysis Using Power Cone Programming for Solving Stability Problems in Rock Mechanics for Generalized Hoek-Brown Criterion. Rock Mech. Rock Eng. 53 (7), 3237–3252. doi:10.1007/s00603-020-02099-y
Li, A. J., Merifield, R. S., and Lyamin, A. V. (2008). Stability Charts for Rock Slopes Based on the Hoek-Brown Failure Criterion. Int. J. Rock Mech. Mining Sci. 45, 689–700. doi:10.1016/j.ijrmms.2007.08.010
Li, A. J., Merifield, R. S., and Lyamin, A. V. (2011). Effect of Rock Mass Disturbance on the Stability of Rock Slopes Using the Hoek-Brown Failure Criterion. Comput. Geotechn. 38 (4), 546–558. doi:10.1016/j.compgeo.2011.03.003
Li, A. J., Khoo, S., Lyamin, A. V., and Wang, Y. (2016). Rock Slope Stability Analyses Using Extreme Learning Neural Network and Terminal Steepest Descent Algorithm. Autom. Constr. 65, 42–50. doi:10.1016/j.autcon.2016.02.004
Martin, C. D., and Maybee, W. G. (2000). The Strength of Hard-Rock Pillars. Int. J. Rock Mech. Mining Sci. 37, 1239–1246. doi:10.1016/S1365-1609(00)00032-0
Merifield, R. S., Lyamin, A. V., and Sloan, S. W. (2006). Limit Analysis Solutions for the Bearing Capacity of Rock Masses Using the Generalised Hoek-Brown Criterion. Int. J. Rock Mech. Mining Sci. 43, 920–937. doi:10.1016/j.ijrmms.2006.02.001
Mert, E., Yilmaz, S., and İnal, M. (2011). An Assessment of Total RMR Classification System Using Unified Simulation Model Based on Artificial Neural Networks. Neural Comput. Applic. 20, 603–610. doi:10.1007/s00521-011-0578-6
Miah, M. I., Ahmed, S., Zendehboudi, S., and Butt, S. (2020). Machine Learning Approach to Model Rock Strength: Prediction and Variable Selection with Aid of Log Data. Rock Mech. Rock Eng. 53 (10), 4691–4715. doi:10.1007/s00603-020-02184-2
Millán, M. A., Galindo, R., and Alencar, A. (2021). Application of Artificial Neural Networks for Predicting the Bearing Capacity of Shallow Foundations on Rock Masses. Rock Mech. Rock Eng. 54, 5071–5094. doi:10.1007/s00603-021-02549-1
Mohamad Ali Ridho, B. K. A., Ngamkhanong, C., Wu, Y., and Kaewunruen, S. (2021). Recycled Aggregates concrete Compressive Strength Prediction Using Artificial Neural Networks (ANNs). Infrastructures 6 (2), 17. doi:10.3390/infrastructures6020017
Naghadehi, M. Z., Thewes, M., and Lavasan, A. (2019). Face Stability Analysis of Mechanized Shield Tunneling: An Objective Systems Approach to the Problem. Eng. Geol. 262, 105307. doi:10.1016/j.enggeo.2019.105307
Ngamkhanong, C., and Kaewunruen, S. (2018). The Effect of Ground Borne Vibrations from High Speed Train on Overhead Line Equipment (OHLE) Structure Considering Soil-Structure Interaction. Sci. Total Environ. 627, 934–941. doi:10.1016/j.scitotenv.2018.01.298
Ngamkhanong, C., Kaewunruen, S., and Baniotopoulos, C. (2018). Far-Field Earthquake Responses of Overhead Line Equipment (OHLE) Structure Considering Soil-Structure Interaction. Front. Built Environ. 4, 35. doi:10.3389/fbuil.2018.00035
Ocak, I., and Seker, S. E. (2012). Estimation of Elastic Modulus of Intact Rocks by Artificial Neural Network. Rock Mech. Rock Eng. 45, 1047–1054. doi:10.1007/s00603-012-0236-z
OptumCE (2020). OptumG2, OptumCE: Optum Computational Engineering. Copenhagen, Denmark. Available at: https://optumce.com/ Accessed: November 10, 2021..
Rahaman, O., and Kumar, J. (2020). Stability Analysis of Twin Horse-Shoe Shaped Tunnels in Rock Mass. Tunnel. Undergr. Space Techn. 98, 103354. doi:10.1016/j.tust.2020.103354
Saada, Z., Maghous, S., and Garnier, D. (2008). Bearing Capacity of Shallow Foundations on Rocks Obeying a Modified Hoek-Brown Failure Criterion. Comput. Geotechn. 35, 144–154. doi:10.1016/j.compgeo.2007.06.003
Sakurai, S. (1993). “Back Analysis in Rock Engineering,” in Comprehensive Rock Engineering-Excavation, Support and Monitoring. Editor J. A. Hudson (Oxford: Pergamon Press), Vol. 4, 543–569. doi:10.1016/b978-0-08-042067-7.50026-x
Senent, S., Mollon, G., and Jimenez, R. (2013). Tunnel Face Stability in Heavily Fractured Rock Masses that Follow the Hoek-Brown Failure Criterion. Int. J. Rock Mech. Mining Sci. 60, 440–451. doi:10.1016/j.ijrmms.2013.01.004
Serrano, A., and Olalla, C. (1998a). Ultimate Bearing Capacity of an Anisotropic Discontinuous Rock Mass. Part I: Basic Modes of Failure. Int. J. Rock Mech. Mining Sci. 35 (3), 301–324. doi:10.1016/S0148-9062(97)00337-9
Serrano, A., and Olalla, C. (1998b). Ultimate Bearing Capacity of an Anisotropic Discontinuous Rock massPart II: Determination Procedure. Int. J. Rock Mech. Mining Sci. 35 (3), 325–348. doi:10.1016/S0148-9062(97)00338-0
Serrano, A., Olalla, C., and Galindo, R. A. (2014). Ultimate Bearing Capacity at the Tip of a Pile in Rock Based on the Modified Hoek-Brown Criterion. Int. J. Rock Mech. Mining Sci. 71, 83–90. doi:10.1016/j.ijrmms.2014.07.006
Serrano, A., Olalla, C., and Galindo, R. A. (2015). Shaft Resistance of a Pile in Rock Based on the Modified Hoek-Brown Criterion. Int. J. Rock Mech. Mining Sci. 76, 138–145. doi:10.1016/j.ijrmms.2015.03.007
Serrano, A., Olalla, C., and Galindo, R. A. (2016). Ultimate Bearing Capacity of an Anisotropic Discontinuous Rock Mass Based on the Modified Hoek-Brown Criterion. Int. J. Rock Mech. Mining Sci. 83, 24–40. doi:10.1016/j.ijrmms.2015.12.014
Shen, J., and Karakus, M. (2014). Three-dimensional Numerical Analysis for Rock Slope Stability Using Shear Strength Reduction Method. Can. Geotech. J. 51, 164–172. doi:10.1139/cgj-2013-0191
Shen, J., Karakus, M., and Xu, C. (2013). Chart-based Slope Stability Assessment Using the Generalized Hoek-Brown Criterion. Int. J. Rock Mech. Mining Sci. 64, 210–219. doi:10.1016/j.ijrmms.2013.09.002
Shin, J. H., Lee, I. K., Lee, Y. H., and Shin, H. S. (2006). Lessons from Serial Tunnel Collapses during Construction of the Seoul Subway Line 5. Tunnel. Undergr. Space Techn. 21, 296–297. doi:10.1016/j.tust.2005.12.154
Sloan, S. W. (2013). Geotechnical Stability Analysis. Géotechnique 63 (7), 531–571. doi:10.1680/geot.12.RL.001
Swift, G. M., and Reddish, D. J. (2005). Underground Excavations in Rock Salt. Geotech Geol. Eng. 23, 17–42. doi:10.1007/s10706-003-3159-3
Ukritchon, B., and Keawsawasvong, S. (2017). Error in Ito and Matsui's Limit-Equilibrium Solution of Lateral Force on a Row of Stabilizing Piles. J. Geotech. Geoenviron. Eng. 143 (9), 02817004. doi:10.1061/(ASCE)GT.1943-5606.0001753
Ukritchon, B., and Keawsawasvong, S. (2019a). Stability of Unlined Square Tunnels in Hoek-Brown Rock Masses Based on Lower Bound Analysis. Comput. Geotechn. 105, 249–264. doi:10.1016/j.compgeo.2018.10.006
Ukritchon, B., and Keawsawasvong, S. (2019b). Lower Bound Stability Analysis of Plane Strain Headings in Hoek-Brown Rock Masses. Tunnel. Undergr. Space Techn. 84, 99–112. doi:10.1016/j.tust.2018.11.002
Ukritchon, B., and Keawsawasvong, S. (2020a). Undrained Stability of Unlined Square Tunnels in Clays with Linearly Increasing Anisotropic Shear Strength. Geotech. Geol. Eng. 38 (1), 897–915. doi:10.1007/s10706-019-01023-8
Ukritchon, B., and Keawsawasvong, S. (2020b). Undrained Lower Bound Solutions for End Bearing Capacity of Shallow Circular Piles in Non‐homogeneous and Anisotropic Clays. Int. J. Numer. Anal. Methods Geomech. 44 (5), 596–632. doi:10.1002/nag.3018
Ukritchon, B., Yoang, S., and Keawsawasvong, S. (2019). Three-dimensional Stability Analysis of the Collapse Pressure on Flexible Pavements over Rectangular Trapdoors. Transport. Geotechn. 21, 100277. doi:10.1016/j.trgeo.2019.100277
Ukritchon, B., Yoang, S., and Keawsawasvong, S. (2020). Undrained Stability of Unsupported Rectangular Excavations in Non-homogeneous Clays. Comput. Geotechn. 117, 103281. doi:10.1016/j.compgeo.2019.103281
Wu, G., Zhao, M., Zhang, R., and Lei, M. (2021). Ultimate Bearing Capacity of Strip Footings on Hoek-Brown Rock Slopes Using Adaptive Finite Element Limit Analysis. Rock Mech. Rock Eng. 54 (3), 1621–1628. doi:10.1007/s00603-020-02334-6
Xiao, Y., Zhao, M., Zhang, R., Zhao, H., and Wu, G. (2019). Stability of Dual Square Tunnels in Rock Masses Subjected to Surcharge Loading. Tunnel. Undergr. Space Techn. 92, 103037. doi:10.1016/j.tust.2019.103037
Xiao, Y., Zhang, R., Zhao, M., and Jiang, J. (2021). Stability of Unlined Rectangular Tunnels in Rock Masses Subjected to Surcharge Loading. Int. J. Geomech. 21 (1), 04020233. doi:10.1061/(ASCE)GM.1943-5622.0001884
Yang, X. L., and Huang, F. (2011). Collapse Mechanism of Shallow Tunnel Based on Nonlinear Hoek-Brown Failure Criterion. Tunnel. Undergr. Space Techn. 26 (6), 686–691. doi:10.1016/j.tust.2011.05.008
Yang, X. L., and Huang, F. (2013). Three-dimensional Failure Mechanism of a Rectangular Cavity in a Hoek-Brown Rock Medium. Int. J. Rock Mech. Mining Sci. 61, 189–195. doi:10.1016/j.ijrmms.2013.02.014
Yang, X.-L., and Yin, J.-H. (2005). Upper Bound Solution for Ultimate Bearing Capacity with a Modified Hoek-Brown Failure Criterion. Int. J. Rock Mech. Mining Sci. 42, 550–560. doi:10.1016/j.ijrmms.2005.03.002
Yang, Y., and Zhang, Q. (1997). A Hierarchical Analysis for Rock Engineering Using Artificial Neural Networks. Rock Mech. Rock Eng. 30, 207–222. doi:10.1007/bf01045717
Yang, X.-L., Li, L., and Yin, J.-H. (2004). Stability Analysis of Rock Slopes with a Modified Hoek-Brown Failure Criterion. Int. J. Numer. Anal. Meth. Geomech. 28, 181–190. doi:10.1002/nag.330
You, K.-H., Park, Y.-J., and Dawson, E. M. (2000). Stability Analysis of Jointed/Weathered Rock Slopes Using the Hoek-Brown Failure Criterion. Geosystem Eng. 3 (3), 90–97. doi:10.1080/12269328.2000.10541157
Zhang, R., Xiao, Y., Zhao, M., and Zhao, H. (2019). Stability of Dual Circular Tunnels in a Rock Mass Subjected to Surcharge Loading. Comput. Geotechn. 108, 257–268. doi:10.1016/j.compgeo.2019.01.004
Ziaee, S. A., Sadrossadat, E., Alavi, A. H., and Mohammadzadeh Shadmehri, D. (2015). Explicit Formulation of Bearing Capacity of Shallow Foundations on Rock Masses Using Artificial Neural Networks: Application and Supplementary Studies. Environ. Earth Sci. 73, 3417–3431. doi:10.1007/s12665-014-3630-x
Keywords: artificial neural network, tunnel, Hoek–Brown failure criterion, machine learning, stability, rock mass
Citation: Keawsawasvong S, Seehavong S and Ngamkhanong C (2022) Application of Artificial Neural Networks for Predicting the Stability of Rectangular Tunnels in Hoek–Brown Rock Masses. Front. Built Environ. 8:837745. doi: 10.3389/fbuil.2022.837745
Received: 17 December 2021; Accepted: 28 January 2022;
Published: 23 February 2022.
Edited by:
Sujit Kumar Dash, Indian Institute of Technology Kharagpur, IndiaReviewed by:
Manash Chakraborty, Indian Institute of Technology (BHU), Varanasi, IndiaCopyright © 2022 Keawsawasvong, Seehavong and Ngamkhanong. This is an open-access article distributed under the terms of the Creative Commons Attribution License (CC BY). The use, distribution or reproduction in other forums is permitted, provided the original author(s) and the copyright owner(s) are credited and that the original publication in this journal is cited, in accordance with accepted academic practice. No use, distribution or reproduction is permitted which does not comply with these terms.
*Correspondence: Chayut Ngamkhanong, Y2hheXV0Lm5nQGNodWxhLmFjLnRo
Disclaimer: All claims expressed in this article are solely those of the authors and do not necessarily represent those of their affiliated organizations, or those of the publisher, the editors and the reviewers. Any product that may be evaluated in this article or claim that may be made by its manufacturer is not guaranteed or endorsed by the publisher.
Research integrity at Frontiers
Learn more about the work of our research integrity team to safeguard the quality of each article we publish.