 Xian-Song Xie1
 Ju Chen
 Jun Wang
95% of researchers rate our articles as excellent or good
Learn more about the work of our research integrity team to safeguard the quality of each article we publish.
Find out more
ORIGINAL RESEARCH article
Front. Built Environ. , 01 March 2022
Sec. Computational Methods in Structural Engineering
Volume 8 - 2022 | https://doi.org/10.3389/fbuil.2022.836251
In order to study the axial compression behavior of magnetically-driven concrete (MDC) filled double-skin GFRP tubes (CFDGT), the axial compression test was conducted on eight columns (the length of columns ranged from 1,000 mm to 3,000 mm). For the MDC, a magnetic vibration device was established to vibrate the MDC, and two series of MDC (concrete with and without vibration) were adopted to investigate the vibration effect, research results showed that the concrete between two circular GFRP tubes could be effectively vibrated by the magnetic force. For the CFDGT columns with MDC, the load-displacement curves, load-strain curves, failure modes and ultimate loads of tested columns were obtained. After the axial compression test, a finite element model was proposed to predict the axial compression behavior and carry out parametric analysis. The design equations for the ultimate load of CFDGTs were derived from the finite element results, comparison results showed that the design equations can predict the ultimate load of CFDGT columns accurately and conservatively, and the maximum calculation error was controlled within 10%.
In previous study conducted (Chen et al., 2016), the magnetically driven concrete (MDC) had been proposed and the steel slag was used as the coarse and fine aggregate. Although research results on the concrete using aggregate of steel slag have been reported (Kawamura et al., 1982; Montgomery and Wang, 1991; Maslehuddin et al., 2003; Qasrawi et al., 2003; Li et al., 2009; Wang, 2010; Wang et al., 2013) by other researchers, it is the first time that the steel slag is used as the carrier of magnetic force in concrete. A test program containing of 120 concrete specimens was conducted by Chen et al. (2016), the compressive strength, splitting strength and flexural strength of concrete vibrated by magnetic method were evaluated. It was shown that the magnetically driven method is effective for two series of MDC: 1) steel slag was used to replace all of the coarse aggregate; 2) steel slag was used to replace half of the aggregate (both fine and coarse). Although the applicability of magnetically driven method has been verified, however, the applicable of MDC in structural members is lack of research.
Due to the excellent anti-corrosion performance of FRP (Al-Rousan, 2020a; Al-Rousan, 2020b), it has a promising application in the concrete-filled FRP tubular columns as well as the FRP strengthening structures (Al-Rousan and Barfed, 2019), and research on behavior of concrete-filled FRP tubular columns have been conducted by many researchers. For example, Teng and Lam (2004) conducted a critical review and modeling on the fundamental behavior of FRP-confined concrete. Fahmy and Wu (2010) carried out a comprehensive study on the models of circular concrete columns confined with different type of FRP composites. Ozbakkaloglu et al. (2013) developed the axial stress–strain behavior of FRP-confined concrete in circular sections, and the database containing the test results of 730 FRP-confined concrete cylinders under monotonic axial compression. Abdalla et al. (2019) carried out a non-linear finite element analysis on circular concrete-filled steel tubes whose end regions were confined by CFRP, and research results showed that the use of CFRP composites resulted in an increase in the lateral load, drift capacities and energy dissipation. In review of the previous studies, it is found that the axial compress behavior of FRP confined concrete is the most important topic of the concrete-filled FRP tubular columns (Issa et al., 2009; Al-Rousan and Issa, 2018).
Concrete filled double-skin FRP tubes (CFDFT) have been recognized to have the advantages of high bearing capacity and stiffness, good ductility and corrosion resistance. This kind of composite members were fabricated by filling concrete in the gap of the outer and inner FRP tubes. Fam and Rizkalla (2001) have conducted tests on 12 concrete filled FRP tubular stub columns, research results showed that the confinement effect of double-skin columns is improved and could approach the solid columns when the center hole is maintained by inner GFRP tube. Teng et al. (2004) proposed research results on the compress behavior of the FRP-concrete-steel double-skin tubular columns. Fanggi and Ozbakkaloglu (2013) conducted an experimental study on the behavior of FRP-concrete-steel double-skin tubular columns under axial compression, results indicated that the core concrete was effectively confined by the FRP and steel tubes. Li et al. (2016) carried out an experimental investigation on the compress behavior of sea water and sea sand concrete filled GFRP or stainless steel tubes, the double-skin columns were also included in the tested specimens, it was found that the axial compression behavior of double-skin columns was similar to that of the solid columns.
In this paper, the GFRP tubes and magnetic force were selected for the application of MDC, and the MDC filled in the CFDGT columns was vibrated by magnetic force. It is because the spacing between the inner and outer GFRP tubes are limited that the core concrete was not easy to be vibrated by using vibrating needle, and the magnetic field could pass through the GFRP tubes without much attenuation, hence the magnetic force was selected. To form the magnetic force around the GFRP tubes, a magnetic vibration device was designed and used for the vibration of the MDC in this paper. Moreover, the CFDGT columns with MDC were tested under axial compression to get the confining effect of MDC. After the axial compression test, a finite element model was established so as to predict the axial compression behavior and carry out parametric analysis, then the design equations considering the influence of hollow ratio for the ultimate load of CFDGTs were proposed.
The cement used in the MDC is the Normal P.O Type 42.5 Portland cement. The coarse aggregate used in the MDC is a crushed dolomite of excellent strength-producing property, and the maximum size of coarse aggregate is 35 mm. The fine aggregate used in the MDC is the natural sand and the fineness modulus is 3.6, and the maximum size of the fine aggregate is less than 5 mm.
The steel slag used in the MDC was the electric furnace slag from Zhejiang Harsco Metals Company, it is because the electric furnace slag contains more ferric oxide comparing with the converter steel slag, hence the electric furnace slag is able to get larger magnet attraction force. The coarse steel slag is used as the coarse aggregate while the fine steel slag is used as the fine aggregate of the MDC. More details of the steel slag were presented by Chen et al. (2016).
Two series of MDC, namely A1 and A2 were used in this study: for Series A1, the coarse aggregate was totally replaced by the steel slag (in weight); for Series A2, half of the coarse and fine aggregates were replaced by the steel slag (in weight). The mixture of the two series of MDC are presented in Table 1.
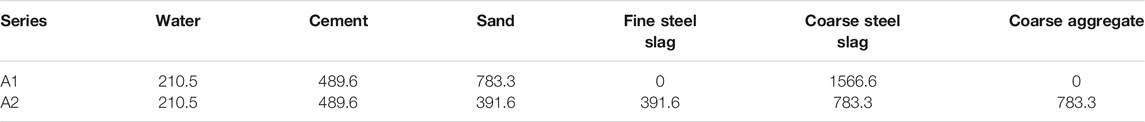
TABLE 1. Mixture of the two series of MDC (by weight, units: kg/m3).
Two kinds of GFRP tubes with diameter of 180 and 300 mm were used as the inner and outer tubes for the CFDGT columns, respectively. The 180 mm GFRP tube was fabricated by extrusion and winding methods, and the winding degree of fibers were 0° and 45° (with respect to longitudinal axis of tubes). The 300 mm GFRP tube was fabricated by winding method, and the winding degree of fibers were 45°.
A magnetic vibration device was designed and established as shown in Figure 1A and Figure 1B, the device consisted of a magnetic field generator, rotating base, steel bracket and control panel. The four solenoid coils shown in Figures 1C,D were used to generate the required magnetic field. The electric current was kept constant and the direction could be switched by a control panel so as to reverse the magnetic force during the vibration. The outer GFRP tubes were surrounded by the four solenoid coils so that the lines of magnetic field were able to pass through the concrete, and the gap between the GFRP tube and one solenoid coil was set as small as possible to reduce the attenuation of magnetic field. Both of the coarse and fine aggregates were derived by the magnetic force generated from the four coils so that the concrete was vibrated, and the four solenoid coils could be lift along the length of columns so that the concrete could be vibrated along the whole length of columns. Moreover, the required magnetic field for vibration was estimated by using the Maxwell’s equations.
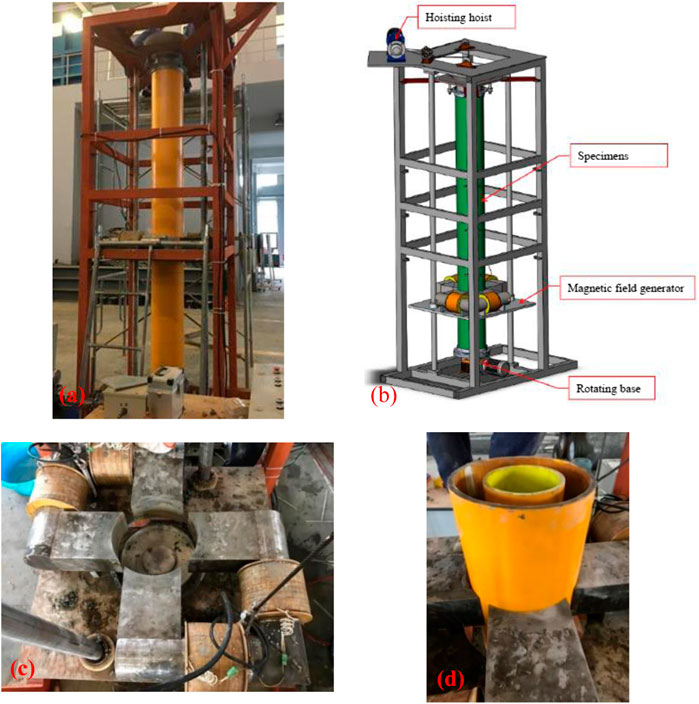
FIGURE 1. Magnetic vibration device and four solenoid coils.
The base of the magnetic vibration device is able to rotate during the vibrating process so that the concrete could be vibrated around 360°, as shown Figure 1C. The MDC was filled about 200 mm height at each pouring time, then the base rotated with a speed of 30 r/min, and the magnetic field was controlled reversing with an interval of 0.25 s. Moreover, each of the concrete section with height of about 200 mm was vibrated for about 1 min, and all of the concrete in a column was vibrated along the column length.
A total eight MDC filled CFDGT columns were fabricated, and the length of the tested specimens are 1,000, 1,500, 2000 and 3,000 mm, respectively. The concrete series can be identified from the name of each specimen, as shown in Table 2, for example, specimen A14 represent that the concrete series is A1, and the length of the column is 3,000 mm (in the specimens’ name, the last number of one,two, three and four represent the length of columns are 1,000, 1,500, 2000 and 3,000 mm, respectively). It should be noted that the specimen of A10 has the same series of concrete with specimen A11, but the magnetic field was not applied during concrete casting of A10. The name and size of the tested columns are given in Table 2.
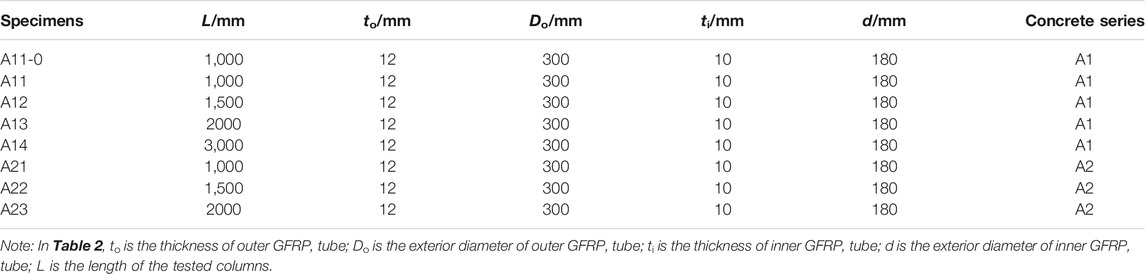
TABLE 2. Name and size of the tested columns.
The real photo and schematic diagram of the axial compression test are shown in Figure 2, and the boundary conditions of each specimen are hinged at two ends. Besides, the two ends of each column was reinforced with steel rings to prevent premature failure. The axial compression load was applied by a 10,000 kN servo-controlled hydraulic testing machine, and the displacement control loading with a speed of 1.0 mm/min during the whole process was applied. The axial shortening of the columns were measured by two 50-mm range LVDTs, and another two LVDTs were arranged to measure the lateral displacement of the columns.
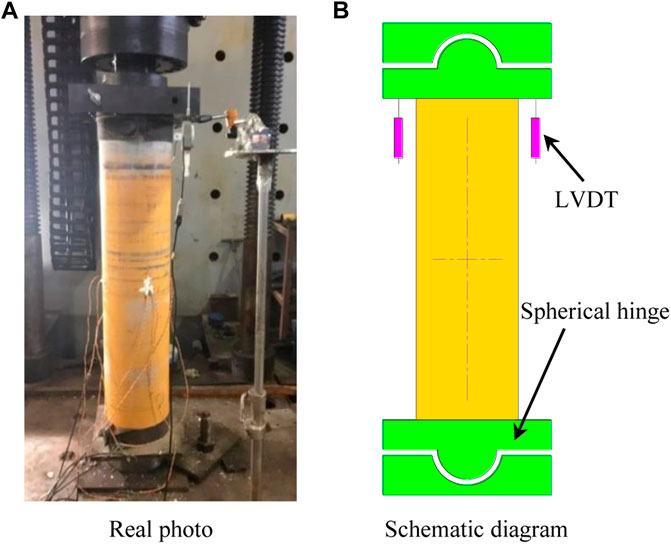
FIGURE 2. Axial compression test. (A) Real photo (B) Schematic diagram.
The strain gauges were attached along the 0°, 45°, 90° and 135° directions (the datum direction is along the column length) of the outer GFRP tubes, and the arrangement of strain gauges is shown in Figure 3.
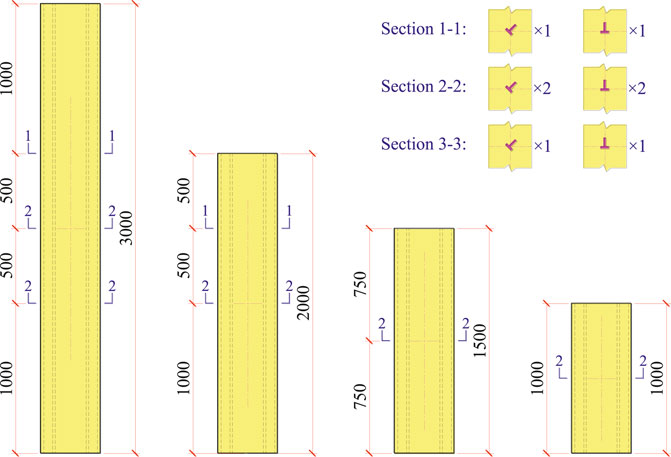
FIGURE 3. Arrangement of strain gauges.
Tensile coupon tests were performed on the same batch of materials to obtain the mechanical properties of GFRP used in the test columns according to ASTM (2014). The hoop tensile strength of GFRP tubes was obtained by using “disk-split” method (Li et al., 2016) similar to the test method used in ASTM (2016). The material properties of the GFRP tubes are summarized in Table 3.
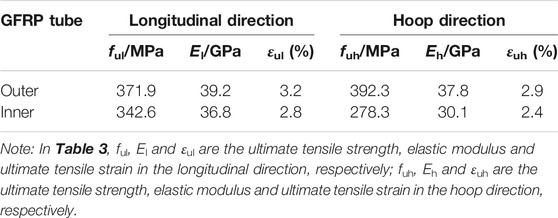
TABLE 3. Material properties of GFRP tubes.
The concrete compressive strength of the 150-mm cubic specimens was tested at the day of experiment, and the cubic specimens of concrete were also vibrated by the magnetic vibration device. For concrete series of A1 and A2, the cubic compressive strength (fcu) were 20.3 and 20.6 MPa, respectively.
All of the tested columns have the failure pattern of rupture of GFRP tubes in the hoop direction, as shown in Figure 4. As can be seen in Figure 4, there was a bulge at the end of the inner GFPR tube, which depicted that the inner GFRP tube could bear part of the axial load before ultimate load, similarly, the outer GFRP tube could also bear part of the axial load before ultimate load.
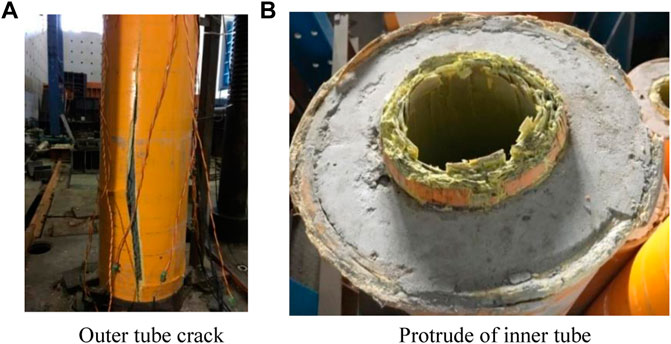
FIGURE 4. Failure mode of test specimens. (A) Outer tube crack (B) Protrude of inner tube.
The ultimate load, ultimate strain (the measured strain corresponding to the ultimate load) and ultimate displacement (the measured axial displacement corresponding to the ultimate load) were summarized in Table 4.
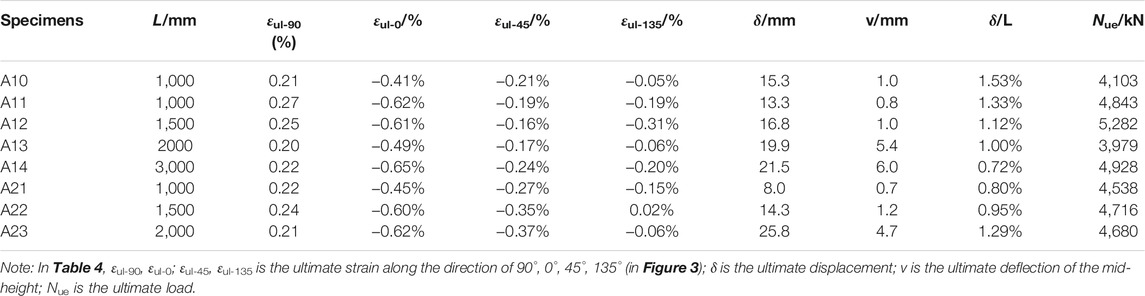
TABLE 4. Results of column tests.
In Table.4, it seems that the slenderness ratio of the columns almost have no influence on the ultimate load, which is mainly because the rupture of GFRP tube in the hoop direction (in Table.4, the ultimate tensile strain is 0.27%, which is relatively small) is the main control factor for the ultimate load. Moreover, specimen A13 was failed due to the premature failure of the outer GFRP tube’s end, hence the ultimate load of specimen A13 was relatively lower than the other specimens.
The load-displacement curves of specimens A10 and A11 are compared in Figure 5A so as to illustrate the effect of magnetic vibration.
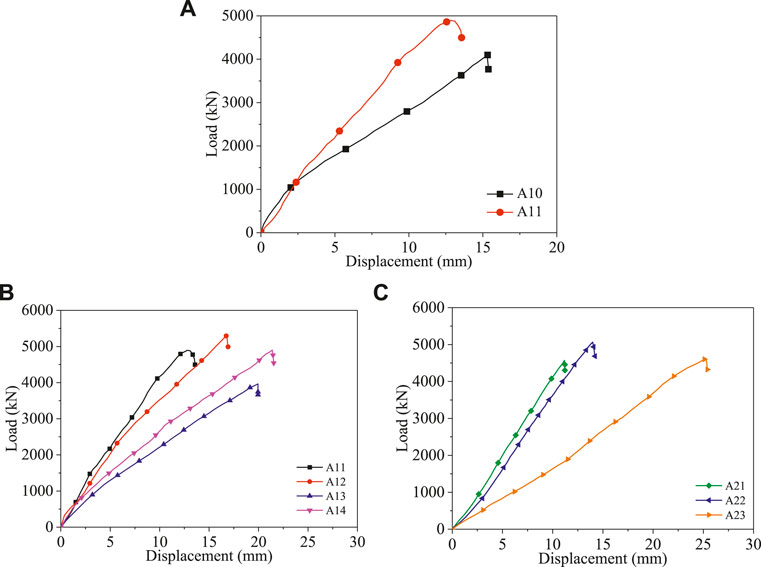
FIGURE 5. Load-displacement curves of tested specimen. (A) Specimens A10 and A11 (B) Concrete series A1 (C) Concrete series A2.
In Figure 5A, the ultimate load of specimen A11 (4,843 kN) is higher than specimen A10 (4,103 kN), and the difference was about 18%. In this paper, the only difference between specimens A10 and A11 is the vibration of concrete, and the difference in ultimate load indicated that the influence of magnetic vibrating on ultimate load is obvious. In addition, the ultimate displacement of specimen A11 is smaller than specimen A10, which showed that the compactness of concrete of specimen A10 is lower than specimen A11, this phenomenon indicated that the magnetic vibration is an effective way to enhance the compactness of concrete. Hence, from the comparison of load-displacement curves shown in Figure 5A, it is shown that the magnetic vibration has an obvious influence on the ultimate load and initial elastic stiffness of the MDC filled CFDGT columns.
The load-displacement curves of specimens A1∼A14 and A21∼A23 are compared in Figures 5B,C to illustrate the influence of different series of MDC, specimen A13 is not taken into consideration due to the premature failure.
As can be seen in Figures 5B,C, the ultimate load of specimen A11 (4,843 kN) is higher than specimen A21 (4,538 kN), and the difference is about 6.7%; while the ultimate load of specimen A12 (5,282 kN) is higher than specimen A22 (4,716 kN), and the difference is about 12%. From the comparison of ultimate load, it is shown that the columns filled with MDC series of A1 have relative higher ultimate load, which indicated that the influence of coarse aggregate on ultimate load is more obvious than fine aggregate in the MDC.
Moreover, in Figure 5, it is clear that the load-displacement curves of tested CFDGT columns have the same development tendency: in the first stage, the axial load almost increased linearly with the axial displacement until the ultimate load; in the second stage, the axial load dropped suddenly just when the ultimate load was reached, and the CFDGT columns were unable to bear further axial load, in addition, the rupture of outer GFRP tube was observed in the second stage. The load-displacement curves revealed that the CFDGT columns behaved as an obvious brittle behavior.
The load versus longitudinal and hoop strain curves of specimens A10 and A11 are compared in Figure 6A.
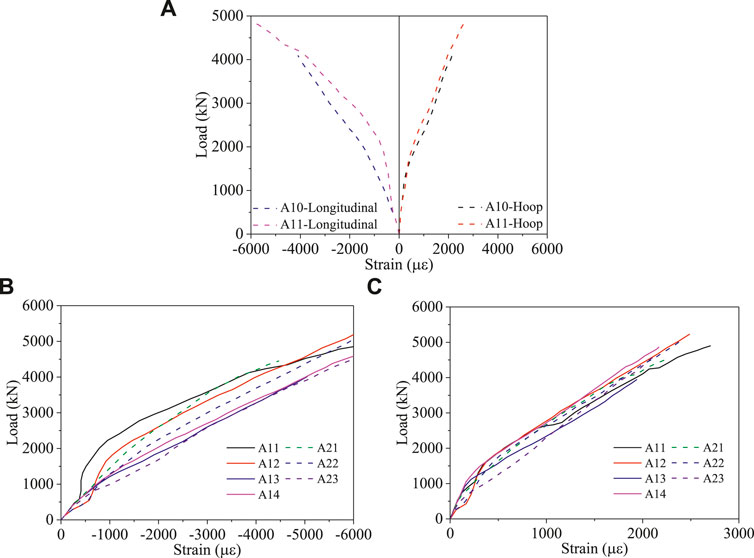
FIGURE 6. Load versus strain curves of specimens A1∼A14 and A21∼A23. (A) Load-strain curves of specimens A10 and A11. (B) Load-longitudinal strain curves. (C) Load-hoop strain curves.
In Figure 6A, for the longitudinal strain, the load versus strain curves of specimens A10 and A11 are almost the identical when load is below 700 kN, which indicated that the vibration of concrete has no influence on the axial deformation at the initial stage, however, as the axial load increase, the difference of load versus strain curves between specimens A10 and A11 become apparent. For specimen A11, the smaller value of longitudinal strain (the strain of A11 is compared with A10 at the same load level) revealed that the outer GFRP tube of A11 carried lower load than specimen A10, accordingly, the concrete of specimen A11 carried higher load than specimen A10, this phenomenon depicted that the elastic modulus of MDC of specimen A11 is larger than specimen A10, and it is also proved by the load-displacement curves.
Moreover, as can be seen in Figure 6A, the hoop strain increase slowly at the initial elastic stage, which is mainly because the confining effect of the outer GFRP tube is not significant at the initial elastic stage, however, when the axial compression load is larger than 30% of the ultimate load, the hoop strain increase faster due to the expansion effect of concrete. In Figure 6A, it can be seen that when the hoop strain is the same for specimens A10 and A11, the axial load carried by specimen A11 is slightly higher than specimen A10, which depicted that the concrete of specimen A11 is more compact than specimen A10.
The load versus longitudinal and hoop strain curves of specimens A1∼A14 as well as specimens A21∼A23 are compared in Figures 6B,C, respectively.
In Figure 6C, the hoop strain curves are almost identical when the axial load is lower than 200 kN, which depicted that the influence of concrete on the hoop deformation is almost negligible when the axial load is lower than 200 kN. However, when the axial load is higher than 500 kN, the hoop strain behaved an obvious turning due to the supporting effect of concrete to the GFRP tube, and the outer GFRP tubes also have an obvious confining effect on the core concrete. When axial load is higher than 2000 kN, the hoop strain of the GFRP tubes of all specimens increased parallelly, and the confining effect is more obvious for specimens with smaller slenderness ratios. Besides, it can be seen in Figure 6B that, specimens with smaller slenderness ratios will have smaller longitudinal strain at the same load level, which depicted that specimens with smaller slenderness ratios will get higher elastic stiffness, and the difference of longitudinal strain is mainly occurred at the load stage between 500 and 2000 kN, which is corresponding to the load versus hoop strain curves, and this phenomenon is also caused by the confining effect of GFRP tubes on the core concrete.
Generally, the specimens with concrete series of A1 have a relatively smaller longitudinal strain and hoop strain compared with specimens with concrete series of A2 at the same load level, hence, the specimens filled with MDC series of A1 have a relatively higher compactness compared with the specimens filled with MDC series of A2, and this phenomenon indicates that the coarse aggregate is more important than the fine aggregate in the MDC.
Moreover, the measured ultimate rupture strains along the hoop direction (i.e., εul-90 in Table 4) are taken as the averaged values of the strain gauges along the hoop direction, and the averaged strain values are summarized in Table 4. It can be found in Table 4 that the εul-90 is much smaller than the ultimate rupture strain along the hoop direction of the material properties (i.e. εuh in Table 3) of the outer GFRP tubs. Besides, for the measured average ultimate rupture strain along the longitudinal direction (i.e. εul-0 in Table 4), the absolute value of εul-0 is smaller than the overall strain of columns (i.e., δ/L in Table 4), hence, the overall strain of δ/L can’t be used to represent the real strain of the GFRP tubes at the point of ultimate load.
A finite element method was developed to analyze the concrete-filled double-skin GFRP tubular (CFDGT) columns. In the proposed FE model, the constitutive model of the GFRP confined concrete subjected to compression was acquired from GB National Standard (2020), and the fibre-reinforced composite damage model of Hashin’s criteria (Hashin and Rotem, 1973; Hashin, 1980) which was depicted in ABAQUS (2014) was used to model the inner and outer GFRP tubes. The 8-node linear brick element with reduced integration and hourglass control (C3D8R) was used to simulate the concrete, and the 4-node shell element with reduced integration (S4R) was used to model both the GFRP tube (Xu et al., 2021). Moreover, the ABAQUS/Standard with general static analysis step was used in the computational analysis, and the iteration solution technique of Newton-Raphson method was adopted in the analysis step (ABAQUS, 2014).
The surface-to-surface contact model (Han, 2016) was introduced in the FE model to simulate the interactions between the GFRP tubes and concrete: the hard contact behaviour in the normal direction and isotropic Coulomb frictions in the tangential direction with a frictional factor of 0.6 (Han, 2016) were adopted in the surface-to-surface interaction model.
For the constitutive law of concrete, the compressive stress-strain relationship provided by GB National Standard (2020) was adopted in the established FE model, and the σ-ε relationship of the concrete confined by composite tubes is expressed as follows:
Where,
R—Radius of the core concrete, and R=(Do-2to)/2;
fck—Characteristic compressive strength of concrete;
Eh—Elastic modulus in the hoop direction of the outer GFRP tube;
to—Thickness of outer GFRP tube;
fc'—Cylinder compressive strength of concrete;
Ec—Elastic modulus of plain concrete.
Moreover, due to symmetry of the geometry and loading, only half of a specimen was modelled in the proposed FE model, and two end plates (modelled as rigid bodies) were used to apply the axial compression load. Besides, the symmetry boundary conditions were applied on the symmetry plane, and two pinned boundary conditions were applied on the two endplates by two reference points which were coupled with the endplates. More detailed applications of the boundary conditions and axial compression load of the proposed FE model can is shown in Figure 7.
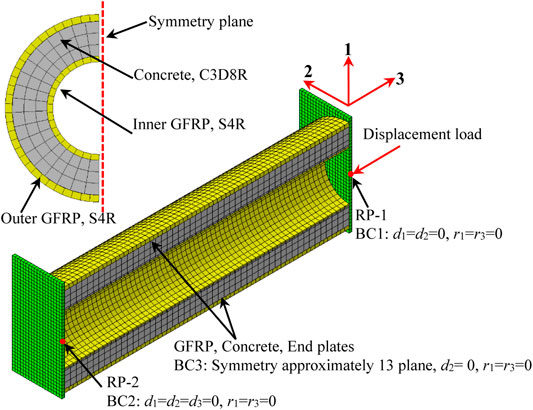
FIGURE 7. Schematic diagram of the proposed FE model.
The mesh sensitivity analysis of the cross-sectional and length directions was carried out. The modelling results indicated that the element size or number had little influence on the load-displacement curves as well as the ultimate load when the element size or number of the concrete, GFRP tubes were within the following ranges:
1) Concrete: The element number was no less than 16 along the semicircle direction, the element number was no less than five along the radial direction, and the element number was no less than 60 along the length direction.
2) GFRP tube: The GFRP tube was divided as a square grid, and the side length was no more than 20 mm.
Due to small difference between the cubic compressive strength of concrete series A1 and A2 (20.3 and 20.6 MPa), the average compressive strength (20.45 MPa) of the two series of concrete was selected to represent the concrete compressive strength of the tested columns to be validated.
Figure 8 shows the comparison of load-displacement curves between the test results and FE results. The signed solid lines represent the test results, while the smooth solid lines represent the FE results.
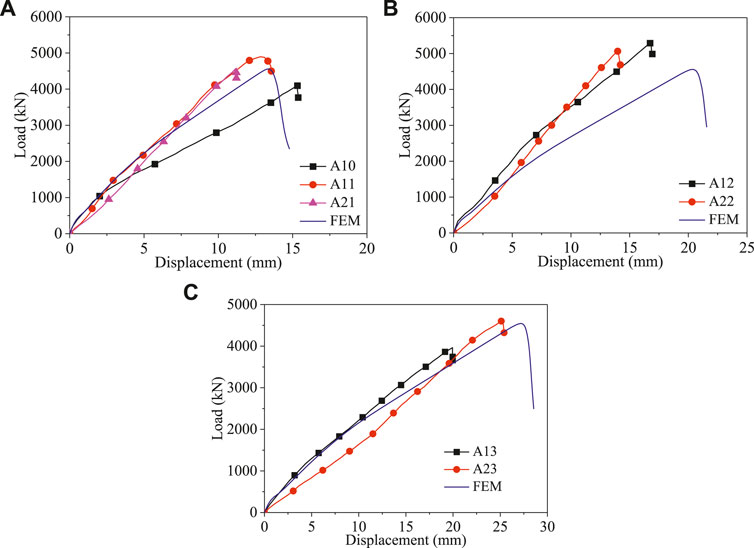
FIGURE 8. Comparison of load-displacement curves. (A) L = 1,000 mm (B) L = 1,500 mm (C) L = 2,000 mm.
Figure 9 shows the comparison of failure modes between the test results and FE results.
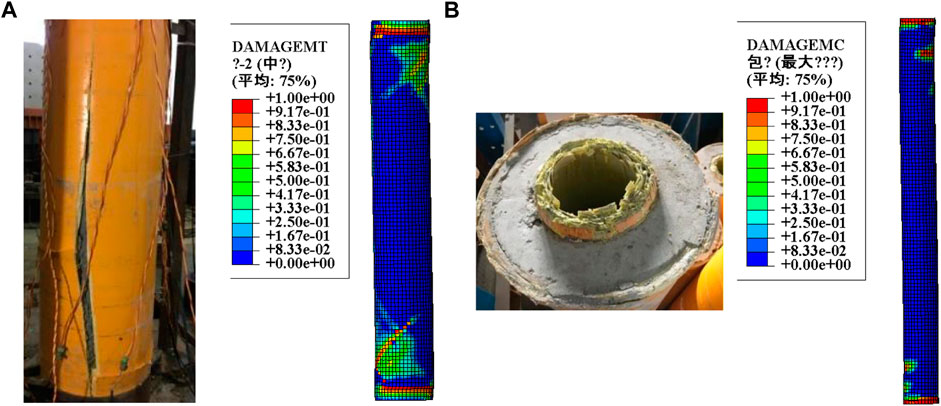
FIGURE 9. Comparison of failure modes. (A) Comparison of outer tube. (B) Comparison of inner tube.
It can be seen in Figures 8, 9 that the modelled load-displacement curves and failure modes are in good agreement with the test results. In Figure 8, the FE results truly reflect the steep drop section after ultimate load. Therefore, the comparison results have shown that the proposed FE model can predict the load-displacement curves and failure modes of the tested specimens.
Table 5 shows the comparison of the ultimate load between the test results and FE results.
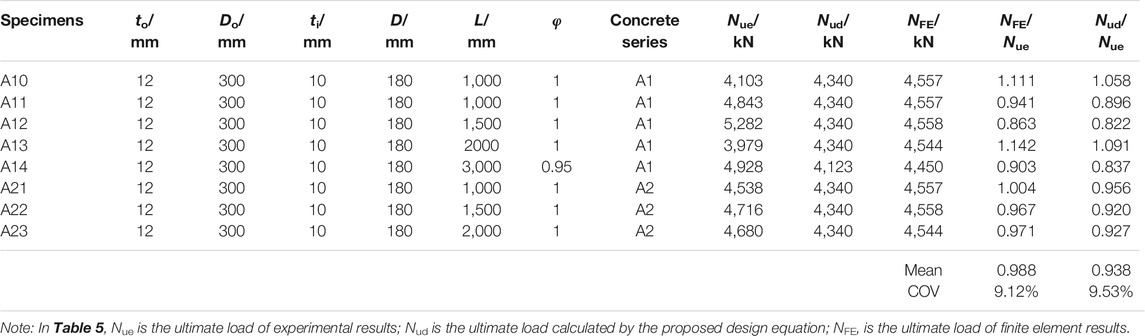
TABLE 5. Comparison of ultimate load.
As seen in Table 5, the average value of NFE/Nue is 0.988, and the corresponding coefficient of variation (Cov) is 9.12%, which shows that the modelled results are very close to the experimental results. Therefore, the comparison results of ultimate loads have shown that the developed FE model can also predict the ultimate loads of the tested specimens.
In conclusion, the proposed FE model can predict the load-displacement curves and ultimate loads accurately, hence, the proposed modelling methods and FE model in this paper can be used for the subsequent parametric analysis.
In this paper, the three parameters of hollow ratio (χ), length of columns (L), exterior diameter of outer tubes (Do) will be analyzed and discussed since they will significantly influence the axial compressive behavior of the CFDGT columns. In the parametric analysis, the average compressive strength (20.45 MPa) of the two series of concrete was also selected to represent the concrete compressive strength of the columns to be analyzed, and the thickness of the outer and inner GFRP tubes of all the columns to be analyzed are 12 and 10 mm.
The influence of the hollow ratio (χ) on the load-displacement curves of CFDGT columns is shown in Figure 10. In Figure 10, the specimens were named in the order of exterior diameter of outer GFRP tubes, exterior diameter of inner GFRP tubes and length of columns. For example, specimen named as “D300-d180-L1000” represent that the exterior diameter of the outer and inner GFRP tubes are 300 and 180 mm, respectively, and the length of the specimen is 1,000 mm. The naming rules is equally applied to the following analysis.
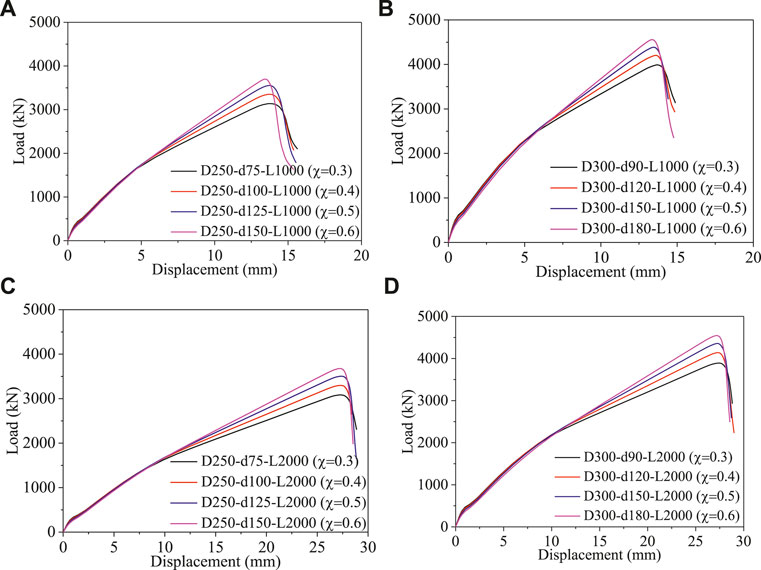
FIGURE 10. Influence of the hollow ration (χ). (A) Do = 250 mm, L = 1,000 mm. (B) Do = 300 mm, L = 1,000 mm. (C) Do = 250 mm, L = 2,000 mm. (D) Do = 300 mm, L = 2,000 mm.
In Figure 10, it can be seen that the hollow ratio (χ) has an obvious influence on the ultimate load, and specimens with larger hollow ratio will get higher ultimate load, which is mainly because specimens with larger hollow ratio (χ) will get higher area of inner GFRP tube, and the influence of the area of inner GFRP tube on ultimate load is higher than the area of concrete (the concrete compressive strength is 20.45 MPa, and it is relatively small). In addition, it can be seen in Figure 10 that the hollow ratio (χ) almost has no influence on the ultimate displacement (the displacement corresponding to the ultimate load).
The influence of the length of columns (L) on the load-displacement curves of CFDGT columns are shown Figure 11 (Do = 300 mm). In Figure 11, the specimens were grouped by the hollow ratio χ (χ varies from 0.3 to 0.6).
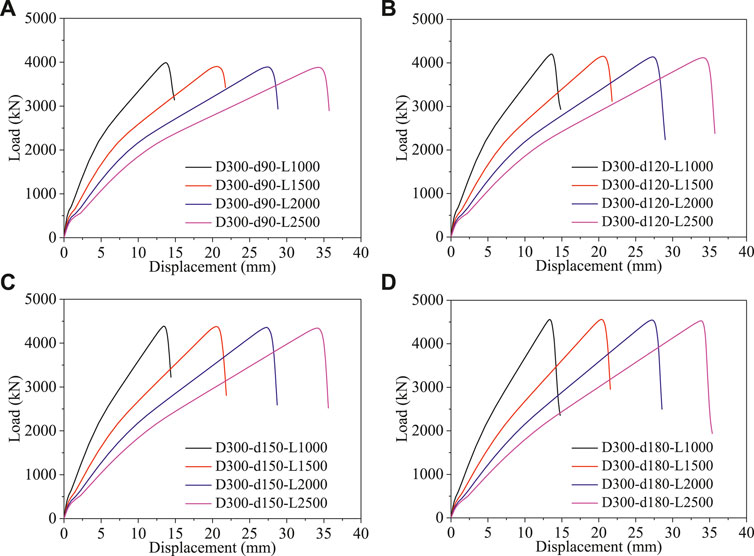
FIGURE 11. Influence of the length of columns (Do = 300 mm). (A) χ = 0.3. (B) χ = 0.4. (C) χ = 0.5. (D) χ = 0.6.
As can be seen in Figure 11, the length of columns (L) have a relatively moderate influence on the ultimate load of CFDGT columns regardless of the hollow ratio (χ). However, the length of columns (L) have an obvious influence on the ultimate displacement, which is mainly because the tensile failure strain of GFRP tube is the controlling parameter for the ultimate state of CFDGT columns (as discussed in Load-Strain Curves), and it is also the intrinsic characteristics and remained constant regardless of the length, hence the specimens with larger length (L) will get higher ultimate displacement.
The influence of the exterior diameter of outer tubes (Do) on the load-displacement curves of CFDGT columns are shown in Figure 12 (L = 2000 mm). In Figure 12, the specimens were grouped by the hollow ratio χ (χ varies from 0.3 to 0.6).
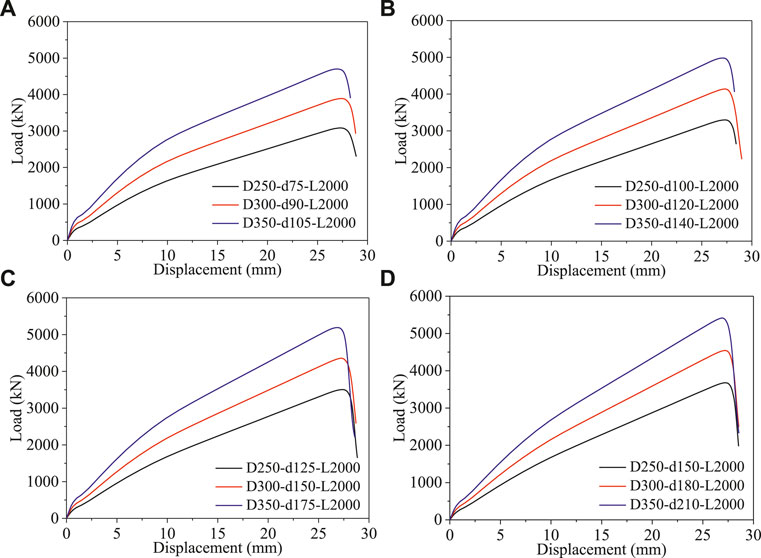
FIGURE 12. Influence of the exterior diameter of outer tubes (L = 2000 mm). (A) χ = 0.3. (B) χ = 0.4. (C) χ = 0.5. (D) χ = 0.6.
As can be seen in Figure 12, for specimens have the same hollow ratio (χ) and the same length of columns (L), the ultimate load and elastic compressive stiffness of CFDGT columns are influenced obviously by the exterior diameter of outer tubes (Do), and the larger the exterior diameter of outer tubes (Do), the higher the ultimate load and elastic compressive stiffness, which is mainly because the increase of area of concrete and GFRP tubes. Besides, it is apparent that the ultimate displacements are basically the same for specimens have the same length of columns (L), the reason is the same as the discussion in Figure 11.
Moreover, it can be concluded from Figure 12 that the ultimate displacement of CFDGT columns is only influenced by the length of columns (L), which is mainly because the ultimate displacement of CFDGT columns is determined by the GFRP tubes, and the tensile failure strain of GFRP tubes remained constant regardless of the length of columns (L), hence, the specimens have larger length will get higher ultimate displacement.
The design equations for calculating the ultimate loads of normal strength concrete filled double-skin GFRP tubular columns (CFDGT) which were proposed by Li et al. (2016) are expressed in Eqs 7–12.
Where,Np—Ultimate load of the CFDGT columns;Nco—Ultimate load of the outer GFRP tube and core concrete;Ni—Ultimate load of the inner GFRP tube;fun—Nominal ultimate compressive strength;Ac—Area of core concrete;Ao—Area of outer GFRP tube;ful,t—Longitudinal tensile strength of GFRP tube;ful,c—Longitudinal compressive strength of GFRP tube;fuh,t—Hoop tensile strength of GFRP tube;fc'—Cylinder compressive strength of concrete;fl—Hoop confining pressure provide by outer GFRP tube on core concrete;to—Thickness of outer GFRP tube;Do—Exterior diameter of outer GFRP tube;fav,i—Average compressive stress of GFRP tube;Ai—Area of inner GFRP tube;σres—Residual compressive stress of inner GFRP tube, and taken as 0 in this paper.
For the long CFDGT columns, the stability of the columns should be considered. In this paper, the stability factor of φ is referred from the GB National Standard (2015), hence, the ultimate load considering stability of the CFGST columns can be expressed as follows:
In Eq. 9, the expression of fun/fc’ was derived from the fitting results of the concrete filled GFRP tubular columns, and the influence of hollow ratio of χ was not considered in the expression. In this paper, the influence of hollow ratio χ on the ultimate load of CFDGT columns is verified in the section of parametric analysis, hence, the ultimate load captured by the proposed FE model was used to consider the influence of hollow ratio χ on the expression of fun/fc'.
According to the ultimate load captured by the proposed FE model (as shown in Table 6), the scatter diagram and its fitting results of fun/fc'-fl/fc’ relationship is given in Figure 13. It should be noted that the strait lines of the fitting results must be passed through the point of (0, 1) in Figure 13, because when the value of fl equals to 0, the value of the nominal ultimate compressive strength fun equals to fc’, hence the value of fun/fc’ equals to one when fl/fc’ equals to 0.
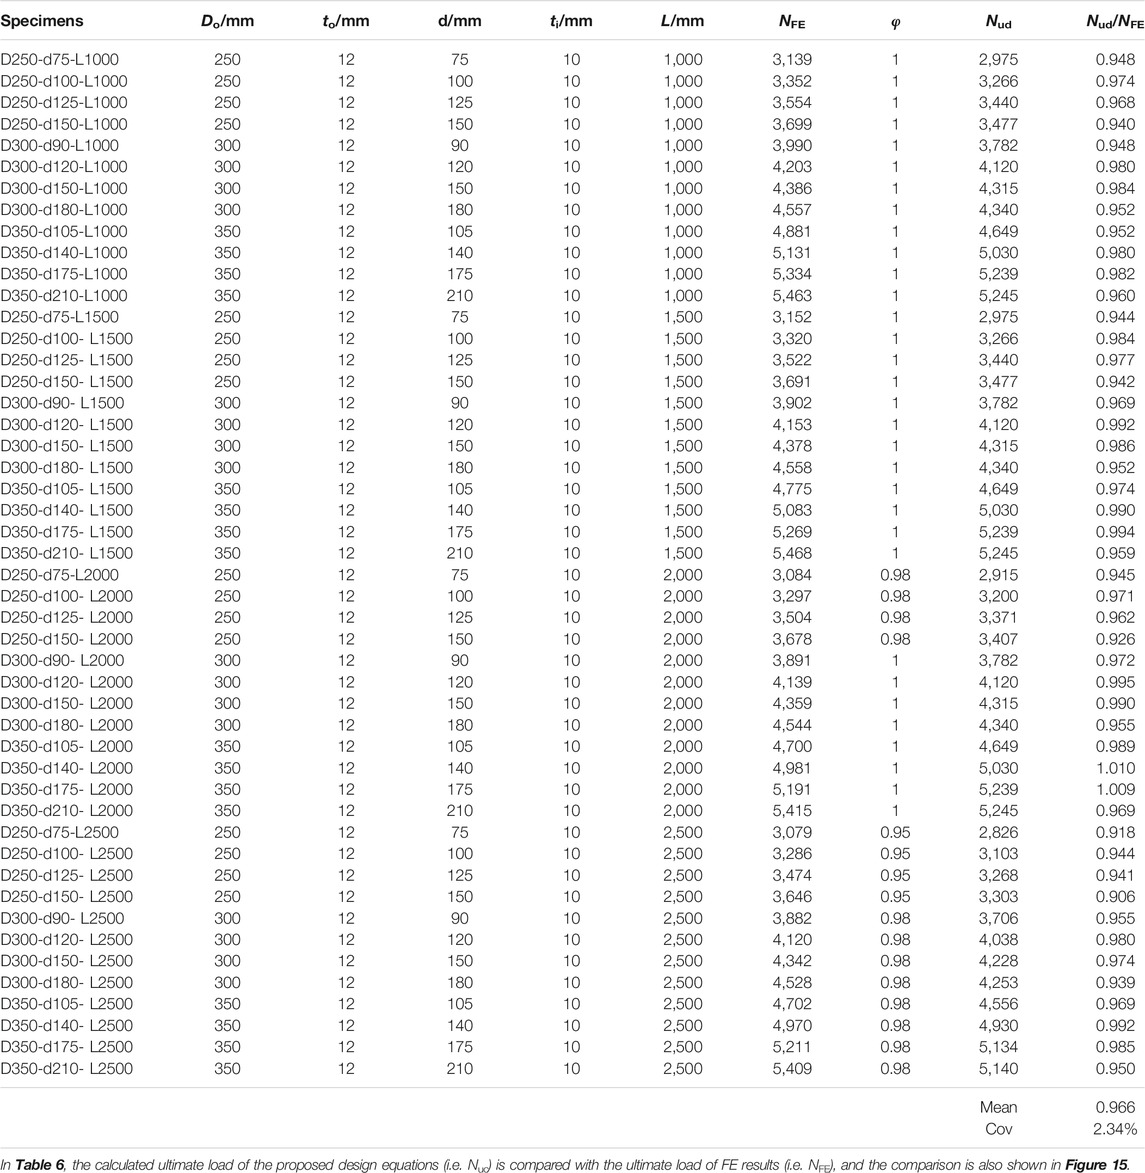
TABLE 6. Comparison between the calculated results and FE results.
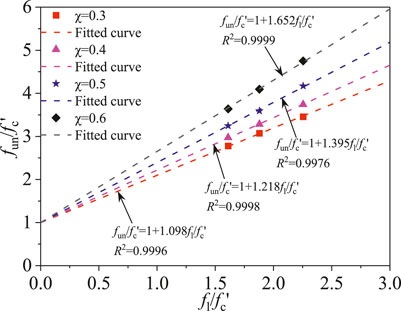
FIGURE 13. Scatter diagram and fitting results of fun/fc'-fl/fc'.
In Figure 13, it is found that the fun/fc'-fl/fc’ relationships are very close to linear behavior for specimens with various of hollow ratios, and for specimens with larger hollow ratio χ, the slope k of fun/fc'-fl/fc’ relationships become larger simultaneously, which means that the contribution for the ultimate load of the inner GFRP tubes become larger.
Figure 14 gives the scatter diagram and its fitting results between k and χ, as can be seen in Figure 14, the fitting result shows that there is a high linear relationship between k and χ.
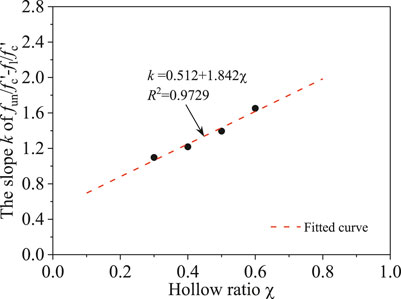
FIGURE 14. Relationship between k and χ
Hence, the relationship between the slope k of fun/fc'-fl/fc’ and the hollow ratio χ can be expressed as follows:
When calculating the ultimate load of CFDGT columns by Eq. 13, Eq. 14 should be used to replace Eq. 9 so as to consider the influence of hollow ratio χ.
In Table 5, the calculated ultimate load of Eq. 13 (i.e. Nud) is compared with the experimental ultimate load (i.e. Nue), it can be seen in Table 5 that the proposed design equations considering the influence of hollow ratio χ have a high accuracy (the average value of Nud/Nue is 0.938, with a corresponding Cov of 9.53%).
Table 6 summarized the comparison of ultimate load between the calculated results of the proposed design equations and the FE results.
From the comparison results shown in Table.6 and Figure 15, it can be seen that design equations which considered the influence of hollow ratio χ still have high accuracy and conservative results: in Table.6, the average Nud/NFE value is 0.966; in Figure 15, the maximum calculation error is controlled within 10%.
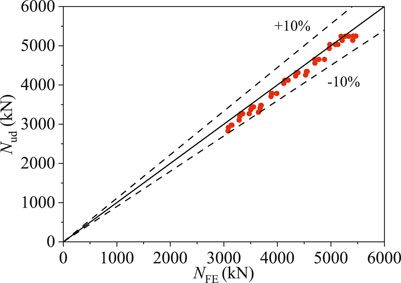
FIGURE 15. Comparison of ultimate load between calculated results and FE results.
In this paper, altogether eight magnetically-driven concrete (MDC) filled double-skin GFRP tube (CFDGT) columns were studied by axial compression test, the load-displacement curves, load-strain curves and ultimate load were acquired by the test, and a finite element model was established after the axial compression test so as to carry out parametric analysis, at last, the design equations considering the influence of hollow ratio for the ultimate load of CFDGT columns were proposed. Through the research work presented in this paper, the following conclusions can be drawn:
1) The Magnetic vibration is an effective way to enhance the compactness of concrete, and the influence of coarse aggregate is more obvious than fine aggregate in the MDC;
2) The rupture of GFRP tube in the hoop direction is the main control factor for the ultimate load of CFDGT columns, hence the influence of slenderness ratio on ultimate load is not obvious, and the load-displacement curves revealed that the CFDGT columns behaved as an obvious brittle behavior;
3) The confining effect of core concrete is more obvious for CFDGT columns with smaller slenderness ratios;
4) The hollow ratio has an obvious influence on the ultimate load of CFDGT columns, but it almost has no influence on the ultimate displacement; the length of columns has an obvious influence on the ultimate displacement of CFDGT columns, but it has a moderate influence on the ultimate load;
5) The proposed design equations can predict the ultimate load of CFDGT columns accurately and conservatively, and the maximum calculation error was controlled within 10%.
The original contributions presented in the study are included in the article/Supplementary Material, further inquiries can be directed to the corresponding authors.
X-SX: Conceptualization, Methodology, Validation, Resources, Data curation, Formal analysis, Investigation, Data curation, Visualization. JC: Conceptualization, Methodology, Validation, Resources, Data curation, Writing—original draft, Visualization, Supervision, Project administration, Funding acquisition. JW: Conceptualization, Methodology, Software, Validation, Formal analysis, Investigation, Resources, Data curation, Writing—original draft, Writing—review and editing, Visualization, Project administration, Funding acquisition. C-BL: Methodology, Software, Validation, Formal analysis, Visualization.
The research described in this paper was supported by the Key-Area Research and Development Program of Guangdong Province (2019B111107002), the National Natural Science Foundation of China (51908016/52078249).
The authors declare that the research was conducted in the absence of any commercial or financial relationships that could be construed as a potential conflict of interest.
All claims expressed in this article are solely those of the authors and do not necessarily represent those of their affiliated organizations, or those of the publisher, the editors and the reviewers. Any product that may be evaluated in this article, or claim that may be made by its manufacturer, is not guaranteed or endorsed by the publisher.
ABAQUS (2014). Abaqus 6.14. Abaqus Analysis User's Guide. Johnston, Rhode Island, United States: Simulia.
Abdalla, K. M., Al-Rousan, R., Alhassan, M. A., and Lagaros, N. D. (2019). Finite-element Modelling of concrete-filled Steel Tube Columns Wrapped with CFRP. Proc. Inst. Civil Engineers-Structures Buildings 173 (11), 844–857. doi:10.1680/jstbu.19.00011
Al-Rousan, R. (2020a). Behavior of CFRP Strengthened Columns Damaged by thermal Shock. Mag. Civil Eng. 97 (5), 1–12. doi:10.18720/MCE.97.8
Al-Rousan, R. (2020b). Behavior of Circular Reinforced Concrete Columns Confined with CFRP Composites. Proced. Manufacturing 44, 623–630. doi:10.1016/j.promfg.2020.02.247
Al-Rousan, R. Z., and Barfed, M. H. (2019). Impact of Curvature Type on the Behavior of Slender Reinforced concrete Rectangular Column Confined with CFRP Composite. Composites B: Eng. 173, 106939. doi:10.1016/j.compositesb.2019.106939
Al-Rousan, R. Z., and Issa, M. A. (2018). Stress-strain Model and Design Guidelines for CFRP-Confined Circular Reinforced concrete Columns. Polym. Compos. 39 (8), 2722–2733. doi:10.1002/pc.24262
ASTM (2016). ASTM D2290-12. Standard Test Method for Apparent Hoop Tensile Strength of Plastic or Reinforced Plastic Pipe. West Conshohocken, PA: American Society for Testing Materials.
ASTM (2014). ASTM D3039/D3039M-14. Standard Test Method for Tensile Properties of Polymer Matrix Composite Materials. West Conshohocken, PA: American Society for Testing Materials.
Chen, J., Wang, J., and Jin, W.-l. (2016). Study of Magnetically Driven concrete. Construction Building Mater. 121 (9), 53–59. doi:10.1016/j.conbuildmat.2016.05.152
Faggi, B. A. L., and Ozbakkaloglu, T. (2013). Compressive Behavior of Aramid FRP–HSC–Steel Double-Skin Tubular. Construction Building Mater. 48, 554–565. doi:10.1016/j.conbuildmat.2013.07.029
Fahmy, M. F. M., and Wu, Z. (2010). Evaluating and Proposing Models of Circular concrete Columns Confined with Different FRP Composites. Composites Part B: Eng. 41, 199–213. doi:10.1016/j.compositesb.2009.12.001
Fam, A. Z., and Rizkalla, S. H. (2001). Behavior of Axial Loaded concrete-filled Circular Fiber-Reinforced Polymer Tubes. ACI Struct. J. 98 (3), 280–289. doi:10.14359/10217
GB National Standard (2020). GB 50608-2020. Technical Standard for Fiber Reinforced Polymer (FRP) in Construction. Beijing, China: China Planning Press. [in Chinese].
GB National Standard (2015). GB50010-2010. Code for Design of concrete Structures. Beijing, China: China Architecture & Building Press. [in Chinese].
Han, L. H. (2016). Concrete Filled Steel Tubular Structures-Theory and Practice. Third Edition. Beijing: Science Press. [in Chinese].
Hashin, Z. (1980). Failure Criteria for Unidirectional Fiber Composites. J. Appl. Mech. 47, 329–334. doi:10.1115/1.3153664
Hashin, Z., and Rotem, A. (1973). A Fatigue Failure Criterion for Fiber Reinforced Materials. J. Compos. Mater. 7, 448–464. doi:10.1177/002199837300700404
Issa, M. A., Alrousan, R. Z., and Issa, M. A. (2009). Experimental and Parametric Study of Circular Short Columns Confined with CFRP Composites. J. Compos. Constr. 13 (2), 135–147. doi:10.1061/(asce)1090-0268(2009)13:2(135)
Kawamura, M., Torii, K., Hasaba, S., Nicho, N., and Oda, K. (1982). Applicability of Basic Oxygen Furnace Slag as a concrete Aggregate, ACI. SP 2, 1123–1141.
Li, Y.-f., Yao, Y., and Wang, L. (2009). Recycling of Industrial Waste and Performance of Steel Slag green concrete. J. Cent. South. Univ. Technol. 16, 768–773. doi:10.1007/s11771-009-0128-x
Li, Y. L., Zhao, X. L., Singh, R. K. R., and Al-Saadi, S. (2016). Experimental Study on Seawater and Sea Sand concrete Filled GFRP and Stainless Steel Tubular Stub Columns. Thin-Walled Structures 106, 390–406. doi:10.1016/j.tws.2016.05.014
Maslehuddin, M., Sharif, A. M., Brahim, S. M., and Barry, M. S. (2003). Comparison of Properties of Steel Slag and Crushed limestone Aggregate concrete. Construction Building Mater. 17 (8), 105–112. doi:10.1016/s0950-0618(02)00095-8
Montgomery, D. G., and Wang, G. (1991). Instant-chilled Steel Slag Aggregate in concrete - Strength Related Properties. Cement Concrete Res. 21 (6), 1083–1091. doi:10.1016/0008-8846(91)90068-s
Ozbakkaloglu, T., Lim, J. C., and Vincent, T. (2013). FRP-confined concrete in Circular Sections: Review and Assessment of Stress-Strain Models. Eng. Structures 49, 1068–1088. doi:10.1016/j.engstruct.2012.06.010
Qasrawi, H., Shalabi, F., and Asi, I. (2003). Use of Low CaO Unprocessed Steel Slag in concrete as fine Aggregate. Construction Building Mater. 23 (6), 1118–1125. doi:10.1016/j.conbuildmat.2008.06.003
Teng, J. G., Yu, T., and Wong, Y. L. (2004). “Behavior of Hybrid FRP–concrete–steel Double-Skin Tubular Columns,” in The 2nd international conference on FRP composites in civil engineering-CICE 2004, Adelaide, Australia, December 2004. Editor R. Seracino (Boca Raton, Florida, United States: CRC Press), 811–818.
Teng, J. G., and Lam, L. (2004). Behavior and Modeling of Fiber Reinforced Polymer-Confined concrete. J. Struct. Eng. 130, 1713–1723. doi:10.1061/(asce)0733-9445(2004)130:11(1713)
Wang, G. (2010). Determination of the Expansion Force of Coarse Steel Slag Aggregate. Construction Building Mater. 24, 1961–1966. doi:10.1016/j.conbuildmat.2010.04.004
Wang, Q., Yan, P., Yang, J., and Zhang, B. (2013). Influence of Steel Slag on Mechanical Properties and Durability of concrete. Construction Building Mater. 47, 1414–1420. doi:10.1016/j.conbuildmat.2013.06.044
Keywords: magnetically driven concrete, double-skin GFRP tubes, vibration effect, finite element model, ultimate load
Citation: Xie X-S, Chen J, Wang J and Liu C-B (2022) Behavior of Magnetically-Driven Concrete (MDC) Filled Double-Skin GFRP Tubes (CFDGT) Under Axial Compression. Front. Built Environ. 8:836251. doi: 10.3389/fbuil.2022.836251
Received: 15 December 2021; Accepted: 24 January 2022;
Published: 01 March 2022.
Edited by:
Yongliang Wang, China University of Mining and Technology, ChinaReviewed by:
Chiara Bedon, University of Trieste, ItalyCopyright © 2022 Xie, Chen, Wang and Liu. This is an open-access article distributed under the terms of the Creative Commons Attribution License (CC BY). The use, distribution or reproduction in other forums is permitted, provided the original author(s) and the copyright owner(s) are credited and that the original publication in this journal is cited, in accordance with accepted academic practice. No use, distribution or reproduction is permitted which does not comply with these terms.
*Correspondence: Ju Chen, Y2VjakB6anUuZWR1LmNu; Jun Wang, d2FuZ2p1bjEyM0BzenUuZWR1LmNu
Disclaimer: All claims expressed in this article are solely those of the authors and do not necessarily represent those of their affiliated organizations, or those of the publisher, the editors and the reviewers. Any product that may be evaluated in this article or claim that may be made by its manufacturer is not guaranteed or endorsed by the publisher.
Research integrity at Frontiers
Learn more about the work of our research integrity team to safeguard the quality of each article we publish.