 Si Han Li
95% of researchers rate our articles as excellent or good
Learn more about the work of our research integrity team to safeguard the quality of each article we publish.
Find out more
ORIGINAL RESEARCH article
Front. Built Environ. , 08 March 2022
Sec. Wind Engineering and Science
Volume 8 - 2022 | https://doi.org/10.3389/fbuil.2022.829533
The design life can be longer than 50 years for critical structures or infrastructures and shorter than 50 years for non-residential structures or construction periods. Some building codes provide methods to derive factors for adjusting the design wind speeds for construction periods. Eurocode 1 provides a probability factor for calculating the design wind speeds for a specific return period regulated for a construction period of less than 1 year. The Australian ABCB Temporary Structures standard provides design wind speed for construction using a different assumption. The ASCE 37 in the USA provides design wind speed reduction factors for a design life less than 5 years by maintaining the probability of exceedance of the factored wind load for 50-year design life the same for a shorter design life. These approaches can result in different results and deserve some comparisons. The present study included another method that maintains the structural reliability of the non-standard design life the same as the structural reliability for the design life of 50 years. The derived factors for a design life shorter than 50 years using these methods were compared considering the Canadian wind climates. The calculated design wind speed adjustment factors for design life longer than 50 years were evaluated using various techniques and compared with the commonly used importance factors. The present study also characterized the directionality and seasonality of the Canadian wind climates.
Many building codes have adopted load and resistance factor design (LRFD) criteria for the ultimate state design. The combination of the dead load and wind load effect can be the governing design condition. An exceedance probability of 0.02 is widely accepted to evaluate the annual maximum design wind speed, often communicated as the 50-year return period in a stationary climate. The design life of 50 years is typically assumed to calculate the load factor (e.g., 1.4 in National Building Code of Canada, National Research Council of Canada, 2005; National Research Council of Canada, 2010 and National Research Council of Canada, 2015) or determine the ultimate return period (e.g., 700 years in American Society of Civil Engineers, ASCE, 7-16, 2016).
Recent studies (O’Connor 2004; Aksözen et al., 2017; Cao et al., 2019) demonstrated that actual service lives of buildings can vary significantly from about 20 years to more than 100 years. The sustainability and environmental footprints may require a more robust design life in future design practices.
The return period of design load effects may not necessarily be the same as the design life when a structural design prefers a different design life (e.g., 5 years or 100 years). A shorter design life can be desired for specific conditions, including non-residential structures and facilities, and construction periods. In these conditions, applying the design wind loads for a design life of 50 years can be over-conservative, uneconomic, and create unnecessary environmental footprints. More extended design life can be desired for critical infrastructures (e.g., bridges and nuclear facilities) or from a more sustainable perspective. Alternatively, with the same design life of 50 years, a higher reliability target can be chosen by applying an importance factor or using a design wind speed associated with a higher importance level, communicated as the risk category in some codes.
Some standards provide factors to reduce the design wind speeds for a construction period, which is often defined to be less than 1 year. Three different approaches have been implemented in various standards. The Eurocode 1/BS EN 1991-1-4 (2005) provides a probability factor for adjusting the design wind speed for a return period different from 50 years. The BS EN 1991-1-6 (2005) provides the appropriate return period for a construction period shorter than 1 year. The Australian standard ABCB Temporary Structures Standard (2015) provides wind speed reduction factors for different wind regions. The approach used for deriving these factors was given in Wang and Pham (2011), which maintains the probability of exceedance on an annual basis within 1 year. The ASCE 37 in the USA provides design wind speed reduction factors derived from the study by Boggs and Peterka (1992) and Rosowsky (1995). Their study adopted an assumption that maintains the total probability of the exceedance of the factored wind load in a design life of 50 years the same for a shorter design life. Few past research had compared these three methods. Therefore, the present study summarizes and compares these three methods in Canadian wind climates in the following sections.
An importance factor of a lower importance level can often be used for non-residential structures and facilities. However, most standards do not explicitly define the appropriate design lives of these structures and the associated factors with different design lives. For a construction period of less than 1 year, the wind speed reduction factor may not apply to a non-residential structure with a design life longer than 1 year. The methods mentioned previously mainly target the probability of exceedance of the wind hazard but do not target specific structural reliability, which is the basis for modern codes to derive the load factors and evaluate the appropriate risk level. This observation applies to longer design life. Therefore, the present study will adopt the probability models and their parameters used to develop the wind load factors in National Research Council of Canada (2015) to derive the appropriate factors for different design lives in Canadian wind climates. Design wind speed adjustment factors for a construction period of less than 1 year are to be derived using various methods in Canadian wind climates. General factors for extreme wind seasonality and directionality in Canadian climate will also be derived.
This study is organized as follows. The second section reviews the approaches used in various standards for calculating the wind speed reduction factors for a construction period of less than 1 year. These approaches are to be used to calculate wind speed reduction factors in the Canadian wind climate. The third section investigates the design wind speed for both shorter design lives for non-residential structures and longer design lives for permanent structures. An approach will be developed to maintain the same target structural reliability index in non-standard design lives. The fourth section discusses the annualized risk level. The last section summarizes the findings.
Approaches have been provided in various building codes and standards to derive the design wind speeds for a construction period shorter than 1 year. In Eurocode 1/BS EN 1991-1-4 (2005), the design wind speed for a return period different from the 50 years can be derived using a probability factor, cprob. The expression of cprob is listed in Table 1. BS EN 1991-1-6 (2005) provides the return period for calculating the cprob for design life shorter than 50 years. The national annex of UK to Eurocode 1, i.e., BS NA EN 1991-1-4 (2010) and BS NA EN 1991-1-6 (2005), refers to cprob and the return periods for a construction period provided in the Eurocode 1. The same factor but labeled as cr is defined in the Italian code CNR-DT 207 R1/2018 (2018) and presented in Table 1.
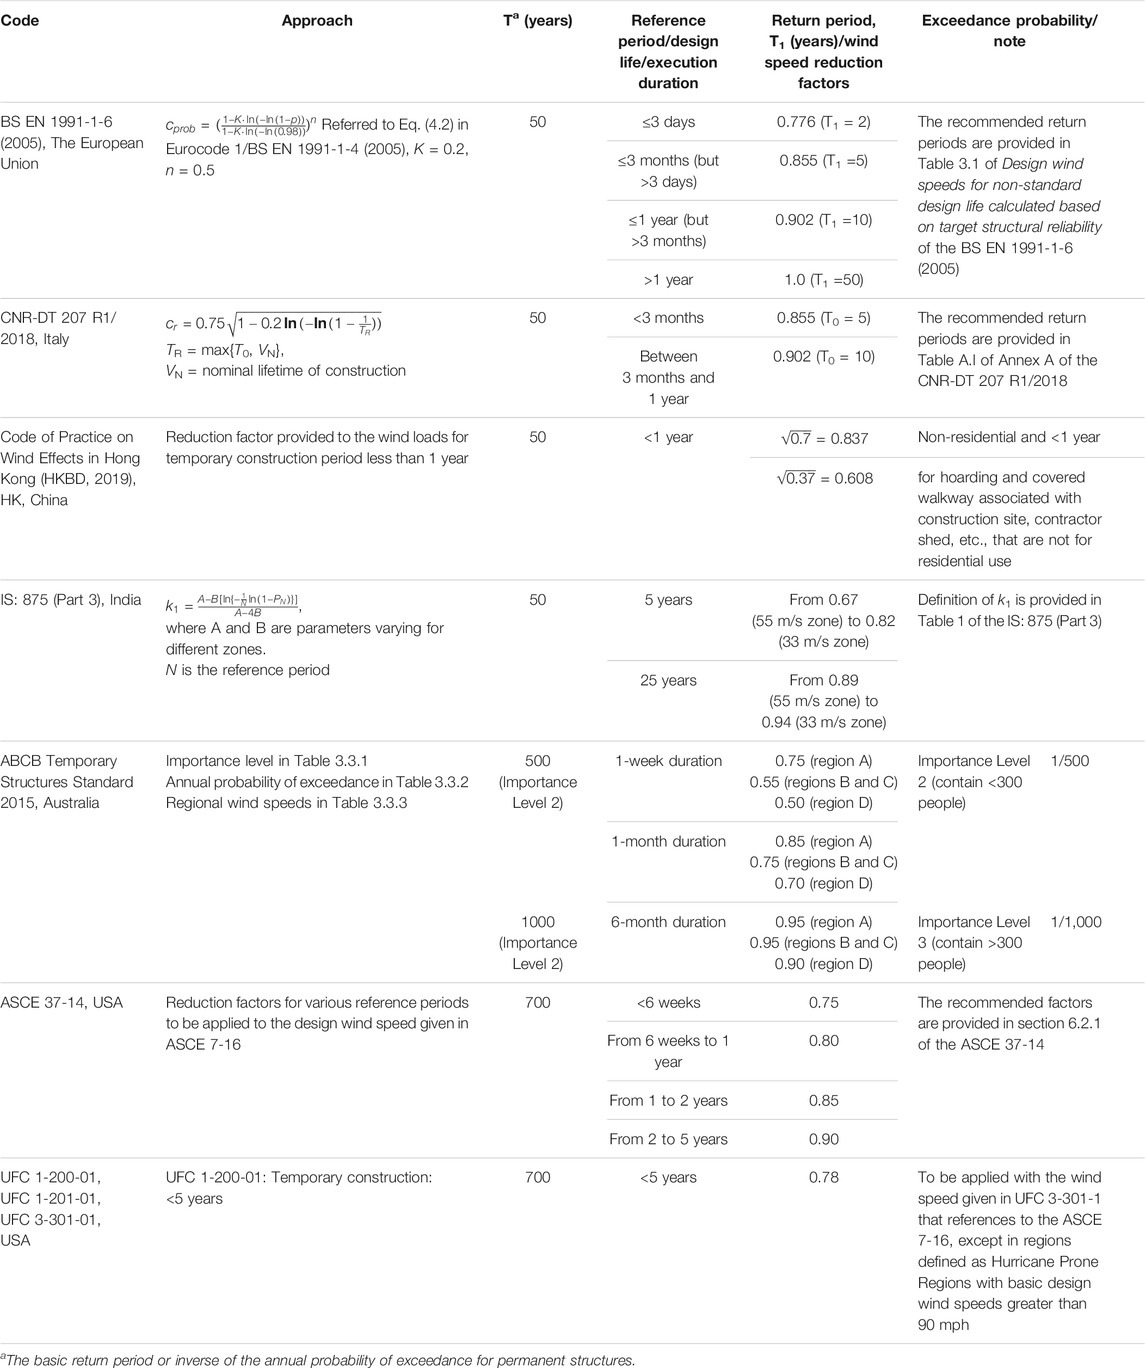
TABLE 1. Summary of basic design wind speed adjustment factor provided in various codes and standards.
The probability factor is a ratio of return period wind pressure or speed for a given return period to the 50-year return period wind pressure or wind speed. The appropriate return periods for various construction periods less than 1 year are provided in the Eurocode and adopted in various national Annexes, such as BS NA EN 1991-1-6 (2005) in the UK and CNR-DT 207 R1/2018 (2018) in Italy. The 2-year, 5-year, and 10-year return periods are required to calculate the cprob for a construction period less than 3 days, between 3 days and 3 months, and between 3 months and 1 year, respectively. No reduction to the design wind speed is allowed for a construction period longer than 1 year. In other words, the cprob = 1 for a construction period longer than 1 year. A constant value of K = 0.2, as shown in Table 1, is given in the Eurocode 1, which corresponds to a coefficient of variation (CV) of 0.23 for the annual maximum extreme wind pressures.
The expression of cprob or cr indicates that the Gumbel distribution is used to fit extreme wind pressures or wind speed. The inverse of the K, i.e., 5, is the product of the mode and dispersion of the Gumbel distribution. Eurocode 1 does not explain how this constant K value was derived. However, a study by Cook and Mayne (1979) provided the product of mode and dispersion of the Gumbel distribution for annual maximum wind speeds for 66 UK stations (shown in figure 3 of their study). Their analysis demonstrates that the mean value of the product of the mode and dispersion of the Gumbel distribution is equal to 10 (about 5 when wind pressures are considered). Therefore, the cprob factor given in Eurocode 1 seems to be based on the average wind climate of the UK, which might be representative of the Northern European wind climate. It is noted that the CNR-DT 207 R1/2018 (2018) uses different formulas for calculating the cr for return period greater than 50 years or less than 5 years.
When a site-specific wind climate is considered, the K value will be different and can be expressed by
where T is the return period, n = 1 when wind speeds are fitted into a Gumbel distribution, n = 0.5 when wind pressures are fitted into a Gumbel distribution, and CV is the coefficient of variation of extreme wind speeds or extreme wind pressures corresponding to the selected n value.
As no references are provided in the Eurocode 1 or other national Annexes, it is unclear how these return periods were determined for the different construction periods. The 10-year return period is often used to determine the serviceability limit design, given that the 50-year return period is used for the ultimate limit state design. It seems the 10-year return period is assigned for the construction period between 3 months and 1 year. The return period is halved for a construction period between 3 days and 3 months and is further halved for a period less than 3 days.
The Australian standard, ABCB Temporary Structures Standard (2015), provides reduction factors to basic design wind speeds for temporary structures with their execution period of less than 1 year for different wind speed regions. These factors are listed in Table 1. The method used to derive these reduction factors was given in Wang and Pham (2011). Their approach maintains the exceedance probability of the ultimate return period wind speed on an annual basis for a shorter epoch less than 1 year. This method appears different from those implemented in EN 1991-1-6 (2005). The following formula was given in Wang and Pham (2011) to calculate these reduction factors:
where
The key assumption of Wang and Pham’s approach is to maintain the 1/R for a short period. In other words, let
The equivalent return period or annual exceedance probability for different temporary periods can be derived when their approach is considered. Given the annual exceedance probability of 1/50, the equivalent return period for a temporary period less than 1 year considering Wang and Pham’s approach can be derived by
where T is the equivalent return period, and m has the same definition as Eq. 2.
Several T for various temporary periods less than 1 year were calculated and are presented in Table 4, which includes the calculated wind speed reduction factors using other approaches and will be discussed in the next section.
It should be noticed that the annual exceedance probability of 0.02 stems from the assumption of the nominal design life of 50 years and the average occurrence of one failure event within this nominal design life, i.e., 1/50. The annual exceedance probability for the ultimate design wind speed, e.g., 1/500, or the ultimate return period, is often derived by maintaining the ultimate design wind speed the same as the factored design wind speed, i.e.,
ASCE 37-14 (2015) provides design wind speed reduction factors for a construction period shorter than 5 years. These factors were derived based on the studies by Boggs and Peterka (1992) and Rosowsky (1995). Their approach maintains the total probability of exceedance of the factored wind load in a 50-year design life for a shorter design life. Rosowsky’s study used a few hundred meteorological stations in the USA to calculate the wind speed reduction factors, consequently used to derive an envelope curve for various short design lives/temporary construction periods. The envelope curve of the reduction factors represents the least reduction for a given short design life/temporary construction period among all sites. The CV of the extreme wind climate derived based on ASCE 7-16 design wind speed maps of the USA ranges from about 0.10 to about 0.35.
In Rosowsky (1995), the exceedance probability of the factored design wind loads for a design life of 50 years was maintained for a shorter design life. The exceedance probability of the factored wind speeds during a design life can be expressed by
where
The design wind speed for a design life of Ts can then be expressed by
where F (·) denotes the probability distribution, and
The equivalent return period derived from Eq. 5 will depend on the specific wind climate. Although the average wind climate can derive the equivalent return periods, this approach does not consider the average wind climate but uses the least reduction factors for the entire region.
The Indian building code IS 875 (Part 3) (2005) provides a k1 factor to adjust the design wind speed for the design life of 5 and 25 years but does not provide factors for a period less than 1 year. This factor is calculated using the same approach as the (ASCE 7-14, 2005) but for regional specific average wind climates. The formula of k1 is presented in Table 1.
The Code of Practice on Wind Effects in Hong Kong, China (HKBD, 2019) provides a design wind load reduction factor of about 0.7 (shown in Table 1) for a temporary construction period of less than 1 year. The corresponding reduction factor for the design wind speed is about 0.84. The code also provides a return period wind load factor, Sr, of 0.25 for the 1-year return period and 0.55 for the 10-year return period. Therefore, the 0.84 wind speed (or 0.7 for wind pressure) reduction factor associates with a return period of about 20 years.
The standards UFC 1-200-01 (2019), UFC 1-201-01 (2013), and UFC 3-301-01 (2019) in the USA define the design life of the temporary, semi-permanent, and permanent structure but only provides a single reduction factor for a design life shorter than 5 years. The factor of 0.78 (in Table 1) is permitted to be applied to the basic wind speed defined in UFC 3-301-1, except for the hurricane-prone regions where the basic wind speed is greater than 90 mph. The structures and facilities specified in these UFC codes can differ from normal residential structures as other codes.
Besides construction periods, both Eurocode 1 and UFC code recommends other design lives, listed in Table 2. The Eurocode 1 suggests a design life of 10 years for temporary structures, 10–30 years for replaceable structural parts, 15–25 years for agricultural and similar structures, 50 years for building structures and other common structures, and 120 years for monumental building structures, highway bridges, and other civil engineering structures. The UFC code defines a design life shorter than 5 years for temporary construction, 5–10 years for semi-permanent construction, 10–25 years for semi-permanent construction with maintenance and upkeep of critical building systems, and more than 25 years for permanent construction. The cprob can be calculated for the design lives provided in Eurocode 1. However, the UFC code does not provide a formula to calculate the design wind speed adjustment factor for the provided return periods.
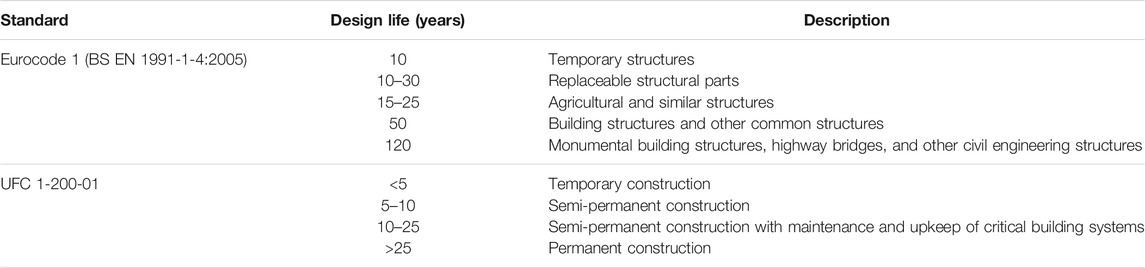
TABLE 2. Design life provided in Eurocode 1 (BS EN 1991-1-4:2005) and UFC 1-200-01.
The previous section shows that the wind speed reduction factors given in different codes can differ significantly. Some are based on a consistent statistical target value, and others might be determined with more conservative assumptions. For calculating the cprob and factors based on Wang and Pham’s approach, the average wind climate of Canada is required. Deriving the regional or envelope factors using Rosowsky’s method requires many meteorological stations across Canada.
The design wind pressure defined in NBCC is the product of basic wind pressure, exposure factor, topographic factor, gust effect factor, and pressure coefficient. The wind load factor
The Gumbel distribution can be expressed by
where u and a are the location parameter and scale parameter, respectively.
The CV of the extreme wind speeds can be calculated from the fitted Gumbel distribution parameters by
The wind speed reduction factor, rf =
where rT = 50/Ts, γ
Equation (8) indicates that the rf decreases with the CV increase. The calculated rf values for various CVs are illustrated in Figure 1.
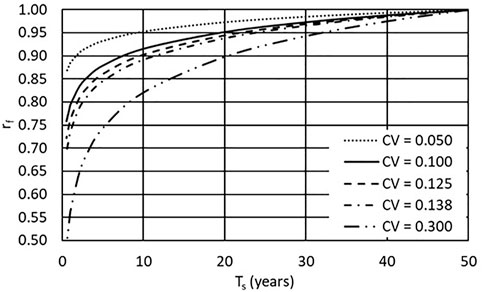
FIGURE 1. rf varies with Ts for selected CV values.
The present study calculated the CV values of the annual maximum wind speeds from 235 meteorological stations across Canada obtained from Environmental and Climate Change Canada (https://climate.weather.gc.ca/historical_data/search_historic_data_e.html). Each of these stations has more than 20 years of record. The calculated CV ranges from 0.063 to 0.30, with a mean value of 0.138 (the same as observed in Hong et al., 2014). Figure 2A presents the geographical locations of these stations as circles.
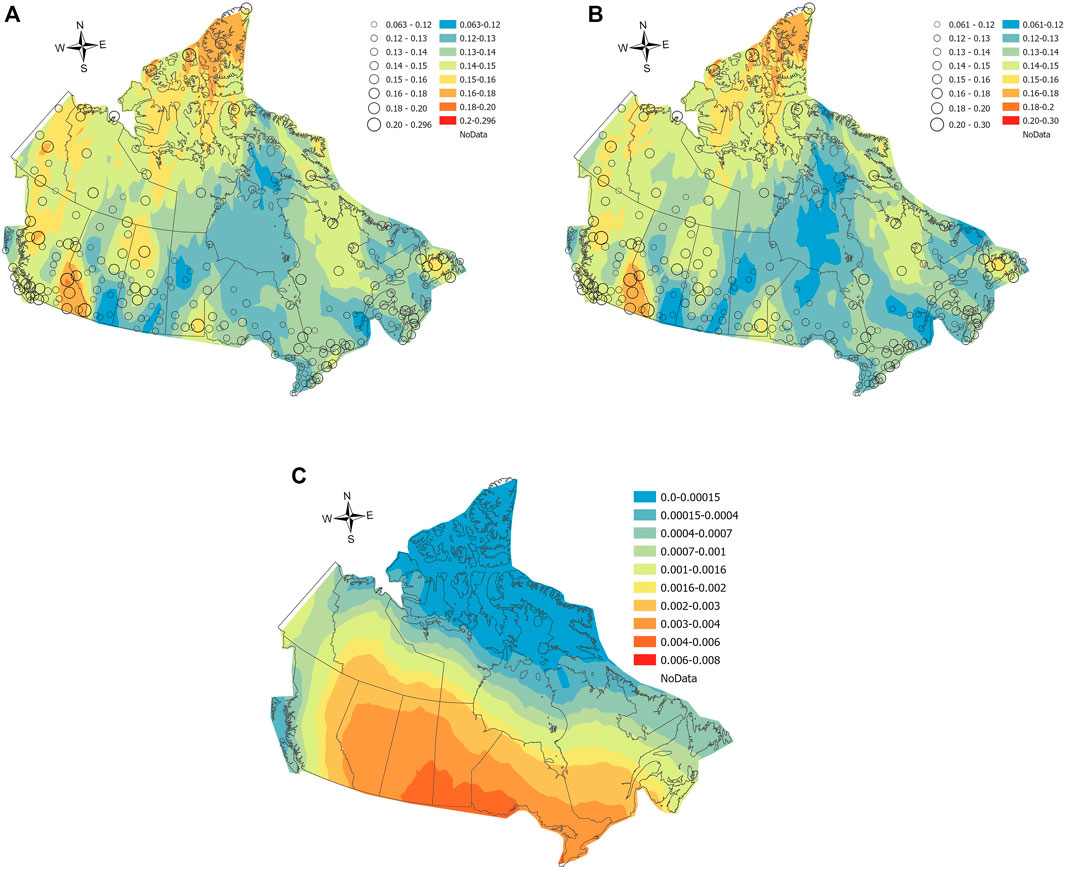
FIGURE 2. CV of annual maximum wind speeds for (A) the mixed wind climate, (B) non-thunderstorm wind climate, and the statistics of the thunderstorm records calculated based on HLY01 for (C) probabilities of occurrence for a given hour.
The contour maps for CV values shown in Figure 2A are developed based on the mixed wind climates. All contour maps shown in this study were created using a spatial interpolation technique known as the Ordinary Kriging method (Johnston et al., 2003) in ArcGIS (Esri Inc, 2020).
Tang (2016) included meteorological stations with more than 10 years but less than 20 years of records. The CVs for stations with more than 10 years of records are within the same range as those reported in Hong et al. (2014) but have a smaller mean value of 0.125. Tang’s study shows that the small sample size of records leads to either smaller or larger CV values. However, their study showed that more stations with short records produce smaller CV values. Therefore, their study calculated a smaller mean CV value across Canada. To reduce the sample size effect, Tang’s study carried out the region of influence (ROI) analysis (Burn 1990) by incorporating adjacent stations with statistical similarities to the main station’s wind climate. Their study showed that the range of CV values calculated from the ROI analysis was between 0.11 and 0.30, with a mean value of 0.141. The spatial distribution of CV from Tang’s study is similar to the present study. Therefore, the following analyses used the CV values derived based on the 235 stations. Using the statistics calculated based on stations having more than 20 years of data also considered that a minimum of 20 years of data is required to provide a reliable estimate of return period wind speeds (Hong et al., 2016; Li 2018).
The design life, Ts, of 10, 5, 2, 1, 0.5 years, and 6 weeks were considered. Figure 3 presents the calculated rf for these design lives. The large circle represents less reduction, while the small circle represents more reduction. As shown in Figure 3, rf values appear in geographical variations, especially for smaller Ts. This variation is caused by the spatial variation of the CV as shown in Figure 2. The maximum rf value for Ts ≤1 year associates with the smallest CV value, which appears in Canada’s most northern region, as shown in Figures 2 and 3.
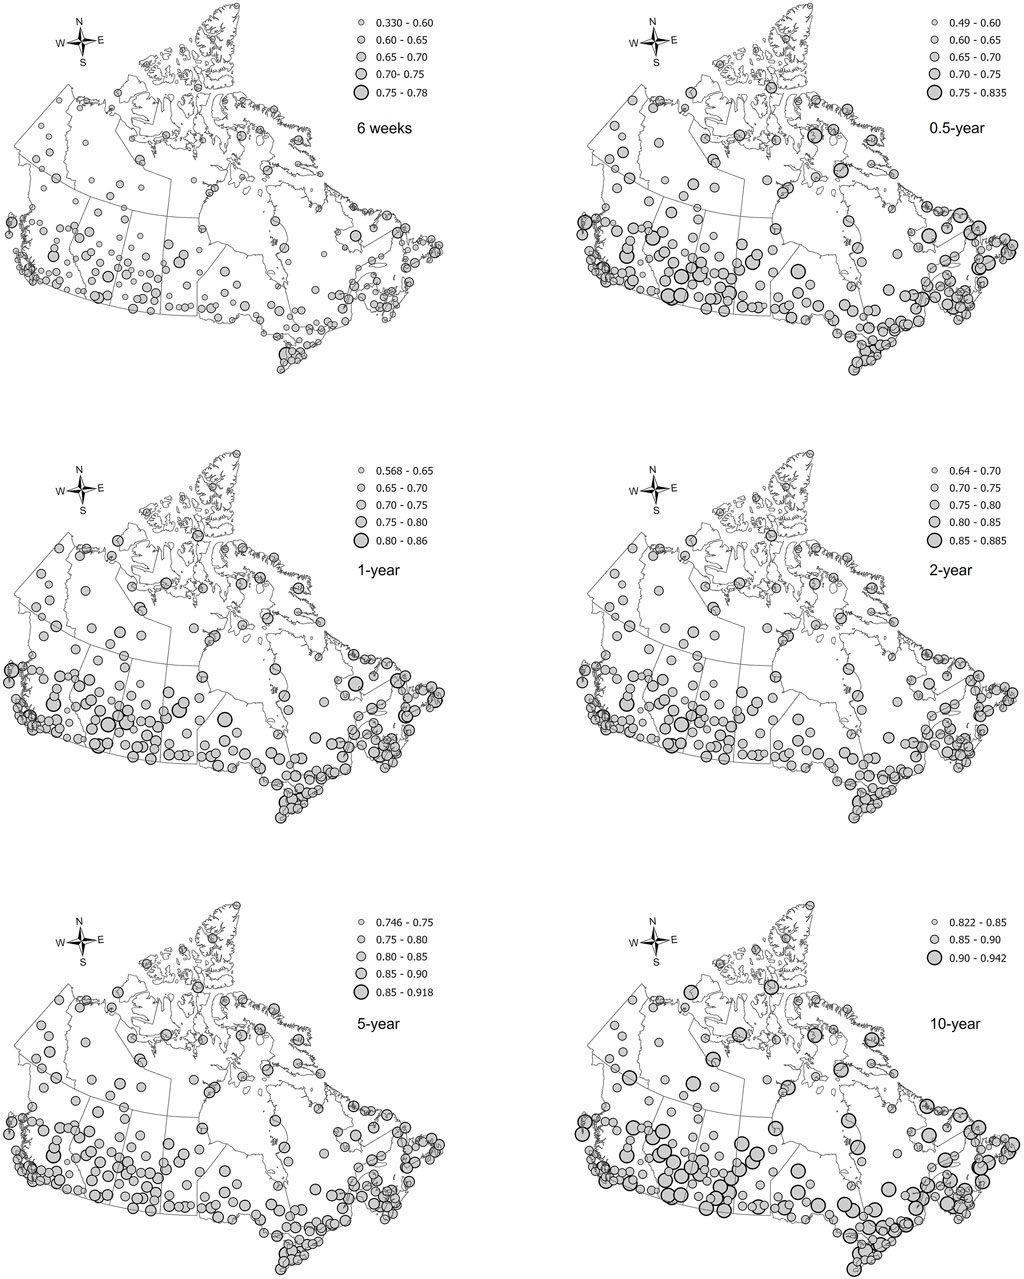
FIGURE 3. rf for various design life considering mixed wind climates.
Storm separation has been considered in many building codes and standards. The extreme wind speeds induced by different weather systems can be separated and analyzed independently (Gomes and Vickery, 1978). The separated wind mechanisms are combined statistically to estimate the return period wind speeds. Two primary extreme wind mechanisms in Canada are non-thunderstorm winds and thunderstorm winds. The tornado and post-tropical-cyclone-induced wind speeds are rare and can hardly be considered using historical data. Therefore, the present study only considers the non-thunderstorm and thunderstorm winds when storm separation is considered. The return period wind speed of the combined wind climate can be expressed by
where FS (·)and FTH (·) are probability distributions for non-thunderstorm and thunderstorm winds, respectively.
The weather flags recorded in the HYL01 records were used to identify the thunderstorm winds. The CVs of non-thunderstorm annual maximum wind speeds were calculated and are presented in Figure 2B. The probabilities of thunderstorm wind events for a given hour are shown in Figure 2C. The annual maximum thunderstorm wind speeds and non-thunderstorm wind speeds were fitted into the Gumbel distribution separately. The generalized least square method (Lieblein 1974; Hong et al., 2013), also known as the best linear unbiased estimator (BLUE), was used to estimate the Gumbel distribution parameters in the following analyses. The return period wind speeds for the combined wind climate were then calculated using Eq. 9. Figure 4 presents several examples to show the return period wind speeds derived based on mixed wind climates (all records considered) and combined wind climates. For the selected cities, the storm separation makes an insignificant impact for lower return period wind speeds but can be considerable when the longer return period (e.g., 500 years) is considered.
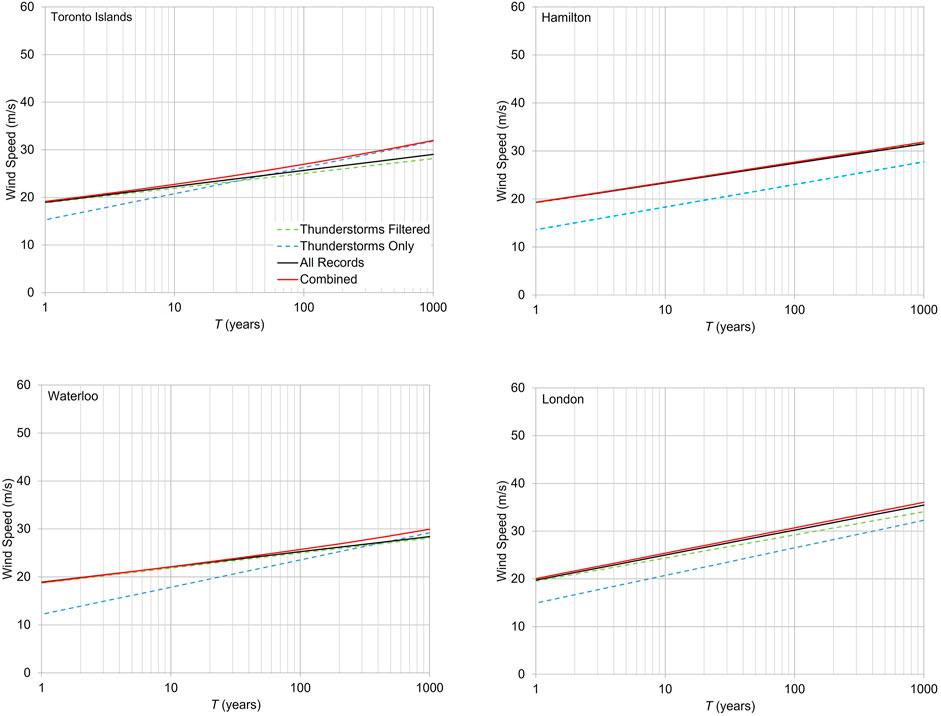
FIGURE 4. Return period wind speeds derived based on mixed wind climates and combined wind climates at four selected cities.
For the combined wind climates, the calculation of rf used both Eqs. 4 and 9. For most sites, the return period wind speeds estimated considering storm separations are close to the values calculated using the mixed wind climate for most return periods, especially for the lower return period, but can be different for longer return periods, e.g., 500 years. Considering all studied sites, the average ratios of the return period wind speeds for combined wind climate to those for the mixed wind climates are about 1.0 for a return period less than 50 years. The standard deviation (SD) of the ratios for a specific return period can vary between 0.01 and 0.03. The 95th percentile of the ratio for a return period less than 10 years is about 1.01 and is 1.05 for a 50-year return period. The rf derived based on either combined wind climates or mixed wind climates are mostly identical. The 99th percentile of the ratio of rf derived based on the combined wind climates to that derived based on the mixed wind climates is within 1%. Therefore, rf derived based on the combined wind climates will not be presented. When rf is given for the rest of the contents, it refers to the result based on the mixed wind climate.
Table 3 lists the rf calculated based on the 10th percentile, 2nd percentile, and the minimum CV values. There are about 0.04 differences of the rf between the listed higher and lower CV values for each Ts. Table 4 lists the wind speed reduction factors calculated using the other approaches. The cprob was calculated based on the return period suggested in Eurocode 1 for each Ts and a CV of 0.138. The reduction factors based on the approach given in Wang and Pham (2011) were calculated based on the equivalent return period derived based on Eq. 3 and listed in Table 4. The results show that the rf values based on the CV of 0.063 are very close to the cprob based on the CV of 0.138 in most cases. Based on Wang and Pham’s approach, the reduction factor becomes more conservative for Ts greater than 1 month. As discussed previously, the physical meaning of assigning the 1/50 exceedance probability to a shorter epoch seems unclear. Given that the rf for CV = 0.063 and cprob for CV = 0.138 provide comparable values, it seems appropriate to consider the rf for CV = 0.063 in the Canadian wind climates for a construction period of less than 1 year.
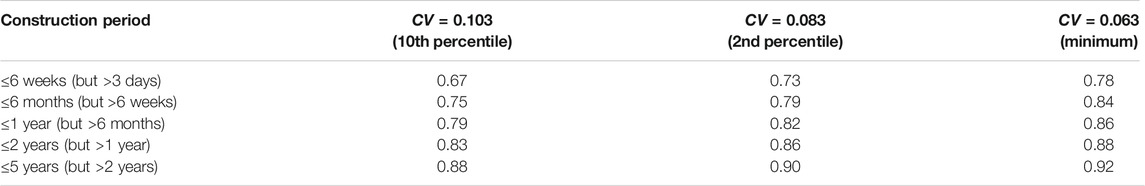
TABLE 3. rf for selected CV.

TABLE 4. Comparison of the wind speed reduction factors calculated using different approaches for a temporary period of less than 1 year.
Both directionality and seasonability of extreme wind speeds are valuable information for structural design resisting wind forces. There is no standalone directionality factor in the current NBCC building code, nor seasonality factor. The wind directionality effect was accounted implicitly into the gust and pressure coefficients (Bartlett et al., 2003a). Therefore, the site-specific wind directionality effect cannot be considered when applying the code analytical approaches to avoid double-counting. The wind directionality effect can be considered explicitly when the design wind pressures were evaluated from a wind tunnel test.
The directional 50-year return period wind speeds for each site were calculated for eight wind directions with each 45° interval and normalized by the non-directional 50-year return period wind speed. Table 5 summarizes the average and SD of the ratio for all sites. On average, the west wind direction appears to be the strongest, and the northeast wind direction is the least strong. For practical use, these directional factors can be normalized by their largest value, i.e., the value calculated at the west wind direction. Table 5 lists the normalized directional factors. The average value of the squared normalized directional factor (apply to the wind loads) is about 0.81. This value is close to the 0.85 directional factor given in the ASCE 7. These wind directional factors can be useful to understand the extreme wind climate for the strength design with a design life of 50 years but are not suggested to be considered for a temporary period of less than 1 year. These factors do not consider the correlation between wind directions and seasonal variations for a specific local wind climate.
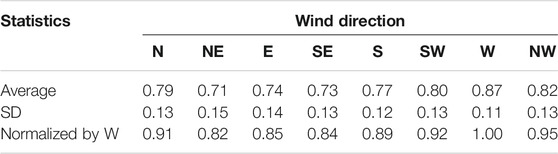
TABLE 5. Statistics of the directional factor calculated based on all sites (0.02 annual exceedance probability).
Similarly, the 50-year return period wind speeds for each month, 2 months, and 4 months were calculated at each site. Table 6 lists the average values of the calculated seasonal factor, cseason, for all studied sites. The results show that the smallest monthly cseason is about 0.70 in July and the largest monthly cseason is about 0.91 in January. The 2-month cseason varies from 0.76 to 0.93. The 4-month cseason ranges from 0.83 to 0.97. The rf listed in Table 4 are comparable with the cseason listed in Table 6. For the Ts <1 month, the rf = 0.78 is within the range of cseason being from 0.7 to 0.91. For the Ts between 1 month and 2 months, the rf = 0.8 is between the range of cseason from 0.76 to 0.93. For Ts between 2 and 4 months, the rf = 0.83 is the same as the minimum value of cseason for 4 months. This comparison indicates that for the construction period executed in specific months, it might be appropriate to take the maximum value of rf and cseason, but not apply both factors.
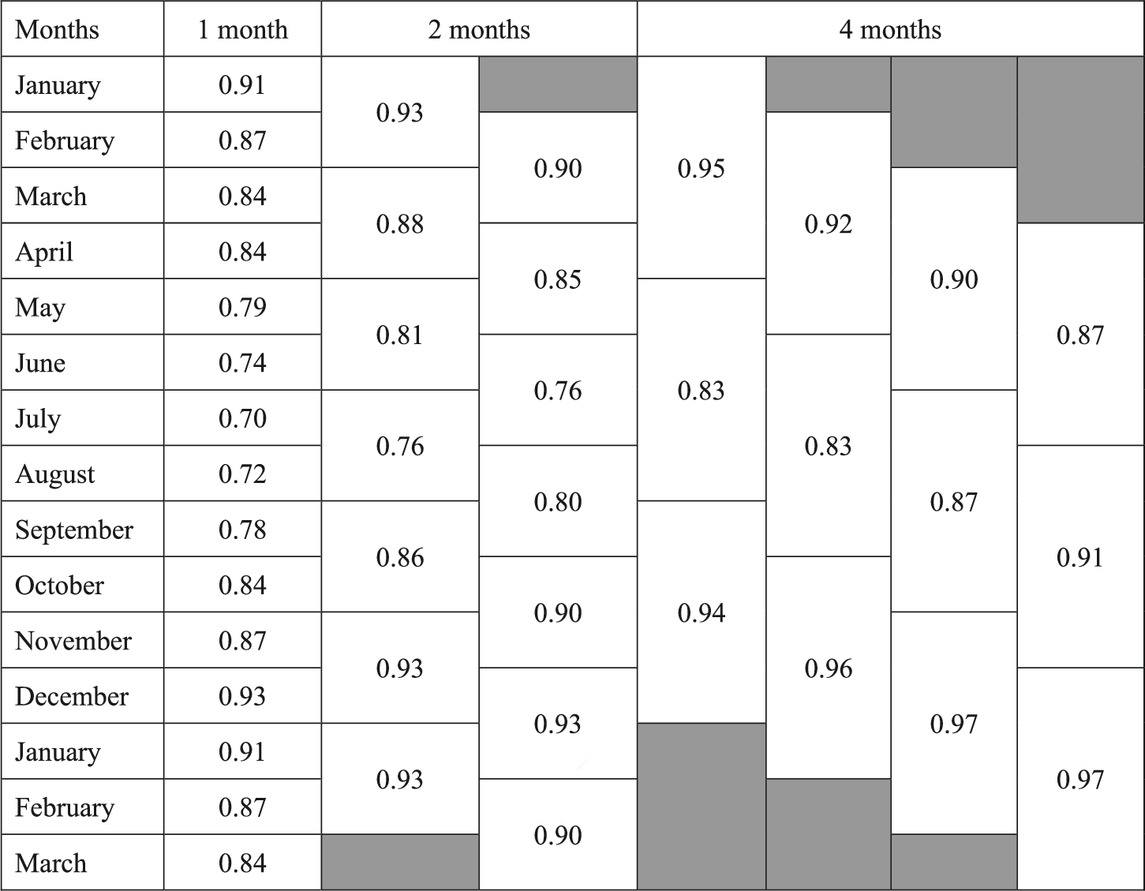
TABLE 6. Season factor cseason (median value of all sites) for annual exceedance probability of 0.02.
The occupational purpose is a critical parameter to define the importance level, also known as the risk category in some standards. The various approaches discussed in previous sections all apply to the temporary construction phase of permanent buildings or infrastructures that protect the safety of the public and occupational persons after the construction completion. The approaches discussed previously may not apply for non-residential structures, facilities, or buildings classified as low importance for very limited temporary occupation. Similarly, when a permanent structure or facility desires a design life longer than 50 years, the applicability of these approaches discussed previously needs to be investigated. However, all methods discussed in the previous section focused on the exceedance probability of the wind hazard. The structural reliability could be evaluated after determining the equivalent return period but is not considered the target. In this section, the structural reliability in a given design life is used as the target to derive the appropriate factors for both short and long design lives.
Since most standards do not provide a clear definition of the design life, the description provided in Eurocode 1 and UFC can be good references. For non-residential structures, the design life of a semi-permanent structure, agriculture and similar structures, might range from 5 to 25 years. The design life of a permanent structure can be longer than 25 years.
For the load and resistance factor design (LRFD), both load effects and material capacity determine the reliability of a structural member. The probability models and their parameters given by Bartlett et al. (2003a and b) have been used to calibrate the load factors and the structural reliability in the NBCC since 2005. The present study adopts these probability models and their distribution parameters.
The current NBCC (2015) assigns the return period of 50 years for the design wind pressures across Canada. The annual probability of exceedance of the extreme wind speeds (1/50 = 0.02) maintains the same for all stations across Canada. Hong et al. (2016) showed that structural reliability varies with the CV of annual maximum wind speeds. Since the reliability target varies with CV value, this section will not target the typical structural reliability index of 3.0 but maintain the structural reliability calculated based on the design life of 50 years for a specific CV.
When wind load is dominant, the design criteria in NBCC (2015) require that the material’s nominal capacity resists the dead load effect combined with the wind load effect. The design criterion is given by
where
Under the ultimate limit state, the real resistance balances the real dead load and the wind load effect. The normalized state function can be given by
where XR denotes the normalized random resistance, XD is the normalized random dead load effect, X represents the peak random annual maximum wind speed in 50 years, XT represents T-year return period (50 years in this case) annual maximum wind speed, and RW/D is the ratio of the nominal wind load effect to the nominal dead load effect. The random variable Z transforms wind velocity to wind load effect and includes uncertainties in the exposure coefficient, the external pressure coefficient, and the gust factor. Note that the storm separation was not considered in Bartlett et al. (2003a and b) for developing the wind load factor. Therefore, to be consistent, the reliability analysis carried out in this section will not consider the storm separation. As Bartlett et al. (2003a) mentioned, the directionality factor was not explicitly included in the evaluation of Eq. 11. However, the gust and pressure coefficients used in the NBCC have been reduced to account for directionality and other factors. The characteristic values, i.e., bias and CV, of the overall load transformation factor, Z, have accounted for the wind directionality effect. Therefore, no site-specific wind directionality effect will be further introduced in the following reliability analysis.
The analyses in the following sections used the probability models and their distribution parameters given in Bartlett et al. (2003a and b) and Hong et al. (2014). XR was modeled as a log-normal distribution with a mean value of 1.17 and a CV of 0.108. XD was modeled as a normal distribution with a mean value of 1.05 and a CV of 0.10. Z was modeled as a log-normal distribution with a mean of 0.68 and a CV of 0.22.
The basic design wind pressures for a 50-year return period defined in NBCC (2015) associate with the hourly mean wind speeds. This section conducted the Monte Carlo simulation to calculate the state function expressed by Eq. 11. The state g(XT) < 0 defines one failure event. The analysis used the probability of failure, given a specific RW/D, for the typical design life of 50 years as the baseline value.
The analysis considered the X in Eq. 11 as the peak value of the annual maximum wind speeds within the given short design life. To maintain the structural reliability index of a short design life the same as the design life of 50 years, an additional factor, Fr, is included in the wind load effect term in Eq. 11 such that
where XS is the peak annual maximum wind speed in S years. Other variables are the same as those defined in Eq. 11.
Given a set of CV and RW/D, the optimal Fr was obtained through the Monte Carlo simulation by matching the probability of the failure for a given short design life to the baseline probability of failure for the design life of 50 years. This analysis selected a range of RW/D, including 0.5, 1, 2, 3, and 5. Figure 5A presents the
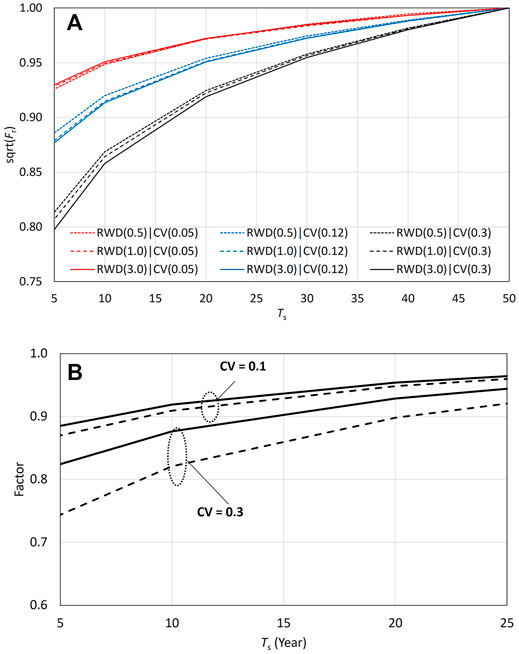
FIGURE 5.
Figure 5A shows that
Given a specific RW/D, the aforementioned analysis still allows the structural reliability to vary with the CV. Since the structural reliability for a specific local wind climate (measured by CV) may not lead to the target reliability, some cautions should apply to use these factors for a specific wind climate. With varying structural reliability, it is hard to apply a factor based on the local wind climate without knowing the structural reliability variation from the target value. A systematic way to address this issue is to achieve the same reliability target regardless of the local wind climate variation.
Achieving the same structural reliability requires the design wind load incorporating the spatial variation of the CV of the extreme wind speeds. The study by Hong et al. (2016) implied that different return periods are required for different regions of Canada, or an additional factor needs to be introduced. Tang (2016) investigated the former idea. Their study had applied a similar approach to allow a varying return period of the design wind speed across Canada. For maintaining the same return period of the design wind speed, this study introduced an extra factor to the nominal wind load for achieving the same target reliability index of 3.0.
The state function uses the same format expressed in Eq. 11 but includes a wind climate variability factor, FC, to achieve the reliability index of 3.0 for all CVs for a design life of 50 years. The state function can be expressed by
Hong et al. (2014) showed that a CV value of 0.138 with RW/D equal to 3.0 results in a reliability index of 3.0. Therefore, for deriving the FC to reach the same reliability target, the RW/D was set to be 3.0. In such a way, the analysis derived an extra factor considering the effect of varying CV values and maintained the final structural reliability index of 3.0.
Figure 6A presents the calculated probability of failure without applying the FC. Figure 6B presents the calculated FC as a function of CV value (0.05 < CV < 0.3). A linear regression describes FC as a function of CV reasonably well and is easy to use. This regression model can be expressed by
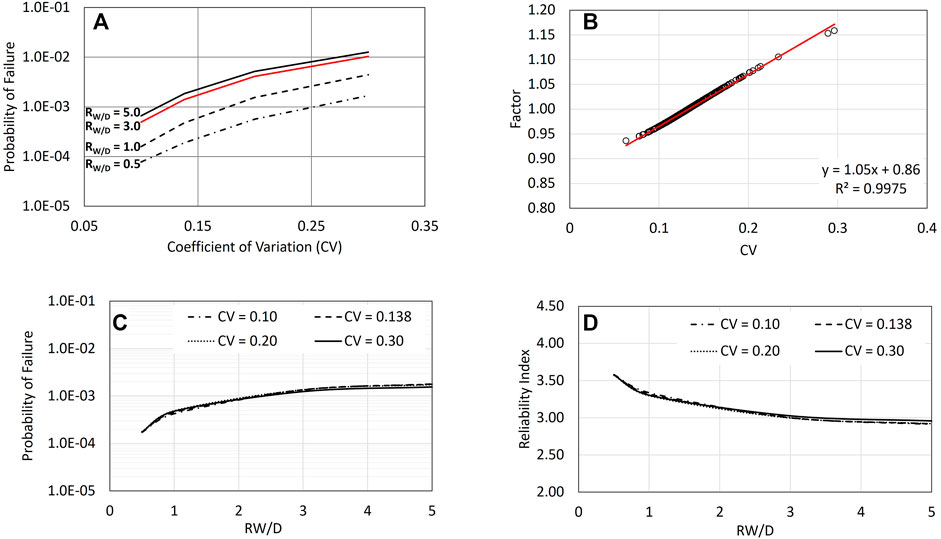
FIGURE 6. (A) Probability of failure varies with CV for specific RW/D. (B) Factors need to be applied for Canadian stations to achieve the same structural reliability index of 3.0. (C) Probability of failure for selected CV with applying the factors shown in (A). (D) Reliability index for selected CV with applying the factors shown in (A).
Equation 14 predicts unity for CV = 0.138. Figure 6C presents the probability of failure calculated by applying FC. Figure 6D presents the corresponding structural reliability index.
By applying the FC factor to the wind load, the calculation leads to the structural reliability independent of CV, given RW/D = 3.0. For RW/D less than 3.0, the reliability index will be higher. RW/D of 5.0 results in a slightly lower reliability index. The FC factor considers the variability of wind climate that results in a uniform return period of 50 years with a wind load factor of 1.4 or a higher return period of 500 years with a unity wind load factor across Canada.
A similar analysis was conducted considering FC for a few selected CV values by the state function:
Results show that the derived Fr values vary with CV values given a specific design life. Therefore, the combined factor (
Figure 7 presents the developed climate variability factors, FC_Ts, for various design lives. Unlike a linear fit for the FC shown in Figures 6A,B, a second-degree polynomial fits FC_Ts more appropriately for smaller and larger Ts. This relation can be expressed by
where a, b, and c are polynomial coefficients.
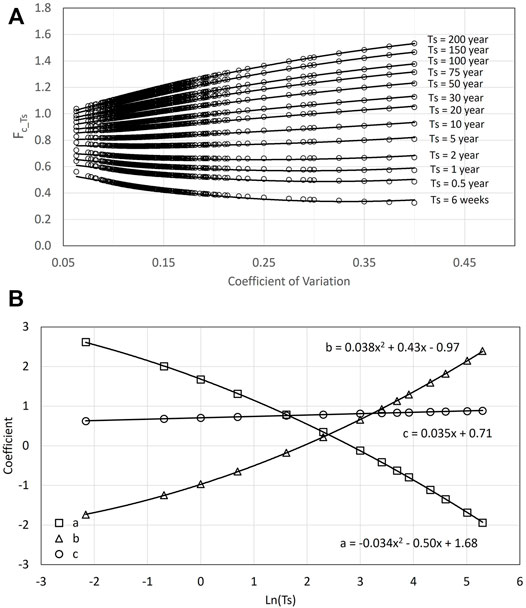
FIGURE 7. Climate variability factors vary with CV value for a different design life (A) and fitted parameters of climate variability factor as functions of the design life (B).
These coefficients were fitted into a function of design life Ts. The Ts between 6 weeks and 200 years were considered to fit these parameters. The second-degree polynomial again provides the best fit for coefficients a and b. A linear fit for coefficient c is adequate. The analyses were extended to a CV of 0.4 to avoid possible overfitting problems at the boundary values.
The fitted coefficients as a function of the natural log of the design life can be expressed by
where x = ln (Ts).
The cprob and rf can also be derived based on the approaches discussed in the previous section. For calculating cprob, the return period is set to be the same as the design life, Ts. Figure 8 compares the (rf)2, (cprob)2, with
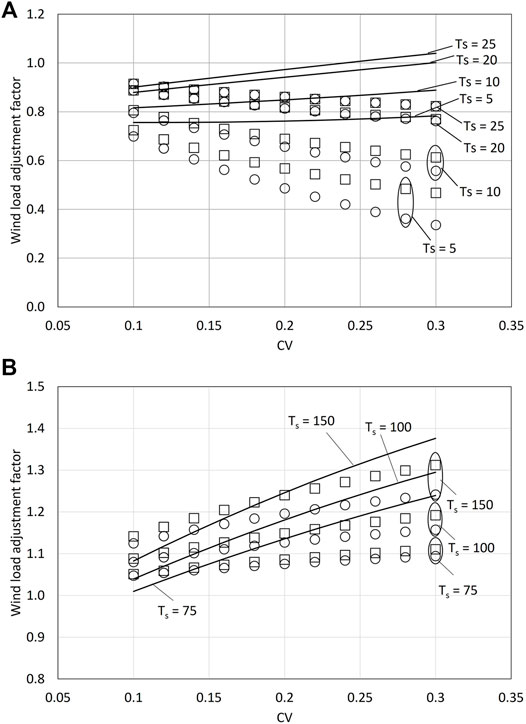
FIGURE 8. Comparison of (rf)2 (circle), (cprob)2 (square), and
Figure 8 shows that for a design life less than 25 years, the
Figure 8B presents factors calculated for three longer design lives, including 75, 100, and 150 years. These factors can be compared with the commonly used importance factors of 1.15 and 1.25 for the importance level of important structure and post-disaster structure, respectively. There is no explicit definition of the design life given in the current NBCC. Therefore, assuming a design life of 50 years may be appropriate. The application of the importance factor increases the target structural reliability index from the standard target value of 3.0. The calculated
Figure 8B shows that the FC_Ts factors are greater than (rf)2 and (cprob)2 for CV >0.138 and Ts <100 years. For Ts = 150 years, the FC_Ts factors are greater than (rf)2 and (cprob)2 for CV greater than 0.17. For cases when FC_Ts is less, the extra safety margin for smaller CVs leads to a reduction. The difference between FC_Ts and the other two factors can be large for a larger CV value.
One might use the importance factor to consider a longer design life. It might be practically reasonable to consider a design life of about 100 years as an important structure and consequently apply the importance factor of 1.15. A 100-year design life with
All the previous sections considered the probability of failure for the entire design life. When the annualized risk is considered, the consequence of the failure event will need to be considered. However, given the variety of exposure, this section focuses on human safety, which could be at risk when a failure occurs.
For a temporary construction period, the use of a reduced wind speed is not the intent to reduce the safety of individuals; instead, safety is still the primary concern but through the appropriate risk control protocols, e.g., as emphasized in the ASCE 37-14 (2015):
“Reductions of loads to the levels stated in this standard are appropriate when loading situations can be managed through safety protocols that limit access to hazardous locations when loadings exceed those used for temporary designs, and when loadings, including environmental loadings, can be limited (e.g., by timely snow removal) proactively. The knowledge and training of personnel in control of construction sites, the visible nature of construction elements, and the processes on construction sites are key components of protocols necessary to control of risk to personnel and property on the construction site. Risks to personnel and property adjacent to the construction site also warrant attention.”
Although the approaches discussed in previous sections increase the annual probability of failure, the number of people (i.e., exposure) in a structure under construction decreases. A method besides the safety protocol mentioned previously might be considered. To maintain the annualized risk (the probability of failure × exposure), the number of people in the building under construction can be restricted when a forecasted wind speed exceeds a threshold below the wind speed used for calculating the structural strength capacity requirements in the construction period. For example, assuming the normalized full occupational capacity of a building is 1 and given the annual probability of failure being 2.70E−5, the annual risk is equal to 2.70E−5. When considering the annual probability of failure being 1.35E−03 (i.e., maintain the total probability of failure for 1-year construction period the same as the 50 years) and keeping the annual risk level of 2.70E−5, the exposure shall be decreased to 2.70E−5/1.35E−3 = 0.02. In other words, in this case, the exposure shall be less than 2% of the full occupational capacity for keeping the same annual risk level. The economic benefits and practical feasibility shall only be permitted when the risk control can be adequately carried out.
For semi-permanent non-residential structures or facilities, the philosophy for the approach introduced in the previous section assumes that the design maintains the same total safety level, measured by the structural reliability index or the total probability of failure, during the design life. The annualized risk level will vary with the proposed design life. This variation is consistent with the current design philosophy. The annualized risk level for this approach will vary for different design periods, similar to applying the importance factor for a Low Importance Category building. The annualized risk level is a way to communicate the risk level for the design options. This concept is the same as considering a longer design life to be more critical.
For a construction period of a permanent structure, various codes set a limit of 1 year to apply a wind speed reduction factor. The annualized risk level for a construction period is greater than a level for a permanent structure but less than the level for 1-year return period wind speed being used. For a semi-permanent structure, by applying a proper
Three approaches provided in various building codes were used to develop wind speed reduction factors in Canadian wind climates within 1 year. It was found that the rf associates with the smallest CV and the cprob associates with the average CV are comparable. The rf factors associated with the smallest CV were found within the seasonal factors for specific periods. The maximum value of the rf factor and seasonal factor for a particular period of less than 1 year can be considered for a construction period of less than 1 year.
The directional factors can inform the wind directionality and might be used for a semi-permanent and permanent structure, but not suggested being used for temporary structures. The average value of the normalized directional factors for wind pressures in Canadian wind climates is about 0.81, close to the directionality factor of 0.85 in ASCE 7-16. The directional factors shall not be directly applied with the code analytical approaches, given that the wind directionality effect has been implicitly accounted for in the gust and pressure coefficients provided by the code.
The derived
For a longer design life, the
Publicly available datasets were analyzed in this study. This data can be found here: https://climate.weather.gc.ca/historical_data/search_historic_data_e.html.
SHL: conceptualization, methodology, formal analysis, validation, investigation, writing—original draft, review and editing.
The author SHL was employed by the Rowan Williams Davies & Irwin Inc.
All claims expressed in this article are solely those of the authors and do not necessarily represent those of their affiliated organizations, or those of the publisher, the editors, and the reviewers. Any product that may be evaluated in this article, or claim that may be made by its manufacturer, is not guaranteed or endorsed by the publisher.
The author thanks Environment and Climate Change Canada (ECCC) for providing access to Canada’s hourly wind speed data.
ABCB Temporary Structures Standard (2015). Temporary Structure Standards. Canberra, Australia: Australian Building Codes Board.
Aksözen, M., Hassler, U., and Kohler, N. (2017). Reconstitution of the Dynamics of an Urban Building Stock. Building Res. Inf. 45 (3), 239–258. doi:10.1080/09613218.2016.1152040
ASCE 37-14 (2015). Design Loads on Structures during Construction, 37-14. New York: American Society of Civil Engineers.
ASCE 7-16 (2016). Minimum Design Loads for Buildings and Other Structures, 7-16. New York: American Society of Civil Engineers.
Bartlett, F. M., Hong, H. P., and Zhou, W. (2003a). Load Factor Calibration for the Proposed 2005 Edition of the National Building Code of Canada: Companion-Action Load Combinations. Can. J. Civ. Eng. 30, 440–448. doi:10.1139/l02-086
Bartlett, F. M., Hong, H. P., and Zhou, W. (2003b). Load Factor Calibration for the Proposed 2005 Edition of the National Building Code of Canada: Statistics of Loads and Load Effects. Can. J. Civ. Eng. 30, 429–439. doi:10.1139/l02-087
Boggs, D. W., and Peterka, J. A. (1992). “Wind Speeds for Design of Temporary Structures,” in Structures Congress’ 92.
BS EN 1991-1-4 (2005). Eurocode 1: Actions on Structures – Part 1-4: General Actions – Wind Actions. Brussels, Belgium: European Committee for Standardization.
BS EN 1991-1-6 (2005). Eurocode 1: Actions on Structures - Part 1-6: General Actions - Actions during Execution. Brussels, Belgium: European Committee for Standardization.
BS NA EN 1991-1-4 (2010). (English): UK National Annex to Eurocode 1. Actions on Structures General Actions - Wind Actions. London, United Kingdom: British Standards Institution.
BS NA EN 1991-1-6 (2005). (English): UK National Annex to Eurocode 1. Actions on Structures General Actions - Actions during Execution. London, United Kingdom: British Standards Institution.
Burn, D. H. (1990). Evaluation of Regional Flood Frequency Analysis with a Region of Influence Approach. Water Resour. Res. 26 (10), 2257–2265. doi:10.1029/90wr01192
Cao, Z., Liu, G., Duan, H., Xi, F., Liu, G., and Yang, W. (2019). Unravelling the Mystery of Chinese Building Lifetime: A Calibration and Verification Based on Dynamic Material Flow Analysis. Appl. Energ. 238, 442–452. doi:10.1016/j.apenergy.2019.01.106
CNR-DT 207 R1/2018 (2018). Guide for the Assessment of Wind Actions and Effects on Structures. Roma, Italy: National Research Council of Italy.
Cook, N. J., and Mayne, J. R. (1979). A Novel Working Approach to the Assessment of Wind Loads for Equivalent Static Design. J. Wind Eng. Ind. Aerodyn. 4 (2), 149–164. doi:10.1016/0167-6105(79)90043-6
Esri Inc (2020). ArcGIS Pro (Version 2.7). Redlands, CA, United States: Esri Inc. Available at: https://www.esri.com/en-us/arcgis/products/arcgis-pro/overview.
Gomes, L., and Vickery, B. J. (1978). Extreme Wind Speeds in Mixed Wind Climates. J. Wind Eng. Ind. Aerodyn.s 2 (4), 331–344. doi:10.1016/0167-6105(78)90018-1
HKBD (Hong Kong Buildings Department) (2019). Code of Practice on Wind Effects in Hong Kong 2019. Hong Kong, China: Buildings Department.
Hong, H. P., Li, S. H., and Mara, T. G. (2013). Performance of the Generalized Least-Squares Method for the Gumbel Distribution and its Application to Annual Maximum Wind Speeds. J. Wind Eng. Ind. Aerodyn. 119, 121–132. doi:10.1016/j.jweia.2013.05.012
Hong, H. P., Mara, T. G., Morris, R., Li, S. H., and Ye, W. (2014). Basis for Recommending an Update of Wind Velocity Pressures in Canadian Design Codes. Can. J. Civ. Eng. 41 (3), 206–221. doi:10.1139/cjce-2013-0287
Hong, H. P., Ye, W., and Li, S. H. (2016). Sample Size Effect on the Reliability and Calibration of Design Wind Load. Struct. Infrastructure Eng. 12 (6), 752–764. doi:10.1080/15732479.2015.1050039
IS 875 (Part 3) (2005). Design Loads (Other than Earthquake) for Buildings and Structures – Code of Practice, Part 3 Wind Loads. New Delhi. India: Bureau of Indian Standards.
Johnston, K., Ver Hoef, J. M., Krivoruchko, K., and Lucas, N. (2003). ArcGIS 9. Using ArcGIS Geostatistical Analyst. Redlands, CA: Environmental Systems Research Institute.
Li, S. H. (2018). Effect of Disjunct Sampling on Calibration of Design Wind Speed. J. Wind Eng. Ind. Aerodyn. 183, 283–294. doi:10.1016/j.jweia.2018.11.016
Lieblein, J. (1974). Efficient Methods of Extreme-Value Methodology. Report NBSIR74-602. Washington: National Bureau of Standards.
National Research Council of Canada (NRCC) (2005). National Building Code of Canada. Ottawa, Ontario: Institute for Research in Construction.
National Research Council of Canada (NRCC) (2010). National Building Code of Canada. Ottawa, Ontario: Institute for Research in Construction.
National Research Council of Canada (NRCC) (2015). National Building Code of Canada. Ottawa, Ontario: Institute for Research in Construction.
O’Connor, J. (2004). “Survey on Actual Service Lives for North American Buildings,” in Proceedings from the Woodframe Housing Durability and Disaster Issues Conference, Forest Products Society, Las Vegas, USA, October 2004.
Rosowsky, D. V. (1995). Estimation of Design Loads for Reduced Reference Periods. Struct. Saf. 17 (1), 17–32. doi:10.1016/0167-4730(94)00037-q
Tang, Q. (2016). Estimation of Wind Hazard over Canada and Reliability-Based Assignment of Design Wind Load. London, ON, Canada: University of Western Ontario. M.Sc. Thesis.
UFC 1-200-01 (2019). DoD Building Code. Washington, VA, United States: Department of Defense of USA.
UFC 1-201-01 (2013). Non-Permanent DoD Facilities in Support of Military Operations. Washington, VA, United States: Department of Defense of USA.
UFC 3-3-1-01 (2019). Structural Engineering. Washington, VA, United States: Department of Defense of USA.
Keywords: design wind speed, non-standard design life, structural wind load, structural reliability, risk analysis, probability of failure
Citation: Li SH (2022) Design Wind Speed for Buildings and Facilities With Non-Standard Design Life in Canadian Wind Climates. Front. Built Environ. 8:829533. doi: 10.3389/fbuil.2022.829533
Received: 05 December 2021; Accepted: 11 January 2022;
Published: 08 March 2022.
Edited by:
Amrit Kumar Roy, National Institute of Technology, Hamirpur, IndiaReviewed by:
Ritu Raj, Delhi Technological University, IndiaCopyright © 2022 Li. This is an open-access article distributed under the terms of the Creative Commons Attribution License (CC BY). The use, distribution or reproduction in other forums is permitted, provided the original author(s) and the copyright owner(s) are credited and that the original publication in this journal is cited, in accordance with accepted academic practice. No use, distribution or reproduction is permitted which does not comply with these terms.
*Correspondence: Si Han Li, U2loYW4uTGlAcndkaS5jb20=
Disclaimer: All claims expressed in this article are solely those of the authors and do not necessarily represent those of their affiliated organizations, or those of the publisher, the editors and the reviewers. Any product that may be evaluated in this article or claim that may be made by its manufacturer is not guaranteed or endorsed by the publisher.
Research integrity at Frontiers
Learn more about the work of our research integrity team to safeguard the quality of each article we publish.