
94% of researchers rate our articles as excellent or good
Learn more about the work of our research integrity team to safeguard the quality of each article we publish.
Find out more
ORIGINAL RESEARCH article
Front. Built Environ., 08 July 2022
Sec. Indoor Environment
Volume 8 - 2022 | https://doi.org/10.3389/fbuil.2022.826265
This article is part of the Research TopicPathways to Resilient Zero Carbon CitiesView all 9 articles
 Ljubomir Jankovic1*
 John Christophers2
Birmingham Zero Carbon House was retrofitted and extended from an 1840 end of terrace house to an award-winning house with negative operational emissions, receiving a RIBA Award for Architecture in 2010. In addition to a super-insulated envelope, the house achieves its negative emissions status using a photovoltaic system, a solar thermal system and a wood burning stove. The house has been extensively monitored since 2011, with circa 20 performance parameters recorded every minute of the day. Despite its negative operational emissions confirmed by the monitoring, this article for the first time introduces embodied emissions into the calculation of the overall carbon emissions performance. Taking into account embodied emissions from materials, construction process, maintenance and the end-of-life emissions due to deconstruction and disposal, taken over a 60-year span, the analysis reveals that the sum of embodied and operational emissions reached zero in 2012. Taking a rigorous approach of quantifying embodied and operational emissions, the paper puts into perspective the scale of efforts that need to be deployed across the UK and beyond to reach net zero by 2050.
The UN IPCC has flagged the current state of climate change as “code red for humanity” (Masson-Delmotte et al., 2021), approaching a tipping point of no return. Construction and buildings creates approximately 38% of the global carbon emissions (UN Environment Programme, 2020), and significant amount is from domestic houses. This is increasingly becoming recognised across the UK local authorities, where 74% have declared carbon emergency, and in many cases are aiming to reduce carbon emissions down to zero by 2030 (Carbon Emergency UK, 2021). Whilst the reduction measures are typically focused on operational emissions, research shows that embodied emissions can set the zero emissions targets back by several decades (Jankovic et al., 2021).
As over 80% of existing UK homes will still be in use by 2050 (Sarshar, 2018) and will have to be retrofitted to achieve zero carbon performance, the task of bringing climate change under control is significant. This is exacerbated by the absence of building regulations that require new buildings to be zero emissions (Jankovic et al., 2021), which will generate new candidates for retrofit almost straightaway after the construction.
In this gap between the aspirations, outdated regulations and reality, this paper investigates the combined embodied and operational emissions from Zero Carbon House in order to put into perspective the scale of efforts that need to be deployed across the UK and beyond to reach net zero by 2050.
Embodied carbon is a measure of the emissions from a building’s construction and maintenance. This includes materials, their production, transport and installation on site, as well as planned maintenance, replacement and disposal at end of life, all taken over a theoretical 60 years building life for consistency (RICS, 2017; Jones and Hammond, 2019). Operational carbon, by contrast, measures the emissions from operating a building each year. A building with net zero operational carbon does not burn fossil fuels, and is 100% powered by renewable energy, as demonstrated by the measured data. Taken together, operational and embodied carbon measure whole life carbon (WLC).
Embodied carbon has not until recently been prioritised in the construction industry. This is partly for good historical reasons. Circa 1980-1990 when pioneering groups such as AECB were formed, whole life carbon and whole life costs were rarely discussed in the UK. But at that time whole-life analysis showed emissions from operational energy typically accounted for 90–95% of whole life carbon–as many UK buildings were still singled glazed–with embodied carbon at just 5–10%. It was therefore logical that design teams focused their efforts on “fabric first” operational energy/carbon. The increasing UK interest in the Passivhaus methodology reflects this focus, and as understanding grows, this is beginning to create a step change in UK building design and construction. However, as highly-insulated buildings are designed to increasingly better standards and operational energy/carbon has fallen, this has led to a corresponding proportional rise in embodied carbon, and therefore in its importance as a component of zero carbon design. RICS reference a low-energy residential example where embodied carbon is just over 50% of WLC (RICS, 2017), but embodied carbon is not covered by any UK regulations.
The Code for Sustainable Homes (DCLG, 2009) used The Green Guide to Specification (BRE, 1996 and subsequent) to assess building materials. Green Guide ratings for building materials include environmental impacts of climate change, water extraction, mining, ozone depletion, toxicity, nuclear and other waste, and acidification. This broad range of factors is laudable. However, materials which are not mainstream, and therefore not supported by extensive research and development programmes, sometimes do not score very highly, even where they appear to have very low embodied carbon. By contrast, materials with established and well-resourced trade organisations and test data score well, some despite having relatively high carbon emissions. The overall Green Guide assessments do not therefore equate to carbon emissions.
In 2017 RICS published their Whole life carbon (WLC) document referred to above (RICS, 2017). Operational and embodied carbon are added together to measure whole life carbon. WLC emissions are divided by RICS into four sections: Product (i.e., building materials etc, designated A1-A3), Construction process (A4-A5), Use (B1-B7) and End of life (C1-C4) (see Figure 1). Embodied carbon is defined by RICS in two ways. The first narrower definition, often referred to as upfront carbon, assesses embodied carbon to practical completion only. This comprises stages A1-A5, i.e., raw material extraction, transport to manufacturing, manufacture and fabrication, transport to the construction site, and construction/installation.
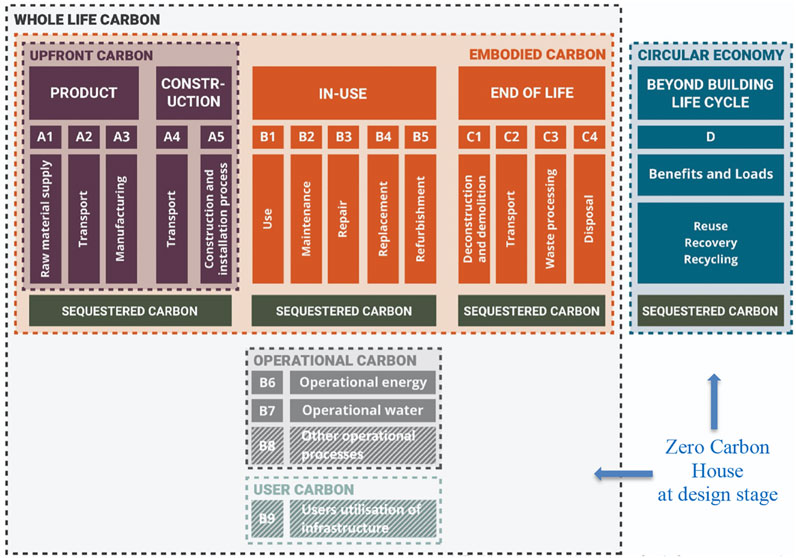
FIGURE 1. Whole Life Carbon categories (WLCN, 2021), based on (RICS, 2017). Hatched areas relate to infrastructure.
The second RICS definition of embodied carbon is wider. As well as product and construction (A1-5), it includes maintenance, repair, replacement and refurbishment (B1-B5), and end-of-life (C1-C4) as components of embodied carbon. Operational energy use (B6) and operational water use (B7) are separated out as operational carbon, and are not part of the embodied carbon total. The maintenance and end-of-life (B1-5 and C1-4) emissions in the second definition, which go beyond practical completion, are valuable. They reflect that although a product could be low carbon at the construction stage, it might carry hidden whole-life impacts–e.g., requiring high levels of maintenance and/or early replacement, and/or being very difficult or impossible to reuse. They also help to focus attention on buildings as sources of materials to be reused at end-of-life. It is this second RICS definition which has been widely adopted by leading UK construction bodies–WLCN, UKGBC, RIBA, LETI, CIBSE, BBP, GHA, etc. The RIBA 2030 Climate Challenge standard is a voluntary standard introduced by RIBA in 2019 which includes target metrics for operational energy, embodied carbon, water consumption and other measures. The common set of definitions proposed by the Whole Life Carbon Network (WLCN, 2021), related to RICS WLC categories (RICS, 2017), is shown in Figure 1.
In the absence of Government standards, these bodies are collaborating admirably to agree and align both methodologies and targets for embodied carbon, and it is these to which the current study is benchmarked in Table 1. UK building industry bodies are also campaigning for public policy on embodied carbon. UKGBC advocates using planning reforms to prioritise reuse of existing buildings; reporting and regulation of Whole Life Carbon and Embodied Carbon to minimum standards; and removal of VAT on refurbishment works to incentivise re-use over demolition (UKGBC, 2019).

TABLE 1. Comparison with other design standards.
Since its completion 12 years ago in 2009, Zero Carbon House (Figure 2) has continued to attract international attention. Dezeen magazine named it as their first of ten global low-energy architecture projects, “one of the most sustainable houses in the United Kingdom” (Carlson, 2021), following publication by Princetown Architectural Press (Green, 2021).

FIGURE 2. Birmingham Zero Carbon House (photos with permission from Martine Hamilton Knight/STO).
It is striking that different lifestyles and occupancy patterns—the human factor—can make differences of up to 300% in the energy usage in a home (Paone and Bacher, 2018), but if heating loads are to reduce from the typical 180 + kWh/m2. yr used in older buildings to less than 15 kWh/m2. yr of the Passivhaus model, huge improvements are both possible and necessary.
Prior to the Birmingham Zero Carbon House, John Christophers designed (at Associated Architects) a sustainable house in Worcester, which won the RIBA 2005 Sustainability Award. Although its energy usage and insulation figures are very good, it attracted particular attention through its architectural use of very low energy building materials, particularly a cob wall made using earth from the site itself. Working on this project sparked interest in the architectural potential of very low embodied carbon and earth-based building materials, which have been used in a different way in the Zero Carbon House.
In 2007 three design aims were summarised:
First, to create a very low or “zero carbon” home to level 6 (the highest level) of the original UK Code for Sustainable Homes (DCLG, 2009). The house was among the very first UK buildings to achieve this.
Second, to upgrade and extend a 170-year old early Victorian building to the same standard as the new. More than 80% of existing UK homes will still be in use by 2050 (Sarshar, 2018) and must be improved to achieve serious carbon reductions. This aspect of the project could therefore have the greatest potential impact if replicated elsewhere, and this is the first UK retrofit to the Code for Sustainable Homes level 6 (true zero carbon) standard.
Third, to inspire others through the use of space, light, materials–in other words by creating architecture–to demonstrate that green buildings do not have to sacrifice high design standards.
Do some award-winning recent buildings still demonstrate an almost 19th century disregard for their fossil fuel usage, in both operational and embodied carbon? It is no longer acceptable to choose between a beautifully designed piece of architectural design on the one hand, and a low- or zero-carbon building on the other. We can have both; and to be truly sustainable we must have both architectural and environmental excellence. Like obsolete fossil fuel mining, buildings that do not achieve both may be demolished as “stranded assets” because they can no longer be sensibly run, let or maintained. However, it is increasingly apparent that the carbon emission benefits of retrofit outweigh demolition and rebuilding (RIBA, 2021). The sculptor Anthony Gormely has written “The carbon crisis calls for a re-examination of our faith in the technological basis of western progress. A change in belief is a cultural change” (Gormley, 2010). So, although not widely acknowledged in 2007–08 when the zero carbon house was designed, it seemed urgent to explore the cultural change to an architecture of very low embodied carbon building materials, further described below.
Thermal insulation standards are summarised in Table 2. Put another way, the retrofitted walls and roof are 16 times better, windows 14 times, and airtightness 28 times improved from the existing building.
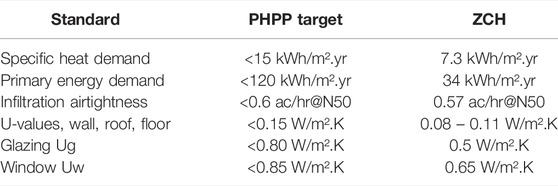
TABLE 2. Comparison of Passivhaus standards with Zero Carbon House standards achieved.
Typical wall construction uses 280 mm of neopor insulation (expanded polystyrene with graphite infrared reflecting additive) on the outside face of both the new and existing masonry at the side and rear. All mechanical fixings were designed out, as these would have compromised thermal performance by creating repeating thermal bridging through the insulation. It is finished in external white render with some colour accents.
The front elevation of the original house is internally insulated to preserve its brickwork and stone features. As there were no historic interiors, it is lined with a ventilated void, breather paper and 350 mm cellulose insulation, manufactured using recycled newspaper. Inside, a light timber framework independent of the external wall supports the variable vapour-permeability airtight membrane and lime plaster finish. Insulating wall tiles maintain structural and thermal integrity. The greater wall thickness is used for window seats, and insulation wraps down through the cellar and beneath the old and new floors.
At the existing roof, a new 450 mm void is framed out beneath the retained slates and rafters. The new roof has 400 mm of cellulose insulation between timber I-beam rafters, over-boarded with 100 mm wood-fibre boards to give an improved decrement factor. All windows are triple-glazed.
The airtight system of grommets, membranes and tapes was able to seal even the most complex existing and new junctions. This has resulted in excellent airtightness results, as shown in Table 2.
To achieve zero use of fossil fuel, on-site PV, solar thermal and biomass renewables are installed. Electric needs are met by 35.6 m2 (5.04 kWp) of photovoltaic roof panels. Monitored performance results are included below. 8.8 m2 of evacuated tube solar hot water collectors are installed below the PV. An 850 L cylinder stores the heat, so one reasonably sunny day can give plentiful hot water over several dull days. The solar tubes therefore provide much of the house’s hot water. A 7 kW high efficiency clean-burn wood stove gives the small amount of top-up required for heating and hot water during the very coldest few weeks of the year.
The house’s ventilation is a pragmatic “mixed mode” design. The excellent insulation, airtightness and thermal bridge-free external building fabric could have been undermined if ventilation were inadequately controlled. A mechanical ventilation heat recovery system (MVHR) recovers waste heat and pre-warms incoming air.
On warmer days the house is naturally ventilated, reducing MVHR energy use. During the UK’s long intermediate spring and autumn seasons, natural and mechanical modes can be mixed. The design includes low level secure vents that can be left open at night. The high thermal mass of the house is described below and works with the ventilation strategy.
An existing mature ash tree is an important feature of the site. The south/west triple-glazing on much of the garden elevation admits essential winter sunshine to warm the heavyweight building, and internal insulating blinds reduce heat loss at night. The glazing is designed so the ash tree seasonally shades this glass: in winter the bare tree allows low angle Sun to penetrate deep into the house. Ash trees come into leaf relatively late, allowing useful heat gains in the spring; but in summer leaves shade the glazing from the high angle Sun to prevent overheating, avoiding the need for motorised or manual external blinds. Risks of overheating in buildings are increasing, and will become more critical with climate change, with key mitigating measures being insulation, ventilation, thermal mass and evaporative cooling from green plants (Jankovic, 2018).
The architectural design combines the technical details described above and enlarges the existing 1840 two-up, two-down terraced house by extending onto the vacant hard-standing adjacent. The modern work doubles the space on ground and first floors and adds a long studio on the second floor. The studio roof is at the right height, pitch and orientation for the solar panels, which provide so much of the house’s renewable energy needs.
Open-plan design on the ground floor creates a variety of different spaces: kitchen, dining and a tall top-lit living room within the existing house. The first floor has four bedrooms, two new and two in the old house, with shutters overlooking the double-height living area.
On the new top floor, a projecting dormer window forms a visual stop to the existing 1840 house below, which remains externally untouched. Planners welcomed the modern green design, filling a vacant gap in the street, and using materials - reclaimed imperial bricks, white render and 30° pitched slate grey roofs - in sympathy with the surroundings.
Architecture to inspire others is the third aim described in Section 1.3.1 above. The architectural design ideas grow out of the zero carbon aims. Two areas, daylight and materials, illustrate how the architecture of this scheme has been shaped.
High quality natural daylight floods through the house, with roof-lights and openings with mirrored linings. Better natural light reduces reliance on electric light and energy use. Designing with top lighting also has interesting design implications: vertical internal spaces have been introduced, especially within the retrofitted part of the house, to maximise these benefits and enhance the qualities of the old house, where original brickwork has been retained (Figure 3 and Figure 4).
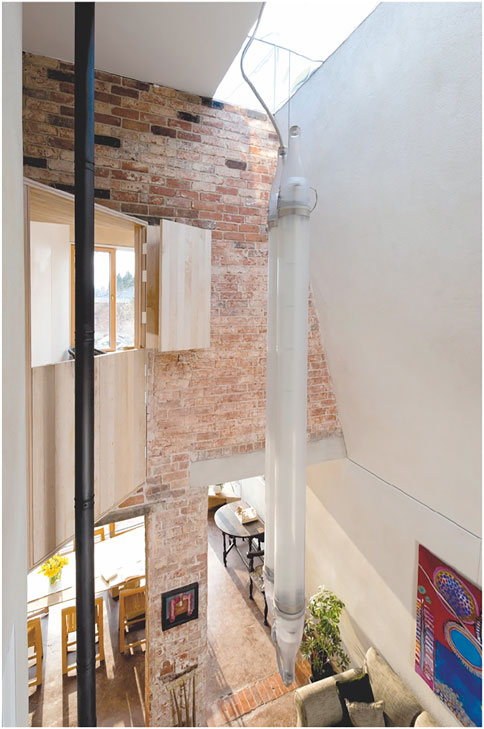
FIGURE 3. Double-height space living room (with permission from Martine Hamilton Knight/Builtvision).
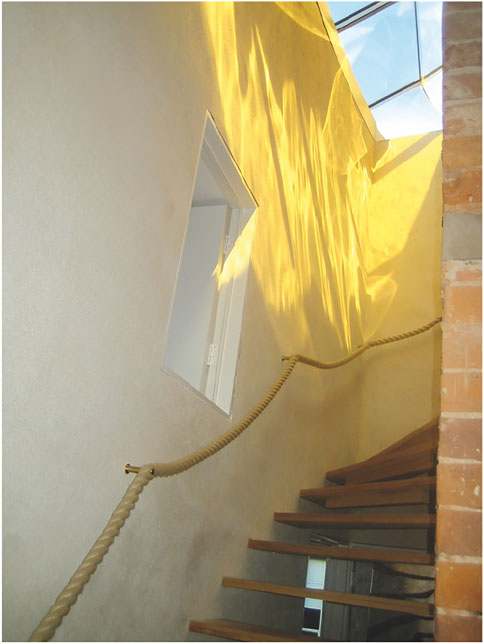
FIGURE 4. High-level openable glazing above the stairs with daylight patterns (courtesy of John Christophers).
Very low embodied carbon materials are used throughout, including fourteen different reclaimed materials. Some, like the structural timber from an old school used for floor joists and stud framing, below-ground drainage pipes and fittings, and reclaimed floorboards and OSB used for roof decking, are not visible; but many are. New interior walls are finished in natural self-coloured lime plaster, which sequesters carbon (Historic Scotland, 2014), with a slight glint of ground recycled green glass aggregate. Recycled glass is also used for the kitchen worktops and wet room floors. Brass ironmongery door lever handles, designed by the Danish architect Arne Jacobsen, are vintage 1960s reclaimed. Warm yellow 200-year old reclaimed Canadian honeydew maple boarding was sourced from a demolished local factory floor. It makes the stairs, an internal shuttered balcony, kitchen, window seats, dining room table, fitted shelving and the complete lining of the top floor timber dormer. Reclaimed bricks were salvaged from a local school and used for the front elevation facing brickwork, and for paving. The thermal insulation, used for all roofs and for internally lining the original brick front elevation, is Warmcel 500, cellulose insulation reprocessed from recycled paper. Wood-fibre insulation boards across the new roofs are also made from reprocessed waste wood. Over 99% of site construction waste was recycled with great diligence by the contractors Speller Metcalfe, who received a national Considerate Constructors award for this scheme.
Where new materials are used, these are very low environmental impact. All electrical wiring is PVC-free. Low VOC paints are used for ceilings, window linings and door frames; and beeswax and linseed oil finishes to floors and maple joinery. As well as timber, other plant-based materials include hemp rope used for handrails and door handles, and cotton canvas for cupboard doors.
The hydraulically-compressed load-bearing unfired earth blockwork structure is a UK first. The 200 mm thick walls required careful protection during construction so they did not dissolve in wet weather. The earth has very high thermal mass (better than concrete or brick) and hygroscopic qualities (Suhr et al., 2013, p. 123), which can act like an air-conditioning system and help regulate internal humidity. Coupled with its ventilation strategy, the house’s clay block walls, rammed earth floors, and solid Victorian brickwork are all heavyweight materials which heat up or cool down very slowly. They store passive heat gains from the Sun, occupants, electric appliances etc, helping to keep internal temperatures stable in both winter and summer. This high thermal mass, made with low carbon building materials seemed the simplest, most sustainable and least expensive way of ensuring the building would not overheat in the predicted hotter summers, providing adaptation to climate change, while avoiding the high CO₂ emissions of cementitious materials.
The earth block structure is rendered over, both internally and externally. More visibly, however, rammed earth floors (Figure 5) run throughout the house, undulating gently and polished with citrus oil and beeswax. The earth floors are generally 75 mm thick, laid over insulation on the ground floor and over composite timber floor structures on the upper levels. They are made with densely compacted material from the site excavations and with some additional clay, becoming very hard with age.
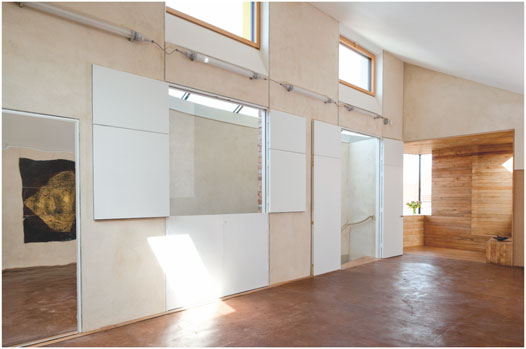
FIGURE 5. Zero carbon house top floor with rammed earth flooring (photo with permission from Martine Hamilton Knight/Builtvision).
Other measures were also taken on site to minimise the environmental impact of construction. These included site induction, avoiding diesel site machinery wherever possible, and recording the travel mileage of all site personnel and materials deliveries. This had the effect of making visible some of the carbon emissions which are normally hidden in construction, leading to greater knowledge, understanding and reduction on site wherever possible.
The analysis in Section 2 and Section 3 below quantifies in detail both the operational and the very low embodied carbon of the materials and construction described above.
Zero Carbon House can be clearly mapped to operational carbon and to circular economy in terms of building and materials reuse at design stage, as shown in Figure 1. However, there was no rigorous analysis of the whole life carbon at design stage. That aspect of the emissions was simply considered to be zero, as result of the building and materials reuse.
Given the increased understanding of the importance of embodied emissions in building materials as a contribution towards climate change (Jankovic et al., 2021), the overall aim of this paper was to put Zero Carbon House under the embodied emissions “lens”. The specific objectives arising from this aim are to quantify embodied emissions arising from retrofit of Zero Carbon House and to investigate the rate of reduction of these starting emissions, taking into account the operational emissions savings from retrofit. The main research question is:
When is Zero Carbon House going to achieve zero cumulative emissions, consisting of embodied and operational emissions?
The total of embodied and operational emissions on an ongoing basis will be referred to in this paper as cumulative emissions. These cumulative emissions over a life cycle of 60 years will be referred to as whole life carbon.
Embodied emissions from the retrofit of Zero Carbon House are considered to be a starting point on the journey towards zero emissions. These starting emissions will be reduced year on year by the savings in operational emissions achieved in two ways:
• Operation of the solar photovoltaic array negative operational emissions arising from supplying new generated energy into the grid, obtained from instrumental monitoring of the house)
• Operational savings compared with the building’s performance before the retrofit, obtained through detailed simulation (Jankovic, 2017).
Embodied emissions will be calculated using ICE database (Jones and Hammond, 2019), complemented using various other sources for embodied emissions of less usual materials not contained in that database.
The basis for calculation for the mass of each of the materials was a detailed simulation model of Zero Carbon House, developed in IES Virtual Environment (IES, 2021) at the time when this research started. In this model, each construction was defined layer by layer, using site survey and design and construction information obtained from the Architect John Christophers. The house geometry that was also part of the simulation model provided surface areas for the corresponding materials, while construction specifications or these materials in the model provided thicknesses of each layer. Thus, volumes of the materials were calculated as area x thickness, and that multiplied by the corresponding material densities of each of the volumes provided information of the corresponding mass. Each mass was subsequently assigned embodied emissions from the ICE database and the total embodied emissions were calculated from there.
From the ICE database of materials embodied carbon (Jones and Hammond, 2019), the figure of 0.024 kgCO₂e/kg for rammed earth has been used for the zero carbon house’s earth floors. As the wide range of embodied carbon emissions from different building materials is not yet widely understood, it is worth highlighting that plastic (3.31 kgCO₂e/kg) is 138 times more, and aluminium (6.67 kgCO₂e/kg) is 278 times more than rammed earth.
In a small number of cases, embodied emissions were obtained from corresponding sources for solar PV per kWp (Circular Ecology, 2021), solar thermal (Menzies and Roderick, 2010), and wood burning stove (Harnot and George, 2021). Although no wastage of building materials was possible to account for, all efforts were made to ensure accuracy of the building materials actually implemented in the construction.
RICS guidance was followed (RICS, 2017) for a building lifetime of 60 years, during which the emissions embodied in the construction materials, construction process, periodic maintenance, and end-of-life emissions due to deconstruction and disposal were calculated.
Operational emissions are calculated from the results of instrumental monitoring. The house is equipped with an instrumentation system for environmental performance monitoring, as shown in Figure 6. Battery operated wireless sensors transmit readings to a data logger located in the house and connected to an Internet router. Readings of electricity production and consumption, air temperatures in all rooms, air relative humidity in the kitchen, carbon dioxide concentration, flow and return water temperatures in the solar thermal system and in the flow and return pipes connected to the wood burning stove are monitored, together with external air temperature and solar radiation coplanar with the photovoltaic array and solar thermal collectors on the roof, and are transmitted to the data logger every minute, where they are stored in an internal memory of the logger. A separate set of wireless pulse readings are taken from flow meters on the wood burning stove water circulation loop, on the solar thermal system water circulation loop, and on the clamp transformers on the electricity cables, measuring exported and imported electricity. These readings are periodically downloaded by connecting to the data logger remotely from the Zero Carbon Lab, where they are used for conducting performance analysis.
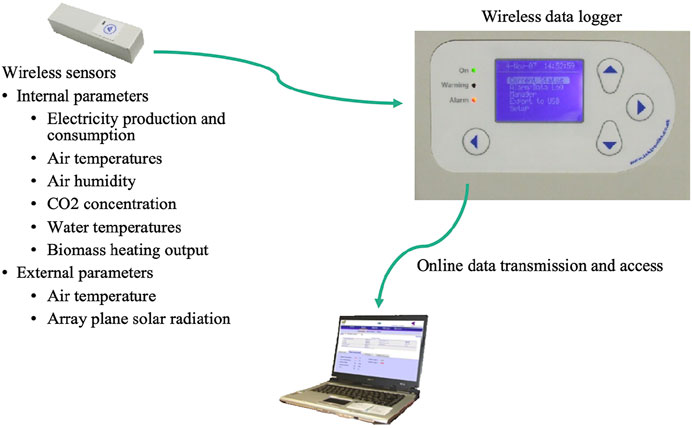
FIGURE 6. Diagram of the instrumentation system for environmental performance monitoring.
The records from instrumental monitoring were used to calculate biomass energy from the wood burning stove and from the solar thermal systems on the basis of Eq. 1:
where.
V–volume flow rate in l/s
ρ–water density in kg/l.
C–specific heat capacity of water in kJ/(kg K).
Tf–water flow temperature in K.
Tr–water return temperature in K.
3,600–conversion factor to get from kJ to kWh.
Export and import electricity values were obtained as direct readings from the corresponding pulse meters on the electricity supply.
Embodied emissions calculations are based on the guidance from the RICS (RICS, 2017) and on the Inventory of Carbon and Energy Database, initially developed by (Hammond and Jones, 2008) and the updated Embodied Carbon Footprint Database (Jones and Hammond, 2019).
The basis for the RICS guidance is a building lifetime of 60 years, during which the emissions embodied in the construction materials, construction process, periodic maintenance, and end-of-life emissions due to deconstruction and disposal are to be taken into account.
As the Zero Carbon House is a retrofit and an expansion of an existing 1840s house, emissions from the construction of the original house were taken into account as zero.
A summary of calculations of embodied emissions is shown in Table 3. The source of emissions factors is based on ICE database (Jones and Hammond, 2019), unless referenced specifically to another source in this table.
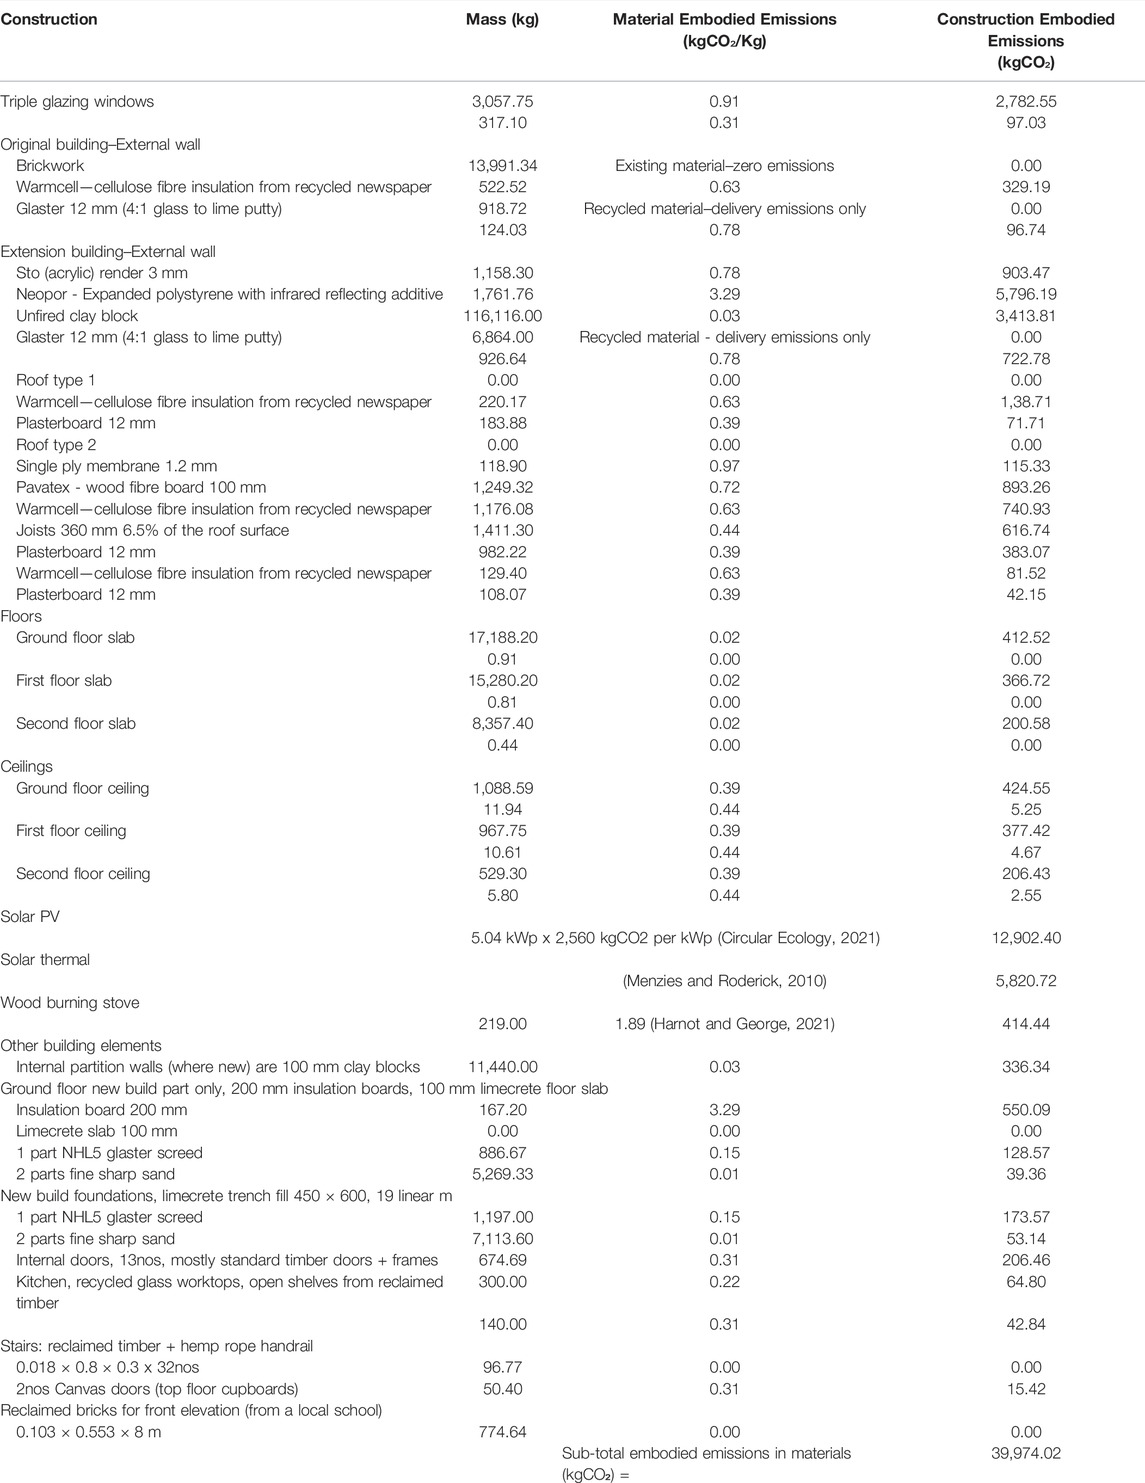
TABLE 3. Summary calculations of embodied emissions in materials.
Carbon emissions from the construction process are calculated as.
• emissions from people travel based on (VCA, 2016), shown in Table 4.
• emissions from material deliveries based on (Thusro, 2013), shown in Table 5.
• emissions from the operation of site machines based on (Heidari and Marr, 2015), shown in Table 6.
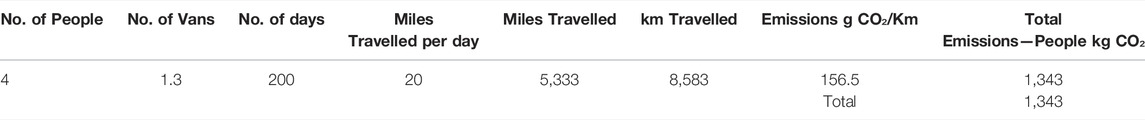
TABLE 4. Emissions from people travel.
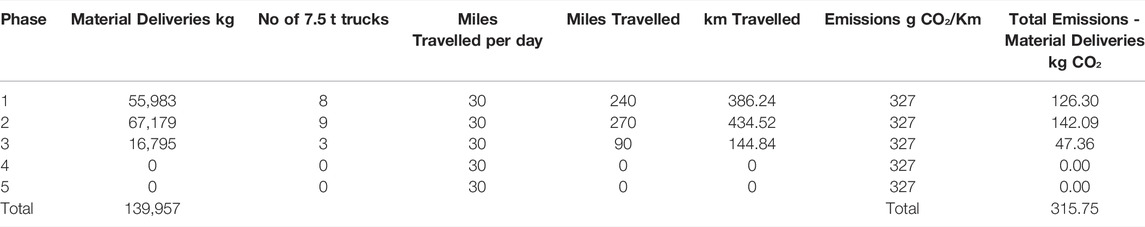
TABLE 5. Emissions from material deliveries.
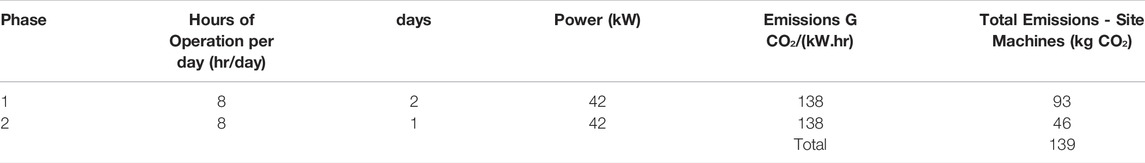
TABLE 6. Emissions from operation of construction equipment on site—source (Heidari and Marr, 2015).
Emissions from maintenance were calculated using RICS guidance (RICS, 2017), and are shown in Table 7.
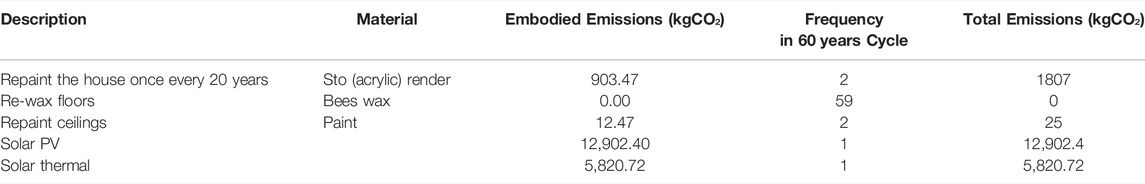
TABLE 7. Emissions from maintenance.
End of life emissions are calculated using RICS guidance (RICS, 2017). They are subdivided into:
• deconstruction and demolition emissions based on Section 3.5.4.1 [C1] of the RICS document (Table 8).
• transport emissions based on Section 3.5.4.2 [C2] of the RICS document (Table 9), and
• disposal emissions based on Section 3.5.3.4 [C4] of the RICS document (Table 10).
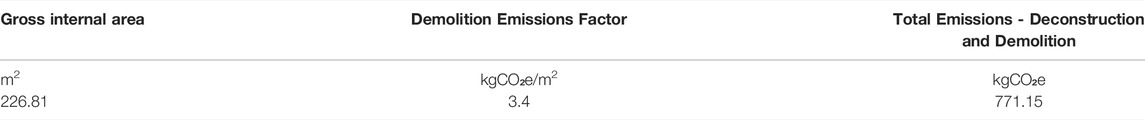
TABLE 8. Deconstruction and demolition emissions—demolition of the building.
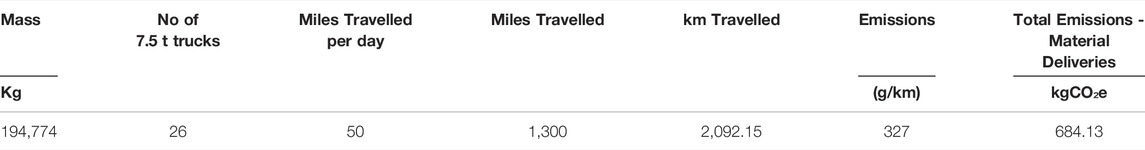
TABLE 9. Transport emissions.
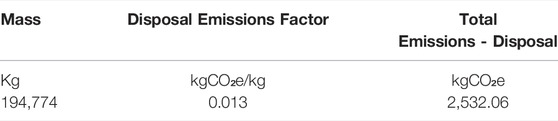
TABLE 10. Disposal emissions.
The total of end of life emissions is the sum of the previous three tables: 3,987.34 kgCO2.
The operational emissions introduced in Section 2.1, calculated using data from instrumental performance monitoring are summarized in Table 11.
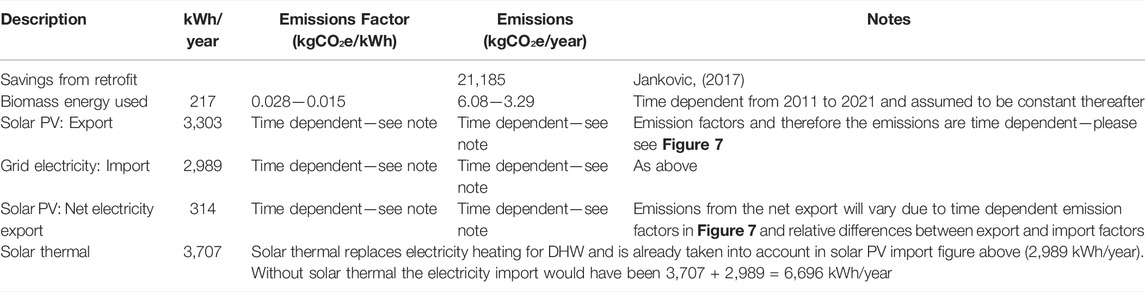
TABLE 11. Operational emissions.
Total annual operational emissions are then calculated as:
Eoperational =—Emissions saving s from retrofit + Emissions from biomass heating + Time dependent emissions from PV electricity export—Time dependent emissions from PV electricity import.
The embodied emissions calculated in detail in Section 2.2, are summarised in Table 12.
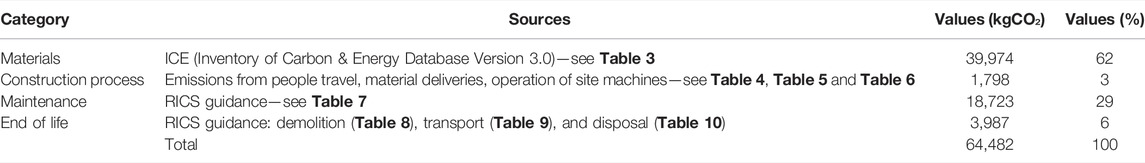
TABLE 12. Summary of embodied emissions.
The total cumulative emissions, combining embodied and operational, are shown in Figure 8. The starting embodied emissions of 41,772 kgCO₂ are offset year by year by the savings from retrofit of 21,185 kgCO₂ and the solar PV net export multiplied by time dependent emission factors in Figure 7, whilst slightly increased by emissions from the wood burning stove. Scheduled maintenance of rendering and repainting every 20 years (Table 7) introduces a small ‘kink’ to the cumulative emissions chart in 2030 and 2050, and the replacement of solar PV and solar thermal systems in 2040 (Table 7) introduces a larger “kink” to the cumulative emissions chart.
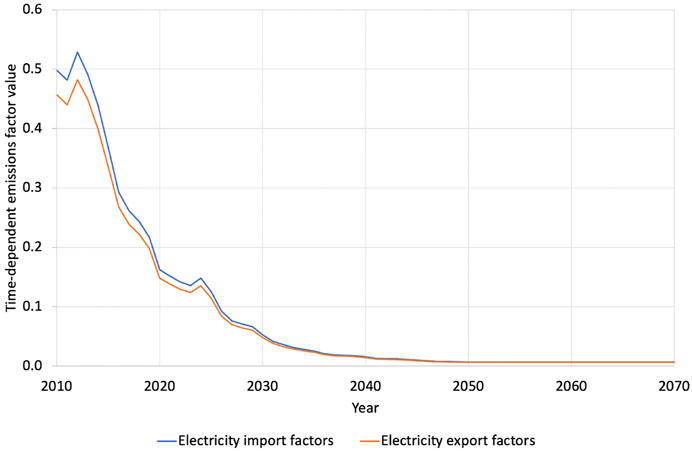
FIGURE 7. Time-dependent emissions factor value—source (Department for Business, Energy & Industrial Strategy, 2021)
This gives the answer to our research question: the total cumulative emissions go below zero in 2012.
Cumulative emissions will continue to fall to 2070, when another increase due to end of life emissions bring the total life carbon emissions to −1,204,720 kgCO₂. Given the large scale of emissions savings, the small kinks in 2030, 2050 and 2070 are not easily noticeable in the chart in Figure 8.
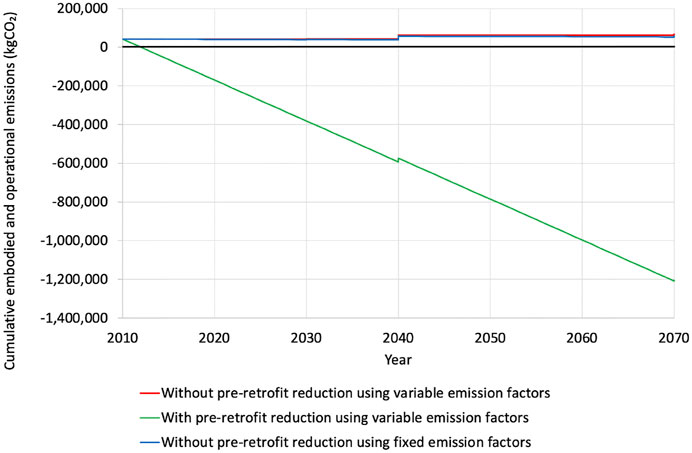
FIGURE 8. Total cumulative emissions.
At 34 kWh/m2. yr, the monitored operational energy use of zero carbon house, including both regulated and unregulated energy, is about a quarter of a current Building Regulations Part L house. It is significantly better than both Passivhaus and Passivhaus Plus standards, and in line with the leading LETI and RIBA (2030) standards for new houses. The renewable technologies incorporated supply more than the operational energy requirements, resulting in better-than-zero negative carbon operation as shown in Table 11.
Table 12 shows that 62% of the embodied carbon of the project is in its building materials. It is worth highlighting the largest two components of this. 12,902 kgCO₂e, or 32% of the building materials total, is from the PV solar panels and 5,820 kgCO₂e, or 15% of the materials total, is from the solar thermal installation. Using the monitored performance figures, the embodied carbon in the PV panels is offset by the power they generate after 7.55 years, and the embodied carbon in the solar thermal installation after just 3.04 years. As it can be seen from Table 11, solar thermal generates 3,707 kWh/year, in comparison with PV exported energy 3,303 kWh/year. Given the relative difference between 15 and 32% of the total embodied emissions in this particular case, this creates an important insight into solar thermal, namely that more surplus energy is generated by solar thermal than solar PV, using less than half of the corresponding embodied emissions.
A total of 29% of the total embodied emissions are due to maintenance over the 60 years time frame. By far the largest component of this is the planned replacement of the PV and solar panels after their design life of 30 years, in effect duplicating their embodied carbon emissions. If the UK electricity grid were decarbonised rapidly enough, evidenced by the UK government published predictions of time dependent emission factors shown in Figure 7 (Department for Business, Energy & Industrial Strategy, 2021), it might prove unnecessary to replace the PV panels, which would reduce the embodied carbon figure for the project. If the building had relied on fossil fuels from utility services, rather than incorporating its own renewables, its embodied carbon emissions would be lower. Owing to the significant embodied carbon in these renewables, it is striking that the embodied carbon would reduce from 64,482 to 45,759 kgCO₂e without them, or from 316 kgCO₂e/m2 to 224 kgCO₂e/m2. However, the whole life carbon model used includes the significant operational carbon benefits of these renewables to give a more complete picture.
RIBA Climate Challenge 2030 (RIBA, 2019) and UKGBC zero carbon standards (UKGBC, 2019) require offsetting of embodied carbon to achieve “net zero” over a theoretical 60 years design life. A number of different options exist for this offsetting, where there is evolving discussion over allowable and verifiable solutions. Clearly the concern is that a building with relatively high operational carbon emissions could use extensive offsets elsewhere to justify a “net zero” description, while making little attempt at reducing its actual carbon emissions. By contrast, the analysis above (Figure 1 and Table 12) demonstrates that the zero carbon house requires no third party carbon offsetting. Within the first 2 years of its operation, its operational carbon emissions savings have offset its embodied carbon, including the embodied carbon of its on-site renewables.
There is a time dimension of embodied versus operational emissions. Embodied emissions are the starting point, and operational emissions reductions reduce the starting point year on year. The higher the embodied emissions and the smaller the annual reduction, the longer it would take to reach zero. Conversely, the lower the embodied emissions and the larger the annual reduction, it would take a shorter time to reach zero.
This has practical design implications. To reduce embodied emissions, bio-sourced materials with sequestered carbon can be used. That would reduce the emissions starting point and would have implications on the time it takes to reach zero. With lower embodied emissions, a smaller scale PV installation would be required, thus saving on embodied emissions from the PV itself. Re-used materials will come with low or no embodied emissions, as these emissions would have been attributed to their first time use, thus reducing the starting embodied emissions in retrofit even further.
The assumption was made that the upfront embodied emissions from the original house before the retrofit was zero, as the original house is more than 60 years old. However, if the house was less than 60 years old, these emissions would have been taken into account. These are estimated to be approximately 26,000 kgCO₂e, and this would have caused more than one additional year before the cumulative emissions reach zero on the basis of savings from retrofit of 21,185 kgCO₂e/year (Table 11).
There are also wider implications to future interventions and policy. Recent research shows that 19.1 million homes will need to be retrofitted to zero emissions by 2050, which requires a rate of retrofit of nearly 1,870 homes per day (Jankovic, 2022). As shown in Table 12, embarking on the Zero Carbon House retrofit created an upfront carbon commitment of 64,482 kgCO₂e, or 316 kgCO₂e/m2. The cost of retrofit of the Zero Carbon House was £60,596 (Jankovic, 2017), or £297/m2. The average size of the UK home is 729 ft2 (Joyner, 2021), or approximately 68 m2. Thus, to retrofit 19.1 million homes would require the upfront carbon commitment of 19.1 × 106 × 316 kgCO₂e/m2 x 68 m2, which comes to over 410 billion kgCO₂e. Similar calculation for the overall investment cost comes to nearly £386 billion. Based on the number of retrofits of 1,870 per day, these figures correspond to upfront carbon commitment of 219 million kgCO₂e/day, and to investment cost of over £206 million/per day. This is the scale of efforts that need to be deployed across the UK and beyond to reach net zero by 2050.
Zero Carbon House is a retrofit and an expansion of an existing 1840s house. Due to its retrofit status, emissions from the construction of the original house were set to zero. The house has been monitored by Zero Carbon Lab since 2010, where circa 20 internal and external parameters have been recorded every minute. This enabled the calculation of the operational emissions and proved its operational carbon-negative status. Embodied emissions were calculated on the basis of RICS guidance and using ICE embodied emissions database for a period of 60 years. These took into account emissions from Materials, Construction process, Maintenance, and End of life. The starting embodied emissions are offset year on year by negative operational emissions and savings of emissions from the existing building pre-retrofit. Analysis shows that the house performance meets or exceeds RIBA 2030, Passivhaus and LETI standards. It was found that operational emission savings have reduced to total emissions, embodied and operational, within 2 years.
Wider implications of this research show that over 410 billion kgCO₂e and investment cost of nearly £386 billion will be required to retrofit all of the 19.1 million UK homes to zero carbon performance by 2050. Retrofitting more recent houses that are less than 60 years old would require upfront carbon used for their construction to be taken into account, and that is expected to be balanced by the savings from retrofit, depending on the exact details of the houses undergoing the retrofit.
Architect: John Christophers/ zero carbon house,Building contractor: Speller Metcalfe Limited, Joinery: Eddie Gallagher, Services engineer: LEDA, Airtightness: Ecological Building Systems, Ecologist: Worcestershire Wildlife Consultancy, Solar engineering: Greenshop Solar, MVHR: Green Building Store, Artist: Jake Lever, Photography: Martine Hamilton Knight, Copyright.
This paper is dedicated to the memory of Eddie Gallagher. Eddie made all the joinery for the zero carbon house in his workshop next-door, working with 200-year old Canadian Honeydew maple. While some are sceptical about reclaimed material, Eddie enthusiastically embraced it, understanding its low embodied carbon, avoidance of waste, and beauty. Eddie died recently from respiratory disease, partly due to working with the formaldehydes and other high VOCs still prevalent in woodworking glues etc. The authors hope his memory will encourage us all to work tirelessly for healthy and true zero carbon sustainable construction.
The original contributions presented in the study are included in the article. Further inquiries can be directed to the corresponding author.
Conceptualization, JC; methodology, LJ and JC; investigation, LJ; writing—original draft preparation, LJ and JC; writing—review and editing, JC and LJ.
The authors gratefully acknowledge the funding from the School of Creative Arts, University of Hertfordshire for the maintenance of the instrumentation system in Birmingham Zero Carbon House.
The authors declare that the research was conducted in the absence of any commercial or financial relationships that could be construed as a potential conflict of interest.
All claims expressed in this article are solely those of the authors and do not necessarily represent those of their affiliated organizations, or those of the publisher, the editors and the reviewers. Any product that may be evaluated in this article, or claim that may be made by its manufacturer, is not guaranteed or endorsed by the publisher.
Carbon Emergency UK (2021). List of Councils Who Have Declared a Climate Emergency | Declare a Climate Emergency. Available at: https://www.climateemergency.uk/blog/list-of-councils/ (Accessed 21 3, 22).
Carlson, C. (2021). Ten Global Projects that Demonstrate the Possibilities of Low-Energy Architecture. Available at https://www.dezeen.com/2021/09/14/ten-global-projects-low-energy-architecture-jared-green/ (Accessed 30 11, 21).
Circular Ecology (2021). Solar PV Embodied Carbon-Circ. Ecol. Available at: https://circularecology.com/solar-pv-embodied-carbon.html (Accessed 10 3, 22).
DCLG (2009). Code for Sustainable Homes: Technical Guide. London: Department for Communities and Local Government.
Department for Business, Energy & Industrial Strategy (2021). Green Book Supplementary Guidance: Valuation of Energy Use and Greenhouse Gas Emissions for Appraisal. GOV.UK. Available at: https://www.gov.uk/government/publications/valuation-of-energy-use-and-greenhouse-gas-emissions -for-appraisal (Accessed 10 3, 22).
Gormley, A. (2010). “Art in the Time of Global Warming,” in Long Horizons: An Exploration of Art + Climate Change (London: British Council).
Green, J. (2021). Good Energy: Renewable Power and the Design of Everyday Life. Hudson, New York: Princeton Architectural Press.
Hammond, G. P., and Jones, C. I. (2008). Embodied Energy and Carbon in Construction Materials. Proc. Institution Civ. Eng. - Energy 161, 87–98. doi:10.1680/ener.2008.161.2.87
Harnot, L., and George, C. B. (2021). Chartered Institution of Building Services Engineers Embodied Carbon in Building Services: A Calculation Methodology.
Heidari, B., and Marr, L. C. (2015). Real-Time Emissions from Construction Equipment Compared with Model Predictions. J. Air & Waste Manag. Assoc. 65, 115–125. doi:10.1080/10962247.2014.978485
Historic Scotland (2014). Short Guide: Lime Mortars in Traditional Buildings. Edinburgh: National Conservation Centre.
IES (2021). VE 2021. Available at: https://www.iesve.com/VE2021 (Accessed 8 11, 21).
Jankovic, L., Bharadwaj, P., and Carta, S. (2021). How Can UK Housing Projects Be Brought in Line with Net-Zero Carbon Emission Targets? Front. Built Environ. 7, 754733. doi:10.3389/fbuil.2021.754733
Jankovic, L. (2018). Designing Resilience of the Built Environment to Extreme Weather Events. Sustainability 10, 141. doi:10.3390/su10010141
Jankovic, L. (2017). Designing Zero Carbon Buildings Using Dynamic Simulation Methods. 2nd ed. London and New York: Routledge.
Jankovic, L. (2022). Radical Overhaul of Construction Industry Needed if UK to Have Any Chance of Net Zero by 2050 – New Research The Conversation.
Jones, C., and Hammond, G. P. (2019). Embodied Carbon Footprint Database. Available at https://circularecology.com/embodied-carbon-footprint-database.html (Accessed 1 10, 21).
Joyner, L. (2021). Here’s What the Average UK House Price Actually Buys You. Available at: https://www.housebeautiful.com/uk/lifestyle/property/a35405209/average-house-price-england-square-foot-yes-homebuyers/ (Accessed 5 14, 22).
V. Masson-Delmotte, P. Zhai, A. Pirani, S.L. Connors, C. Péan, S. Bergeret al. (Editors) (2021). Climate Change 2021: The Physical Science Basis. Contribution of Working Group I to the Sixth Assessment Report of the Intergovernmental Panel on Climate Change (Cambridge: Cambridge University Press).
Menzies, G. F., and Roderick, Y. (2010). Energy and Carbon Impact Analysis of a Solar Thermal Collector System. Int. J. Sustain. Eng. 3, 9–16. doi:10.1080/19397030903362869
Paone, A., and Bacher, J-P. (2018). The Impact of Building Occupant Behavior on Energy Efficiency and Methods to Influence It: A Review of the State of the Art. Western Switzerland: University of Applied Sciences and Arts.
RIBA (2019). 2030 Climate Challenge. Available at: https://www.architecture.com/about/policy/climate-action/2030-climate-challenge (Accessed 30 11, 21).
RICS (2017). Whole Life Carbon Assessment for the Built Environment. London: Royal Institution of Chartered Surveyors.
Sarshar, M. (2018). UK Needs to Retrofit 26 Million Homes by 2050 to Reduce Greenhouse Gas Emissions. https://www.politicshome.com/members/article/uk-needs-to-retrofit-26-million-homes-by-2050-to-reduce-greenhouse-gas- emissions (Accessed 15 3, 22).
Suhr, M., Hunt, R., and McCloud, K. (2013). “Society for the Protection of Ancient Buildings,” in Old House Eco Handbook: A Practical Guide to Retrofitting for Energy-Efficiency & Sustainability (London: Frances Lincoln).
UKGBC (2019). Net Zero Carbon Buildings: A Framework Definition. Available at: https://www.ukgbc.org/ukgbc-work/net-zero-carbon- buildings-a-framework-definition/ (Accessed 30 11, 21).
UN Environment Programme (2020). Building Sector Emissions Hit Record High, but Low-Carbon Pandemic Recovery Can Help Transform Sector – UN Report UN Environ. Available at: http://www.unep.org/news-and-stories/press-release/building-sector-emissions-hit-record-high-low-carbon-pandemic (Accessed 15 3, 22).
VCA (2016). Vanfueldata Vehicle Certificate Agency. Available at: https://vanfueldata.vehicle-certification-agency.gov.uk/vehicles.aspx.
Keywords: zero carbon retrofit, embodied emissions, operational emissions, reclaimed materials, renewable energy, instrumental monitoring
Citation: Jankovic L and Christophers J (2022) Cumulative Embodied and Operational Emissions of Retrofit in Birmingham Zero Carbon House. Front. Built Environ. 8:826265. doi: 10.3389/fbuil.2022.826265
Received: 14 February 2022; Accepted: 16 May 2022;
Published: 08 July 2022.
Edited by:
Hasim Altan, Arkin University of Creative Arts and Design (ARUCAD), CyprusReviewed by:
Alice Moncaster, The Open University, United KingdomCopyright © 2022 Jankovic and Christophers. This is an open-access article distributed under the terms of the Creative Commons Attribution License (CC BY). The use, distribution or reproduction in other forums is permitted, provided the original author(s) and the copyright owner(s) are credited and that the original publication in this journal is cited, in accordance with accepted academic practice. No use, distribution or reproduction is permitted which does not comply with these terms.
*Correspondence: Ljubomir Jankovic, TC5KYW5rb3ZpY0BoZXJ0cy5hYy51aw==
Disclaimer: All claims expressed in this article are solely those of the authors and do not necessarily represent those of their affiliated organizations, or those of the publisher, the editors and the reviewers. Any product that may be evaluated in this article or claim that may be made by its manufacturer is not guaranteed or endorsed by the publisher.
Research integrity at Frontiers
Learn more about the work of our research integrity team to safeguard the quality of each article we publish.