 Angshuman C. Baruah
  Ann C. Sychterz
 - Civil and Environmental Engineering, University of Illinois Urbana-Champaign, Urbana, IL, United States
The ancient art of origami can be harnessed for the development of adaptive structures, including those at civil-engineering scale. This can be enhanced with biomimetics, the study and development of synthetic mechanisms that mimic the structure or functionality of biological organisms in nature. The origami structure presented in this paper draws inspiration from pill bugs, a species of woodlice that can alter its shape between a flat and a rolled configuration. The panel type origami pill bug structure is modelled as bars, hinges, and active elements for actuation. This paper provides analysis and comparison of a new formulation of the form-finding method called dynamic relaxation for the analytical study with a computer vision algorithm for the experimental study of a 3D-printed model. The objective of this study is to simulate and experimentally validate the quasi-static and dynamic response to characterize the kinematic properties and dynamic behavior of the origami pill bug structure.
1 Introduction
The art of origami has inspired engineering devices and structures over the past few decades. Applications include deployable solar panels (Miura et al., 1985; Zirbel et al., 2013), sandwich panel cores (Ballard et al., 2016; Sab and Lebée, 2010), self-deployable stent-grafts (Kuribayashi et al., 2006), and configurable metamaterials (Silverberg et al., 2014). The concepts of origami have been applied for the development of different self-folding structures (Peraza-Hernandez et al., 2014), that can fold and/or unfold without any external manipulation. Significant contributions by Tachi and Miura towards cellular origami have led to the development of fold patterns named after them. The theory behind flat-foldable origami (Hull, 1995) has extended towards understanding the geometry of rigid-foldable origami (Tachi, 2016) and the kinematics of folded metamaterials (Schenk and Guest, 2013). Kinematic analysis of origami by modeling the creases as hinges and panels as rigid links was successful in providing insight into the rigid foldability of crease patterns (Lang et al., 2016). The use of pin-jointed bar framework with rotational hinge spring for fold stiffness was independently developed (Schenk and Guest, 2011; Gillman et al., 2018) to provide insight into the fundamental characteristics of origami structures without the expanse of a full analysis of the shell structure. Li and Wang (2015) have also provided a pin-jointed truss frame for effective system synthesis and design of continuous fluidic origami. A similar approach using bar and hinge models was studied by Filipov et al. (2015), Filipov et al. (2016), Filipov et al. (2017) and Liu and Paulino (2017) for the analysis of scalable origami structures. Fabrication, testing, and analysis of adaptive deployable origami at mid to large-scale are yet to be achieved.
Adaptive structures can alter their form, configuration, and properties based on environmental conditions (Gantes et al., 1989; Pellegrino, 2001). Deployability of such structures has found application in the field of civil engineering for bridges, roof systems (Akgün et al., 2011), and emergency infrastructure (Pérez-Valcárcel et al., 2020). Deployable structures provide an appealing solution for aerospace (Puig et al., 2010) and extra-terrestrial (Pellegrino, 1995) applications. Dynamic characterization of structures (Li et al., 2011) presents computational challenges due to large changes in shape, and therefore geometric compatibility requirements result in non-linear behavior (Gantes et al., 1989). This limits the application of classical finite element approaches and therefore other methods need to be studied to analyse these structures.
Dynamic relaxation (DR) method proposed by Otter (1965) and Day (1965), provides a suitable approach for form-finding and analysis of structures with a high degree of structural non-linearity (Cassell and Hobbs, 1976). It is a vector-based pseudo-dynamic static analysis that does not require matrix inversion and hence has a low cost of computation. This makes dynamic relaxation a strong candidate for integration with real-time algorithms that include machine learning and experimental measurements. Barnes (1999), Barnes et al. (2013) modified the method to include kinetic damping and to improve convergence. This method has also been used to simulate the behavior of adaptive structures (Fest et al., 2004; Domer and Smith, 2005; Sultan and Skelton, 2003; Korkmaz, 2011; Kmet et al., 2012). Form-finding methods like dynamic relaxation has proven better in handling actuation of these structure using external elements that change shape and size. There are energy methods yielding a static solution that can simulate contact mechanics of origami assemblages (Filipov et al., 2017). Although the dynamic relaxation method cannot compute contact mechanics, a module written by the authors can be included to calculate distances between lines and planes in 3D space at each actuation step to check for element collision (Sychterz and Smith, 2018).
Biomimetics is the study and development of synthetic mechanisms that mimic the structure or functionality of biological organisms. The adaptation of natural conformations to engineering applications is leading to profound changes in the design of structural systems (Liu and Jiang, 2011; Nojoomi et al., 2018) and control Sychterz (2019). Although biomimetics has been implemented for shape biomimetics, there has not been work completed on movement biomemetics of origami.
Computer vision is the field of study that deals with automated extraction of useful information from visual inputs, analysis of the data and meaningful interpretation of the results (Ballard et al., 2016; Milan Sonka and Vaclav, 2008; Huang, 1996). Modern approaches combine two methods, Digital Image Correlation (DIC) and Feature-Based Image Registration (FBIR) (Brown, 1992), to optimize efficiency and to obtain a robust and accurate system (Sutton et al., 2016). Computer vision utilizes optical flow methods for tracking a set of pixels in a series of images and relies on pixel luminance intensity values for tracking rather than color (Khaloo and Lattanzi, 2017). The Lucas-Kanade method for optical flow estimation (Lucas and Kanade, 1981) assumes a constant flow in a local neighborhood to provide high robustness under noise. The Scale Invariant Feature Transform (SIFT) was first developed by David Lowe (1999) that identifies local features which are invariant of translation, scaling, and rotation. Speed Up Robust Feature (SURF) algorithm (Bay et al., 2006) is an extension of this method and is used for feature detection. Estimation of a transformed model is carried out using Random Sample Consensus (RANSAC) (Fischler and Bolles, 1981), and relies on multiple iterations to match data sets and eliminate outliers. Image-based object tracking has found application in structural health monitoring (Yoon et al., 2016; Alavi and Buttlar, 2019; Spencer et al., 2019) and has been field validated for bridge testing to accurately measure deformations (Murray, 2013; Murray et al., 2015; Cai et al., 2019). However, application of image-based object tracking algorithms for dynamic characterization of adaptive structures is yet to be explored.
This paper provides a comparison between the analytical and the experimental model of the origami pill bug structure. The analytical study of the structure involves a dynamic relaxation method along with a finite element model for dynamic analysis of the structure. An experimental model comprising of hard polymer panels and flexible rubber hinges is used for the experimental study of the cable-actuated structure. A computer vision algorithm is used to track displacements and used to accurately track displacements in the experimental investigation. An overview of the simulated origami structure is provided and is followed by the results of the preliminary experimental study. This is used to validate the results from the DR method for quasi-static form-finding and dynamic characterization of the origami pill bug, as well as its behavior at different configurations throughout rolling. The novelty of this paper is that it attempts to understand the change in stiffness of the origami pill bug, a geometrically non-linear structure, due to shape-change that results in deployment. The origami pill bug design is a test bed to study the change in stiffness throughout the deployment process of a shell system. This study seeks to advance the state of the art by utilizing the tool of origami to design mid to large-scale deployable structures for civil engineering applications and investigate their dynamic characteristics.
2 Structural Simulation of Origami Pill Bug
The origami pill bug (OPB) structure is inspired by the morphological characteristics of the pill bug (Armadillidiidae), a species of woodlice. Pill bugs can roll their body into a ball shape in a process called conglobation, when triggered by an external stimulus as shown in Figure 1A. This ability to roll into a ball serves as the basis for the design of the adaptive origami-enabled pill bug structure. The OPB structure is initially in unrolled state. The actuation of the OPB structure is carried out utilizing actuation cables connected at the base of the structure. When actuated, the OPB transforms into its rolled configuration as shown in Figure 1B.
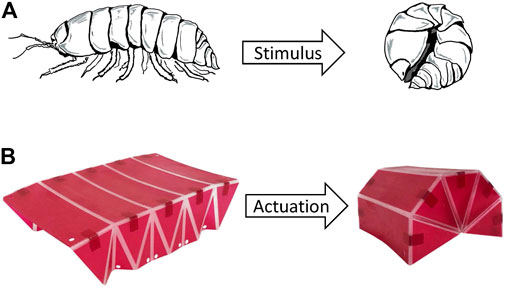
FIGURE 1. (A) Rolling of a pill bug (Armadillidiidae) in response to external stimulus in a process called conglobation, (B) Rolling of a OPB structure due to cable actuation.
A single module of the OPB is shown in Figure 2 depicting the different element and fold types. Fold lines are categorized into mountain, valley, side, and ridge folds. To reduce the computational cost, the structure is modeled as bars, hinges, and active elements for actuation. Panels are modeled with diagonal elements to account for panel bending effects. A five-node-eight-bar N5B8 model with diagonal elements connecting each corner node to the center node of each panel as shown in Figure 2, was suitable to characterize the behavior of the OPB. The model accounts for panel bending and uses a similar topology method as an energy-based approach. The diameter of each bar, and hence the mass, is calculated based on formulation as given by Filipov et al. (2017). The bar cross-sectional areas were calculated using a stiffness equivalent to a solid pane. Experimental results from the Miura-Ori origami fold (Sychterz and Baruah, 2021) shows measurements are in alignment with the bar-hinge model formulation for mid-scale origami structures.
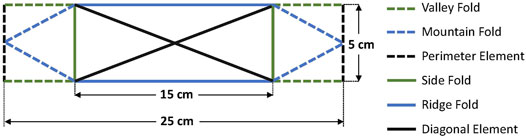
FIGURE 2. A module of the OPB structure showing different element and fold types. N5B8 bar and hinge model is used for the rectangular panels.
The structure consists of five module OPB topology as shown in Figure 3. The OPB is initially in a flat configuration measuring 15 cm (width) by 23.32 cm (length), which serves as a base model. Figure 3 also shows the different node types and boundary conditions employed for the structure. Support nodes on the left are depicted with [ieqn1] and are pinned to the base. On the other hand, movement at the support nodes on the right depicted by [ieqn2] are restricted in both y and z direction. Mountain nodes are marked with [ieqn3] and are restrained only in y direction. Panel, ridge, and valley nodes are depicted with [ieqn4], [ieqn5], and [ieqn6], respectively; and can all move unrestricted. Cables elements are represented by thick solid lines as shown in Figure 3 that run through the valley nodes and connect the support nodes on each side of the structure. Nodal position of the left support nodes [ieqn7] are used to determine the length and pitch of the OPB structure during the deployment process.
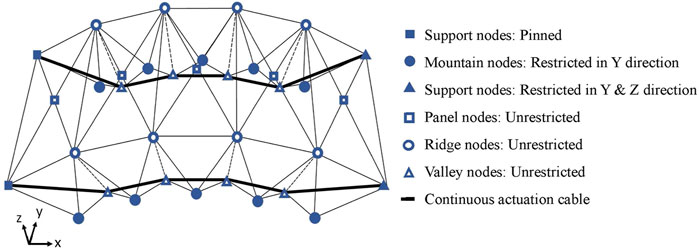
FIGURE 3. Five module OPB structure showing node types and boundary conditions. Support nodes [ieqn8] are pinned and [ieqn9] are restricted y and z direction. Valley nodes [ieqn10] are restrained only y direction. Panel nodes [ieqn11], ridge nodes [ieqn12], and mountain nodes [ieqn13]can all move unrestricted. The two actuation cables run through the valley nodes and connect the support nodes on each side.
Actuation is carried out in the x direction by changing the length of the actuation cables. Since the structure is actuated at a slow and constant rate, the inertial effects due to actuation are negligible. Simulation of the structure is assumed to have reached static equilibrium at each step of the deployment process. A dynamic relaxation method is used for quasi-static analysis; and a finite element model is used for the dynamic analysis of the OPB structure.
2.1 Simulation Using Dynamic Relaxation
The simulation of the OPB utilizes a novel module within the dynamic relaxation (DR) method developed for the actuated Miura-Ori origami structure (Sychterz and Baruah, 2021). However, the study deals with a new topology and system behavior. Dynamic relaxation is a form-finding method based on discretization using lumped mass at the nodes. The pseudo-dynamic analysis includes fictitious inertia and damping terms; and follows an iterative process in time where each iteration is based on the updated geometry from the previous step. The utilization of fictitious inertia and damping terms gives an augmented equation of motion based on Newton’s second law of motion. This augmented equation of motion is used to determine a new static equilibrium for the structure. The DR method is modified to include the calculation of angle stiffness within the calculation of residual forces. This enables the modified DR method to successfully characterize origami hinge stiffness and makes it suitable for application in iterative actuation algorithms for large structures. The fundamental mathematical formulation of the DR method has been well documented in the papers by Bel Hadj Ali et al. (2017), and Sychterz and Baruah (2021).
Although DR is capable of handling cable friction in the structure (Bel Hadj Ali et al., 2017; Sychterz and Smith, 2017), the effect of friction analytically and experimentally was determined to be negligible. Additionally contact mechanics was not considered for this method as the structure was able to achieve its final configuration without risk of element collision. Characterization of folding and bending stiffness in origami within the dynamic relaxation methods is applied to the origami pill bug. The structure is self-stressed by varying the length of the actuation cables (Sychterz and Smith, 2018).
For calculation of bend angles (θb) and fold angles (θf), one element defines the vertex fold line vector,
The bending stiffness (KB) and the folding stiffness (KF) for the bar and hinge model of the OPB structure are calculated based on formulation for thin material provided in the paper by Filipov et al. (2017) and listed in Table 1. For simplicity, the folding stiffness (KF) for the valley folds, mountain folds and folds along ridge elements are assigned to be equal. To account for panel bending effects, bending stiffness (KB) is assigned to the diagonal panel elements. Since the model is restrained at all the mountain nodes, the stiffness of the side folds have negligible impact on boundary conditions to achieve the desired folding pattern. A stiffness ratio (Kf/Kb) of 0.1 (Schenk and Guest, 2013) was found to be suitable for the study (Sychterz, 2019). Materials properties used for the calculation of different parameters are also listed in Table 1 along with the cross-sectional area for each type of bar element. The bar areas are proportioned based on the cross-sectional area to the total volume ratio of a Miura-Ori structure (Filipov et al., 2017). Displacement controlled actuation of the OPB is carried out by shortening the length of each cable segment by an increment of 0.05 cm for every actuation step in the new DR module. Cables on both sides are actuated at the same rate to avoid curling effects due to actuation.
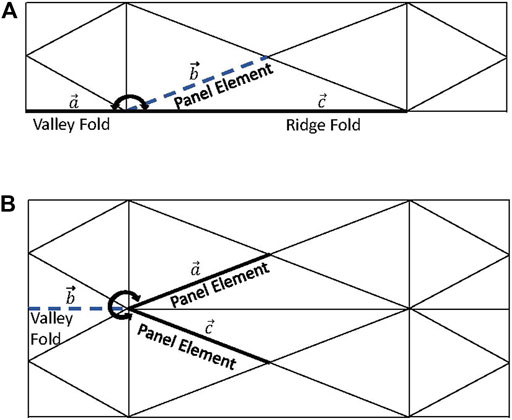
FIGURE 4. Schematics to determine (A) Bend angle (θb) and (B) Fold angle (θf) based on a vertex fold line vector

TABLE 1. Material properties and model parameters for the OPB.
Figure 5 shows the OPB structure at its initial unrolled and final rolled configuration obtained using the modified DR method. The blue dashed line corresponds to the unfolded state, and the solid black line represents the rolled state of the OPB. The dimensions of the reference axis in global x, y and z direction corresponding to length, width and height of the structure are given in cm. The nodal coordinates of the two left support nodes are used to determine the length of the structure during the deployment process.
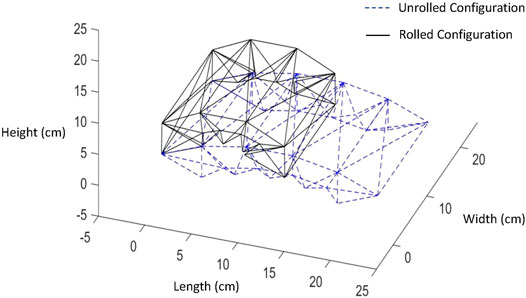
FIGURE 5. Initial unrolled configuration (represented by discontinuous blue line) and final rolled configuration (represented by continuous black line) of the OPB structure using DR method.
As shown in Figure 5, the length of the structure changes from 23.3 cm for the unrolled configuration to a final length of 13.3 cm when the structure is completely rolled. Actuation results in a reduction of 10.0 cm for the length of the structure, which corresponds to a percentage change of 42.9% between these two extreme configurations of the OPB.
2.2 Simulation Using Finite Element Model
A finite element (FE) program called SOFiSTiK (2020) is used to model the OPB structure as shown in Figure 6. Folding stiffness (KF), bending stiffness (KB) and other material dimensions and properties are adopted based on the values listed in Table 1 to maintain continuity between the DR and the FE model. To account for folding and bending stiffness in the FE model, rotational springs are assigned at the nodes of the structure. Rotational spring with stiffness 0.5KF acting about the local y-axis of the element is assigned at end nodes of each valley and mountain fold whereas torsional moment about the local x-axis and moment about the local z-axis is released at both the end nodes. The in-plane stretching and shearing of the rectangular panels as well as panel bending effects are approximated with a series of rotational springs at the end nodes of the diagonal elements of each panel. The stiffness towards bending of the panel face is calculated as KB as shown in Table 1. Springs with rotational stiffness of 0.5KB, acting about the local y-axis, are assigned at the nodes and torsion about the local x-axis is neglected. Rotational moment is released about the local z-direction of the diagonal element. For modelling consistency, boundary conditions for the FE model is kept identical to those of the boundary conditions of the DR method shown in Figure 3.
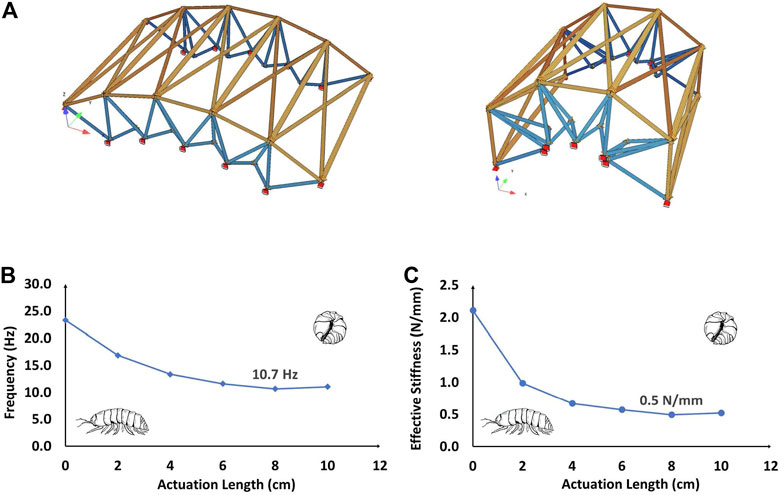
FIGURE 6. (A) Finite element model for the 5-module OPB structure from SOFiSTiK (2020) in both unrolled and rolled configuration. (B) The plot shows the frequencies of the first structural mode at different stages of rolling. First modal frequency of the OPB structure decreases through rolling reaching a minimum of 10.7 Hz. (C) The plot shows the effective stiffness of the structure based on its first structural mode frequencies. Effective stiffness of the structure decreases over actuation with a minimum value of 0.5 N/mm.
The configuration data from the form-finding of the OPB using the novel module of the DR method is utilized to generate the FE model at each stage of deployment. Figure 6A shows the FE model for the unrolled and the rolled configuration of the 5 module OPB obtained from SOFiSTiK (2020). A modal analysis of the OPB structure is carried out to determine the change in stiffness of the OPB as it undergoes deployment. The plot of first modal frequency (Hz) vs. actuation length (cm) in Figure 6B shows that the modal frequencies for the OPB structure decrease non-linearly between the unrolled (inactive) and the rolled (active) configuration. The minimum value for the first structural frequency was calculated at 10.7 Hz from the FE model as shown in Figure 6B. The mode shape for this frequency, the vertical direction, stays constant throughout deployment.
The modal frequencies at different stages of rolling along with the modal mass are tabulated in Table 2 for the first natural mode. The modal mass represents the percentage of the system mass that participates in a given mode. Effective stiffness of the structure is defined as the stiffness calculated based on the modal analysis of the FE model for each configuration from DR. The effective stiffness of the OPB structure shows a non-linear decreasing trend as the structure is actuated into the rolled configuration. It reaches a minimum of 0.5 N/mm between the unrolled and the rolled state as shown in the effective stiffness (N/mm) vs. actuation length (cm) plot in Figure 6C.
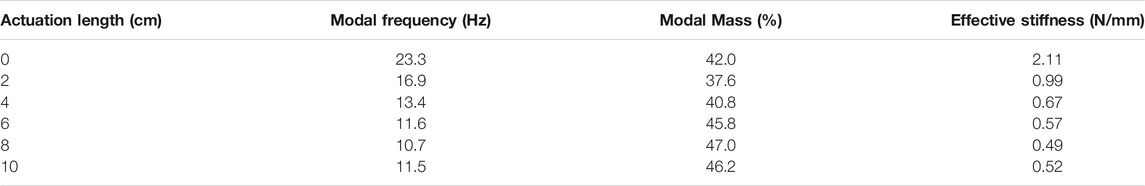
TABLE 2. Calculation of effective stiffness (N/mm) of the OPB structure at different stages of rolling.
3 Experimental Study
3.1 Experimental Structure
An experimental structure was 3D printed using Objet500 Connex3TM printer by Stratasys for the experimental study of the OPB. The overall planar dimensions of the model are 250 mm by 250 mm. A thickness of 1 mm was adopted for the 3D-printed prototype to facilitate an appropriate mathematical solution for the fold and bend stiffness from the formulation provided by Filipov et al. (2017). The experimental model is a multi-material model, meaning different materials were used for the panels and the fold lines. For the panels VeroMagentaVTM was used with a tensile strength of 60 MPa. Whereas, for the flexible fold lines, we used a much compliant material named Agilus30TM clear with a tensile strength of 2.5 MPa. The experimental model is also reinforced at the side folds using angle blocks. These angle blocks are 3D-printed using VeroMagentaVTM with each leg having dimensions of 150 mm by 100 mm and a thickness of 1 mm. This is to imitate the boundary conditions of the mountain nodes ([ieqn14]) where the nodes are restrained in y-direction and to attain the desired folding pattern.
3.2 Experimental Testing
The experimental set-up consists of a rigid platform with a black and white chequered background of one inch squares for measurements and reference. Two clear acrylic blocks are fixed on this platform to support the 3D-model and provide the necessary boundary conditions. Two brackets with pulleys are attached to slotted rails on the test platform as shown in Figure 7. Two actuating cables connect the support nodes and the valley nodes on either side of the structure and pass over two pulleys. To provide uniform actuation, the two actuation cables are connected to a rod. Actuation of the structure is carried out by moving the rod downward as shown in Figure 7. The vertical displacement of the rod is used to calculate the actuation length. A calibration stick is used to calibrate the displacement measurements. The set-up also involves two sets of camera to record the experiment. The first camera (shown in Figure 7) is a inSwanTM document camera and is used to record the displacement of the 3D-printed structure at 30 fps. A second camera captures the displacement of the rod throughout the rolling process to record the actuation data. Contrasting tags are attached to the structure to facilitate tracking by the computer vision algorithm.
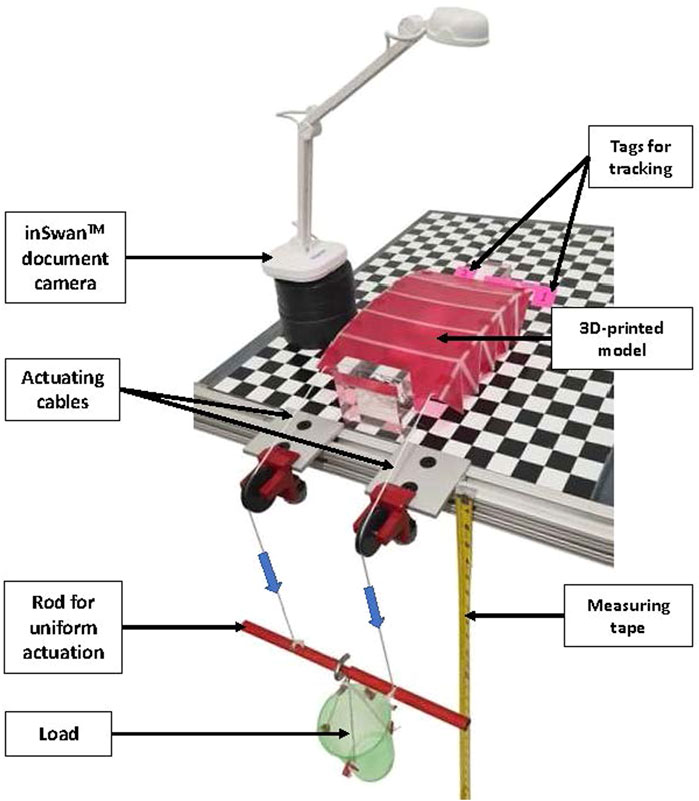
FIGURE 7. Setup for the experimental study of OPB structure. Actuation cables on either side of the 3D-printed model go over the pulleys and connect to a rod. The structure is uniformly actuated pseudo-statically by applying load on the rod. The inSwanTM document camera is used to capture the displacement of the experimental model and contrasting tags are used for tracking these displacements using computer vision.
Actuation is carried out in a slow and steady rate to avoid inertial effects during the rolling process. Two modes of actuation is employed for the experimental study of the OPB structure, displacement-controlled actuation and force-controlled actuation. For displacement-controlled actuation, the actuating cable is shortened by moving the rod shown in Figure 7 downwards, while keeping the rate of actuation constant at approximately 0.1 cm/s. Actuation is stopped when the OPB reaches its final folded configuration. The experiment was repeated fifteen times for displacement-controlled actuation of the 3D-printed model. The mean structural displacement over all the trials of the experiment is considered for further calculations to provide more robust results and account for human error during experimentation.
Force-controlled actuation is carried out by pseudo-static loading of the rod. The loading bucket shown in Figure 7 is initially considered to be at zero load condition. The bucket is loaded in steps of 10 g each. An interval of 1 min is provided between each step of loading to allow the structure sufficient time to fold under that particular load. Loading on the structure is continued until the structure attains its final rolled configuration. To reduce experimental error, fifteen iterations of the force-controlled actuation of the experimental model is carried out and subsequent calculations are based on the mean value of the structural displacement for more robust data.
3.3 Image Tracking Using Computer Vision
The study utilizes a computer vision algorithm to accurately determine the length of the structure throughout the rolling process. Figure 8 shows the procedure for image-based object tracking, where the image of the unrolled OPB is used as the reference frame for tracking displacements (i). The reference image frame is divided into grids and a Region of Interest (ROI) is selected (ii). The Speed Up Robust Features (SURF) algorithm (Bay et al., 2006) detects feature points from the ROI which are invariant of translation, rotation, and scaling (iii). The images of the rolled configuration at each stage of deployment serve as the target image for calculating displacement (iv). The algorithm also compensates for lens and camera distortion during recording (v). SURF feature points from the target image are extracted from the ROI for comparison (vi). The feature points in the ROI are traced in the deformed object frame in accordance with their cross-correlation to determine peak values (Safy et al., 2014) and relative displacement is traced based on the deformation map generated (vii). The transformed model is estimated using Random Sample Consensus (RANSAC), which maps the control points from the target image to the corresponding points in the reference image (Fischler and Bolles, 1981). Multiple iterations are carried out to match data sets and eliminate outliers based on the threshold value (viii). The traced inliers are used to calculate the new feature location (ix). If the traced features fall outside the ROI (x), the algorithm generates an error and the control is returned to the selection of ROI (ii) window for remarking of the region. However, if the traced points are within the acceptable limits (x), displacement is calculated to determine the length of the structure for that particular image frame (xi). The displacement data for each image frame is saved (xii). The program iteratively runs this algorithm for all the image frames (xiii). If the current image frame does not correspond to the last image, the program runs the algorithm for the subsequent (n+1)th image. Once all the image frames are exhausted, the program yields the tracking data (xiv) for the OPB structure for the experimental study as shown in Figure 8. This tracking algorithm is run following the collection of video data and is therefore not in real time.
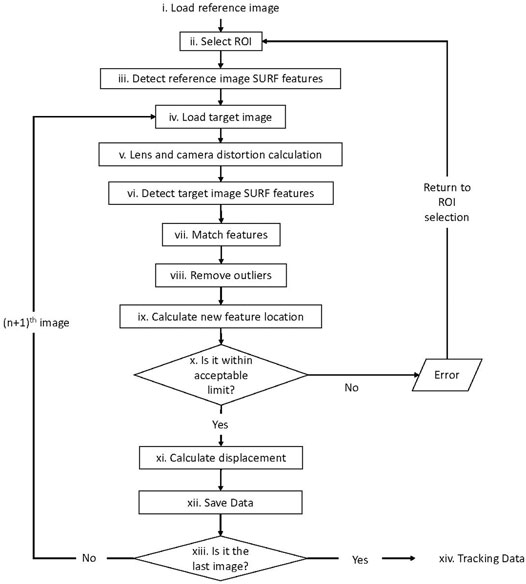
FIGURE 8. Procedure for image-based object tracking for the OPB structure using computer vision.
Figure 9 shows the graphical representation of different stages of the computer vision algorithm used to track the deployment of the OPB structure. Once the image is loaded, the ROI is selected, shown by the yellow rectangular box in Figure 9A. The contrasting tags on the structure provides easily detectable stable features for tracking the displacement of the structure. The algorithm identifies stable feature points that are invariant of rotation and translation on the structure lying within the ROI as shown in Figure 9B. These identified feature points are then matched between the reference and the target image. In Figure 9C, the image on the left shows the reference image and the image on the right shows the target image. The matched features need to be filtered to remove outliers. The lines connecting the two halves in Figure 9C shows the matched features after eliminating the outliers. The inliers are used to track the identified features between the reference and the target image as shown in Figure 9D and provides the displacement of the structure between the two image frames.
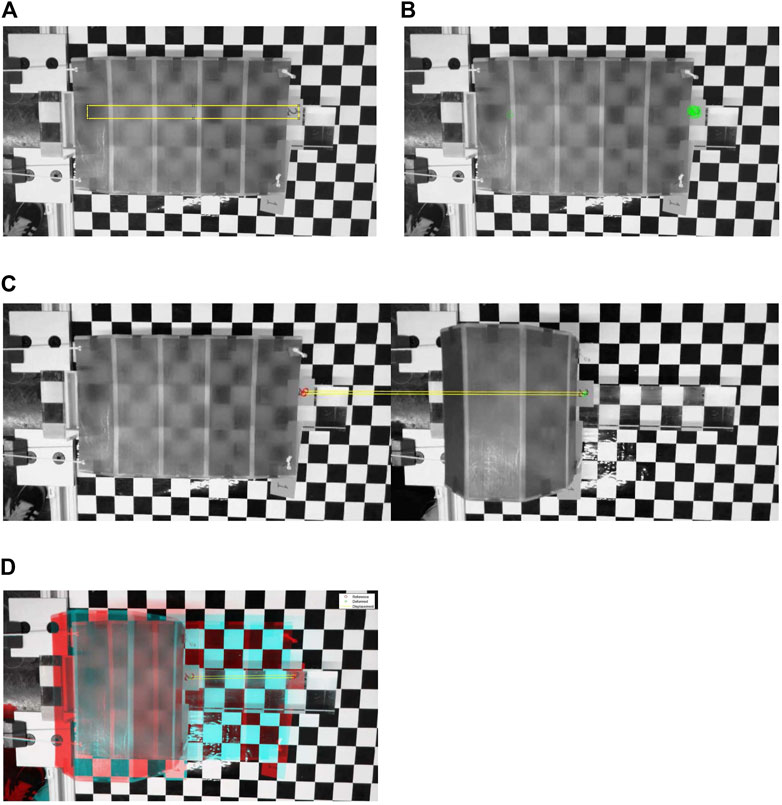
FIGURE 9. Image-based object tracking using computer vision. (A) Selecting ROI for the OPB model, (B) Detected SURF features for tracking, (C) Matched features after eliminating the outliers, (D) Tracked features.
For displacement-controlled actuation, the image-based object tracking algorithm is used to accurately determine the displacement of the structure. This is achieved by tracking the displacement of the contrasting tags on the OPB model. Since the experimental model is symmetrical and actuation is equal on both sides, two tags were chosen. The algorithm is also used to calculate the actuation length by tracking the vertical the movement of the rod and referencing it to the calibration stick. The structural displacement (cm) vs. the actuation length (cm) for displacement-controlled test is plotted in Figure 10. The structural displacement data is averaged over the fifteen iterations of the experiment and is depicted by the continuous blue line in the plot. The standard deviation of the structural displacement is also calculated at each actuation length for the experimental data. The grey region represents the area enclosed under two standard deviations on either side (±2σ) of the mean structural displacement. The discontinuous black line corresponds to the approximated behavior for the change in length of the structure against actuation for the 3D-printed experimental model of the OPB as shown in Figure 10.
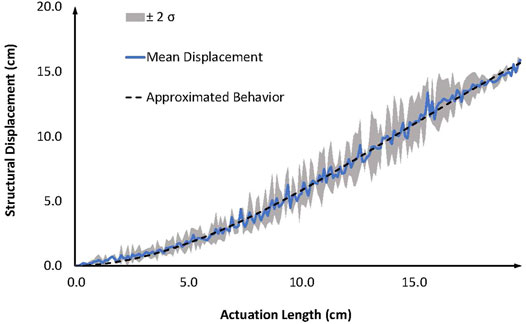
FIGURE 10. Plot for structural displacement (cm) vs. actuation length (cm) where the continuous blue line shows the mean structural displacement (cm) obtained from the experimental study. The gray region represents the area enclosed under two standard deviations on either side of the mean structural displacement. The discontinuous black line depicts the approximated behavior for change in length of the structure (cm) against actuation length (cm).
Application of the tracking algorithm for the force-controlled experimental model yields the structural displacement (cm) vs. applied load (g) plot shown in Figure 11A. The continuous blue line corresponds to the mean structural displacement of OPB model under each applied load, averaged over ten trials of the experiment. The standard deviation of the displacement data is calculated at each load step. The gray shaded region shows the area under two standard deviations on both sides (±2σ) of the mean structural displacement. Kinetic stiffness is derived from the experimental results and refers to the change of stiffness in the time domain as the structure deploys. The mean displacement and applied load data are harnessed to calculate the kinetic stiffness of the structure from the force-controlled experiment. Figure 11B shows the plot for kinetic stiffness (N/mm) against the applied load (g).
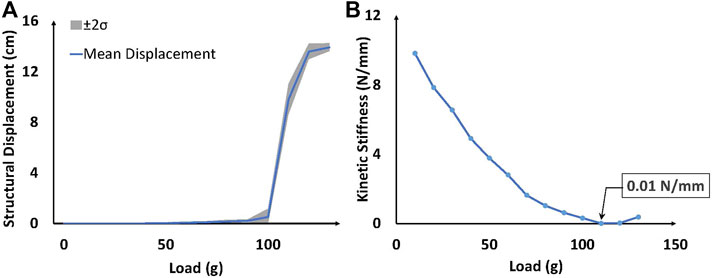
FIGURE 11. (A) Plot for structural displacement (cm) vs. load (g) applied for the OPB experimental model. The continuous blue line represents the mean structural displacement and the gray region shows the area enclosed under two standard deviations on either side of the mean displacement. (B) Kinetic stiffness (N/mm) vs. load (g) plot for the OPB model showing the non-linear decrease in effective stiffness to a minimum of 0.01 N/mm.
4 Results and Comparison
4.1 Simulation Results
The structural simulation of the OPB uses the N5B8 bar and hinge model to reduce computational cost and account for panel bending. The novel module in DR method solves for form-finding at stages of rolling as shown in Figure 5. The length of the OPB structure changes from 23.3 cm in the unrolled state to 13.3 cm for the rolled state, giving 42.9% change in the length of the structure between the two configuration as tabulated in Table 3.
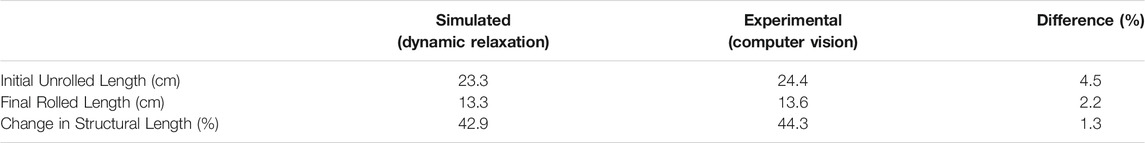
TABLE 3. Comparison of the percentage change in length of the OPB structure between the simulated and the experimental results.
Finite element analysis of the structure at each configuration obtained from DR method shows that the modal frequency of the OPB decreases non-linearly as the structure transforms into its rolled configuration. The minimum value for the first modal frequency of the OPB was found to be 10.7 Hz over the deployment process as depicted in Figure 6B. The effective stiffness of the OPB, calculated based on the modal frequency and the activated mass percentage, also shows a non-linear decreasing trend as shown in Figure 6C. The effective stiffness of the structure for the first mode reaches a minimum value of 0.5 N/mm. Table 2 tabulates the values for modal frequency (Hz), activated mass (%) and effective stiffness (N/mm) of the OPB structure at different stages of actuation for the first structural mode.
4.2 Experimental Results
The experimental consists of a 250 mm by 250 mm 3D-printed model with angle stiffeners for side folds. Application of the computer vision algorithm to the experimental model gives accurate measurements for the displacement of the structure at different stages of deployment. The image-based object tracking algorithm tracks the contrasting tags on the OPB structure to determine the length of the structure throughout activation. The plot of average structural displacement (cm) of the OPB against the actuation length (cm) in Figure 10 shows a non-linear relation between the two parameters. The grey region represents the area under two standard deviations on either side (±2σ) of the mean structural displacement and gives us a measure of the spread of the experimental data at any particular actuation length. The discontinuous black line shows the approximated behavior for structural displacement against actuation length. Approximation of the mean displacement with a cubic polynomial yields a behavior that shows a proper fit within the gray band.
Actuation efficiency is defined as the displacement of the structure (cm) per unit actuation (cm). Thus the slope of the cubic approximation of the mean displacement vs. actuation length plot represents the actuation efficiency at any particular configuration. The actuation efficiency of the OPB structure increases as the structure rolls into its folded configuration as shown in Figure 10. This corresponds to the observation that effective stiffness of the structure decreases as the structure folds as shown in Figure 6C, thus making the structure more compliant.
The mean displacement represented by the continuous blue line in the structural displacement (cm) vs. the load (g) plot for the force-controlled OPB model in Figure 11A shows that the flat configuration of the OPB is kinematically locked to an extent resulting in very small deformations for initial loading. Because of geometrical non-linearity, the stiffness of the structure decreases rapidly after a certain configuration has been achieved. This leads to high deformations around 100–120 g load. The shaded region corresponding to two standard deviations on either side (±2σ) of the mean displacement and shows the spread of the experimental data at different load steps. A narrow spread of the grey region correlates to consistent data over each iteration of the force-controlled experiment. The effective stiffness (N/mm) is calculated as the force required to cause unit displacement of the OPB model. The plot of effective stiffness (N/mm) against applied load (g) in Figure 11B shows a non-linear decreasing trend over the rolling process. The minimum effective stiffness of 0.01 N/mm was obtained from experimental study.
4.3 Comparison and Discussion
A comparison between the pseudo static form-finding results from the DR simulation and the experimental results using computer vision is presented for the OPB structure. The change in length of the structure is calculated as the average displacement of the two left support nodes ([ieqn15]) between the initial unrolled and final rolled configuration. As tabulated in Table 3, a difference of 4.5% between the simulated and the experimental results was calculated for the initial unrolled length of the structure. Similarly, for the final rolled configuration, this difference was calculated to be 2.2%. The comparison between the simulation and the experimental results yields a difference of only 1.3% for the change in length of the structure between the initial unrolled and the final rolled configuration. The experimental test data also indicates the contribution of uncertainties such as joint construction and cable sliding friction in the dynamic behavior of the OPB structure.
Figures 6B,C depicts the non-linear behavior of the OPB structure obtained from the simulation model using the novel DR method. For the experimental study, the behavior of the 3D-printed OPB model was approximated using a cubic polynomial as shown by the discontinuous black line in Figure 10. Thus, the cubic polynomial behavior of the structure from the experimental data is congruent with the simulation results which show that the structure behaves non-linearly over the folding process. The lower stiffness of the folded mode as compared to the flat mode can be attributed to the geometric non-linearity of the origami pill bug structure. Thus, even though the stiffness of individual hinges increases at the component level as the structure folds, the overall stiffness of the structure level at the system level decreases.
Effective stiffness obtained from the FE analysis of the static configurations of OPB using the dynamic relaxation method and the kinetic stiffness derived from the force-controlled experiments define two unique properties for the study. Since the effective stiffness corresponds from a step wise static analysis (Dynamic Relaxation) and kinetic stiffness is corresponds to dynamic analysis (experimental results), a comparison between them shows similar trend but do not directly correlate to each other due to geometric non-linearity of the structure. Both parameters show non-linear decreasing trend over the actuation process with a characteristic minimum as shown in Figures 6C, 11B. However, the minimum value for the effective stiffness obtained from the FE analysis of the simulated model is greater than the minimum kinetic stiffness calculated using the experimental model of the OPB.
The origami pill bug structure can be used for a wide range of applications, from adaptive façades (Gruber and Gosztonyi, 2010) to deployable emergency shelters (Lee et al., 2014). The variable natural frequency of the origami pill bug throughout deployment can be potentially utilized to design active vibration attenuation systems for irregularly shaped or large span light-weight structures.
5 Conclusion
Results of experimental tests using computer vision program are in agreement with the simulation using the novel module within dynamic relaxation method of the origami pill bug structure. This validates that the new dynamic relaxation module is an effective method for quasi-static form-finding of the origami pill bug structure. The image-based object tracking using computer vision is successful in identifying and tracking key features of the 3D-printed model to accurately determine the change in length of the structure throughout the rolling process. Comparison between the analytical and experimental results provides characterization of dynamic behavior and kinematic properties of the origami pill bug structure.
Data Availability Statement
The raw data supporting the conclusion of this article will be made available by the authors, without undue reservation.
Author Contributions
AB completed the modeling, experimental testing, and contributed towards the writing of the manuscript (75%). AS was responsible for the concept development, procurement of funding, supervising modeling and experimental work as well as contributing towards writing and editing of the manuscript (25%).
Funding
The research is sponsored by startup funding provided by the University of Illinois at Urbana-Champaign.
Conflict of Interest
The authors declare that the research was conducted in the absence of any commercial or financial relationships that could be construed as a potential conflict of interest.
Publisher’s Note
All claims expressed in this article are solely those of the authors and do not necessarily represent those of their affiliated organizations, or those of the publisher, the editors and the reviewers. Any product that may be evaluated in this article, or claim that may be made by its manufacturer, is not guaranteed or endorsed by the publisher.
Acknowledgments
The authors would like to thank Mr Tohma Kobayashi for his contributions towards conducting the experimental testing.
References
Akgün, Y., Gantes, C. J., Sobek, W., Korkmaz, K., and Kalochairetis, K. (2011). A Novel Adaptive Spatial Scissor-Hinge Structural Mechanism for Convertible Roofs. Eng. Structures 33, 1365–1376. doi:10.1016/j.engstruct.2011.01.014
Alavi, A. H., and Buttlar, W. G. (2019). An Overview of Smartphone Technology for Citizen-Centered, Real-Time and Scalable Civil Infrastructure Monitoring. Future Generation Comput. Syst. 93, 651–672. doi:10.1016/j.future.2018.10.059
Ballard, Z. C., Thrall, A. P., and Smith, B. J. (2016). Behavior of Folding sandwich Panel Structures: Impact of Ground Conditions, anchorage, and Panel Warping. Construction Building Mater. 112, 1110–1122. doi:10.1016/j.conbuildmat.2016.03.035
Barnes, M. R., Adriaenssens, S., and Krupka, M. (2013). A Novel Torsion/bending Element for Dynamic Relaxation Modeling. Comput. Structures 119, 60–67. doi:10.1016/j.compstruc.2012.12.027
Barnes, M. R. (1999). Form Finding and Analysis of Tension Structures by Dynamic Relaxation. Int. J. Space Structures 14, 89–104. doi:10.1260/0266351991494722
Bay, H., Tuytelaars, T., and Van Gool, L. (2006). Surf: Speeded up Robust Features, 3951. Berlin, Heidelberg: LNCS, 404–417. doi:10.1007/11744023_32
Bel Hadj Ali, N., Sychterz, A. C., and Smith, I. F. C. (2017). A Dynamic-Relaxation Formulation for Analysis of cable Structures with Sliding-Induced Friction. Int. J. Sol. Structures 126-127, 240–251. doi:10.1016/j.ijsolstr.2017.08.008
Brown, L. G. (1992). A Survey of Image Registration Techniques. ACM Comput. Surv. 24, 325–376. doi:10.1145/146370.146374
Cai, Y., Fu, X., Li, F., Li, H., and Zhang, L. (2019). “Application of Ssr for Bridge Deflection Measurement by Using of Digital Image Correlation,” in 2019 IEEE 4th International Conference on Image, Vision and Computing (ICIVC), Xiamen, China, 5-7 July 2019. doi:10.1109/icivc47709.2019.8980849
Cassell, A. C., and Hobbs, R. E. (1976). Numerical Stability of Dynamic Relaxation Analysis of Non-linear Structures. Int. J. Numer. Meth. Engng. 10, 1407–1410. doi:10.1002/nme.1620100620
Domer, B., and Smith, I. F. C. (2005). An Active Structure that Learns. J. Comput. Civ. Eng. 19, 16–24. doi:10.1061/(asce)0887-3801(2005)19:1(16)
Fest, E., Shea, K., and Smith, I. F. C. (2004). Active Tensegrity Structure. J. Struct. Eng. 130, 1454–1465. doi:10.1061/(asce)0733-9445(2004)130:10(1454)
Filipov, E. T., Chun, J., Paulino, G. H., and Song, J. (2016). Polygonal Multiresolution Topology Optimization (Polymtop) for Structural Dynamics. Struct. Multidisc Optim 53, 673–694. doi:10.1007/s00158-015-1309-x
Filipov, E. T., Liu, K., Tachi, T., Schenk, M., and Paulino, G. H. (2017). Bar and Hinge Models for Scalable Analysis of Origami. Int. J. Sol. Structures 124, 26–45. doi:10.1016/j.ijsolstr.2017.05.028
Filipov, E. T., Tachi, T., Paulino, G. H., and Weitz, D. A. (2015). Origami Tubes Assembled into Stiff, yet Reconfigurable Structures and Metamaterials. Proc. Natl. Acad. Sci. USA 112, 12321–12326. doi:10.1073/pnas.1509465112
Fischler, M. A., and Bolles, R. C. (1981). Random Sample Consensus. Commun. ACM 24, 381–395. doi:10.1145/358669.358692
Gantes, C. J., Connor, J. J., Logcher, R. D., and Rosenfeld, Y. (1989). Structural Analysis and Design of Deployable Structures. Comput. Structures 32, 661–669. doi:10.1016/0045-7949(89)90354-4
Gillman, A., Fuchi, K., and Buskohl, P. R. (2018). Truss-based Nonlinear Mechanical Analysis for Origami Structures Exhibiting Bifurcation and Limit point Instabilities. Int. J. Sol. Structures 147, 80–93. doi:10.1016/j.ijsolstr.2018.05.011
Gruber, P., and Gosztonyi, S. (2010). Skin in Architecture: Towards Bioinspired Facades. WIT Trans. Ecol. Environ. 138, 503–513. doi:10.2495/DN100451
Huang, T. (1996). in Computer Vision : Evolution and Promise. Editor C E. Vandoni (Geneva: 19th CERN School of Computing, CERN), 21–25. ISBN 978-9290830955: (1996-11-19). doi:10.5170/CERN-1996-008.21
Khaloo, A., and Lattanzi, D. (2017). Pixel‐wise Structural Motion Tracking from Rectified Repurposed Videos. Struct. Control. Health Monit. 24. doi:10.1002/stc.2009
Kmet, S., Platko, P., and Mojdis, M. (2012). "Analysis of Adaptive Light-Weight Structures," in Procedia Engineering. Elsevier Ltd, 40, 199–204.
Korkmaz, S. (2011). A Review of Active Structural Control: Challenges for Engineering Informatics. Comput. Structures 89, 2113–2132. doi:10.1016/j.compstruc.2011.07.010
Kuribayashi, K., Tsuchiya, K., You, Z., Tomus, D., Umemoto, M., Ito, T., et al. (2006). Self-deployable Origami Stent Grafts as a Biomedical Application of Ni-Rich Tini Shape Memory alloy Foil. Mater. Sci. Eng. A 419, 131–137. doi:10.1016/j.msea.2005.12.016
Lang, R. J., Wang-Iverson, P., and Yim, M. (2016). Origami 5: Fifth International Meeting of Origami Science, Mathematics, and Education. CRC Press. doi:10.5860/choice.47-5704
Lebée, A., and Sab, K. (2010). Transverse Shear Stiffness of a Chevron Folded Core Used in sandwich Construction. Int. J. Sol. Structures 47, 2620–2629. doi:10.1016/j.ijsolstr.2010.05.024
Lee, D. S.-H., Popovic Larsen, O., Kim, S.-D., and Professor Philip de Langes Alle, A. (2014). Design of Deployable Structure for Dome Type Emergency Shelter.
Li, S., and Wang, K. W. (2015). Fluidic Origami: a Plant-Inspired Adaptive Structure with Shape Morphing and Stiffness Tuning. Smart Mater. Struct. 24, 105031. doi:10.1088/0964-1726/24/10/105031
Li, T., Guo, J., and Cao, Y. (2011). Dynamic Characteristics Analysis of Deployable Space Structures Considering Joint Clearance. Acta Astronautica 68, 974–983. doi:10.1016/j.actaastro.2010.08.039
Liu, K., and Jiang, L. (2011). Bio-inspired Design of Multiscale Structures for Function Integration. Nano Today 6, 155–175. doi:10.1016/J.NANTOD.2011.02.002
Liu, K., and Paulino, G. H. (2017). Nonlinear Mechanics of Non-rigid Origami: An Efficient Computational Approach. Proc. R. Soc. A. 473, 20170348. doi:10.1098/rspa.2017.0348
Lowe, D. G. (1999). “Object Recognition from Local Scale-Invariant Features,” in Proceedings of the Seventh IEEE International Conference on Computer Vision, Kerkyra, Greece, 20-27 Sept. 1999 (Kerkyra, Greece: IEEE) 2, 1150–1157. doi:10.1109/iccv.1999.790410
Lucas, B. D., and Kanade, T. (1981). “An Iterative Image Registration Technique with an Application to Stereo Vision,” in Proceedings of the 7th International Joint Conference on Artificial Intelligence (IJCAI '81).
Milan Sonka, R. B., and Vaclav, H. (2008). Image Processing, Analysis, and Machine Vision. Thomson: Patent Country. ISBN 978-0-495-08252-1.
Miura, K., Furuya, H., and Suzuki, K. (1985). Variable Geometry Truss and its Application to Deployable Truss and Space crane Arm. Acta Astronautica 12, 599–607. doi:10.1016/0094-5765(85)90131-6
Murray, C. (2013). Dynamic Monitoring of Rail and Bridge Displacements Using Digital Image Correlation. Kingston, Canada: Queen’s University.
Murray, C., Hoag, A., Hoult, N. A., and Take, W. A. (2015). "Field Monitoring of a Bridge Using Digital Image Correlation," in Proceedings of the Institution of Civil Engineers: Bridge Engineering. London, United Kingdom: Thomas Telford Services Ltd, 3–12.
Nojoomi, A., Arslan, H., Lee, K., and Yum, K. (2018). Bioinspired 3d Structures with Programmable Morphologies and Motions. Nat. Commun. 9 (1 9), 1–11. doi:10.1038/s41467-018-05569-8
Otter, J. R. H. (1965). Computations for Prestressed concrete Reactor Pressure Vessels Using Dynamic Relaxation. Nucl. Struct. Eng. 1, 61–75. doi:10.1016/0369-5816(65)90097-9
Pellegrino, S. (2001). “Deployable Structures in Engineering,” in Deployable Structures. Vienna: Springer Vienna, 1–35. doi:10.1007/978-3-7091-2584-7_1
Pellegrino, S. (1995). Large Retractable Appendages in Spacecraft. J. Spacecraft Rockets 32, 1006–1014. doi:10.2514/3.26722
Peraza-Hernandez, E. A., Hartl, D. J., Malak Jr, R. J., and Lagoudas, D. C. (2014). Origami-inspired Active Structures: A Synthesis and Review. Smart Mater. Struct. 23, 094001. doi:10.1088/0964-1726/23/9/094001
Pérez-Valcárcel, J., Suárez-Riestra, F., Muñoz-Vidal, M., López-César, I., and Freire-Tellado, M. J. (2020). A New Reciprocal Linkage for Expandable Emergency Structures. Structures 28, 2023–2033. doi:10.1016/j.istruc.2020.10.008
Puig, L., Barton, A., and Rando, N. (2010). A Review on Large Deployable Structures for Astrophysics Missions. Acta Astronautica 67, 12–26. doi:10.1016/j.actaastro.2010.02.021
Safy, M., Shi, G., Li, Z., and Amein, A. S. (2013). Improved harris Corner Detector Algorithm for Image Co-registration. Dalian, China: Institute of Electrical and Electronics Engineers Inc., 19–22. doi:10.1109/ICCSNT.2013.6967055
Schenk, M., and Guest, S. D. (2013). Geometry of Miura-Folded Metamaterials. Proc. Natl. Acad. Sci. USA 110, 3276–3281. doi:10.1073/pnas.1217998110
Silverberg, J. L., Evans, A. A., McLeod, L., Hayward, R. C., Hull, T., Santangelo, C. D., et al. (2014). Using Origami Design Principles to Fold Reprogrammable Mechanical Metamaterials. Science 345, 647–650. doi:10.1126/science.1252876
Spencer, B. F., Hoskere, V., and Narazaki, Y. (2019). Advances in Computer Vision-Based Civil Infrastructure Inspection and Monitoring. Engineering 5, 199–222. doi:10.1016/j.eng.2018.11.030
Sultan, C., and Skelton, R. (2003). Deployment of Tensegrity Structures. Int. J. Sol. Structures 40, 4637–4657. doi:10.1016/S0020-7683(03)00267-1
Sutton, M. A., Matta, F., Rizos, D., Ghorbani, R., Rajan, S., Mollenhauer, D. H., et al. (20162016). Recent Progress in Digital Image Correlation: Background and Developments since the 2013 W M murray Lecture. Exp. Mech. 57 (1 57), 1–30. doi:10.1007/S11340-016-0233-3
Sychterz, A. (2019). Actuator Optimization for Adaptive Origami Structures. St. Louis: Society of Engineering Science.
Sychterz, A. C., and Baruah, A. C. (2021). Active Control for Adaptive Origami Structures Undergoing Damage. Eng. Structures 242, 112457. doi:10.1016/J.ENGSTRUCT.2021.112457
Sychterz, A. C., and Smith, I. F. C. (2018). Deployment and Shape Change of a Tensegrity Structure Using Path-Planning and Feedback Control. Front. Built Environ. 4, 45. doi:10.3389/fbuil.2018.00045
Sychterz, A. C., and Smith, I. F. C. (2017). Joint Friction during Deployment of a Near-Full-Scale Tensegrity Footbridge. J. Struct. Eng. 143, 04017081. doi:10.1061/(asce)st.1943-541x.0001817
Tachi, T. (2016). Designing Rigidly Foldable Horns Using Bricard's Octahedron. J. Mech. Robotics 8. doi:10.1115/1.4031717
Yoon, H., Elanwar, H., Choi, H., Golparvar-Fard, M., and Spencer, B. F. (2016). Target-free Approach for Vision-Based Structural System Identification Using Consumer-Grade Cameras. Struct. Control. Health Monit. 23, 1405–1416. doi:10.1002/stc.1850
Keywords: origami, biomimetics, adaptive structure, dynamic response, computer vision, dynamic relaxation
Citation: Baruah AC and Sychterz AC (2022) Assessment and Comparison of Cable-Actuation of Pill Bug Inspired Adaptive Origami Structure Using Computer Vision and Dynamic Relaxation. Front. Built Environ. 8:813543. doi: 10.3389/fbuil.2022.813543
Received: 11 November 2021; Accepted: 18 February 2022;
Published: 11 March 2022.
Edited by:
Eleni N. Chatzi, ETH Zürich, SwitzerlandCopyright © 2022 Baruah and Sychterz . This is an open-access article distributed under the terms of the Creative Commons Attribution License (CC BY). The use, distribution or reproduction in other forums is permitted, provided the original author(s) and the copyright owner(s) are credited and that the original publication in this journal is cited, in accordance with accepted academic practice. No use, distribution or reproduction is permitted which does not comply with these terms.
*Correspondence: Angshuman C. Baruah , YWJhcnVhaDJAaWxsaW5vaXMuZWR1