 Ahmad Al-Fadly
95% of researchers rate our articles as excellent or good
Learn more about the work of our research integrity team to safeguard the quality of each article we publish.
Find out more
ORIGINAL RESEARCH article
Front. Built Environ. , 27 April 2022
Sec. Construction Management
Volume 8 - 2022 | https://doi.org/10.3389/fbuil.2022.811186
This article is part of the Research Topic Construction project delivery: practices, challenges, and opportunities View all 5 articles
Suppliers often contend they “know” best when it comes to what the customer wants. Yet, despite using advanced models, such as the 7P (product, place, price, promotion, people, process, and physical evidence) marketing mix, companies can fail to meet their service objectives because customers perceive services from their own perspective. This difference in perspective presents a knowledge gap that requires it to be filled in an objective way. This research study elucidates how differences between supplier perception and customer perception of delivery are objectively identified. In this study, the target population consisted of the managers of the construction companies in Kuwait and their customers as individual property owners of residential, commercial, and industrial buildings. Discrete questionnaires consisting of the 7P marketing mix constructs were created specifically for the supplier and customer. Using a five-point Likert scale, data from 210 supplier staff and 210 customers were collected from the construction industry. The structural equation modeling (SEM) established the beta coefficients of latent variables reflecting the perceptions of both the supplier and customer. Both models were tested for internal consistency reliability using Cronbach’s alpha, and convergent validity was established based on the standardized factor loading and average variance extracted (AVE). In addition, discriminant validity was established using AVE and correlations. The differences between the standardized coefficients of supplier and customer coefficients were then tested against their pooled variance. The results show that suppliers tend to have a higher perception of their delivery on some constructs, while customers maintained a higher perspective on other constructs, that is, suppliers perceived that their product, place, price, and process were adequate, while customer data indicated otherwise. However, it was promising that the constructs of promotion, physical evidence, and people were more favorable among customer perceptions than supplier expectations. Interestingly, customers perceived that the people factor behind the construction industry was excellent. The findings recommend that suppliers scale their perceptions to be closer to the reality perceived by the customers. The study concludes that this approach of evaluating supplier–customer perceptions is highly beneficial to the supplier.
The construction industry is expected to produce and deliver construction outputs such as residential accommodations and infrastructure that satisfy the customer (Jamal et al., 2021). Because there are many suppliers to the construction industry, interdependent supplier chains impose rigorous constraints, resulting in poor delivery results and high legal costs (Allen and Dale 2012). Consequently, many constructors adapt to general changes in market conditions using studies based on the marketing mix as a baseline to understand customer perception (Ganesha & Aithal, 2020). This inefficient method of adaptation stems from the differences in the supplier’s perception of delivery and the customer’s experience of the delivery.
Reduction of this difference is a service-oriented goal that must be taken seriously by academics and industry practitioners (Hänninen and Karjaluoto, 2017). The method in which this difference can be reduced is the knowledge gap addressed in this study. However, the author contends that studies of the marketing mix intended to evaluate the differences are lacking and represent a gap in knowledge. This study aims to fill this gap by investigating the differences between the supplier’s perception of delivery and the customer’s perception of delivery using the marketing mix applied to both the supplier and customer. In effect, the issue is in how the supplier can best determine what the “customer wants”. There is no intrinsic tool for this purpose. Hence, the supplier’s dilemma is to first evaluate what suits the customer. Second, the supplier has to determine how far offset is the supplier from the customer’s ideals. In this study, a novel methodology is introduced to evaluate the difference between supplier perception and customer experience. Hence, the strategy involves two sets of questionnaires and determining the difference using structural equation modeling and not merely a 5-point Likert scale analysis (Figure 1).
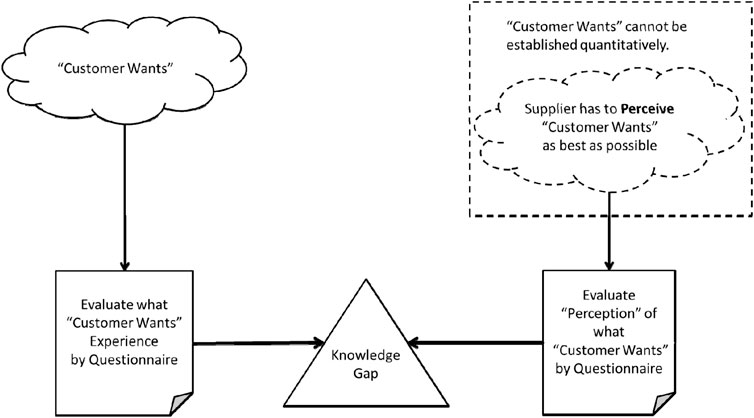
FIGURE 1. Difference between customer experience and supplier perception.
To provide the best product or services to the customer, the supplier pursues approaches and strategies that should result in customer experiences that are beneficial to their business (Grewal et al., 2017). Therefore, the supplier initiates the customer experience with a perception relative to the expectation of the customer (Gallear et al., 2021). This perception relates to the emotional aspects defined by the customer’s experience (Chen et al., 2021). Clearly, understanding how companies benefit from knowing what customers perceive will help suppliers manage customer experience, resulting in increased revenue (Wibowo et al., 2021).
Customer experience may speciously seem simple and easily defined. However, it can be understood as the totality of cognitive (e.g., beliefs and thoughts) and affective (e.g., feelings and attitudes) attributes that give value to the customer’s purchase (Bustamante and Rubio, 2017), along with the customer’s exposure and interaction with a supplier (Maslowska et al., 2017). Importantly, this interaction builds upon the differentiation of the supplier’s offering and customer’s expectations (Hole et al., 2018). The differentiation between the views of the supplier and the customer is a subjective response to the direct and indirect experiences with a supplier. Given the complex interaction of the supplier–customer experience, customer experience is the antecedent to customer perception (Gartner, 2016). Hence, the customer’s needs are the starting point for a successful marketing strategy that defines what delivery will please the customer (Assegaff and Pranoto 2020). As a result, it is customer experience, not satisfaction, that serves as the true measure of a customer’s perceptions of the quality of products and services (Kuppelwieser and Klaus 2021). This is supported by the notion that customer experience corresponds to the quality of service (Jaakkola and Terho 2021).
The marketing mix is the observable aspect of a supplier exposed to the customer even before the customer buys a product (Lee and Jin 2019). The main objective of a supplier’s marketing function is to create a customer experience that is value-creating (Li et al., 2021). However, the customer’s experiences are perceived relative to the marketing mix identified as follows: product, place, price, promotion, people, process, and physical evidence (Anjani et al., 2018). Studies confirm that customer experience is a reflection of attributes such as product, promotion, place, and price (Alafeef, 2020). Similar studies by Isoraite (2016) also concluded that elements of people, process, and promotion in the marketing mix are related to customer experience. Moreover, Hamad (2013) found that “total customer experience” was closely related to people, process, and physical evidence in the marketing mix of services. The importance of improving customer experience through the process element emphasizes marketing mix (Wu and Li 2018). Furthermore, a customer’s judgment of add-value is influenced by price (Alzoubi et al., 2020). From these arguments, the author summarizes that the marketing mix is the driver of customer experience.
Based on the literature review, the author proposes the conceptual model in Figure 2. Here, the customer has a set of values that defines the customer’s expectation. The supplier needs to know this set of values to match the expectations of the customer, as best as possible. Thus, the supplier develops a “marketing mix” to determine what pleases the customer and, in retrospect, build the supplier’s “marketing mix” to deliver the customer’s marketing mix. Consequently, the supplier has to continuously evaluate the difference between the two sets of marketing mix. Thus, the different measures of each (supplier and customer) marketing mix are proposed in this study. A detailed method of analysis is presented as a “primer” on how to conduct this evaluation.
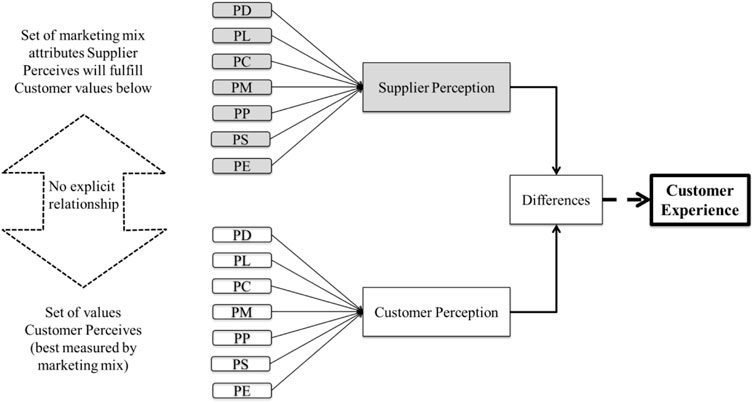
FIGURE 2. Conceptual model for the supplier/customer.
In this research, structural equation modeling (SEM) is used to conduct causal modeling and path analysis using IBM SPSS-AMOS for Windows version 25 by Arbuckle (2017). This method was chosen owing to the availability of the standardized estimate of the effects of marketing mix on the respective supplier or customer perception. The steps involved are as follows:
1. Theory development
2. Model construction
3. Instrument construction
4. Data collection
5. Model testing
6. Results and interpretation
Figure 3 presents the theoretical framework of the study, which indicates the differences between the supplier perception and customer perception of the marketing mix that need to be measured. Thus, the research is a study design of a single concept as perceived by two parties, that is, supplier and customer.
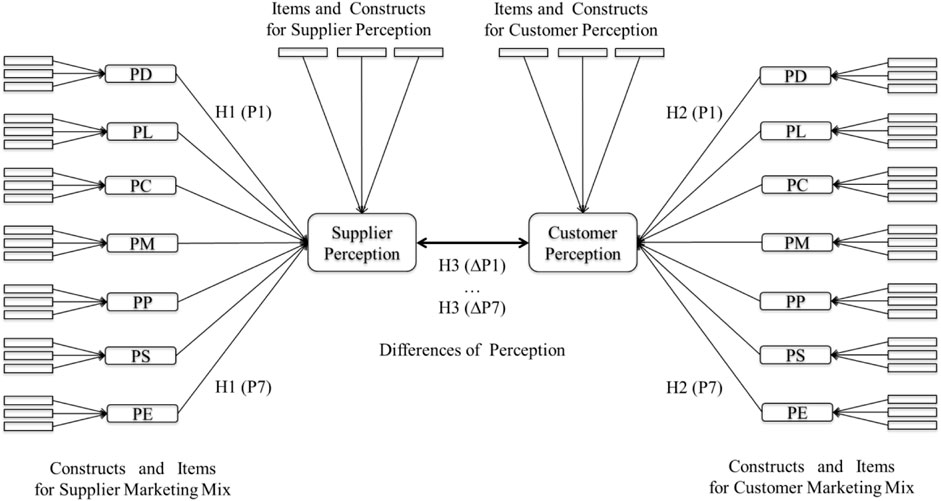
FIGURE 3. Theoretical model of research.
Thus, the study proposes the following hypotheses:
H1 (P1. P7): There is a direct effect of the marketing mix in creating supplier perception in the construction industry.
H2 (P1. P7): There is a direct effect of the marketing mix in creating customer perception in the construction industry.
H3 (ΔP1. ΔP7): There is no difference between supplier perception and customer perception of the marketing mix in the construction industry.
The test model was constructed with the 7Ps (PD, PL, PC, PM, PP, PS, and PE) of the marketing mix as the exogenous variables and the customer experience as the endogenous variable. All covariance and error variance were included as shown in Figure 4. The constructs PM, PP, and PS are not shown for clarity. The structural model is drawn according to the work by Arbuckle (2017). Confirmatory factor analyses were conducted for all 7P constructs and customer experience. The results clearly established the seven factors and eigenvalues greater than one.
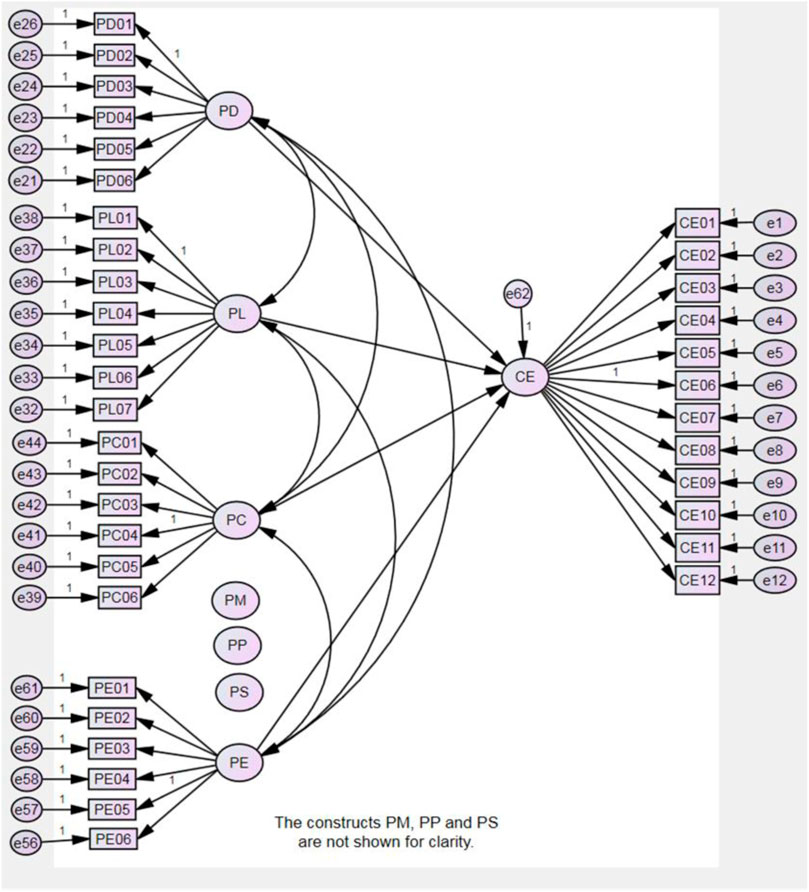
FIGURE 4. Model construction for the study.
The research instrument, a questionnaire adapted to two separate audiences, was constructed with the 7P elements of the marketing mix for both questionnaires (supplier and customer). Table 1 shows that the product element of the marketing mix based on six items was adapted from the works by Cravens and Piercy (2007) and Hollensen (2007), whereas the place element with seven items was adapted from the work by Tielung and Untu (2021). The price element with six items was adapted from the work by Fergnson and Hlavinka (2006). The promotion element, comprising five items, was adopted from the work by Jensen and Jepsen (2008). The people element featuring six items was adopted from the work by Iles (2008), while the process element with five items was adopted from the work by Martin (2014). The physical evidence element with six items was adopted from the work by Sadq (2019). Last, the customer experience element with twelve items was adapted from the works by Klaus (2015) and Maklan and Klaus (2011).
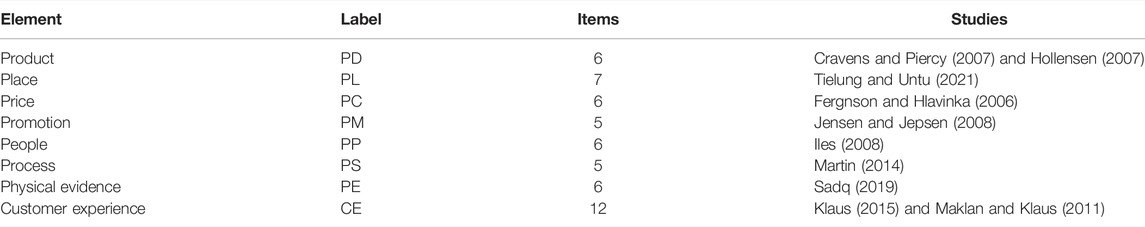
TABLE 1. Adopting variables from previous studies.
Each variable was assessed through a number of questionnaire items based on the respective studies discussed previously. The questionnaire items assessed similar properties of the variables, and the questions were only different in being addressed to the customer or supplier. All 53 items of the questionnaire were assessed on a five-point Likert scale ranging from (1) strongly disagree to (5) strongly agree (Supplementary Appendixs SI, SII).
In this study, the target population consisted of the managers of the construction companies in Kuwait and their customers as individual property owners of residential, commercial, and industrial buildings. A simple questionnaire survey strategy was encouraging as both customers and suppliers were hopeful that the study would benefit them. The questionnaire was distributed anonymously (no names were collected), and no human data were collected. The respondents participated with informed consent, and there was no risk to the respondent. Data were collected over a period of 2 months starting from August 2020.
The questionnaires were pretested with 40 construction managers and their customers. There were no reported problems with the understanding and phrasing of the questionnaire. The questionnaire layout and the number of questions were carefully considered. Convenience sampling was used as respondents were accessible and willing to participate in the study following acceptable guidelines (Robinson 2014). However, randomization was not practicable for the population (Etikan et al., 2016). Using the respective questionnaires, data were collected from 210 usable questionnaires from the suppliers (i.e., managers of the construction companies) and 210 usable questionnaires from their customers. The sample demographics for both questionnaires are shown in Tables 2, 3.
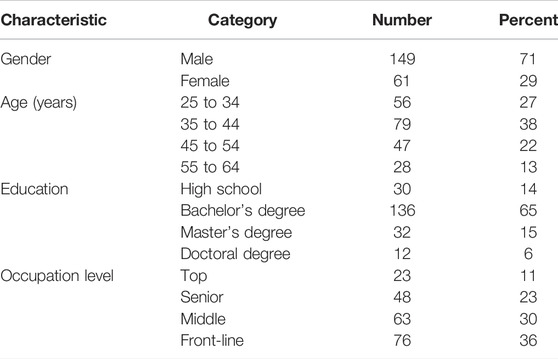
TABLE 2. Demography of respondents for the supplier (N = 210).
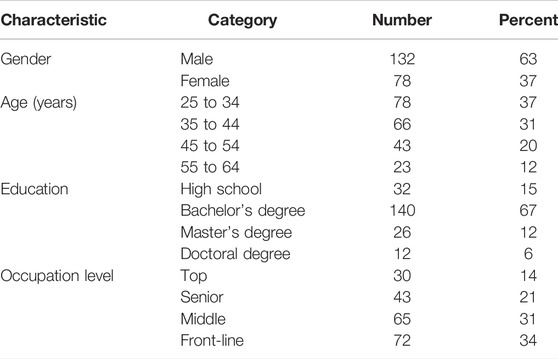
TABLE 3. Demography of respondents for the customer (N = 210).
The composite reliability for supplier survey was evaluated with IBM SPSS v 21 for Cronbach’s alpha. Table 4 shows that the reliability for the constructs was greater than 0.70 and therefore acceptable (Sekaran and Bougie, 2016).
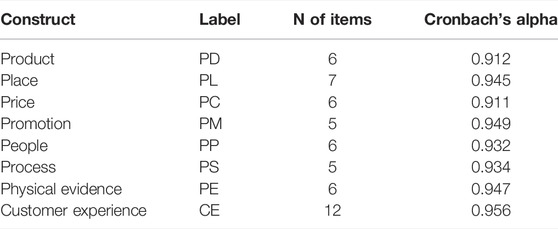
TABLE 4. Internal consistency of the supplier questionnaire.
Convergent validity is used to ensure that items within a construct measure the same construct. To accept convergent validity, AVE (average variance extracted) must be higher than 0.50 (Hair et al., 2017), while the standardized factor loadings must be greater than 0.70 (Black and Babin 2019). Table 5 shows that the convergent validity was established since AVE is greater than 0.50 and CR is greater than 0.70 for all constructs. Discriminant validity is used to ensure that all constructs are different from one another. To establish discriminant validity, the square root of AVE values should be greater than the correlations involving the constructs (Ab Hamid et al., 2017). Table 6 shows that discriminant validity was established as the values of the square root of AVE are greater than the correlations between constructs for all supplier constructs.
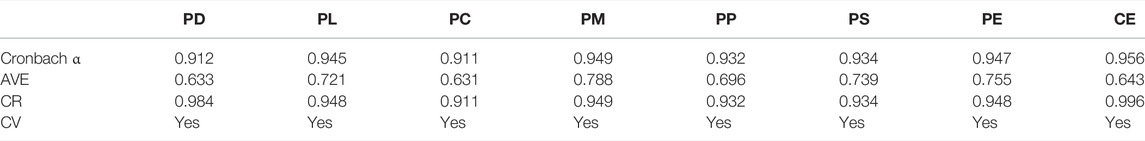
TABLE 5. AVE and CR for constructs in the supplier survey.
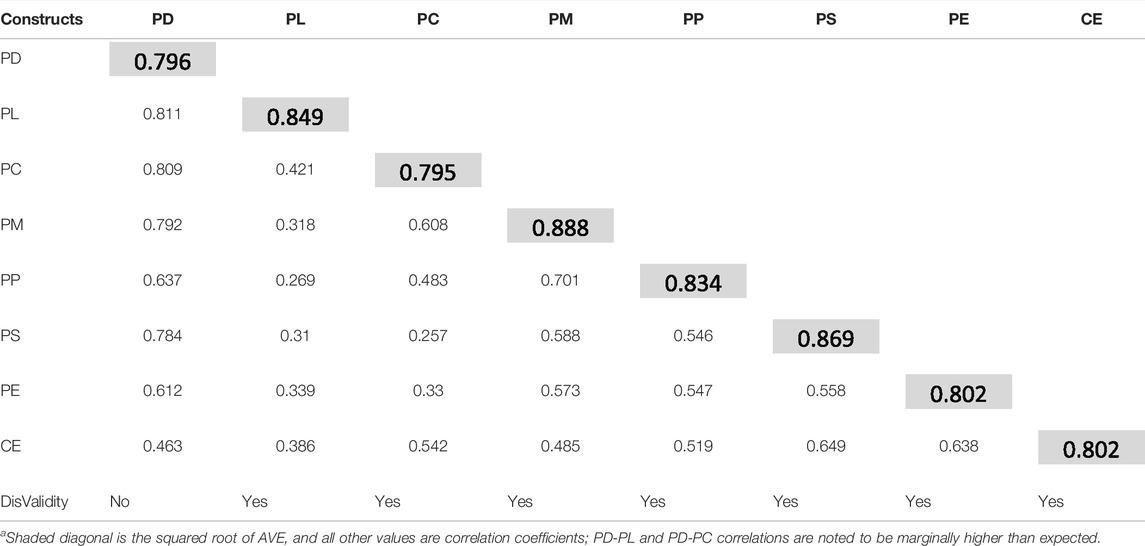
TABLE 6. Correlation coefficient and squared root of AVE for the supplier.
The composite reliability for customer survey was evaluated with IBM SPSS v 21 for Cronbach’s alpha. Table 7 shows that the reliabilities for the constructs were greater than 0.70 and therefore acceptable (Sekaran and Bougie 2016).
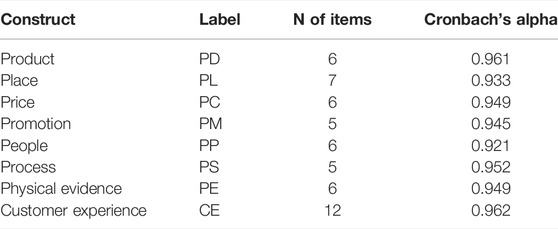
TABLE 7. Internal consistency of the customer questionnaire.
The convergent validity was similarly calculated. Table 8 shows that the convergent validity was established because AVE was greater than 0.50 and CR greater than 0.70 for all customer constructs. In addition, the discriminant validity was calculated similarly. Table 9 shows that discriminant validity was established as the square root of the AVE values is greater than the correlations between constructs for all customer constructs.
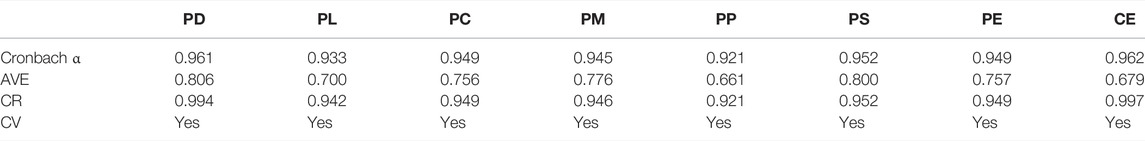
TABLE 8. AVE and CR for constructs in the customer survey.
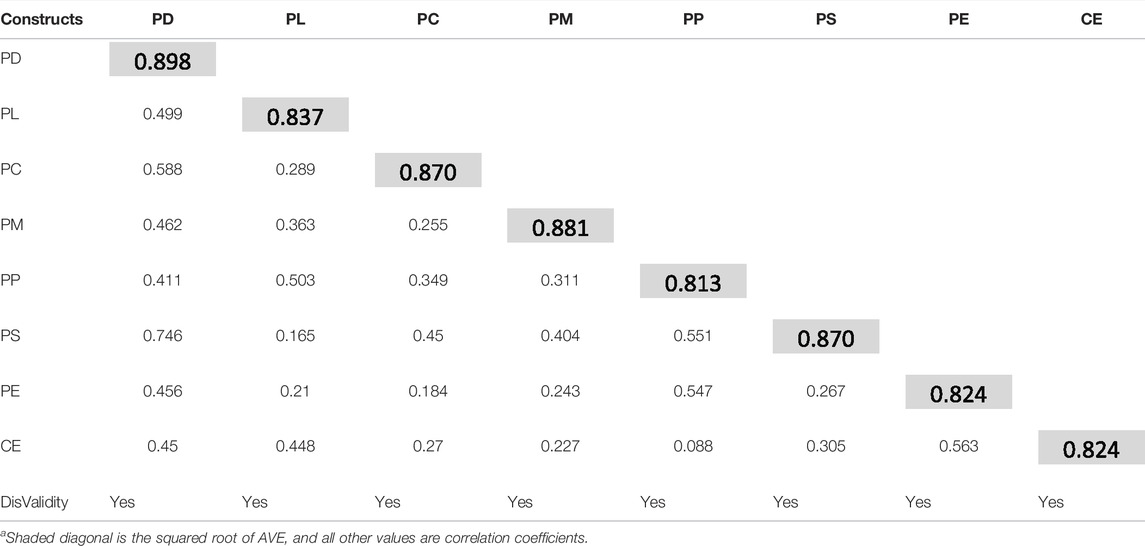
TABLE 9. Correlation coefficient and squared root of AVE for the customer.
The data analysis included a test of the direct effects from the supplier marketing mix in creating customer experience in the construction industry. In Table 10, the product element is shown to have a path coefficient of β = 0.273 with critical ratio t = 3.468 corresponding to p < 0.001. Thus, the product element is a significant aspect of the supplier marketing mix related to customer experience. Similarly, Table 10 shows that all constructs are significant at p < 0.05. Thus, it is shown that all H1 hypotheses of the elements of the supplier marketing mix (PD, PL, PC, PM, PP, PS, and PE) are significant constructs for customer experience.
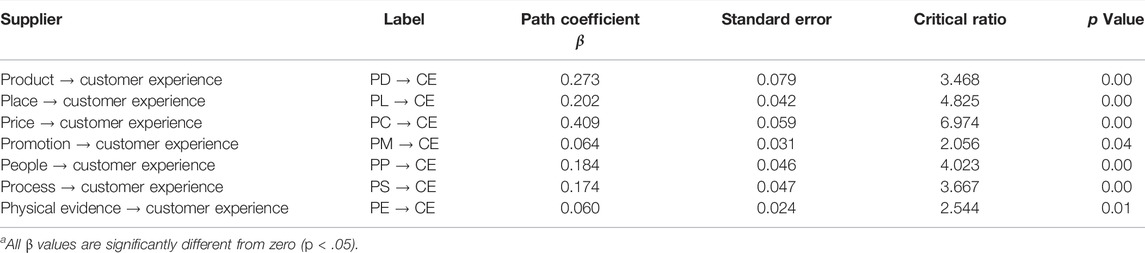
TABLE 10. Path analysis for the supplier showing significant supplier constructs.
The data analysis included a test of the direct effects from the customer marketing mix in creating customer experience in the construction industry. Form Table 11, the price element has a path coefficient of β = 0.117 with the critical ratio t = 2.917 corresponding to p < 0.001. Thus, the price element is a significant aspect of the customer marketing mix that is related to customer experience. Similarly, the table shows that constructs PL, PC, PM, PP, and PE are significant at p < 0.05 while constructs PD and PS are significant at p < 0.10. Thus, it is shown that all H2 elements of the customer marketing mix (PD, PL, PC, PM, PP, PS, and PE) represent significant constructs for customer experience.
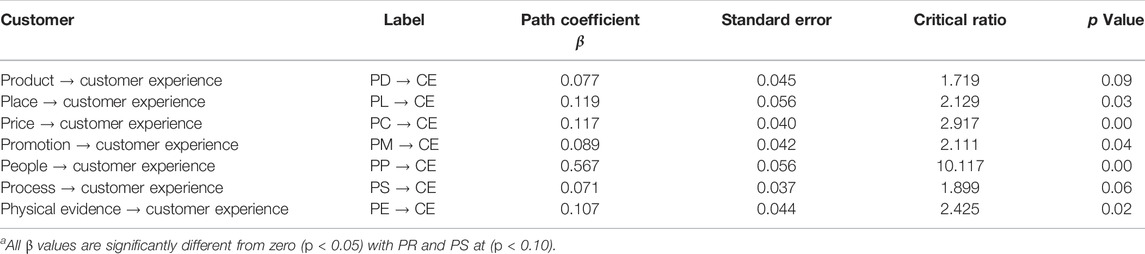
TABLE 11. Path analysis for the supplier showing significant customer constructs.
The differences between the supplier path coefficients and customer path coefficients are considered. Both path coefficients are shown in Figure 5. It is to be noted that the confidence interval lines are 1.96 standard deviations of the standard error. Any overlap of the confidence interval lines suggests that there is no significant difference between the constructs of the supplier and customer pair.
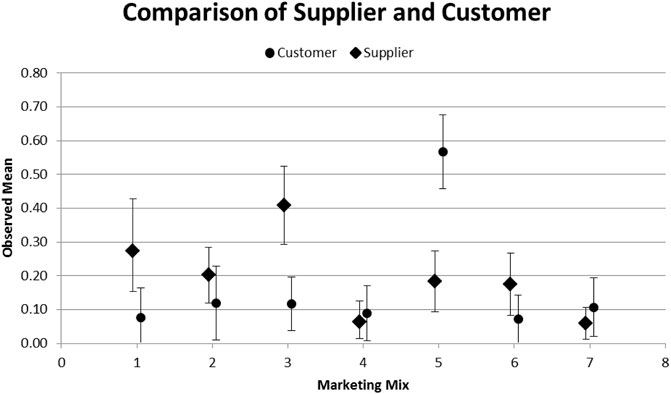
FIGURE 5. Comparison of supplier and customer perceptions.
The differences between the standardized coefficients of supplier and customer coefficients were tested against their pooled variance. The results are shown in Table 12.
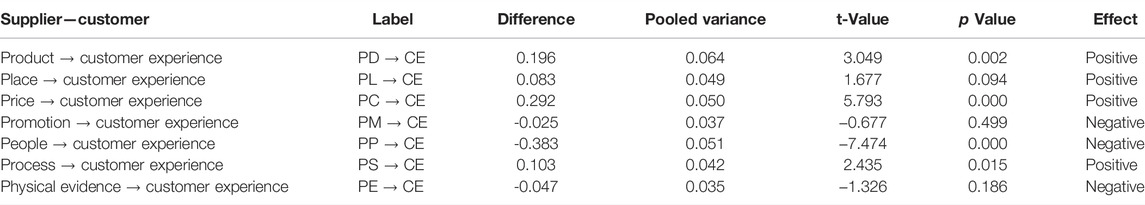
TABLE 12. Comparison of supplier–customer.
From Table 12, the marketing mix (PM, PP, and PE) are found to be significant constructs where customer experience exceeds supplier perception. Hence,
H3 (PM): There is a significant negative difference.
H3 (PP): There is a significant negative difference.
H3 (PE): There is a significant negative difference.
Figure 6 shows a graph of the differences. All the differences in the bottom half (y < 0) of the graph show that the (supplier–customer) path coefficients are negative, thereby implying that the customer has a higher perception than the supplier and that the supplier needs to maintain this advantage. From Table 12, the marketing mix (PD, PL, PC, and PS) are significant constructs where supplier experience exceeds customer perception. Hence,
H3 (PD): There is a significant positive difference.
H3 (PL): There is a significant positive difference.
H3 (PC): There is a significant positive difference.
H3 (PS): There is a significant positive difference.
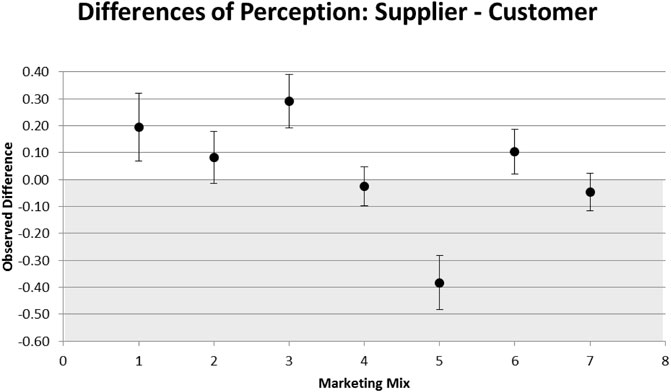
FIGURE 6. Differences of perception between the supplier and customer.
Figure 6 shows a graph of the differences. All the difference in the top half (y > 0) of the graph shows that the (supplier–customer) path coefficients are positive. This implies that the supplier has a higher perception than the customer and that the supplier needs to better understand the shortcoming. Clearly, the supplier’s management needs to focus on these differences and plan a program of action to improve customer experience.
This study is tantamount to establishing the union of the supplier perception of customer needs and the customer perception of customer needs. If the seven Ps are significant in both the supplier and customer data, then an empirical estimation of the differences in the perception is permissible. The aim of hypothesis 1 was to establish that P1 to P7 were, indeed, relevant and necessary for the supplier. This was clearly established in Table 10, where all the seven Ps are found to be significant at alpha = 0.05. The aim of hypothesis 2 was to establish that P1 to P7 were, indeed, relevant and necessary to the measurement of the seven Ps for the customer. This was clearly established in Table 11, although two of the Ps were significant at alpha = 0.10. Between hypothesis 1 and hypothesis 2, it is established that the seven Ps are significant to both the supplier and customer. Having established this important tenet, hypothesis 3 empirically shows the differences in the perception of the direct effect of the marketing mix between supplier perception and customer perception of the marketing mix in the construction industry.
This study provides a new approach to the empirical determination of differences between variables by two stakeholders, that is, the supplier and customer. In this case, the seven Ps are perceived by distinct groups. Consequently, it is paramount that the supplier correctly “perceives” what is important to the customer. Any erroneous understanding of this perception would imply a fundamentally wrong basis for the adoption or adaptation of planning, marketing, or sales endeavors. Such trial-and-error methods would be an expensive approach that is almost certain to lose customers to the competition. Suppliers would, therefore, benefit from the application of this research methodology to understand customer perception in the most objective, that is, quantifiable method.
The study contributes to deepening the understanding of customer experience in the construction industry by establishing a causal effect between the elements of the marketing mix and customer experience through the model of the study. The same is also true of the causal effect between the elements of the marketing mix and supplier experience through the model of the study. The study presents an important progression to the body of knowledge on the theory and practice of examining the differences of perception between suppliers and customers, while strongly set on the marketing mix. Using the study techniques, individual constructs within the marketing mix are uniquely identified for the supplier and compared to the customer.
The study allows construction companies to gage the effectiveness of their marketing strategies and minimize the differences that exist between the expected and actual practices of the marketing mix within either the supplier or customer perceptions. This helps suppliers to justify the creation of a business strategy, goal, and mission to support their customer’s experience. The findings itself will help construction companies to create more efficient marketing strategies in order to enhance their customer’s actual experience. It is also noted that the generalization presented in this study could be customized for a single construction company to provide particular insights to the organization.
First, the findings of this study stress the importance of establishing the difference between what the supplier perceives that the customer perceives and what the customer (actually) perceives. The research showed that the perception of the supplier and customer can be objectively quantified. Second, within the context of the questionnaire responses, it was identified that there is a significant negative difference in PM, PP, and PE elements of the marketing mix. The negative values (supplier–customer) imply that customer perception is higher than that of the supplier. In particular, PP was significant at alpha = 0.05. Clearly, this is indicative of the customer’s perception that the element is in favor of the customer. Third, it was identified that there is a significant positive difference in PD, PL, PC, and PS elements of the marketing mix. The positive values (supplier–customer) imply that the customer perception is higher than the supplier perception. Clearly, this relationship is indicative of a misjudgment of the customer’s perception by the supplier. Consequently, the supplier is recommended to institute a program of management action to improve the marketing mix within the supplier companies. Fourth, based on the findings of this study, it is deduced that the differences are widespread across many suppliers since the survey was conducted among many suppliers. Therefore, the results are based on a diverse range of respondents, implying that the elements of promotion, people, and physical environment are perceived as adequate by the customers. In contrast, the product, place, price, and process suggest the need for internal organizational level improvement. Consequently, a particular supplier may need to conduct the study customized to their own environment.
This study focused on customer experience in terms of their perception using the marketing mix within the construction industry. However, culture is an important aspect of customer experience, which was not included in the marketing mix. Future studies could include the cultural aspect and its influence on customer experience. As this study was limited to a convenience sample of supplier and customers, future studies could be based on a more selective group of suppliers and its corresponding group of customers. Such a study would encourage supplier actions at the administrative or employee levels. This would be more immediately actionable by the supplier. This primer study could be extended to other areas within an organization that requires a calibration of difference in the perception of work performed. The method could be used where a “supplier–customer” relationship exists. For example, in the food industry sector, the supplier perception of a cafeteria could be compared to the customer perception with regards to the presentation of food and beverages.
The scope of this research is limited to its goal of investigating the effects of the marketing mix of construction companies on their customer experiences in Kuwait. The applicability of the results is limited to the construction sector of the selected country, and its replication to other industries could be extended to other similar markets. The supplier survey questionnaires included front-liners whose responses could have been somewhat more customer-like. Future studies could be more selective on the nature of the supplier and customer respondents.
The original contributions presented in the study are included in the article/Supplementary Material, further inquiries can be directed to the corresponding author.
The author confirms being the sole contributor of this work and has approved it for publication.
The author declares that the research was conducted in the absence of any commercial or financial relationships that could be construed as a potential conflict of interest.
All claims expressed in this article are solely those of the authors and do not necessarily represent those of their affiliated organizations, or those of the publisher, the editors, and the reviewers. Any product that may be evaluated in this article, or claim that may be made by its manufacturer, is not guaranteed or endorsed by the publisher.
The Supplementary Material for this article can be found online at: https://www.frontiersin.org/articles/10.3389/fbuil.2022.811186/full#supplementary-material
Ab Hamid, M. R., Sami, W., and Mohmad Sidek, M. H. (2017). Discriminant Validity Assessment: Use of Fornell & Larcker Criterion versus HTMT Criterion. J. Phys. Conf. Ser. 890, 012163. doi:10.1088/1742-6596/890/1/012163
Alafeef, M. (2020). The Influence of Service Marketing Mix on Customer Loyalty towards Islamic banks: Evidence from Jordan. Int. J. Acad. Res. Account. 10 (3), 239–255. doi:10.6007/ijarafms/v10-i3/7862
Allen, M., and Dale, D. (2012). EC Harris Global Construction Disputes: Moving in the Right Direction. Available at: http://www.disputeboardsmena.com/wp content/uploads/2013/02/ECH-Global-Construction-Disputes-Report-2012.pdf.
Alzoubi, H., Alshurideh, M., Kurdi, B. A., and Inairat, M. (2020). Do perceived Service Value, Quality, price Fairness and Service Recovery Shape Customer Satisfaction and Delight? A Practical Study in the Service Telecommunication Context. Uncertain Supply Chain Manage. 8 (3), 579–588. doi:10.5267/j.uscm.2020.2.005
Anjani, H. D., Irham, I., and Waluyati, L. R. (2018). Relationship of 7P Marketing Mix and Consumers’ Loyalty in Traditional Markets. Agro Ekonomi 29 (2), 261–273.
Assegaff, S., and Pranoto, S. (2020). Price Determines Customer Loyalty in Ride-Hailing Services. Am. J. Humanities Soc. Sci. Res. 4 (3), 453–463.
Black, W., and Babin, B. J. (2019). “Multivariate Data Analysis: Its Approach, Evolution, and Impact,” in Reflections on the Contributions of Joseph F. Hair, Jr. To Marketing and Business Research. Editors B. J. Babin, and M. Sarstedt (Cham: Springer). doi:10.1007/978-3-030-06031-2_16
Bustamante, J. C., and Rubio, N. (2017). Measuring Customer Experience in Physical Retail Environments. Josm 28, 884–913. doi:10.1108/JOSM-06-2016-0142
Chen, T., Guo, W., Gao, X., and Liang, Z. (2021). AI-based Self-Service Technology in Public Service Delivery: User Experience and Influencing Factors. Government Inf. Q. 38 (4), 101520. doi:10.1016/j.giq.2020.101520
Cravens, D. W., and Piercy, N. F. (2007). Strategic Marketing. 9th ed. New York, NY, USA: McGraw-Hill.
Etikan, I., Musa, S., and Alkassim, R. (2016). Comparison of Convenience Sampling and Purposive Sampling. Ajtas 5 (1), 1–4. doi:10.11648/j.ajtas.20160501.11
Fergnson, R., and Hlavinka, K. (2006). Loyalty Trends: Three Evolutionary Trends to Transform Your Loyalty Strategy. J. Consumer Marketing 23 (5), 292–299.
Gallear, D., Ghobadian, A., He, Q., Kumar, V., and Hitt, M. (2021). Relationship between Routines of Supplier Selection and Evaluation, Risk Perception and Propensity to Form Buyer-Supplier Partnerships. Prod. Plann. Control. 2021, 1–17. doi:10.1080/09537287.2021.1872811
Ganesh, H. R., and Aithal, P. S. (2020). Establishing True Lifestyle Brand in India: An Integrated Marketing Mix Framework. International Journal of Management, Technology, and Social Sciences 5 (1), 261–284. doi:10.47992/ijmts.2581.6012.0094
Gartner (2016). Gartner for Marketers Customer Experience. Available at: https://www.gartner.com/marketing/customer-experience/(Accessed Dec 13, 2019).
Grewal, D., Roggeveen, A. L., Sisodia, R., and Nordfält, J. (2017). Enhancing Customer Engagement through Consciousness. J. Retailing 93 (1), 55–64. doi:10.1016/j.jretai.2016.12.001
Hair, J. F., Hult, G. T. M., Ringle, C. M., and Sarstedt, M. (2017). A Primer on Partial Least Squares Structural Equation Modeling (PLS-SEM). 2nd ed. Thousand Oaks, CA: Sage.
Hamad, Y. (2013). Marketing Management: Total Customer Experience. London: London School of Commerce, 29–31.
Hänninen, N., and Karjaluoto, H. (2017). Environmental Values and Customer-Perceived Value in Industrial Supplier Relationships. J. Clean. Prod. 156, 604–613.
Hole, Y., Pawar, S., Bhaskar, M. P., and Mahesh, P. (2018). Service Marketing and Quality Strategies. Pen 6 (1), 182–196. doi:10.21533/pen.v6i1.291
Iles, A. (2008). Shifting to green Chemistry: the Need for Innovations in Sustainability Marketing. Bus. Strat. Env. 17 (8), 524–535. doi:10.1002/bse.547
Jaakkola, E., and Terho, H. (2021). Service Journey Quality: Conceptualization, Measurement and Customer Outcomes. Josm 32 (6), 1–27. doi:10.1108/josm-06-2020-0233
Jamal, B., Akoi, S., Fadel, P., and Sardar, Z. (2021). Factors Shaping Customer Satisfaction with Residential Flats: Evidence from Sulaymaniyah City. Black Sea J. Manage. Marketing 2 (2), 1–12.
Jensen, M. B., and Jepsen, A. L. (2008). Online Marketing Communications: Need for a New Typology for IMC? J. Website Promot. 2 (1/2), 19–35.
Kuppelwieser, V. G., and Klaus, P. (2021). Measuring Customer Experience Quality: The EXQ Scale Revisited. J. Business Res. 126, 624–633. doi:10.1016/j.jbusres.2020.01.042
Lee, J. Y., and Jin, J. (2019). The Role of Ethical Marketing Issues in Consumer-Brand Relationship. Sustainability 11 (23), 6536. doi:10.3390/su11236536
Li, S., Peng, G., Xing, F., Zhang, J., and Zhang, B. (2021). Value Co-creation in Industrial AI: The Interactive Role of B2B Supplier, Customer and Technology Provider. Ind. Marketing Manage. 98, 105–114. doi:10.1016/j.indmarman.2021.07.015
Majed Sadq, Z. (2019). The Relationship between Organizational Power and Job Involvement and Their Impact on Achieving Strategic Objectives (An Empirical Study of Private Hospitals Managers' Perspectives in Erbil City, Kurdistan Region of Iraq). International Journal of Multicultural and Multireligious Understanding 6 (5), 627–637. doi:10.18415/ijmmu.v6i5.1159
Maklan, S., and Klaus, P. (2011). Customer Experience: Are We Measuring the Right Things? Int. J. Market Res. 53 (6), 771–772. doi:10.2501/ijmr-53-6-771-792
Martin, M. (2014). Business, Marketing Mix. Available at: https://www.cleverism.com/placefour-ps-marketing-mix.
Maslowska, E., Malthouse, E. C., and Viswanathan, V. (2017). Do customer Reviews Drive purchase Decisions? the Moderating Roles of Review Exposure and price. Decis. Support Syst. 98, 1–9. doi:10.1016/j.dss.2017.03.010
Robinson, O. C. (2014). Sampling in Interview-Based Qualitative Research: A Theoretical and Practical Guide. Qual. Res. Psychol. 11 (1), 25–41. doi:10.1080/14780887.2013.801543
Sekaran, U., and Bougie, R. (2016). Research Methods for Business: A Skill-Building Approach. Seventh edition. Hoboken, NJ, USA: John Wiley & Sons.
Tielung, M., and Untu, V. (2021). Marketing Mix on Customer Satisfaction on the Tourism Tomohon City. Int. J. Res. 9 (1), 25–36. doi:10.14738/abr.91.9583
Wibowo, A., Chen, S., Wiangin, U., Ma, Y., and Ruangkanjanases, A. (2021). Customer Behavior as an Outcome of Social Media Marketing: The Role of Social Media Marketing Activity and Customer Experience. Sustainability 13, 189. doi:10.3390/su13010189
Keywords: supplier perception, customer experience, marketing mix, construction industry, SEM
Citation: Al-Fadly A (2022) Differences Between Supplier and Customer Experiences of Marketing Mix in the Construction Industry. Front. Built Environ. 8:811186. doi: 10.3389/fbuil.2022.811186
Received: 08 November 2021; Accepted: 04 March 2022;
Published: 27 April 2022.
Edited by:
Assed N. Haddad, Federal University of Rio de Janeiro, BrazilReviewed by:
Sheyla Mara Baptista Serra, Federal University of São Carlos, BrazilCopyright © 2022 Al-Fadly. This is an open-access article distributed under the terms of the Creative Commons Attribution License (CC BY). The use, distribution or reproduction in other forums is permitted, provided the original author(s) and the copyright owner(s) are credited and that the original publication in this journal is cited, in accordance with accepted academic practice. No use, distribution or reproduction is permitted which does not comply with these terms.
*Correspondence: Ahmad Al-Fadly, b3ZlcnNlYXNfa3dAeWFob28uY29t
Disclaimer: All claims expressed in this article are solely those of the authors and do not necessarily represent those of their affiliated organizations, or those of the publisher, the editors and the reviewers. Any product that may be evaluated in this article or claim that may be made by its manufacturer is not guaranteed or endorsed by the publisher.
Research integrity at Frontiers
Learn more about the work of our research integrity team to safeguard the quality of each article we publish.