 Karin Loh
 Manuj Yadav
 Kerstin Persson Waye
 Maria Klatte
 Janina Fels
95% of researchers rate our articles as excellent or good
Learn more about the work of our research integrity team to safeguard the quality of each article we publish.
Find out more
ORIGINAL RESEARCH article
Front. Built Environ. , 08 February 2022
Sec. Indoor Environment
Volume 8 - 2022 | https://doi.org/10.3389/fbuil.2022.688847
This article is part of the Research Topic Acoustics in the Built Environment: a Challenge for Improving the Quality of Life View all 14 articles
Children spend a considerable amount of time in educational institutions, where they are constantly exposed to noisy sound environments, which has detrimental effects on children’s health and cognitive development. Extensive room acoustics measurements and long-term in-situ measurements in such institutions are scarce and are generally conducted using omnidirectional microphones. This study provides preliminary results of room acoustics in unoccupied conditions and in-situ noise measurements during occupancy, in classrooms and playrooms in Germany using an omnidirectional microphone, an adult HATS (head and torso simulator), and a child HATS. The results indicate that room acoustics of most of the sampled rooms need improvement (mid-frequency reverberation time, T30 (s) = 0.6 (0.3–1.1) and clarity index, C50 (dB) = 6.1 (1.6–10.4); speech transmission index (STI) = 0.7 (0.6–0.8); mean values and range); the sound pressure level (SPL) during activities was around 66 dB (A-weighted equivalent level SPL) in both classrooms and playrooms using omnidirectional measurements, which is somewhat lower than similar measurements in other countries that varied in measurement periods; psychoacoustics parameters relating to sound fluctuation (fluctuation strength and roughness) show variation with increasing room volumes; and that there may be some benefit in considering child HATS for in-situ noise measurements. While the validity of these results in relation to children’s perceptual evaluation (using questionnaires, etc.) is subject to future investigations, the results highlight some of the nuances in the choice of transducers in measurements with children and potential benefits of psychoacoustic parameters in complementing the SPL-based parameters in more comprehensively characterizing the noise environments in educational institutions.
Noise and unfavorable room acoustics in educational institutions, such as primary schools and preschools, is a well-known problem. While several studies have reported results of room acoustics measurements (in both occupied and unoccupied rooms), long-term noise measurements are scarce, especially in daycare settings. Furthermore, for characterizing noise and room acoustic measurements in such institutions, two possibilities include using omnidirectional and binaural transducers. The former allows a range of measurements including standardized ones (Bradley et al., 1999; American National Standards Institute, 2002; Building Bulletin 93, 2015; Deutsches Institut für Normung, 2016; Astolfi et al., 2019a), while the latter generally incorporated as microphones near human (who may or may not have freedom of movement) ears or within ear canals of head and torso simulator (HATS). Binaural transducers allow measurements that can represent some of the effects of head, shoulders, and outer ear processing for static listeners (i.e., without head movements). Adult HATS in binaural measurement procedures are relatively common in research settings including in classrooms (CRs) for children (e.g., Shinn-Cunningham et al., 2005; Peng et al., 2012), and there is at least one example of a head and shoulder simulator (Fels et al., 2004; Prodi et al., 2007) that has been qualified to closely represent children aged approximately 3–6 years (hereinafter, referred to as children/child HATS). This study reports on room acoustics measurements in unoccupied conditions (furnished rooms) and long-term noise measurements during typical hours of occupancy, in several primary schools and daycare centers, using both omnidirectional and binaural transducers. This includes investigating the extent to which relevant acoustic and psychoacoustic parameters vary across the educational settings and between the transducers, that is, omnidirectional, adult and child HATSs, with the latter two providing first-order representations of teachers and students’ perception, respectively. These considerations may be important for characterizing the noise environment and room acoustics and determining appropriate measurement methods in a variety of educational institutions for children.
As listed in Table 1, which refers to measurements in CRs mainly in primary schools and daycare centers across various countries, the sound pressure levels (SPLs, in decibel) in such educational institutions are considerable. There are also considerable variations between studies due to factors such as the number of children present (Sala and Rantala, 2016); the age groups, with daycare centers generally reporting higher levels than primary school CRs (Picard and Bradley, 2001); activities involved; room acoustics due to excessively low or high reverberation times (RTs) (Astolfi et al., 2019b); measurement methods including duration (Sala and Rantala, 2016; Wang and Brill, 2021), transducer type and locations, for example, omnidirectional vs binaural recordings vs dosimeters (last two rows in Table 1), with microphones in front of ears (Södersten et al., 2002; McAllister et al., 2009); and pedagogical aspects. Representing a wide range of such factors, Sala and Rantala (2016) summarized SPLs from studies conducted in Finland, Germany, Sweden, United Kingdom, and United States over several years, reporting a range of SPLs from LA,eq (A-weighted equivalent energy SPL) = 42–100 dB in schools and LA,eq = 60–85 dB in preschools measured for periods ranging from 2 min up to five working days. Their own investigations included LA,eq as well as several percentile levels including LA90 representing the background noise in occupied CRs, LA10 representing the higher levels, and LA50 representing the median level. In terms of room acoustics, Sala and Rantala (2016) reported RTs, speech transmission index (STI) values (values ≥0.85 considered adequate for a wide range of hearing and learning conditions for children), and mean background noise level in unoccupied CRs as 34.5 dB (27–44 dB). Astolfi et al. (2019b) used a consistent measurement setup across CRs in Italy, which were classified either as rooms with “good” or “bad” acoustics according to the occupied rooms’ RT (T20,occ), as listed in Table 1. They also reported clarity index (C50 in dB, ratio between the energy arriving in the first 50 ms and the remaining energy) and the ratio of useful to detrimental energy values (U50 in dB) to express speech intelligibility, which were highly correlated with T20,occ. For the CRs with “good” acoustics, reported values for C50 and U50 were mostly within the range of optimum values, with C50 ≥ 3 dB considered good and U50 ≥ 1 dB considered optimal; and the CRs with “bad” acoustics had corresponding values outside this optimal range. Persson Waye and Karlberg (2021) reported results from a study in Sweden in unoccupied furnished rooms, before and after an acoustic intervention. Wang and Brill (2021) reported estimated noise and speech levels from measurements in the United States CRs, along with RT and C50 values in unoccupied rooms.
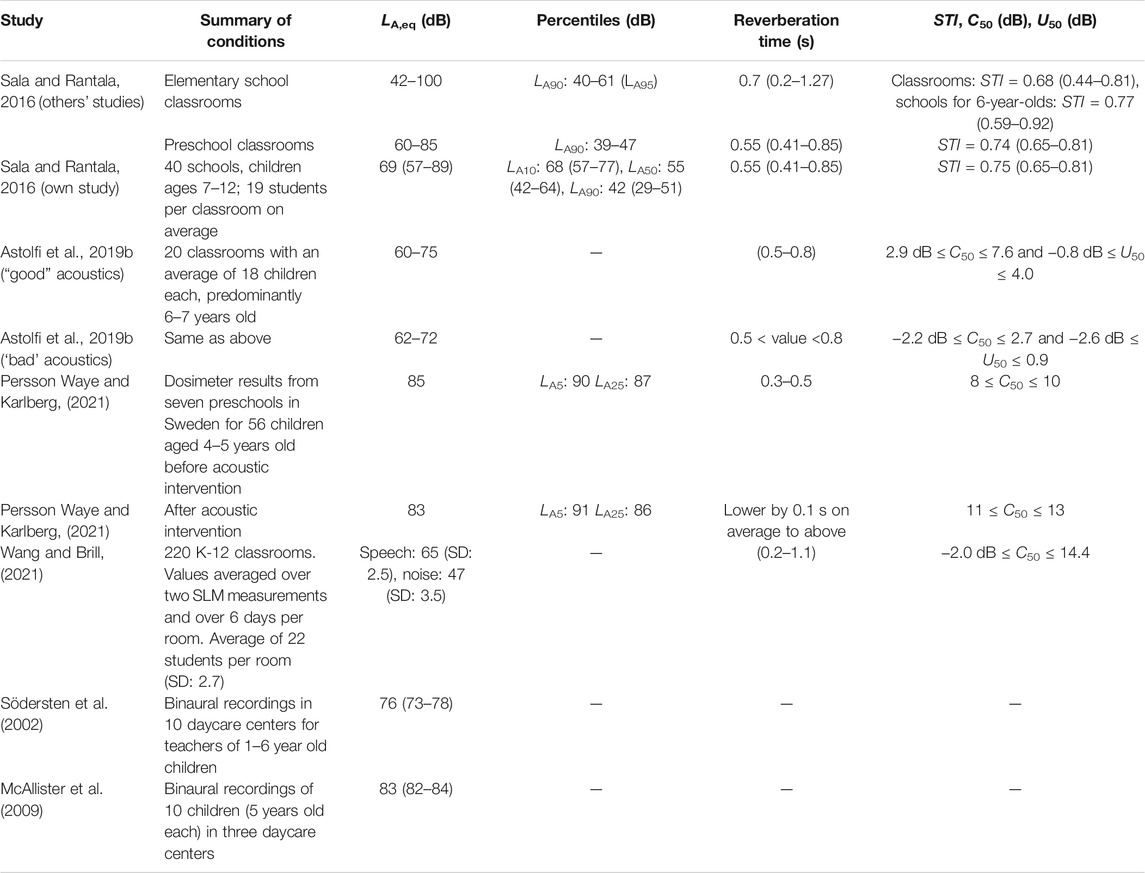
TABLE 1. Summary of noise and room acoustic parameters in previous studies. Reported values are mean and the range (in brackets) unless indicated otherwise.
The studies mentioned above have typically used omnidirectional microphones at fixed locations and/or single-channel noise dosimeters to measure the sound environment in educational institutions. Binaural recordings of children and teachers moving freely within CRs have been performed in at least two studies (last two rows in Table 1) where microphones were placed in front of both ears of teachers and children in preschool CRs in Sweden, and values reported are power averages of left and right ear values. For typical daily activities in CRs, these values represent a closer representation of hearing levels for both teachers and children. The almost 6 dB difference in the mean LA,eq values in these two studies using similar measurement methods was partly attributed by the authors to the differences in heights and distances between the teachers and children. The values reported in Södersten et al. (2002) and McAllister et al. (2009) do not include contributions due to self-speech of the participants wearing binaural microphones, which, besides other measurement factors, may partly account for slightly lower values compared to the dosimeter values reported in Persson Waye and Karlberg (2021) which presumably include contributions due to the participant’s own speech. In the latter, significant differences were found between children and personnel amounting to 6–8 dB.
Regardless of the measurement method, the high SPLs reported in Table 1 can have detrimental effect on adults’ well-being at work (e.g., Åhlander et al., 2011) and on children’s behavior and development (for reviews, Shield and Dockrell, 2003, 2008; Klatte et al., 2013). Unfavorable room acoustics, such as long RTs relative to the room volume, characterized as being outside the 0.5–0.8 s optimum range (in occupied rooms) in Astolfi et al. (2019b), have been shown to lower performance in phoneme identification in adults and children (Neuman and Hochberg, 1983; where RT = 0.6 s was detrimental compared to RT = 0.4 s or no reverberation), impairment in primary school children’s speech perception and listening comprehension (Klatte et al., 2010a), short-term memory (Klatte et al., 2010b), and negative effects on performance, well-being, and social climate at school (Klatte et al., 2010c). Since children spend a considerable amount of time in these educational institutions, noise assessment and control are crucial toward providing optimal learning and development environments. Noise assessment and subsequent control would benefit from long-term measurements using a consistent method for more reliable parameter values compared to previous studies, which include a range of measurement periods (see Sala and Rantala, 2016, for a review).
While measurements using omnidirectional transducers have several advantages, binaural measurements are a closer representation of hearing conditions. Binaural transducers placed near human ears, as in Södersten et al. (2002) and McAllister et al. (2009), perhaps represent one possibility, with its own set of logistical issues. HATSs have limitations in terms of fixed location, and generic head-related transfer function (HRTF); the latter characterizes the frequency-dependent amplifications in the signals when measured at the ear canal entrance (Møller et al., 1995). However, the advantages of HATSs include a potentially more robust and repeatable setup compared to putting transducers on humans, with a major limitation being the use of additional equipment that may not be as readily available as individual microphones. Another overhead includes additional binaural analyses due to processing two channels instead of one in general and the potential use of computational expensive binaural models such as those for binaural loudness (Moore and Glasberg, 2007). Yet, to avoid intrusive methods involving humans (especially children), HATSs represent a rather convenient middle ground for noise measurements in CRs, which can be used to augment information provided by standard methods using omnidirectional microphones.
In terms of HATS sizes, children have smaller ears, head, and shoulder sizes than adults, and arguably a HATS representing adult morphology may not represent those of children. Hence, differences in anthropometric sizes between adults and children need to be considered to represent children’s perspectives more appropriately. Indeed, different adult HATSs can also have different HRTFs, but for the sake of brevity, this is not explored further here, and instead the focus is on comparisons between a selected adult and child HATS. Fels et al. (2004) reported more amplification in the higher frequency bands (starting from 4 to 5 kHz) for children vs adults HRTFs. Differences were also observed for different directions in the horizontal plane and the median plane (Fels and Vorländer, 2009). More gain in higher frequencies in children’s HRTFs might explain the higher sensitivity to high-frequency sounds reported for children (Persson Waye and Karlberg, 2021). With this in mind, it may be expected that differences between the transducers might also be observable in certain room acoustic and noise parameters, such as RT and SPL, when analyzed on a band-by-band basis, especially in the higher frequency bands.
To further characterize the behavioral effects of spectral and temporal (and spatial) aspects of human sound perception, psychoacoustic models and associated parameters (hitherto based largely on adults’ perception) are, at least in principle, better suited than level-based parameters. Psychoacoustic loudness is perhaps the most common (for both stationary and time-varying sounds; ISO 532-1). However, other psychoacoustic parameters such as sharpness, roughness, fluctuation strength, etc., have been useful in investigations of several subjective attributes of various sound environments for adults. However, the use of psychoacoustic parameters in CR studies has been very limited, and it is unclear whether there is any benefit in considering psychoacoustic models based on adults’ perception to characterize children’s perception; psychoacoustic models specifically for children, and adults’ models adapted for children are possible too, but not the focus here. Yet, the scope of existing psychoacoustic parameters has the potential to complement and even go beyond investigations that are possible with SPL-based parameters. This includes, but is not limited to, exploring the higher sensitivity of children to high-frequency sounds compared to adults. This is possible by comparing, for instance, SPL of lower vs higher-frequency octave bands with psychoacoustic sharpness (S) and whether there is a benefit in using one approach over another. Additionally, one may expect higher sharpness values based on measurement with child HATS compared to adult HATS due to higher amplification in higher frequencies for children’s HRTFs compared to adults’ HRTFs (Fels et al., 2004). Similarly, to explore the effect of fluctuations in the sound environment on human perception, it is possible to compare the performance of SPL-based parameters that quantify the level fluctuations above the ambient SPL (e.g., LA10—LA90, etc.) and psychoacoustic parameters fluctuation strength (FS) and roughness (R). These psychoacoustic parameters characterize human perception to slower (FS) and faster (R) amplitude fluctuations and have been shown to be related to annoyance due to air-conditioning, and auditory distraction due to many sounds including speech in office simulations Schlittmeier et al. (2012), respectively.
This study has two main aims:
1. Providing pilot results of room acoustics (unoccupied furnished rooms) and long-term measurements during occupancy in several primary schools and daycare centers using an adult and a child HATS, representing a teacher and a child in CRs, respectively, along with an omnidirectional microphone that is used in most previous studies.
2. Studying the relationship between relevant acoustic and psychoacoustic parameters that characterize the sound environment in CRs, based on the measurements in aim 1 with regard to the differences that might be introduced by transducers including differences in anthropometric sizes. The results may be beneficial for future studies where the subjective perceptions of children and adults in CRs are characterized in relation to one or more types of these transducers.
Both the aims are steps toward determining measurement and analysis methodologies that best characterize the subjective perception of children and of adults in CRs, which should be linked in further studies to children’s responses on subjective perception in child-appropriate questionnaires (e.g., Persson Waye et al., 2013).
Acoustic measurements were conducted in ten educational buildings in Germany (Aachen) including four primary schools and six daycare centers. In total, N = 8 CRs and N = 10 playrooms (PRs) were measured. An overview of all selected rooms is given in Table 2 including information on connected rooms, acoustical treatments, room dimensions, and A-weighted ambient background noise levels outside occupied hours. In terms of PRs in daycare centers, most of them are directly connected with one or two smaller connected rooms (for example, an extra eating room or an extra sleeping room), which are presented as additional volumes in Table 2. The doors to these rooms are seldom closed to enable continuous supervision by the educators. Therefore, the room volumes of these smaller rooms were added to the overall room volumes, and they were also considered while evaluating the room acoustic measurements (Section 2.2 and Section 4.1). Furnishings corresponded to the purpose of the educational institutions and remained unchanged for the acoustic measurements. None of the rooms had mechanical ventilation systems, and ventilation was mostly managed through windows that were closed for the room acoustics measurements and were open during some of the in-situ measurements. However, the opening of windows during in-situ measurements was not controlled in this study.
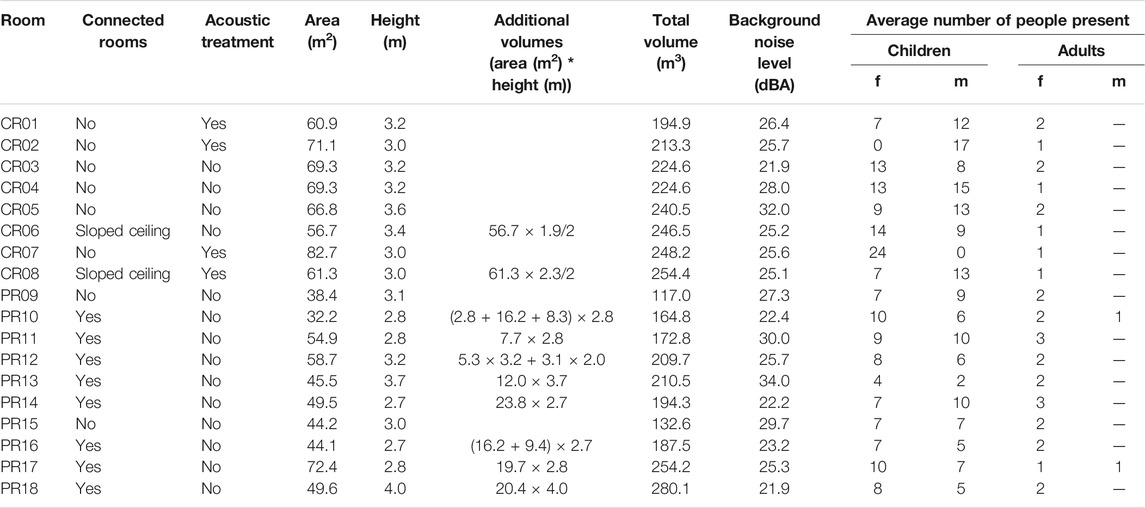
TABLE 2. Overview of selected classrooms (CRs) and playrooms (PRs). Background noise measurements conducted in unoccupied rooms.
In the CRs, on average 22 children (f: 50.0%) and 1 adult (mostly female), while on the PRs, in average 15 children (f: 53.5%) and 2 adults (f: 91.3%) were present during noise measurements. The adults were teachers of the corresponding groups of children. Children in the primary schools were between 6–10 years old and more than 50% of adults were in the age group between 31–50 years. In the daycare centers, children were between 3–6 years old and more than 50% of the adults were between 21–40 years old.
All involved adults gave signed informed consent, and in the case of children, all parents signed the informed consent for the participation of their children. The procedure was approved by the Medical Ethics Committee at the RWTH Aachen University, Germany (EK 321/16 and EK 218/18).
Room acoustic measurements were conducted in unoccupied furnished rooms according to ISO 3382-2 (International Organization for Standardization, 2008) at precision level with two source and six receiver positions. As the sound source, the Institute of Technical Acoustics (ITA)’s 3-way omnidirectional dodecahedron loudspeaker was used. Simultaneous measurements were executed with the ITA adult HATS (Schmitz, 1995) equipped with Schoeps CCM2H microphones, ITA child HATS (Fels et al., 2004) equipped with Sennheiser KE4 microphones, and a ½” diffuse field omnidirectional microphone (B&K Type 4134) as a reference. Positions were chosen according to ISO 3382-2 with as little overlap as possible without removing the furnishings inside the rooms. All receivers were positioned to represent standing situations since the chosen positions were quite far from the tables and chairs. It further represents reasonably the behavior of teachers and educators in the room, who are standing most of the time. The reference microphone was positioned at the height of 1.2 m, the ear axis of the adult HATS was adjusted to 1.5 m, and of the child HATS to 1.0 m height. The measurement signal was an exponential sweep with a duration of 5,944 s, and it was repeated five times per position.
Furthermore, for all six receiver positions, the ambient equivalent A-weighted background noise level over 30 s (BNLA,eq,30s) was measured according to ISO 9568 (International Organization for Standardization, 1993) using the reference microphone (½” diffuse field microphone B&K Type 4134).
Room acoustic parameters T20, T30, EDT (early decay time; to potentially represent subjective “reverberance” (Bradley, 2011)), C50 (clarity index), D50 (definition), and TS (center time) were computed according to ISO 3382-2 (International Organization for Standardization, 2008) and ISO 3382-1 (International Organization for Standardization, 2008) for a frequency range of 125 Hz–16 kHz octave bands center frequencies. The A-weighted background noise level over 30 s was evaluated according to ISO 9568 (International Organization for Standardization, 1993) for a frequency range of 31.5 Hz–16 kHz. The STI was calculated using the indirect method following IEC 60268-16 (International Electrotechnical Commission, 2012), which computed the STI using the measured impulse response neglecting effects from masking and background noise. Hereby, MATLAB and the ITA toolbox (Berzborn et al., 2017) were used. Since some of the rooms measured were connected with smaller volumes (Table 2), the degree of non-linearity in the reverberant energy decay of the measured impulse responses was examined using the method in Annex B of ISO 3382-2. All measurement positions where the degree of curvature of the decay (comparing T30 and T20) for the reference microphone exceeded the 10% threshold, signifying substantial deviation from linearity, were removed from further room acoustic analyses (Table 3) (International Organization for Standardization, 2008). Subsequently, only T30 values are reported. Results including T20 values are provided in Supplementary Table S2.
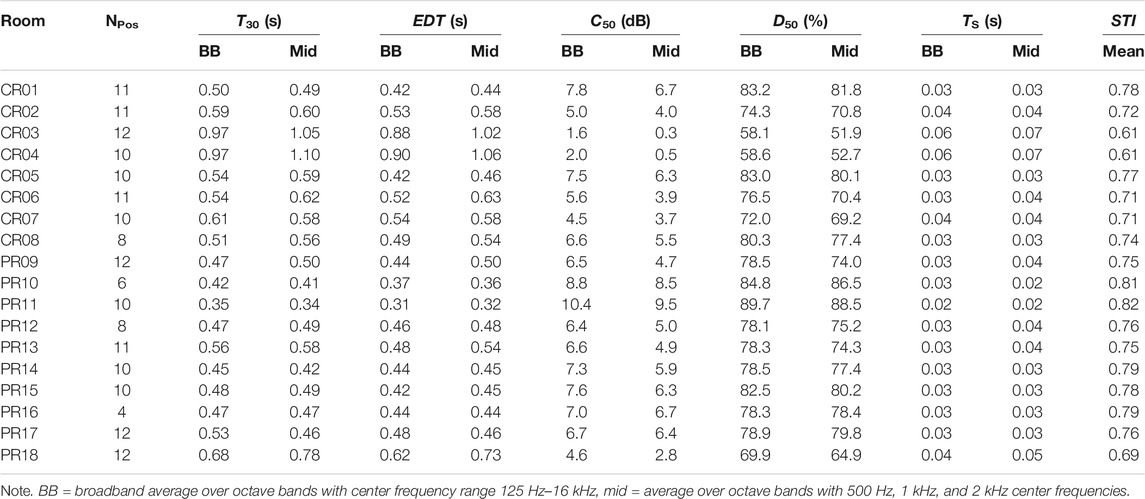
TABLE 3. Room acoustic parameters from omnidirectional microphone for classrooms (CRs) and playrooms (PRs).
To approximate binaural versions of the standard room acoustic parameters, two approaches were considered. Firstly, the computed parameters from the left and right ear were averaged
All the room acoustic parameters were examined according to the factors “connected rooms” (single room vs coupled rooms vs rooms with sloping ceilings), “acoustic treatment” (with vs without), “room type” (CRs vs PRs), and “measurement method” (omnidirectional microphone vs A-HATSAv vs C-HATSAv) with respect to 125 Hz–16 kHz octave bands center frequencies. One-way ANOVAs were carried out for the room acoustic parameters (as listed in Table 3 with a single value for each room) to examine possible differences between the measurement methods (e.g., between omnidirectional microphone vs A-HATSAv, etc.).
The in-situ noise measurements were conducted during the daily activities of children in CRs and PRs. The same equipment as stated for the room acoustic measurements in unoccupied rooms was used to execute the in-situ measurements. All three receivers were positioned together in the center (less than 30 cm to each other, cf. Figure 1) of the main room of activity so that people were able to move around them. While this potentially introduces acoustic shadowing and interference issues for the transducers, the location of the transducers was due to logistical concerns including ensuring that the measurement equipment did not adversely interfere with the usual behavior of the adults and children (e.g., by attracting too much children’s attention). The positioning of measurement equipment was discussed forehand with the teachers, and the study and the equipment were explained to the children 1 day before the measurements started in each educational institution.
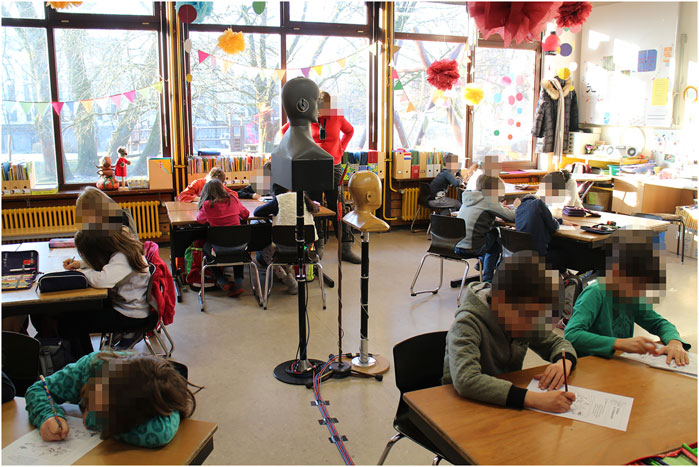
FIGURE 1. Example of the centered positioning of the measurement transducers during an in-situ measurement in a classroom.
In-situ measurements were conducted over 2 days per CR and PR during normal daily activities. On the first day, all dummy heads were positioned to represent a standing position (ear axis of the adult HATS at 1.5 m, ear axis of the child HATS at 1.0 m, and the omnidirectional microphone at 1.2 m). On the second day, they were positioned to represent a sitting position (ear axis of the adult HATS at 1.2 m, ear axis of the child HATS at 0.8 m, and the omnidirectional microphone at 1.2 m) or to represent a playing height (ear axis of the child HATS at 0.5 m), respectively, according to the dominant scenario of each educational institution. Only periods with children present in the room were considered, where the sound pressure level exceeded 35 dBZ (Z-weighted). In other words, a cutoff sound pressure level of 35 dBZ was used to distinguish between children’s presence and absence in the rooms. This cutoff was based on inspecting several samples within the recordings when children were not present. This resulted in up to 6 hours of recordings on average per room, which were used for further analyses.
Three types of noise parameters were taken into consideration. Firstly, parameters based on A-weighted SPL were computed, including LA,eq and percentiles (LA10 and LA90). Secondly, to consider sound fluctuations over time in rooms above the background noise (generally signified using LA90), level-based fluctuation parameters typically used in areas with multi-talker speech, for example, open-plan offices (Yadav et al., 2021), were calculated. These included noise climate
To further understand the relation between the sharpness and A-weighted SPL with respect to low and high frequencies (below and above 1 kHz), a low–high-frequency ratio of LA,eq was calculated as follows:
Table 3 lists the results of the room acoustic measurements (using the omnidirectional microphone) of all rooms averaged over all positions that met the decay curvature criteria within ISO 3382–2 (i.e., those with decay curvature under 10%; Section 2.2.2), and Table 4 presents a summary of the details provided in Table 3. Results averaged over all measured positions are provided in Supplementary Table S1. In four cases (CR08, PR10, PR12, and PR16; Table 3), ≥4 positions had to be discarded. In further analyses, PR16 was excluded due to especially a low number of measurement positions that met the curvature criteria.
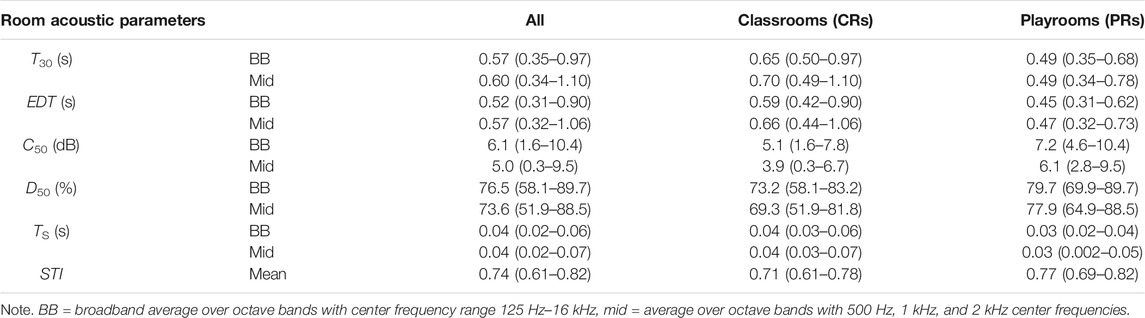
TABLE 4. Summary of room acoustic parameters in Table 3. Reported values are mean and the range (in brackets).
The room acoustics of two CRs (CR03 and CR04; Table 3) were noticeably different from the other six (averaged T30 = 0.55 s and averaged STI = 0.74 in these CRs). Possible explanation could be combined effect of the large room volumes with flat ceilings compared to other larger volumes like C06, C07, and the absence of acoustic treatment in these rooms; although C05 still has comparable room volume and room acoustics to C06 and C07, it has no acoustic treatment and has a flat ceiling similar to C03 and C04.
Figure 2 presents the relationship between STI and other room acoustic parameters. Figure 3 presents the mean values of room acoustic parameters over 125 Hz–16 kHz octave band center frequencies, grouped according to room type.
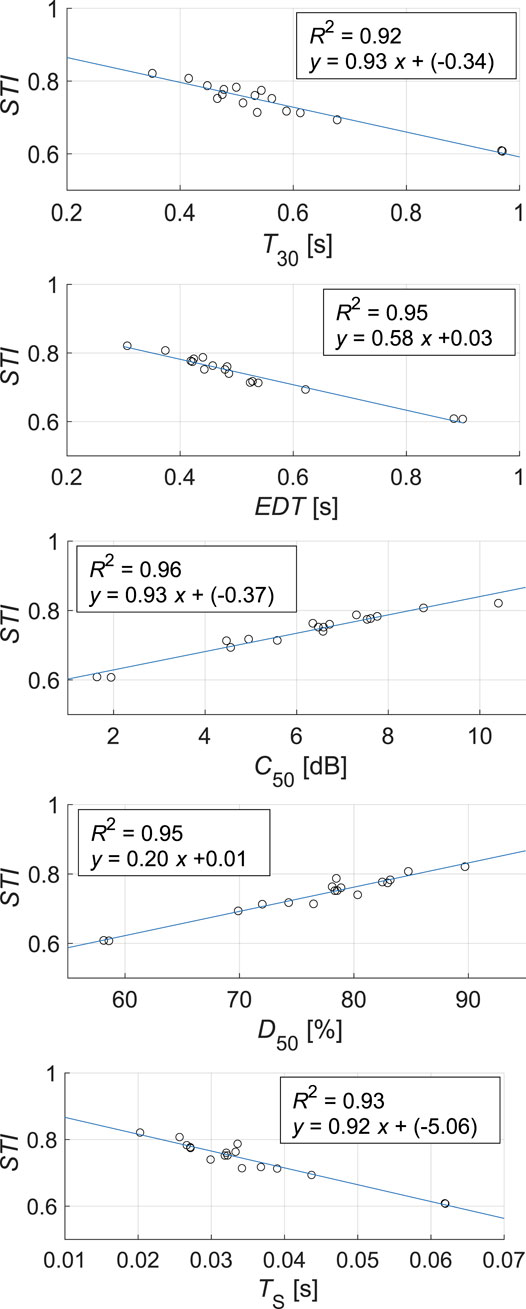
FIGURE 2. Linear regression models between speech transmission index and other room acoustics parameters.

FIGURE 3. Room acoustic parameters over 125 Hz–16 kHz octave band frequencies for classrooms and playrooms.
All results of the room acoustic measurements using the adult and child HATSs including both evaluation methods (averaging and prominent-ear) can be found in the supplementary material (Supplementary Table S3−S6) including results on the inter-aural correlation coefficient (IACC) though it is not further discussed in this work (Supplementary Table S7 and Supplementary Table S8).
Figure 4 presents the mean value of room acoustic parameters over 125 Hz–16 kHz octave band center frequencies, grouped according to the three measurement methods: using the omnidirectional microphone (Ref), adult and child HATSs with the averaging method, that is A-HATSAv and C-HATSAv, respectively. Results for the prominent-ear method can be found in Supplementary Figure S1. For the mid-frequency octave bands (500 Hz, 1 and 2 kHz center frequencies), values were very similar for all the room acoustics parameters across the measurement methods. Beyond 2 kHz, some deviations can be seen, which can broadly be attributed to the anthropomorphic features (i.e., HRTFs) of the binaural transducers becoming important for smaller wavelengths. In this regard, the values for the adult HATS varied more in comparison to the other measurement methods. Furthermore, for the parameters C50, D50, and TS, which are all ratios of early sound energy to late/reverberant energy, the values for the child and adult HATSs are similar but deviated from the omnidirectional microphone for the 4 kHz band, and the parameter values for the adult HATS exhibited a distinct deviation in comparison to the corresponding values for the child HATS and the omnidirectional microphone, which have similar values, for the 8 kHz octave band. These deviations, starting from the 4 kHz octave band, can also be observed in the HRTF magnitude response of child HATS in comparison to adult HATS as presented in Fels et al. (2004). However, the statistical analyses revealed no significant difference between the five measurement methods (Ref vs A-HATSAv vs C-HATSAv vs A-HATSProm vs C-HATSProm; Supplementary Table S9).
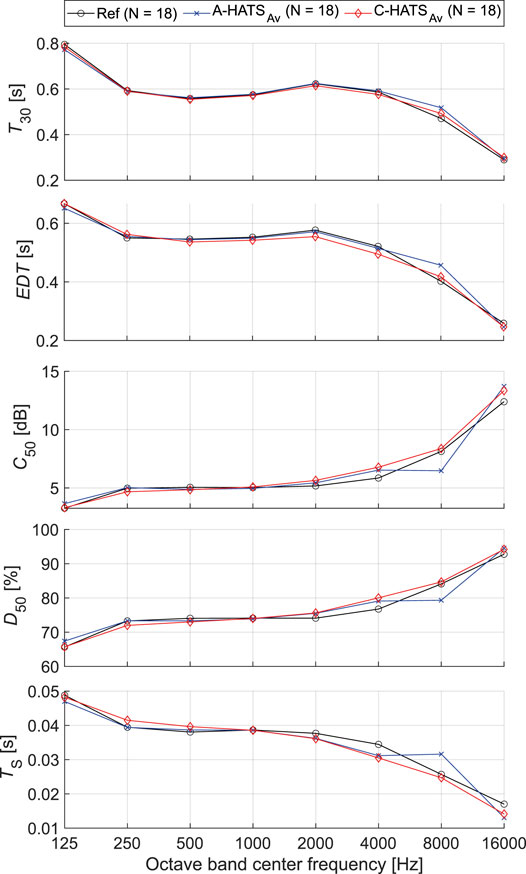
FIGURE 4. Room acoustic parameters according to the different measurement methods: omnidirectional microphone (Ref), adult and child HATSs with the averaging method (A-HATSAv/C-HATSAv).
Table 5 and Table 6 present the noise parameters calculated from the omnidirectional microphone recordings for each room, which are summarized in Table 7.
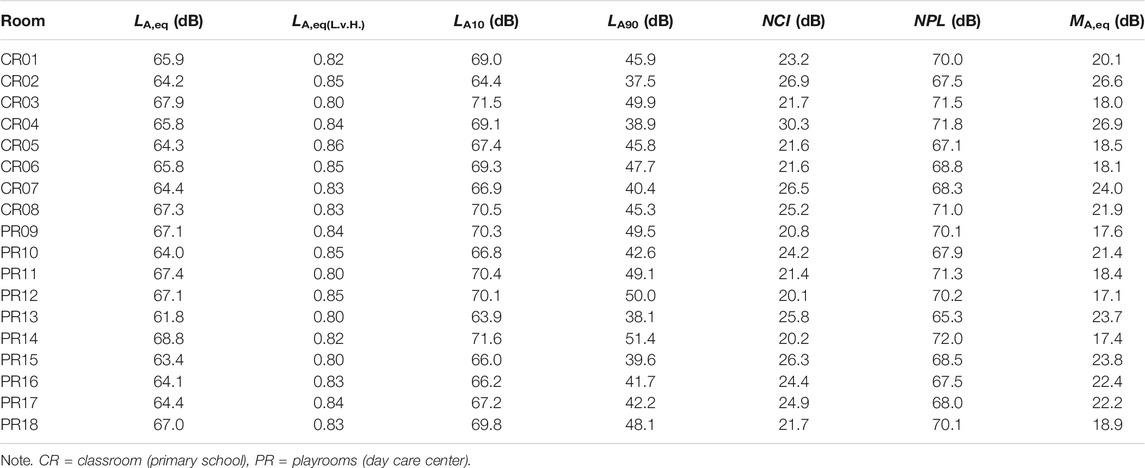
TABLE 5. In-situ sound pressure level parameters from omnidirectional microphone.
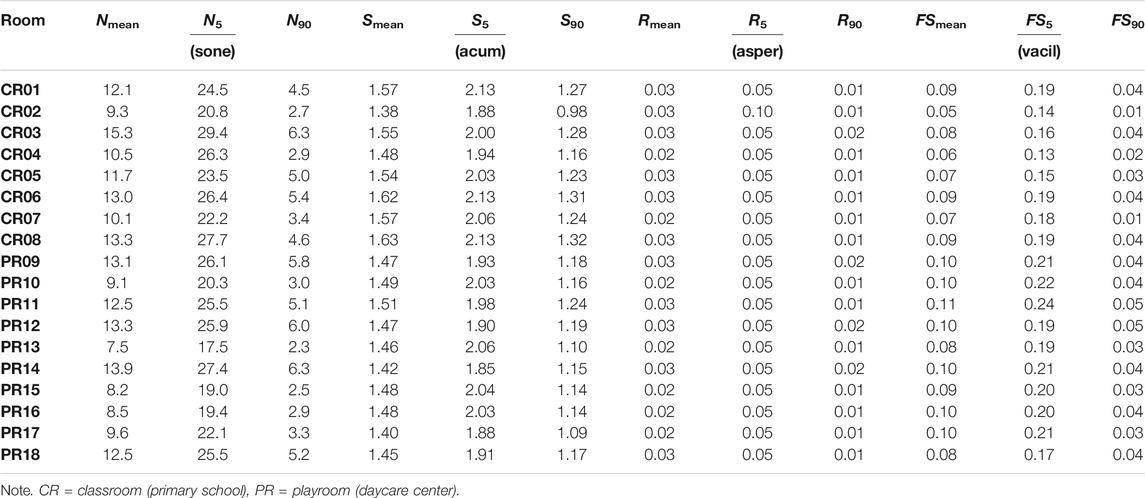
TABLE 6. In-situ psychoacoustic parameters from omnidirectional microphone.
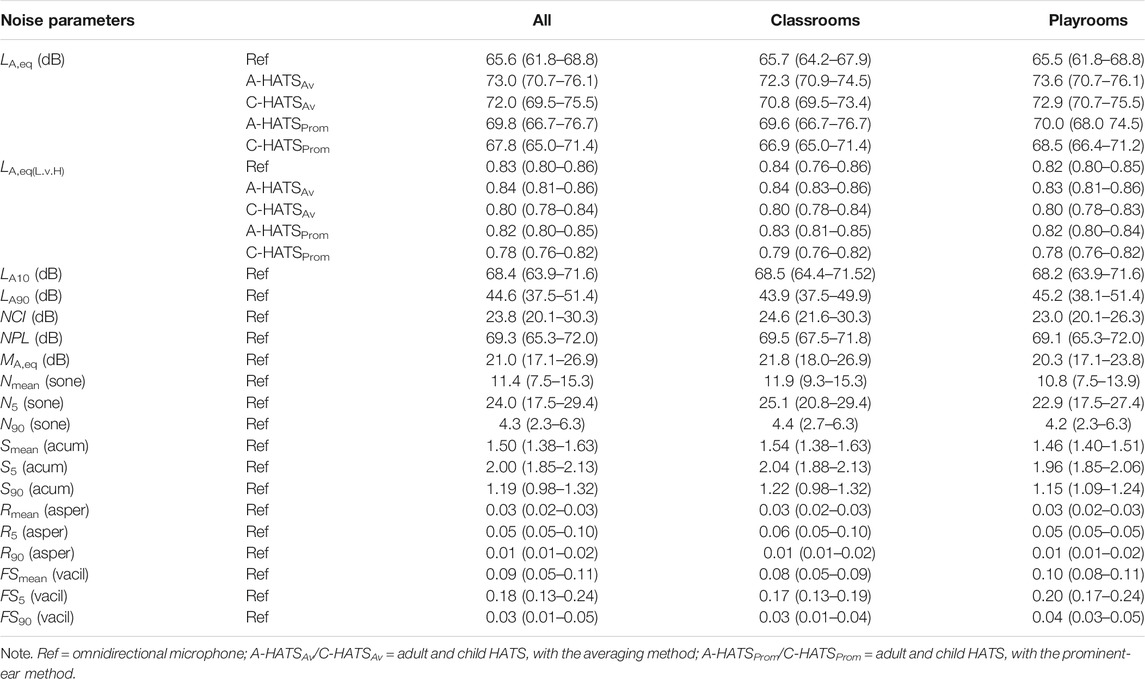
TABLE 7. Summary of noise parameters. Reported values are mean and the range (in brackets).
Differences between CRs in primary schools and PRs in daycare centers are mainly observable in loudness (average N = 11.9 sone (9.3–15.3 sone) vs 10.8 sone (7.5–13.9 sone); Table 7) and in sharpness (average S = 1.5 acum (1.38–1.63 acum) vs 1.46 acum (1.40–1.51 acum), and in the percentiles (average N5 = 25.1 vs 22.9 sone). An increase in loudness is understandably related to increasing LA,eq, with an R2 of 0.85. Loudness Nmean (as y) is predicted from LA,eq (as x) with the equation y = −61.90x + 1.12. Almost no relationship between increasing sharpness and increasing high-frequency content in the in-situ sound was found (R2 of 0.00 for Ref, A-HATSAv, and A-HATSProm; R2 of 0.02 for C-HATSAv; R2 of 0.04 for C-HATSProm).
Figure 5 shows the SPL variation according to the different measurement methods, room conditions, and SPL-based parameters. Results of the level-based and the in-situ psychoacoustic parameters from the other measurement methods using HATSs including both evaluation methods (averaging and prominent-ear) for each room can be found in Supplementary Tables S10–S17.
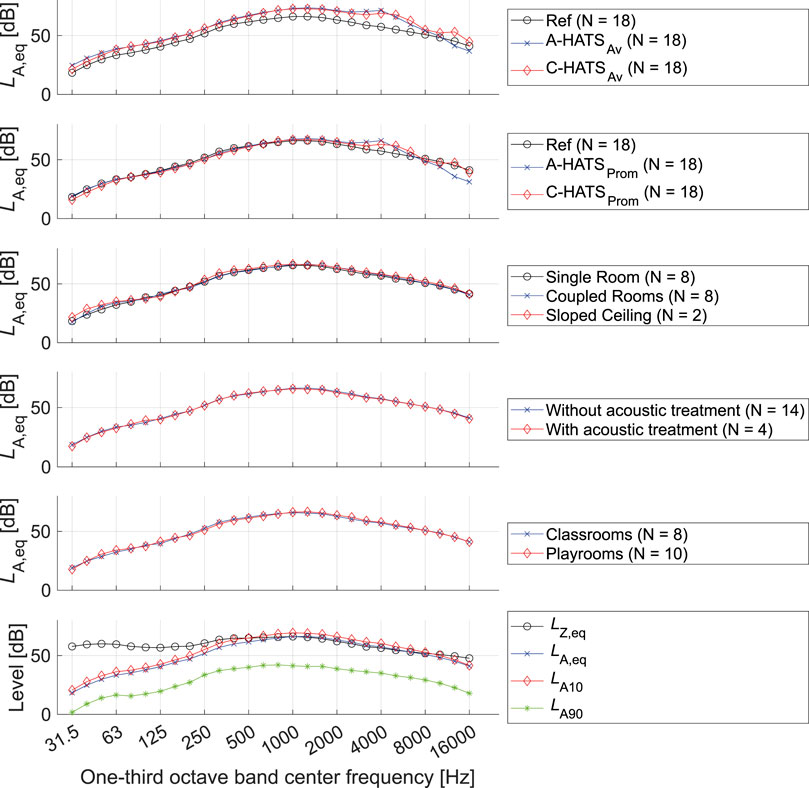
FIGURE 5. One-third octave band sound pressure levels (A-weighted) for the measurement methods and various room properties. Here, Ref = omnidirectional microphone, A-HATSAv/C-HATSAv = adult/child HATS (level summation), and A-HATSProm/C-HATSProm = adult/child HATS (prominent-ear method).
Figure 6 shows the difference between the mean values for several parameters across the measurement methods (Ref vs A-HATSAv vs C-HATSAv and Ref vs A-HATSProm vs C-HATSProm). Statistical analyses revealed differences in all noise parameters, except for the two level-based sound fluctuation parameters NCl and MA,eq (Supplementary Table S18). For the level-based parameters, the post-hoc analyses yielded significant differences for all comparisons across measurement methods for the parameter NPL, with significant differences between the Ref and HATS values for LA,eq using the averaging method and significant difference between the HATSs only for LA,eq using the prominent ear method. In terms of the low–high-frequency ratio of LA,eq, the post-hoc analyses revealed significant differences between the Ref and child HATS values while the Ref and adult HATS values were not significant for both averaging and prominent ear method. Differences between HATSs in LA,eq(L.v.H) for both evaluation methods were significant.
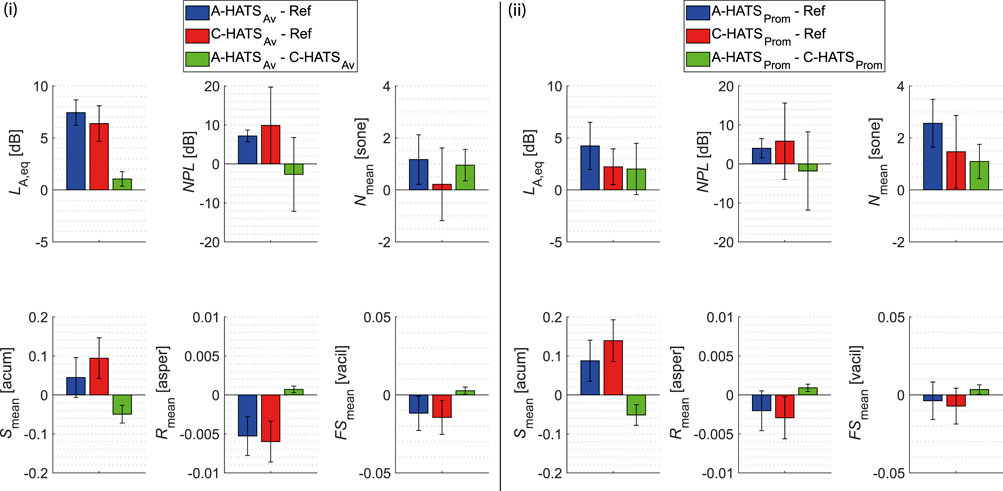
FIGURE 6. Each subplot shows differences in parameter (y-axis) values between three measurement methods. Each bar represents the difference in mean values as per the legend and its 95% confidence interval. Two groups of differences are presented: (i) differences between omnidirectional microphone (Ref), adult and child HATS with the averaging method (A-HATSAv/C-HATSAv) and (ii) differences between Ref, and adult and child HATS with the prominent-ear method (A-HATSProm/C-HATSProm).
For the psychoacoustic parameters, the post-hoc analyses showed no significant differences for loudness (Nmean and N5) between both HATSs using the averaging method and the omnidirectional microphone, while differences were significant in terms of using the prominent-ear method. However, no differences were found between the adult and child HATSs. Considering N90, differences between omnidirectional microphone and adult HATS were significant as well between the two HATSs. For sharpness (Smean), all results from the HATS were significantly different to the omnidirectional microphone and within each other (A-HATSAv vs C-HATSAv and A-HATSProm vs C-HATSProm). However, for S90, no differences between the HATSs with both evaluation methods were observed. For roughness (Rmean, R5 and R90), differences were observed between the omnidirectional microphone and the HATSs using the averaging method, while differences between the HATSs and both evaluation methods were not significant. For fluctuation strength, all measurement methods were significantly different from each other for FS90, while FSmean was only significantly different for omnidirectional microphone vs C-HATSAv; and for FS5, the only significant difference was between the omnidirectional microphone and the HATSs using the averaging evaluation method.
Supplementary Table S19 summarizes the results of the correlation analyses between the noise parameters and the room volume according to the different measurement methods. Significant correlations were only yielded for R5, FSmean, and FS5. In R5, only the adult and child HATSs’ measurement results using the averaging method were correlated with the room volume, while the FSmean showed a correlation above 0.5 for all HATS methods. All correlations with these methods were negatively correlated.
Results from this study (as listed in Table 4) add to the insights from previous studies across various countries (Klatte et al., 2013; Sala and Rantala, 2016; Astolfi et al., 2019b; Persson Waye and Karlberg, 2021; Wang and Brill, 2021). In the following, the mid-frequency octave bands (500 Hz, 1 kHz, 2 kHz; mid in Table 3 and Table 4) values will be discussed (except for STI), which were used in most previous studies in Table 1. In general, primary school CRs measured in Germany had higher RTs (T30) and marginally lower STI values than CRs in Finland (Sala and Rantala, 2016), but are within the range of corresponding values reported in previous studies summarized in Sala and Rantala from CR in several countries. Current sample of PRs had similar RT values compared to preschools in Sweden in a recent study (Persson Waye and Karlberg, 2021; Table 1), albeit with the largest RT reported there being 0.5 s compared to 0.7 s in the current sample. Overall, PRs had better room acoustic properties than CRs, with lower T30, EDT, and TS, and higher C50, D50, and STI values. Rooms with acoustic treatment understandably yielded better room acoustic values. PRs with coupled volumes had better room acoustic properties than single-volume PRs. However, this needs to be interpreted with caution since additional volumes, besides involving more complicated energy decays and subsequent analyses (Section 2.2.2 and Table 3), also provide extra sound absorption, which would disappear if the doors connecting these volumes were shut. Yet, the current findings are closer in representing the daily operation in PRs, where these doors are typically kept open.
If the room acoustic classification from the work by Astolfi et al. (2019b) is used, which is based on criteria for both T20 (T30 values used for the current sample) and C50 values, although for occupied rooms, all CRs except CR03 and CR04 would be classified as having “good acoustics,” while all PRs except PR10, 11, 14, and 18 would be classified as having “good acoustics.” It is likely, however, that some of these values may meet the criteria for “good acoustics” as per Astolfi et al. (2019b) if the measurements were conducted during occupation, as was shown for university CRs, especially with mostly reflective surfaces (Choi, 2016). STI (unoccupied) is recommended to be at least ≥0.80 and ≥0.85 for educational institutions for children without and with hearing, cognition, and/or behavioral issues, respectively (Finnish Standards Association, 2004). For the current sample, except for PR10 and PR11, none of the CRs or PRs meet the recommended STI values for even children without hearing and/or learning difficulties. STI, overall, had a strong linear relationship with RT (and other room acoustic parameters), similar to previous studies (Leccese et al., 2018; although not in Sala and Rantala, 2016), which can be used to estimate global STI values based on the simpler way to calculate RT values. While this implies that RT could perhaps be used as a primary indicator to represent the room acoustics in CRs, more studies with larger sample sizes are needed to determine the strength of the relationship between RT and STI, and their relationship with subjective impressions. U50 values, which have been used in several studies of CR acoustics, were not calculated for the current sample due to the measurement issues. The relevance of the good/bad acoustics in the current sample can further be explored based on subjective impressions of children in these rooms, as was done in Astolfi et al. (2019b), which is proposed for a future study. Nevertheless, based on room acoustics measurements alone, with higher RTs in some rooms and lower values for intelligibility than recommended, most CRs measured in the current study are likely to be not optimal for learning purposes (however, these rooms in occupied conditions might be better suited though it is not examined in this study) and may affect cognitive and behavioral development of children (Klatte et al., 2010a; 2010b; 2010c), and especially for children with hearing loss and/or learning difficulties (Crandell and Smaldino, 2000). The CRs that have “bad acoustics” (CR03, 04; Table 2) did not have any acoustic treatment, although the same was true of some CRs that could be classified as with “good acoustics” as per Astolfi et al. (2019b). None of the PRs had any substantial acoustic treatment but some of these may benefit from the extra absorption due to open doors to connecting volumes. With this in mind, Figure 3 shows that there is plenty of scope to improve the room acoustic conditions in the CRs and the PRs (if adjoining volumes are not included), with basic acoustic treatment to manage the excessive reverberation in the higher frequency while improving/maintaining appropriately high speech intelligibility (which could be estimated using Figure 2). Given that high-frequency sound absorption is relatively straightforward to accomplish (e.g., ceiling tiles, carpet, and/or wall absorption), and may partly be provided by the occupants, the results here are at least encouraging in terms of providing some impetus and guidance for solving the issues related to bad/insufficient room acoustics in CRs.
The results in Table 7 add to the previous in-situ measurements in primary schools and daycare centers and introduce some level-based sound fluctuation parameters previously used in other fields with multi-talker speech environments like open-plan offices (Yadav et al., 2021). For omnidirectional microphones, the mean LA,eq values in CRs and PRs were almost the same (∼66 dB), with a relatively wider range of values in the latter. These values are within the range of values reported in previous studies, but the range of values in the current sample generally has lower upper limits, that is, the CRs and PRs with higher LA,eq values had lower LA,eq values compared to previous studies. This includes LA,eq values reported from omnidirectional measurements in CRs of Italy (Astolfi et al., 2019a; 2019b), Finland (Sala and Rantala, 2016), and United States (for the speech levels, Wang and Brill, 2021), where the measurement devices were placed at fixed locations.
Omnidirectional LA,eq values in the current study were around 20 dB lower than values reported in studies wherein children wore dosimeters (Persson Waye and Karlberg, 2021), and in McAllister et al. (2009) where children in daycare centers had a microphone placed near each ear. Compared to McAllister et al. (2009), where children were free to move around, the HATSs in the current study had fixed locations and with microphones at the entrance of the ear canal instead. This, combined with the overall quieter CRs in the current sample, may partly explain the lower mean binaural LA,eq values in the current sample of PRs for the adult and child HATSs of around 13 dB, and 14.5 dB, respectively, for the prominent ear values. The mean LA,eq values calculated using the adult HATS were higher than those for the child HATS, which is opposite to what was reported in McAllister et al. (2009), where they compared values of similar measurement methods using binaural measurements for adults (Södersten et al., 2002) and children. McAllister et al. (2009) had partly attributed their results to children being the primary noise sources, which is also relevant for the current sample. Hence, the counterintuitive finding of higher LA,eq for the adult compared to child HATS in the current study, which is most likely due to the particular transducer placement, is suggested as a question for future research. At the very least, this comparison highlights the issues in the selection of transducers for child-appropriate in-situ studies where the location of the transducers is fixed.
Moreover, LA,eq values calculated using omnidirectional microphone were significantly different from HATS, and the adult HATS was at least significantly different from child HATS for the prominent ear condition (Section 3.2 and Supplementary Table S18). Based on the octave-band spectra in Figure 5, differences between the adult and child HATSs (SPLs calculated using level summation for the left and right ear values) and the omnidirectional microphone are largely linked to the 6 dB introduced by the level summation till around 1 kHz, followed by a more complicated trend till 16 kHz. There can be many contributing factors here, including the peak (around 4 kHz) and notches (around 8 and 10 kHz) in the magnitude response of the adult HATS HRTFs. In terms of the prominent ear values for the adult and child HATSs, no differences to the omnidirectional microphone are observed up to 2 kHz. Differences around 4 kHz and beyond 8 kHz are again observable as in the room acoustic parameters, which is in line with the work by Fels et al. (2004) and Fels and Vorländer (2009), who explain these effects with the anthropometric differences between adults and children; however, there are no noticeable differences between the different room conditions (coupled rooms, acoustic treatment, and room types). Since SPL above 8 kHz diverged between the adult and child HATSs, it can be assumed that the fine structure of the ear played a role in the evaluation and that the LA,eq could be sensitive to differences introduced by the anthropometric sizes of the ear. Altogether, the spectral variation in the SPL between the different transducers points toward some benefit in using a child HATS over an adult HATS and/or an omnidirectional microphone for LA,eq values.
For the percentile levels, the LA10 and LA90 values in the current study were similar to the ones reported in Sala and Rantala (2016) and were within the range of values of previous studies summarized in Sala and Rantala (2016). These percentile levels were, however, not significantly different between the adult and child HATSs. For the level-based fluctuation parameters, while only NPL showed significant differences across the measurement methods (different transducers), the usefulness of such parameters will depend on whether they are able to explain children’s perception of the noise environment in CRs and PRs, which is suggested as a question for future studies.
The use of psychoacoustic parameters is not common in CR acoustics literature. One of the aims of this study was to present results that may be useful for future studies, including ones that compare the performance and potential benefits of level-based and psychoacoustic parameters in relation to children’s perception of their acoustic environments. Hence, the discussion here will be limited to a preliminary comparison between the level-based and psychoacoustic parameters.
Fluctuation strength (FS) and roughness characterize amplitude modulations up to 20 Hz, and between 15–300 Hz, respectively. Roughness has been shown to be related to noise annoyance due to faster sound fluctuations, and FS has been shown to be related to auditory distraction (Schlittmeier et al., 2012). In the current study, the main finding related to these parameters is that they both show a significant decrease in values (R5, FSmean, and FS5) with increasing room volumes for the HATSs (Section 3.2.2), out of all the parameters tested (including level-based parameters). This finding broadly suggests decreasing amplitude fluctuations with increasing room volumes, which is expected, presumably if the number of children is not increasing disproportionately. However, this needs future studies where the number of children in a room is considered more systematically than the current study.
Mean sharpness values had significant differences between all the transducers. In terms of HATSs, this is consistent with previous findings (Fels et al., 2004) and the expectations of the current study, with higher values of high-frequency content measured with child HATS compared to adult HATS in accordance with anthropometric differences, as was discussed in Section 4.2. This observation is supported by the findings regarding the low–high-frequency ratio of LA,eq, though significant differences were only found between the omnidirectional transducer and the child HATS and between the HATSs. However, these results need validation in terms of children’s perception in future studies, where it would be possible to comment on whether the use of HATSs, which introduce measurement and analysis overheads, is sufficiently justified over the more traditional use of omnidirectional transducers, which further allow relatively convenient measurement setups.
Overall, the current results show very limited benefit in considering computationally expensive loudness and sharpness over the more traditional and easier to calculate level-based parameters, although there may be some benefit in considering fluctuation strength and roughness, which showed variation with increasing room values for the HATSs.
The measurement methods in this study have several limitations that are generally related to logistical difficulties in conducting measurements with children and/or at educational institutions. For the room acoustic measurements, some of the doors to adjoining rooms were not closed since they are typically left open during daily activities. This was discussed in detail in Section 2.2 and Section 2.3, including the method to address nonlinear decays. Room acoustics measurements were not conducted during occupancy, which limits the characterization of rooms to unoccupied conditions only, and further limits comparisons with previous studies.
In terms of the in-situ measurements, a major limitation was the fixed locations of the transducers, which was to avoid too many disruptions to the normal activities of children. The close-by positioning of the transducers can lead to shadowing effects that were not examined in detail within this study, which is acknowledged as a limitation. Furthermore, the head directions of the HATSs were static and not changed during the measurement durations, so the effects introduced by head movements could not be analyzed within this study. These issues could be improved in a future study wherein several measurement locations including using a combination of HATS locations and measurements using microphones placed near children’s ears, etc., as in McAllister et al. (2009).
Moreover, the number of children in the rooms fluctuated during the day, which could not be monitored. Hence, detailed analyses using the number of children as a factor were not possible and are recommended for future studies. Additionally, the type of noises and associated activities were not specifically analyzed in this study. In further studies, the measurement method could be chosen to allow studying the impact of noise sources (e.g., speech-based and impact sounds). Finally, since only one example of adult and child HATSs was used, results are limited to these HATS. It is likely that using a different HATSs will lead to different results to an extent, which can be considered in a separate study.
This study presents pilot results from acoustic assessments in German primary schools and daycare centers with a focus on long-term measurements using an adult and a child HATS, and an omnidirectional microphone, besides room acoustics. Main conclusions are as follows:
1. The room acoustics in both CRs and PRs in Germany has a lot of scope for improvements to meet guidelines for “good acoustics” outlined in recent studies. The current findings point toward the use of typical room acoustics treatment for high-frequency sound absorption to control the RTs while ensuring high speech intelligibility.
2. Based on omnidirectional measurements, long-term LA,eq values in CRs and PRs are very similar (∼66 dB), which are in general lower and with a smaller range than similar measurements in other countries in Europe and the United States . Similar trends are reported for percentile levels (L10, L90).
3. There are some indications that psychoacoustic parameters (especially fluctuation strength and roughness) may be beneficial in complementing SPL-based parameters.
4. Overall, while the findings here suggest some benefit in considering child HATS over adult HATS and/or omnidirectional measurements in terms of characterizing in-situ noise measurements, especially in the higher frequencies where anthropomorphic details are important, these findings are specific to the current measurement method with fixed locations for the transducers including orientation for the HATSs. More research that considers various transducer locations and orientations is necessary to validate these findings.
5. The findings here, especially for points 3 and 4 above, are considered preliminary and need further studies that characterize children’s perception in relation to the wide range of parameters studied here that included room acoustics, level-based, and psychoacoustic parameters.
The raw data supporting the conclusion of this article will be made available by the authors, without undue reservation.
The studies involving human participants were reviewed and approved by the Medical Ethics Committee at the RWTH Aachen University, Germany. Written informed consent to participate in this study was provided by the participants’ legal guardian/next of kin.
The concept of this study and manuscript was conceived and designed by JF, KP, MY, and KL. Data collection and processing were carried out by KL. Results analysis was conducted by KL and MY with support by MK in terms of statistical analysis. Results interpretations and literature search were driven by MY and KL in support of all contributing authors. KL took the lead in writing the manuscript and was supported by the other authors. All authors provided critical feedback and helped shaping the research, analysis, and manuscript. JF supervised the project and provided all necessary resources.
This work was funded through the HEAD-Genuit-Stiftung (project ID: P-16/17-W), the European Union’s Horizon 2020 research and innovation program under the grant agreement no. 874724 (Equal-Life), and the Deutsche Forschungsgemeinschaft (DFG, German Research Foundation) project number: 401278266. Furthermore, the project was supported by the Deutsche Forschungsgemeinschaft (DFG, German Research Foundation)—project number: 368482240/GRK2416.
The authors declare that the research was conducted in the absence of any commercial or financial relationships that could be construed as a potential conflict of interest.
All claims expressed in this article are solely those of the authors and do not necessarily represent those of their affiliated organizations, or those of the publisher, the editors, and the reviewers. Any product that may be evaluated in this article, or claim that may be made by its manufacturer, is not guaranteed or endorsed by the publisher.
Special thanks to the student assistants Simon Klein and Julian Burger for assisting acoustic measurements and data entry. Many thanks to Florian Pausch for helpful discussions and advice. Finally, the authors would like to thank all children, parents, educators, and administration from the involved educational institutions for participating in this study.
The Supplementary Material for this article can be found online at: https://www.frontiersin.org/articles/10.3389/fbuil.2022.688847/full#supplementary-material
Åhlander, V. L., Rydell, R., and Löfqvist, A. (2011). Speaker's Comfort in Teaching Environments: Voice Problems in Swedish Teaching Staff. J. Voice 25, 430–440. doi:10.1016/j.jvoice.2009.12.006
American National Standards Institute (2002). ANSI-S12.60-2002 - Acoustical Performance Criteria, Design Requirements, and Guidelines for Schools. Melville, NY: Inc..
Astolfi, A., Parati, L., D’Orazio, D., and Garai, M. (2019a). “The New Italian Standard UNI 11532 on Acoustics for Schools,” in Proceedings of the 23rd International Congress on Acoustics, Aachen, Germany, 7004–7011.
Astolfi, A., Puglisi, G. E., Murgia, S., Minelli, G., Pellerey, F., Prato, A., et al. (2019b). Influence of Classroom Acoustics on Noise Disturbance and Well-Being for First Graders. Front. Psychol. 10, 2736. doi:10.3389/fpsyg.2019.02736
Ayr, U., Cirillo, E., Fato, I., and Martellotta, F. (2003). A New Approach to Assessing the Performance of Noise Indices in Buildings. Appl. Acoust. 64, 129–145. doi:10.1016/S0003-682X(02)00075-0
Berzborn, M., Bomhardt, R., Klein, J. C., Richter, J.-G., and Vorländer, M. (2017). “The ITA-Toolbox: An Open Source MATLAB Toolbox for Acoustic Measurements and Signal Processing,” in Fortschritte der Akustik - DAGA 2017 (Kiel: Deutsche Gesellschaft für Akustik e.V. (DEGA)). Available at: https://publications.rwth-aachen.de/record/687308.
Bradley, J. S., Reich, R., and Norcross, S. G. (1999). A Just Noticeable Difference in C 50 for Speech. Appl. Acoust. 58, 99–108.
Bradley, J. S. (2011). Review of Objective Room Acoustics Measures and Future Needs. Appl. Acoust. 72, 713–720. doi:10.1016/j.apacoust.2011.04.004
Choi, Y.-J. (2016). Effect of Occupancy on Acoustical Conditions in university Classrooms. Appl. Acoust. 114, 36–43. doi:10.1016/j.apacoust.2016.07.010
Crandell, C. C., and Smaldino, J. J. (2000). Classroom Acoustics for Children with Normal Hearing and with Hearing Impairment. Lshss 31, 362–370. doi:10.1044/0161-1461.3104.362
Deutsches Institut für Normung, e. V. (2016). DIN 18041 - Acoustic Quality in Rooms - Specifications and Instructions for the Room Acoustic Design.
Deutsches Institut für Normung, e. V. (2009). DIN 45692 - Measurement Technique for the Simulation of the Auditory Sensation of Sharpness.
Fels, J., Buthmann, P., and Vorländer, M. (2004). Head-related Transfer Functions of Children. Acta Acustica united with Acustica 90, 918–927.
Fels, J., and Vorländer, M. (2009). Anthropometric Parameters Influencing Head-Related Transfer Functions. Acta Acustica united with Acustica 95, 331–342. doi:10.3813/aaa.918156
International Electrotechnical Commission (2012). IEC 60268-16 - Sound System Equipment - Part 16: Objective Rating of Speech Intelligibility by Speech Transmission index.
International Organization for Standardization (2008). ISO 3382-2 - Acoustics - Measurement of Room Acoustic Parameters - Part 2: Reverberation Time in Ordinary Rooms.
International Organization for Standardization (2017). ISO 532-1 - Acoustics - Methods for Calculating Loudness - Part 1: Zwicker Method.
International Organization for Standardization (1993). ISO 9568 - Cinematography - Background Acoustic Noise Levels in Theatre, Review Rooms and Dubbing Rooms.
Klatte, M., Bergström, K., and Lachmann, T. (2013). Does Noise Affect Learning? A Short Review on Noise Effects on Cognitive Performance in Children. Front. Psychol. 4, 578. doi:10.3389/fpsyg.2013.00578
Klatte, M., Hellbrück, J., Seidel, J., and Leistner, P. (2010a). Effects of Classroom Acoustics on Performance and Well-Being in Elementary School Children: A Field Study. Environ. Behav. 42, 659–692. doi:10.1177/0013916509336813
Klatte, M., Lachmann, T., and Meis, M. (2010b). Effects of Noise and Reverberation on Speech Perception and Listening Comprehension of Children and Adults in a Classroom-like Setting. Noise Health 12, 270. doi:10.4103/1463-1741.70506
Klatte, M., Lachmann, T., Schlittmeier, S., and Hellbrück, J. (2010c). The Irrelevant Sound Effect in Short-Term Memory: Is There Developmental Change? Eur. J. Cogn. Psychol. 22, 1168–1191. doi:10.1080/09541440903378250
Leccese, F., Rocca, M., and Salvadori, G. (2018). Fast Estimation of Speech Transmission Index Using the Reverberation Time: Comparison between Predictive Equations for Educational Rooms of Different Sizes. Appl. Acoust. 140, 143–149. doi:10.1016/j.apacoust.2018.05.019
Lenne, L., Chevret, P., and Marchand, J. (2020). Long-term Effects of the Use of a Sound Masking System in Open-Plan Offices: A Field Study. Appl. Acoust. 158, 107049. doi:10.1016/j.apacoust.2019.107049
McAllister, A. M., Granqvist, S., Sjölander, P., and Sundberg, J. (2009). Child Voice and Noise: A Pilot Study of Noise in Day Cares and the Effects on 10 Children's Voice Quality According to Perceptual Evaluation. J. Voice 23, 587–593. doi:10.1016/j.jvoice.2007.10.017
Møller, H., Sørensen, M. F., Hammershøi, D., and Jensen, C. B. (1995). Head-related Transfer Functions of Human Subjects. J. Audio Eng. Soc. 43, 300–321.
Moore, B. C. J., and Glasberg, B. R. (2007). Modeling Binaural Loudness. The J. Acoust. Soc. America 121, 1604–1612. doi:10.1121/1.2431331
Neuman, A. C., and Hochberg, I. (1983). Children's Perception of Speech in Reverberation. J. Acoust. Soc. America 73, 2145–2149. doi:10.1121/1.389538
Peng, Z., Lau, S.-K., Wang, L. M., Browne, S. D., and Roy, K. P. (2013). Binaural Room Impulse Response Database Acquired from a Variable Acoustics Classroom. Proc. Mtgs. Acoust. 15, 015003. doi:10.1121/1.4793567
Persson Waye, K., and Karlberg, J. (2021). Sound Quality Characteristics of Importance for Preschool Children's Perception and Wellbeing after an Acoustic Intervention. Front. Built Environ. 7, 91. doi:10.3389/fbuil.2021.688836
Persson Waye, K., van Kamp, I., and Dellve, L. (2013). Validation of a Questionnaire Measuring Preschool Children's Reactions to and Coping with Noise in a Repeated Measurement Design. BMJ open 3, e002408. doi:10.1136/bmjopen-2012-002408
Picard, M., and Bradley, J. S. (2001). Revisiting Speech Interference in Classrooms:Revisando la interferencia en el habla dentro del salón de clases. Int. J. Audiol. 40, 221–244.
Prodi, N., Farnetani, A., Yiluya, S., and Fels, J. (2007). “Investigating Classroom Acoustics by Means of Advanced Reproduction Techniques,” in Audio Engineering Society Convention, 122.
Sala, E., and Rantala, L. (2016). Acoustics and Activity Noise in School Classrooms in Finland. Appl. Acoust. 114, 252–259. doi:10.1016/j.apacoust.2016.08.009
Schlittmeier, S. J., Weißgerber, T., Kerber, S., Fastl, H., and Hellbrück, J. (2012). Algorithmic Modeling of the Irrelevant Sound Effect (ISE) by the Hearing Sensation Fluctuation Strength. Atten Percept Psychophys 74, 194–203. doi:10.3758/s13414-011-0230-7
Schmitz, A. (1995). A New Digital Artificial Head Measuring System. Acta Acustica united with Acustica 81, 416–420.
Shield, B. M., and Dockrell, J. E. (2008). The Effects of Environmental and Classroom Noise on the Academic Attainments of Primary School Children. J. Acoust. Soc. America 123, 133–144. doi:10.1121/1.2812596
Shield, B. M., and Dockrell, J. E. (2003). The Effects of Noise on Children at School: A Review. Building Acoust. 10, 97–116. doi:10.1260/135101003768965960
Shinn-Cunningham, B. G., Kopco, N., and Martin, T. J. (2005). Localizing Nearby Sound Sources in a Classroom: Binaural Room Impulse Responses. J. Acoust. Soc. America 117, 3100–3115. doi:10.1121/1.1872572
Södersten, M., Granqvist, S., Hammarberg, B., and Szabo, A. (2002). Vocal Behavior and Vocal Loading Factors for Preschool Teachers at Work Studied with Binaural DAT Recordings. J. Voice 16, 356–371. doi:10.1016/S0892-1997(02)00107-8
Sottek, R. (1993). Models for Signal Processing in the Human Auditory System. [dissertation]. Aachen, Germany: RWTH Aachen University.
van Wijngaarden, S. J., and Drullman, R. (2008). Binaural Intelligibility Prediction Based on the Speech Transmission index. J. Acoust. Soc. America 123, 4514–4523. doi:10.1121/1.2905245
Wang, L. M., and Brill, L. C. (2021). Speech and Noise Levels Measured in Occupied K-12 Classrooms. J. Acoust. Soc. America 150, 864–877. doi:10.1121/10.0005815
Keywords: noise assessment, educational buildings, children’s hearing, binaural acoustics, classroom acoustics
Citation: Loh K, Yadav M, Persson Waye K, Klatte M and Fels J (2022) Toward Child-Appropriate Acoustic Measurement Methods in Primary Schools and Daycare Centers. Front. Built Environ. 8:688847. doi: 10.3389/fbuil.2022.688847
Received: 31 March 2021; Accepted: 03 January 2022;
Published: 08 February 2022.
Edited by:
Arianna Astolfi, Politecnico di Torino, ItalyReviewed by:
Valtteri Hongisto, Turku University of Applied Sciences, FinlandCopyright © 2022 Loh, Yadav, Persson Waye, Klatte and Fels. This is an open-access article distributed under the terms of the Creative Commons Attribution License (CC BY). The use, distribution or reproduction in other forums is permitted, provided the original author(s) and the copyright owner(s) are credited and that the original publication in this journal is cited, in accordance with accepted academic practice. No use, distribution or reproduction is permitted which does not comply with these terms.
*Correspondence: Karin Loh, a2FyaW4ubG9oQGFrdXN0aWsucnd0aC1hYWNoZW4uZGU=
Disclaimer: All claims expressed in this article are solely those of the authors and do not necessarily represent those of their affiliated organizations, or those of the publisher, the editors and the reviewers. Any product that may be evaluated in this article or claim that may be made by its manufacturer is not guaranteed or endorsed by the publisher.
Research integrity at Frontiers
Learn more about the work of our research integrity team to safeguard the quality of each article we publish.