 Sahar Hasanpour
 Mehdi Khakzand
 Mohsen Faizi
- School of Architecture & Urban Planning, Iran University of Science and Technology, Tehran, Iran
With the industrialization of societies, urban planners are more concerned with the significance of leisure time since it affects individuals’ mental state and wellbeing. Considering the importance of visual quality, this study examined young adults in the Torghabe and Mellat park of the Mashhad to improve the quality of the leisure environment by detecting youth preferences for natural and man-made variables. Accordingly, the classic Delphi method was used to detect research variables. The most common preference priorities were extracted by photo surveys, simulation of the study environment, and conjoint analysis with the full design approach to calculate the relative importance and Part-Worths, or utility values of these variables, according to the results, among the considered attributes, “shape” (32.61%) and “ solid/void patterns” (5.96%) were of the most and the least significance in the youth preferences for leisure spaces combining natural and shopping environment.
1 Introduction
With increasing population and industrialization of societies, individuals’ mental and social dimensions and their quality of life have been disregarded; hence, leisure time can be considered to address this issue (Marsella 1998; Prüss et al., 2008; Trivedi et al., 2008; Srivastavala 2009; Hardoy et al., 2013). Research indicates that leisure time increases multidimensional construct of quality of life and wellbeing (Caldwell 2005; Brajša et al., 2011; Paggi 2016; Mansfield et al., 2020). Environmental quality is one of the indicators assessing quality of life and physical health (Motloch 2010; Streimikiene 2015). In this regard. Improving environmental quality is of great significance, and visual values are of priority in this regard (Kivanc 2013). Vision accounts for 87% of human perception (Bell 2004, 3), thus playing a critical role in shaping the identity and appeal of a space or a community (Kivanc 2013). The quality of the landscape and its factors, the quality of buildings and their elements, the quality of public spaces and their components, the variety of shapes, the quality of facades, and landscapes are included in the visual dimension (Sadeghi et al., 2014). Human interests, tastes, visual perceptions, and aesthetic expectations are highly relative and different; hence, their measurement and evaluation are highly challenging. Accordingly, consistent visual principles and variables are required to measure (Bell 2004, 11) the target group’s preferences. Considering the role of aesthetics and individuals’ visual preferences in observing the environment is highly important and plays a key role in increasing environmental quality (Amini and Adibzadeh 2020) and reinforcing the relationship between humans and the environment, thereby enhancing the presence of individuals in spaces.
A qualitative descriptive-analytical research in Iran employed survey and library research methods to collect the required data, and the results indicated that landscaping and building facades can lead to the emergence of perceptions such as understanding the space appeal and feelings and a sense of belonging; hence, they can improve the quality of the environment and comfort among citizens (Azma and Katanchi 2017). In addition to identify the visual aesthetics of the facade to promote the quality of the environment, many studies have addressed individuals’ preferences to improve environmental quality by using greenery and water in different ways. However, the studies provided no clear understanding of its different types such as the forms of water display or certain types of plants and trees or their type and shape.
In the proposed manuscript, conjoint analysis was used to examine the aesthetic and visual preferences of the environment to detect the young adults’ needs (20–30). The present study aimed to find a significant relationship between natural and man-made elements and youth preferences for leisure environment and estimate the relative importance and utility values of each variable to improve environmental quality. The study was conducted in Mashhad and included young adults, who were surveyed regarding their preferences for variables of the natural and man-made environment. Furthermore, the interactions among these variables were evaluated using the conjoint analysis method. In this study, its attributes and levels are independent variables, and the young interviewees’ preference for the leisure environment is a dependent variable. The full design approach was adopted so that each profile describes a different environment encompassing different combinations of all the selected attributes and the levels of each attribute, which are visually simulated based on the concerned environment.
2 Literature review
2.1 Nature
Recent studies have indicated that greenery improves mental health (Parry 1990; Pretty, 2006; Gubbels et al., 2016; Barton and Rogerson 2017; Kua and Sia 2017; Wang et al., 2019) and has a strong restorative effect on stress (Kondo et al., 2018). Greenery in its different types and sizes, including shrubs, trees, and grass, in combination with water also increases the sense of security (Hami et al., 2014).
2.2 Nature and quality of leisure space
Previous research on commercial and service environments in green and natural settings have highlighted their positive impact on individuals’ mental status, attitudes, mood (Joye et al., 2010; Kristjánsson 2017; Purani and Kumar 2018). Individuals’ physical and mental health (Rosenbaum et al., 2018) directly enhances the visitor’s emotional and behavioral response. In quantitative and descriptive studies on commercial environments in Colombia, the results revealed that the elements of the natural environment play an essential role as a preferred factor and promote environmental quality (Ortegón-Cortázar and Royo-Vela, 2017; 2019). In a study adopting a survey method and simulating the visual space by natural stimuli, the results highlighted the preference for the natural environment and its positive effect on individuals’ mental state. Studies in South America addressed the presence or absence of natural elements in shopping malls and indicated that individuals at different ages have a preference for nature (Rosenbaum et al., 2016; Rosenbaum et al., 2018). In 2018, a study in Malaysia used a photo survey in shopping malls and revealed the public preferences for a wide range of green spaces with a garden, water flow, and seating area. Attractive appearance may affect visitors’ behavior; however, none of the studies has addressed a specific age range (Hami et al., 2014). In this regard, the combination of the natural environment and shopping positively affects visitors.
2.3 Formal elements and environmental quality
Some of the visual principles are introduced by Bell (2004) in his book, which are: direction, size, shape, number, position, orientation, interval, texture, density, color, light, visual force, and visual inertia. Ching (2007) considers the architectural form as the point of contact between mass and space and classifies visual elements into form (including different proportions of form and dimensions, shape, curved surfaces, edges, etc.), mass, void, scale, material, and so on. He believes that architectural forms, textures, materials, color, light, shadow, and others are combined to introduce the quality of space, and the environmental quality is defined as the use and relationship of these elements inside and outside the building. Moreover, a list of formal aesthetic elements is presented in previous studies, and the most remarkable elements of physical aesthetics are identified as follows: proportion, scale, form, dimensions (Pazooki 2011); shape (i.e., Façade shape, entrances, doors and windows’ shapes, and entrances’ specifications); color (i.e., dominant color and other colors in the façade); texture (i.e., facade material, material luminosity, and facade transparency); lines (i.e., skyline, vertical and horizontal lines, horizontal and vertical extensions, entrances’ location), subjective parameters, and objective parameters [i.e., visual (facade materials, color, form, skyline and building line, proportions of facades, etc.) and formal (artificial elements, natural elements, parks (including parks, green spaces, trees, and fountains)] (Esmaili et al., 2020), proportions, materials, simplicity, depth, and the interaction of solids and voids (Prieto and Oldenhave 2021).
2.4 Conjoint analysis
Conjoint analysis is an advanced analysis method in marketing to understand individuals’ complex choices. In this method, qualitative data is converted into quantitative data using statistical analysis and goes beyond a standard rating question. It forces respondents to pick what product concepts they like best, helping identify what your audience truly values.
Conjoint analysis uses logistic regression to calculate how different attributes and levels are valued, conjoint uses categorical data instead of continuous data. The result of this regression calculates coefficients. These coefficients are referred to as “utilities”. Utilities are not an actual unit of measurement, it can be thought of as “happiness” (Surveyking., 2021). With this part-worths (
It was first adopted by Laing (2005) in landscape science to understand individuals’ preferences for the visual impact of street views, and then Aspinall et al. (2008) used it to evaluate the relative importance of outdoor spaces for the elderly according to the Discrete Choice Conjoint Analysis method. In a study in southeastern Spain, in the lowlands of the Alps and the Jaras, conjoint analysis was used to evaluate the landscape and its crop components by including 165 visitors of the region and their preferences for the three main landscape components. Moreover, both ranking and rating methods were considered in the assessment of preferences. Some strategies were proposed in this study to maintain the highest landscape value (Sayadi et al., 2009). In 2019 in Australia, a study employed the conjoint method to assess the aesthetic factors among tourists to provide environmental changes (including four attributes) in the landscape of the Great Barrier Reef (GBR) underwater ecosystem. The relative importance of the landscape revealed how protective planning must be implemented to achieve sustainable tourism development (Le et al., 2019). In Australia, Schirpke et al. (2019) aimed to estimate landscape preferences at the individual level based on a set of perspectives using the conjoint method. To this end, the landscape preferences of 967 participants were examined by a photo survey using 24 photos of the central Alps at four sites, and the relative importance and part-worth utilities of each attribute were then calculated.
The value importance represents the relative contribution of an attribute in assessing youth preferences compared to other attributes, and the utility score shows more details about the effect/attribute-related variations in assessing youth preferences for the environment.
2.4.1 Estimation of the utility values
The additive model of the Conjoint Analysis is:
The relative importance of an attribute can be obtained by weighting on the sum of the ranges (Conjoint Analysis .n.d.)
3 Methods and material
3.1 Study setting and data collection
This study was conducted in Mashhad, a metropolitan city in northeastern Iran. Mashhad is known as the second-largest city in Iran (Figure 1). It is the second-most populous city in Iran after Tehran, and a majority of its population is 20–30 years old. Because of the holy shrine, the city receives more than 27 million visitors annually. Moreover, the city is rich in its natural resources and has many natural potentials.
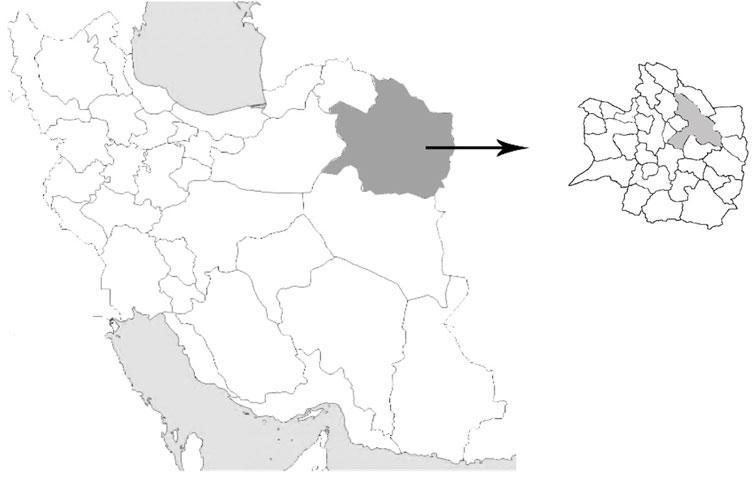
FIGURE 1. Map of mashhad.
Both descriptive and inferential statistics and factorial analyses were used to reach the research objectives. To this end, the required data were collected from two regions in Mashhad, Mellat Park and Torqabeh, where there are rich natural resources, including vast vegetation, abundant rivers, and gardens, and a commercial district. These two are the biggest parks in Mashhad, which have all the criteria selected in this article together, including (built and natural space). One is in the center of Mashhad and the other is in the west of Mashhad, whose persona is different in terms of economic status.
In this study, the researchers set 250 cases as a domain. A large sample size in usually considered in the conjoint analysis studies, ranging from 100 to 1,000 cases (Oyatoye et al., 2016) The data were collected using 20 photo surveys and face-to-face interviews to ensure the consistency of the responses. The questionnaire was given to random cases (in groups of 5–10) in field study by the author, and the author was present when each person was completing the questionnaire, to clarify any possible ambiguity in the questions. If the person was unwilling to answer, the questionnaire was given to another person to ensure that the response rate is 100%. This process had been lasted about two consecutive months and questionnaires were gathered in the same time.
The percentage of gender distribution shows that 140 users (59.1%) of the participants are female and 97 users (40.9%) are males. This is to the existing Gender based population of the Mashhad.
3.2 Demographic measure
The participants’ social and demographic features, including gender, level of education, and age were assessed. To assess the level of education, these following levels were considered: below high school diploma, high school diploma, bachelor’s degree, master’s degree, and PhD, and gender was also assessed as two male and female categories. Different levels of education indicate that 64 (27%) participants do not have a high school diploma, 72 (30%) persons have a high school diploma, 85 (36%) persons hold a bachelor’s degree, 11 (5%) persons hold a master’s degree, and 5 (2%) persons have a PhD degree. These figures reflect the existing situation within the society in general as well.
3.3 Attribute and level selection
In the Literature Review Section, the visual attributes promoting the quality of the environment was listed according to some documents and previous studies, including shape, color, proportion, dimensions, patterns of solids and voids, direction, material, texture, brightness, shadow, edges, scale, orientation, rhythm, skyline, and position, water, greenery (Bell 2004; Ching 2007; Pazooki 2011; Esmaili et al., 2020; Prieto and Oldenhave 2021). To identify research attributes from aforementioned list, the classic Delphi method (Grime and Wright 2016) was used in three rounds as follows to: First, 10 specialists in the field of landscape and architecture from the Tehran University of Science and Technology were selected. After submitting the developed questionnaires to them, they were asked to rate the effect of factors on the landscape aesthetics and the appeal of the environment based on a five-point Likert scale. Due to the clarity of the preliminary criteria, the structured questionnaires were developed for the first round (Very weak = 1, weak = 2, moderate = 3, good = 4, excellent = 5). At the end of the first round, after comparing the obtained values with the threshold value (=3) here, out of 18 factors, eight factors with an average score <3 were removed. The revised questionnaire was prepared and was submitted once more for the second round. In this phase, two other factors were also removed after reviews. In the third round, the factors remained from the second round were screened once more. Then the Kendall correlation coefficient was used to check the consensus calculated by SPSS software. Seven factors (namely shape, material, height, facade orientation, solid/void patterns, water, and plants) with scores close to one [i.e., 0.9 (very strong consensus) and 0.7 (strong consensus)] were selected to be included in this study. Two levels of each factor were considered, as described in the Introduction Section: shape (straight and curved), height (tall, medium, and short), material (transparent and opaque), Orientation (horizontal and vertical), solid/void patterns (void or no void), water (streams and ponds), and plants (trees and flowers) (Fernando, 2012).
3.4 Questionnaire design
The full profile method containing 2 × 2×2 × 2 × 2 × 2 × 3 = 192 different modes, which used the orthogonal design formula with SPSS software, was used in this study. It was reduced to 20 incentives presented in the form of a photo survey. In the orthogonal creation method of full profile incentives, the variables are assumed to be independent from each other (Oyatoye et al., 2016). Each of the 20 incentives simulates an environment, in which there are seven factors and one level for each factor in the scene. First, an image was selected as the base (Figure 2), and all the required factors and levels in each incentive were visually simulated using Photoshop software (Figures 3, 4).
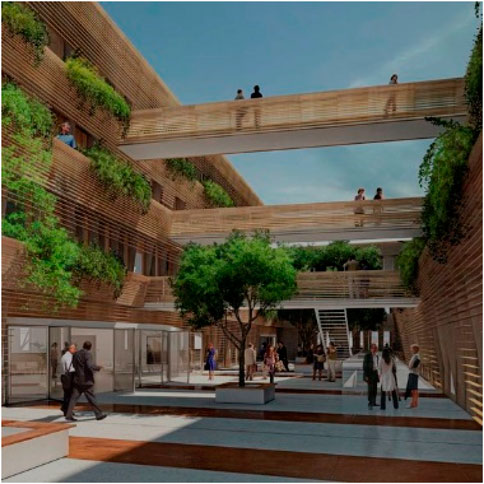
FIGURE 2. Base photo.

FIGURE 3. Photo on Card one shows Attribute “water” with “stream” level, attribute “plant” with “horizontal” level, attribute “facade orientation” with “horizontal” level, and attribute “shape” with “straight” level, attribute “solid/void” with “no void” level, attribute “material” with “transparent” level, and attribute “dimension (height)” with “medium” level.
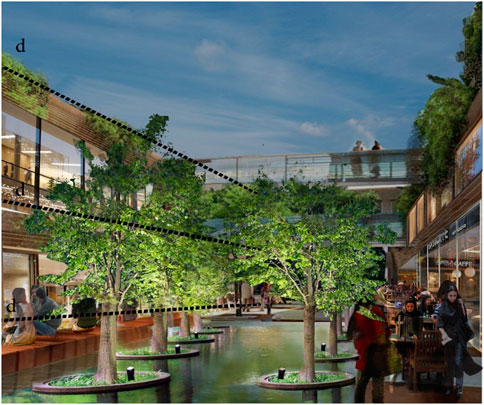
FIGURE 4. Photo on Card two shows Attribute “water” with “pond” level, attribute “plant” with “vertical” level, attribute “orientation” with “horizontal” level, and attribute “shape” with “straight” level, attribute “solid/void” with “no void” level, attribute “material” with “transparent” level, and attribute “dimension (height)” with “medium” level.
The overall scene shows a view of the greenery and water next to a wall of shops, and the observer and the depth of the image are fixed in all scenes.
Dimensions refers to the height of the wall since the depth and width are fixed in all the images. Orientation refers to the proportions of height to wall length, which can induce a horizontal viewing angle or a vertical viewing angle for the observer. Shape outlines the wall and lines in the landscape, which are considered curved or straight.
3.4.1 Youth preferences
The questionnaire was responded using a scoring method, which was a combination of all scoring values. In each pictured incentive, the factors and their levels were used to measure youth preference, and the participants were asked to express their preferences (on a 10-point Likert scale) using the seven statements about the presence of each factor in the scene. Positive scores indicate the level of positive preferences, and negative scores represents the level of negative preferences. In this regard, the options were as follows: very high (5/−5), high (4/−4), moderate (3/−3), low (2/−2), very low (1/−1), and ineffective (0) (Figure 5).
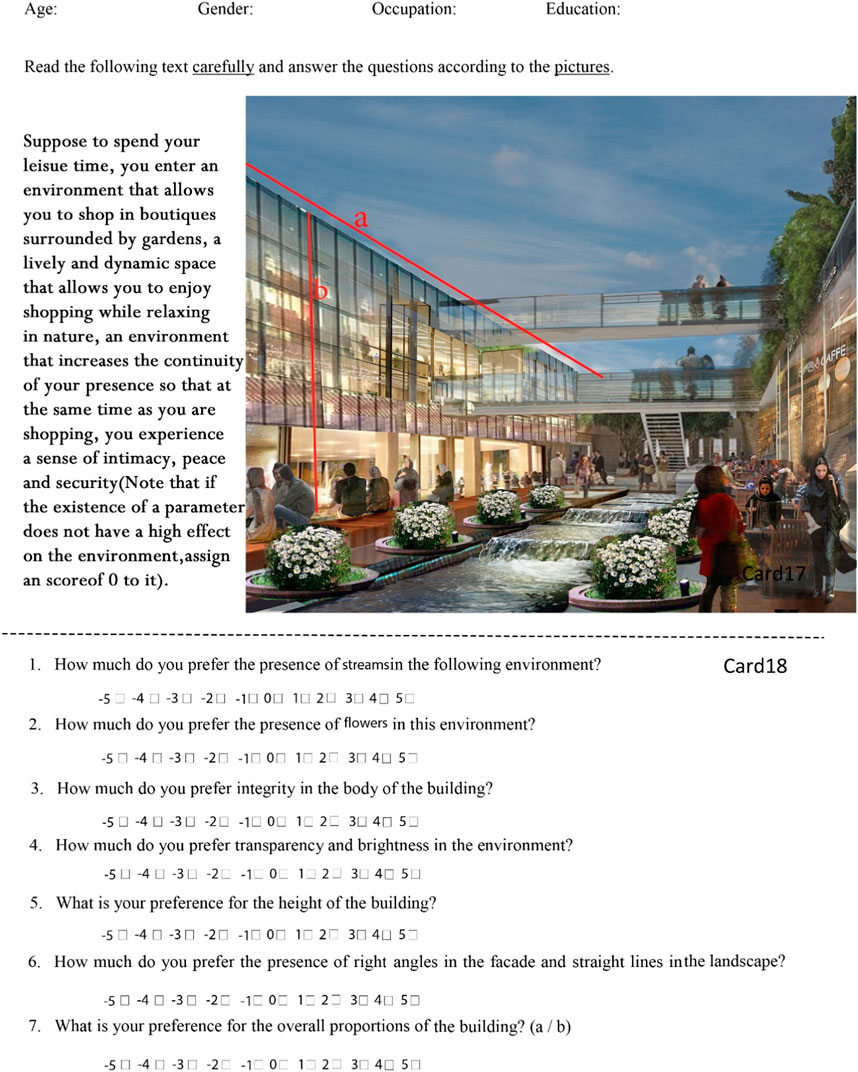
FIGURE 5. Research questionnaire (A) The length of the building, (B) Building height.
4 Results
There is no graphical user interface available in SPSS for Conjoint Analysis. The SPSS-Syntax has to be used in order to retrieve of procedure CONJOINT.
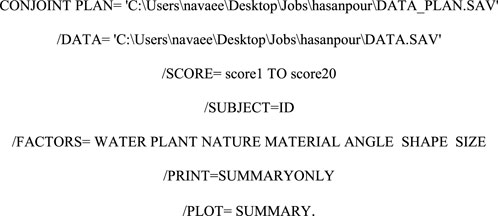
The PLAN subcommand: tells which file contains the data for the reduced design.
The subcommand DATA: tells conjoint which file contains the rankings of the respondents.
The subcommand FACTORS is relationship between the factors and the ranks of the interviewed persons. In this manuscript, all of the relationships are DISCRETE.
The results would be the following:
4.1 Correlations between observed and estimated preferences
To calculate the significance level of the hypothesis, Pearson’s R and Kendall tau tests were used and the number 0.0001 was obtained. Accordingly, the studied model has remarkable accuracy and validation, and there is a significant relationship between natural and man-made elements and youth preferences for leisure environment, which is a combination of shopping environment and green spaces in this study.
4.2 Homogeneity of stimuli
Regarding the general specifications of the model, there are two levels for each variable, and the relationship is considered discrete, suggesting that the variables are nominal, and that there is no large or small direction in the studied properties. The V-Kramer test was used to check the correlation of the attributes, and the scores are as follows: 0.10 for water and plants, 0.10 for water and solid/void pattern, 0.30 for water and materials, 0.10 for water and façade orientation, 0.20 for water and shape, 0.45 for water and height, 0.03 for plant and solid/void pattern, 0.19 for plant and materials, 0.41 for plant and facade orientation, 0.50 for plant and shape, 0.61 for plant and height, 0.18 for solid/void pattern and materials, 0.39 for solid/void pattern and facade orientation, 0.10 for solid/void pattern and shape, 0.32 for solid/void pattern and height, 0.10 for materials and facade orientation, 0.10 for materials and shape, 0.15 for materials and height, 0.10 for facade orientation and shape, 0.90 for facade orientation and height, and 0.23 for shape and height. In the temporal model design, homogeneous stimuli are the ones with a low (close to zero) correlation between attributes. If the aggregated utility structures are highly heterogeneous, this loss of information is substantial. Accordingly, all attributes are homogeneous. Due to the choice limitations for possible combinations, the homogeneity of the design is affected to such an extent that this error can be ignored.
4.3 Relative importance
Figure 6 shows the relative importance of the attributes calculated. As presented, the attribute “shape” with the score of 32.61% is the most important, followed by “orientation” with 23.25%, “dimension” (height) with 11.24%, “material” with 11.13%, “water” with 8.29%, “plants” with 7.51%, and “solid/void pattern” with 5.96%, respectively.
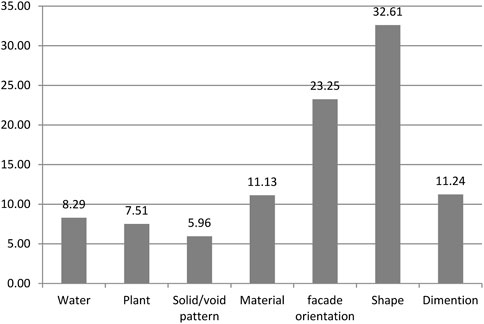
FIGURE 6. Relative importance of each attribute.
4.4 Utility score
Table 1 shows the preferred utility for each level of an attribute. Some cases are schematically presented in Figures 7,8 the others are described. In this case, a higher score indicates more convenience for the subjects. Moreover, Table 1 can be used to compare the level of one attribute with the level of another attribute. For example, from the perspective of the participants, horizontal orientation with a score of 0.22 is more important than opaque or transparent materials with a score of 0.09. This implies that an environment with a focus on a wall inducing a horizontal view is more preferred among the young adults from Mashhad compared to an environment with transparent materials. It is also possible to add two levels and compare them with other levels. For example, individuals will choose an environment using straight shapes and small masses in the landscape and outlines of the building (0.14 + 0.03) compared to an environment with curved shapes and large masses (−0.14 + 0.15). It is also possible to compare the combination of one to seven levels with one to seven other level. Finally, the results show that an environment with concentrated water features (ponds) and short plants inducing a horizontal angle of view and a solid with a horizontal wall, in Which transparent materials are integrated, is the most favored and preferred option among the young adults.

TABLE 1. Total part worth utility.
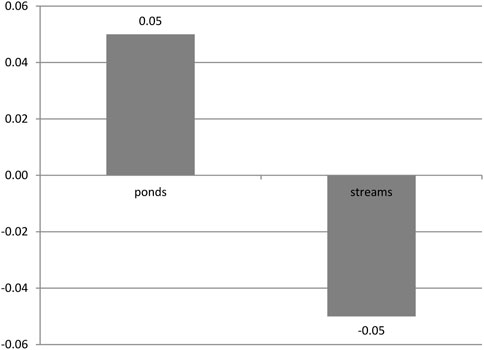
FIGURE 7. The youth’s Preferences for water.
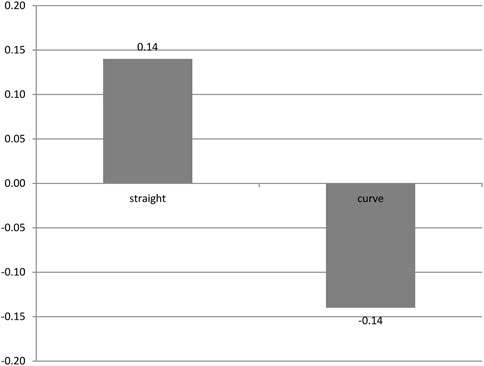
FIGURE 8. The Youth’s preferences for shape.
Figure 7 shows that “ponds” are the young adults’ preference for the variable levels of water.
Figure 8. Indicates that ‘straight’ is the young adults’ preference for the variable levels of shape.
In the diagram illustrating the attribute ‘orientation’, the young adults’ preferences are ‘horizontal’ for the variable levels of orientation, ‘no void’ for the variable levels of solid/void patterns, ‘flower’ for the variable levels of plant, ‘straight’ for the variable levels of shape, and ‘tall’ for the variable levels of height.
5 Discussion
Research in countries with different cultures reveals significant differences in landscape preferences regarding different factors such as age, population, level of education, specialization (designers and non-designers), geographical location, and personality (Alizadeh et al., 2018). In this study, studies addressing the effects of age and level of education, which were discussed in demographic features, on landscape preferences were reviewed. For example, the results for the level of education suggested that those who are more inclined to nature are probably illiterate or uneducated” (Sevenant and Antrop 2006). Considering age, research in Iran shows that children in the age range of 7–12 years prefer formal aesthetics, while adults in the age range of 18–55 years prefer sensory aesthetics, including nature (Kashani 2015). Research in China on older adults has shown that natural landscape features are a common factor affecting their preferences (Wu et al., 2015); however, the preferences of slightly older individuals for green spaces may vary depending on setting, which may indicate that the desire for nature increases with age.
The findings this study confirm the previous findings in terms of demographic features, including ‘level of education.’ The young adults aged 18–30 years in Mashhad preferred formal elements in the facade over the elements of the natural environment in a leisure environment. These differences may be due to age constraints or environmental performance. This means that the more limited the range of the above factors is, the more variations are observed.
In terms of preferences, no study prioritized all attributes mentioned in this study. However, comparing two natural features (namely water and plants) and two levels for each attribute (streams/ponds and horizontal/vertical), a study in China shows that older adults prefer green features such as “ground cover” and “colorful flowers” to “diverse plant composition” and “canopy trees”. This implies that the height of the plant is important and that the participants prefer landscapes with water features more than plant landscapes, showing that water features are preferred among the elderly (Wang and Rodiek 2019). However, no research has addressed this issue among younger adults.
In this manuscript, water (8.29%) is more important than plants (7.5%). There seem to be almost common results regarding the preference for the forms of nature and the preference of water over nature among old and young adults; however, no research has examined the forms of water as mentioned. In thus study, five facade attributes of form (namely shape, height, materials, solid/void pattern, and facade orientation) were selected. Some studies have examined shape, transparency, and dimensions, as discussed below.
Research on walkability for the elderly has highlighted the significance of transparency as a positive feature, indicating that medium height is more preferred than shorter heights. In contrast, in this study, dimensions are in the third place, and larger dimensions are preferred. Moreover, shapes are preferred over curved shapes that are visually pleasing (Bertamini et al., 2016). Focusing on specific demographic features such as age, level of education, and personality in this study may explain the consistency of their findings with those of the present study regarding the curve/straight levels since creative individuals are documented to prefer curved shapes (Alizadeh et al., 2018). Accordingly, the participants in this study might be less creative and this makes providing definitive comments difficult.
6 Conclusion
The detection of the most salient features of individuals’ willingness to use a place is of paramount importance. This study examined the relative importance of the environmental attributes and their levels regarding the youth preferences for a leisure environment (i.e., a combination of shopping and green space) in Mashhad. The study aims to improve the landscape quality by prioritizing preferences. The findings would contribute to designing and identifying dominant environmental attributes and prioritizing them to improve landscape design and management for the young adults. Environmental, urban, and landscape designers are also provided with information on visual preferences for the landscape design of leisure spaces. According to this study, building facade visual elements along with natural elements can be used purposefully in the design of such spaces for youth to make the environment more desirable. Moreover, the young adults in Mashhad mainly preferred the following attributes: shape, solid/void pattern, dimension (height), material, facade orientation, water, and plant, respectively. Among the levels, straight, horizontal, large, transparent, solid, ponds, and horizontal were the most preferred levels of the attributes ‘shape, orientation, dimension (height), material, solid/void pattern, water, and plant’, respectively. Accordingly, ponds and water elements such as water pools, artificial lake, and others can be used instead of flowing water such as streams in designing leisure spaces. Regarding the preferences of this age group, plants, flowers, grass, shrubs, and short ornamental trees inducing an open and horizontal viewing angle can be used instead of tall trees. The findings also indicate that masses along the horizon are preferred because they create a horizontal viewing angle. These masses should cover a large area and contain no division in the body. Since transparent materials are more desirable than opaque ones, it is better to use transparent materials such as glass in the body of these masses. As presented in Table 1, straight lines are more preferred than curved lines; hence, straight lines can be used in the landscape, to form gardens and the lines around the pools and artificial lakes, build skylines, and divides lines in the body of masses, window frames, and others. In immediate decisions and in situations with the least budget, where it is not possible to use all the variables, the relative importance of the attributes can help to obtain maximum utility. Since Mashhad is a tourist destination with abundant tourist attractions, future studies can examine the priorities of the selected elements in different tourism functions in future studies. It is also possible to limit the scope of research and examine one attribute and more levels using the conjoint analysis method. For example, the attribute of trees with two broad-leaved and needle-leaved levels or different types of flowers and colors (warm/cold) can be examined. Future researchers can also limit the scope of the study to a specific time and investigate effective factors such as the color or intensity of artificial lights at night. Future studies can also examine the relationship between the selected attributes and demographic characteristics such as age, gender, and others. Alves, 2008, Brayne, 2015, Calatrava-requena, 2009, Conjoint Analysis, Lebeau, 2012, Ortegón-Cortázar and Royo-Vela, 2019, Ortegón-Cortázar and Royo-Vela, 2017, Pretty, 2006, Suhardi Maulan, 2018, Wang, 2019.
6.1 Limitations
Since a scoring method was used for data collection; hence, the respondents faced complexities in their judgments. They honestly responded to the seven questions on each of the 20 cards, and this was time-consuming and required a lot of patience and care. Moreover, the respondents had difficulty in distinguishing preferences for each stimulus.
Data availability statement
The original contributions presented in the study are included in the article/supplementary material, further inquiries can be directed to the corresponding author.
Author contributions
SH carried out the Literature review section and also methodology. MK participated in study design and statistical analysis. MF prepared the discussion and conclusion. SH drafted the manuscript. All authors read and approved the final manuscript.
Conflict of interest
The authors declare that the research was conducted in the absence of any commercial or financial relationships that could be construed as a potential conflict of interest.
Publisher’s note
All claims expressed in this article are solely those of the authors and do not necessarily represent those of their affiliated organizations, or those of the publisher, the editors and the reviewers. Any product that may be evaluated in this article, or claim that may be made by its manufacturer, is not guaranteed or endorsed by the publisher.
Supplementary material
The Supplementary Material for this article can be found online at: https://www.frontiersin.org/articles/10.3389/fbuil.2022.1066338/full#supplementary-material
References
Alizadeh, Sima, Sadeghi, Minoo, and Abdullah, Aldrin (2018). “ The appraisal model of teenagers ’ landscape preference based on demographic and personality characteristics. J. Des. build Environ. 18, 9–18. doi:10.22452/jdbe.vol18no1.2
Alves, Susana, Peter, A. A, Catharine, W. T, Takemi, S, Roger, B, and Adrian, V (2008). Prefer. older people Environ. attributes local parks use choice-based conjoint analysis. ” Facil. 26, 11–12. doi:10.1108/02632770810895705433–453
Amini, A. A., and Adibzadeh, Bahman (2020). The role of visual preferences in architecture views. J. Archit. Urbanism 44 (2), 122–127. doi:10.3846/jau.2020.12582
Azma, Sara, and Katanchi, Roxana (2017). “The effect of landscaping and building facades on perceptual-behavioral features of citizens. J. Hist. Cultur. art Res. 6, 264–281. doi:10.7596/taksad.v6i3.890
Barton, Jo, and Rogerson, Mike (2017). “The importance of greenspace for mental health.” BJPsych. International 14, 79–81. doi:10.1192/s2056474000002051
Bell, Simon (2004). Elements of visual design in the landscape. New York, NY, USA: Spon Press. ISBN0-415-32517-X ISBN 0-415-32518-8.(2eds
Bertamini, Marco, Letizia, Palumbo, Tamara, N. Gheorghes, and Mai, Galatsidas (2016). Do observers like curvature or do they dislike angularity. Br. J. Psychol. 107, 154–178. doi:10.1111/bjop.12132
Brajša, Ž. Andrje, Merkaš, Marina, and Iva, Šverko (2011). Quality of life and leisure activities: How do leisure activities contribute to subjective well-being. Soc. Indic. Res. 102, 81–91. doi:10.1007/s11205-010-9724-2
Caldwell, L. Linda (2005). Leisure and health: why is leisure therapeutic. Br. Juornal Guid. @counselling 33, 7–26. doi:10.1080/03069880412331335939
Conjoint Analysis, n.d. “QuestionPro: Conjoint analysis: Definition, example, types and model. https://www.questionpro.com/blog/what-is-conjoint-analysis/.Available at
Esmaili, Fatemeh, Charehjoo, Farzin, and Hoorijani, Nassim (2020). Analyzing and evaluating facades with a special approach to visual aesthetics using the grid method (case study: Enqelab street in sanandaj). Bagh-e Nazar 17 (82), 69–84. doi:10.22034/bagh.2019.165147.3934
Fernando, W., and Dilantha, G (2012). An international scientific open access journal to publish all facets of plants, their functions and interactions with the environment and other living organisms. Plants 1, 1–5. doi:10.3390/plants1010001
Grime, M., and Georg, W. (2016). D elphi Method. Wiley StatsRef, Stat. Ref. Online, 1–6. doi:10.1002/9781118445112.stat07879
Gubbels, J. S, Kremers, S. P. J, Droomers, M, Stronks, K., Hosman, C., et al. (2016). “The impact of greenery on physical activity and mental health of adolescent and adult residents of deprived neighborhoods: A longitudinal study. Health Place 40, 153–160. doi:10.1016/j.healthplace.2016.06.002
Hami, Ahmad, MoulaFazilah, F., and Suhardi Maulan, B. (2018). Public preferences toward shopping mall interior landscape design in Kuala Lumpur, Malaysia. Urban For. Urban Green. 30, 1–7. doi:10.1016/j.ufug.2017.12.019
Hami, Ahmad, Maulan Suhardi, Bin, Manohar, Mariapan, and Malekizadeh, Muhammad (2014). The relationship between landscape planting patterns and perceived safety in urban parks in Tabriz, Iran. Afr. J. Environ. Sci. Technol. 8 (2), 107–113. doi:10.5897/ajest2013.1486
Hardoy, Jorge E., Mitlin, Diana, and Satterthwaite, David (2013). “ Environmental Problems In An Urbanizing World: Finding Solutions In Cities In Africa Asia Lat. Am. Routledge, Oxfordshire, England, UK, https://books.google.com/books?hl=en&lr=&id=2TD_AQAAQBAJ&oi=fnd&pg=PP1&ots=_MIHFiCbLl&sig=fCilgAdANNuU6fHjvs8lm-WRG9k.
Joye, Yannick, Willems, Kim, Brengman., Malaika, and Wolf, Kathleen (2010). The effects of urban retail greenery on consumer experience: Reviewing the evidence from a restorative perspective. Urban For. Urban Green. 9 (1), 57–64. doi:10.1016/j.ufug.2009.10.001
Kashani, , and Hamedani, Mina (2015). “Comparative comparison of aesthetic parameters of urban space from the perspective of children and adults (Case study: Isfahan). motaleate shahri 4 (14), 19–30.
Kivanc, Mehmet (2013). “Visual quality assessment methods in landscape architecture studies,”. Editor Murat Özyavuz Adv. Landsc. Archit(London, UK.IntechOpen
Kondo, Michelle C., Fluehr, Jaime M., McKeon, Thomas, and Branas, Charles C. (2018). Urban green space and its impact on human health. Int. J. Environ. Res. Public Health 15 (3), 445. doi:10.3390/ijerph15030445
Kristjánsson, Margret G. (2017). “Greenery in the indoor retail environment the effect of greenery on environment perceptions, probable behavior, and willingness to spend. Lokav. Til. BS-gráðu Sálfraeðideild Heilbrigðisvísindasvið. https://skemman.is/handle/1946/27732.
Kua, E. H., and Sia, A. (2017). Green environment and mental health in the city,Mental Health and Illness in the City 445–464.
Laing, R., Davies, A., and Scott, S. (2005). in .“ Combining visualization with choice experimentation in the built environment.” Visualization in Landscape and Environmental Planning Technology and applications(Spon Press) Taylor \& Francis, London
Le, Dung (2019). Noel Scott, Susanne Becken, Rod M. Connolly“Tourists ’ aesthetic assessment of environmental changes, linking conservation planning to sustainable tourism development. J. Sustain. Tour. 27 (10), 1477–1494. doi:10.1080/09669582.2019.1632869
Lebeau, Kanneth, Joeri Van, Mierlo, Philippe, Lebeau, Olivier, Mairesse, and Cathy, Macharis (2012). “ A choice-based conjoint analysis on the market potential of PHEVs and BEVs in Flanders. World Electr. Veh. J. 5 (4), 871–880. doi:10.3390/wevj5040871
Mansfield, Louise, Dykin, Norma, and Kay, Tess (2020). “Theoretical and metodological trajectories on wellbeing in leisure studies. Leis. wellbeing 39 (1), 1–10. doi:10.1080/02614367.2020.1713195
Marsella, A. J. (1998). Urbanization, mental health, and social deviancy: A review of issues and research. Am. Psychol. 53, 624–634. doi:10.1037/0003-066X.53.6.624
Ortegón-Cortázar, L., and Royo-Vela, M. (2017). Attraction factors of shopping centers: Effects of design and eco-natural environment on intention to visit. Eur. J. Manag. Bus. Econ. 26 (2), 199–219. doi:10.1108/EJMBE-07-2017-012
Ortegón-Cortázar, L., and Royo-Vela, M. (2019). Nature in malls: Effects of a natural environment on the cognitive image, emotional response, and behaviors of visitors. Eur. Res. Manag. Bus. Econ. 25 (1), 38–47. doi:10.1016/j.iedeen.2018.08.001
Oyatoye, B. E. O., Otike-obaro, A. E., and Nkeiruka, G. (2016). (n.d.). Using conjoint analysis to study the factors important to university students in Nigeria when they select a laptop computer. Peer reviewed, University of Lagos, Nigeria, 1–16.
Paggi, M. E., and Jopp, D. (2016). C.HertzogThe importance of leisure activities in the relationship between physical health and well- being in a life span sample. karger 10007, 450–458. doi:10.1159/000444415
Parry-Jones, li William, (1990). Natural landscape, psychological well-being and mental health. Landsc. Res. 15 (2), 7–11. doi:10.1080/01426399008706309
Pazooki, S. (2011). The application of formal aesthetics by architects and interior architects according to their own ranking performances. Eastern Mediterranean University.İsmet İnönü Bulvarı, Gazimağusa semantic scholar, September
Pretty, , Prof, Jules, Jo, Peacock, Martin, Sellens, and Murray, Griffin (2006). “The mental and physical health outcomes of green exercise. Int. J. Environ. Health Res. 15 (5), 319–337. doi:10.1080/09603120500155963
Prieto, Alejandro, and Oldenhave, Mimi (2021). What makes a façade beautiful. J. Facade Des. Eng. 9 (2), 21–45. doi:10.7480/jfde.2021.2.5540
Prüss-Üstün, Annete, Bonjour, Sophie, and Corvalán, Carlos (2008). “ the impact of the environment on health by country: A meta-synthesis. Environ. Health, A Glob. Access Sci. Source 7 (1), 7. doi:10.1186/1476-069X-7-7
Purani, Keyoor, and Kumar, Deepak S. (2018). “ Exploring restorative potential of biophilic servicescapes. J. Serv. Mark. 32 (4), 414–429. doi:10.1108/jsm-03-2017-0101
Rosenbaum, Mark S., Contreras Ramirez, Germán, and Camino, Jaime Rivera (2018). A dose of nature and shopping: The restorative potential of biophilic lifestyle center designs. J. Retail. Consumer Serv. 40, 66–73. doi:10.1016/j.jretconser.2017.08.018
Rosenbaum, Mark S., Contreras Ramirez, Germán, and Otalora, Mauricio Losada (2016). “ The restorative potential of shopping malls. J. Retail. Consumer Serv. 31, 157–165. doi:10.1016/j.jretconser.2016.02.011
Sadeghi Reza, Ali, Pourjafar, Mohammadreza, Ali Akbar, Taghvaee, and Azadfallah, Parviz (2014). “ Explanation of environmental aesthetic factors of urban design. Curr. World Environ. 9 (2), 502–518. doi:10.12944/cwe.9.2.35
Sayadi, S., González-Roa, C., and Calatrava-Requena, J. (2009). Public preferences for landscape features: The case of agricultural landscape in mountainous Mediterranean areas. Land use policy 26 (2), 334–344. doi:10.1016/j.landusepol.2008.04.003
Schirpke, Uta, Tappeiner, Gottfried, Tasser, Erich, and Tappeiner, Ulrike (2019). Using conjoint analysis to gain deeper insights into aesthetic landscape preferences. Ecol. Indic. 96 (1), 202–212. doi:10.1016/j.ecolind.2018.09.001
Sevenant, Marjanne, and Antrop, Marc (2006).“Mapping cultural dimensions of the urbanised landscape for a stratified survey of landscape preference. A case study of Ghent, Belgium, Alfa Spectra STU. Planning Studies-Central European Journal of Architecture and Planning FA STU 10, 11–18. Book of Abstracts, 7. http://hdl.handle.net/1854/LU-363345
Srivastava, kalpana (2009). Urbanization and mental health. Ind. psychiatry 18 (2), 75–76. doi:10.4103/0972-6748.64028
Streimikiene, Dalia (2015). Environmental indicators for the assessment of quality of life. Intellect. Econ. 9 (1), 67–79. doi:10.1016/j.intele.2015.10.001
Surveyking, N. D. 2021. “A guide to conjoint analysis.” Available at: https://www.surveyking.com/create
Trivedi, Jitendra, Sareen, Himanshu, and Dhyani, Mohan (2008). “ rapid urbanization-its impact on mental health: A South asian perspective. indian J. psychiatry 50 (3), 161–165. https://www.ncbi.nlm.nih.gov/pmc/articles/pmc2738359/. doi:10.4103/0019-5545.43623
Wang, Ruoya, Marco, Helbich, Yao, Yao, Jinbao, Zhang, Penghua, Liu, Yuan, Yuan, et al. (2019). Urban greenery and mental wellbeing in adults: Cross-sectional mediation analyses on multiple pathways across different greenery measures. Environ. Res. 176, 108535. doi:10.1016/j.envres.2019.108535
Wang, Xinxin., and Rodiek, Susan (2019). Older adults’ preference for landscape features along urban park walkways in Nanjing, China. Int. J. Environ. Res. Public Health 16 (20), 3808. doi:10.3390/ijerph16203808
Keywords: environmental quality, preferences, leisure space, Mashhad, conjoint analysis
Citation: Hasanpour S, Khakzand M and Faizi M (2023) Improving quality of leisure environment considering youth preferences in Mashhad, Iran. Front. Built Environ. 8:1066338. doi: 10.3389/fbuil.2022.1066338
Received: 10 October 2022; Accepted: 12 December 2022;
Published: 04 January 2023.
Edited by:
Waqas Ahmed Mahar, Balochistan University of Information Technology, Engineering and Management Sciences, PakistanReviewed by:
Michele Rocca, University of Pisa, ItalyShama Anbrine, University of Engineering and Technology, Lahore, Pakistan
Copyright © 2023 Hasanpour, Khakzand and Faizi. This is an open-access article distributed under the terms of the Creative Commons Attribution License (CC BY). The use, distribution or reproduction in other forums is permitted, provided the original author(s) and the copyright owner(s) are credited and that the original publication in this journal is cited, in accordance with accepted academic practice. No use, distribution or reproduction is permitted which does not comply with these terms.
*Correspondence: Mehdi Khakzand, bWtoYWt6YW5kQGl1c3QuYWMuaXI=