 Ratnasai Kosuru
 Amlan Kumar Sengupta
- Department of Civil Engineering, Indian Institute of Technology Madras, Chennai, India
Performance based analysis under seismic loads using the finite element method for wall-type reinforced concrete (RC) members in buildings and in important structures like liquid retaining structures, nuclear containment structures, offshore concrete gravity structures etc., necessitates the understanding of the non-linear behaviour of the constituent membrane elements. The current orthotropic formulation of the softened membrane model (SMM) can be strictly used only when the reinforcement is symmetric to the principal axes of applied stresses. When the reinforcement is asymmetric, shear strain is generated due to the normal stresses in the principal axes of applied stresses, which is referred to as shear-extension coupling. An anisotropic formulation is required to capture the generated shear strain. The current study quantifies the shear strain due to asymmetry in reinforcement, by testing panels under biaxial tension-compression using a large-scale panel testing facility. A model for the shear strain is proposed based on the tests data. The paper presents the experimental programme, important test results and the modelling of shear strain. Expression developed for the shear strain can be incorporated in the solution algorithm of the SMM for improved prediction of the shear behaviour of a membrane element. This further aids in accurate prediction of the seismic performance of the important structures mentioned earlier.
1 Introduction
Shear walls in buildings and other wall-type members in liquid retaining structures, nuclear containment structures, offshore concrete gravity structures (CGS) are a part of the lateral load resisting system of the structure (Figure 1). They withstand loads generated due to wind, earthquakes and sea waves (for CGS). When these extreme loads act on the structure, the members may be stressed beyond their linear response. A performance based analysis using the finite element method (FEM) is used to analyse such a structure. Thus, modelling the non-linear behaviour of the wall-type members is necessary to generate the system response in the analysis of the structure.
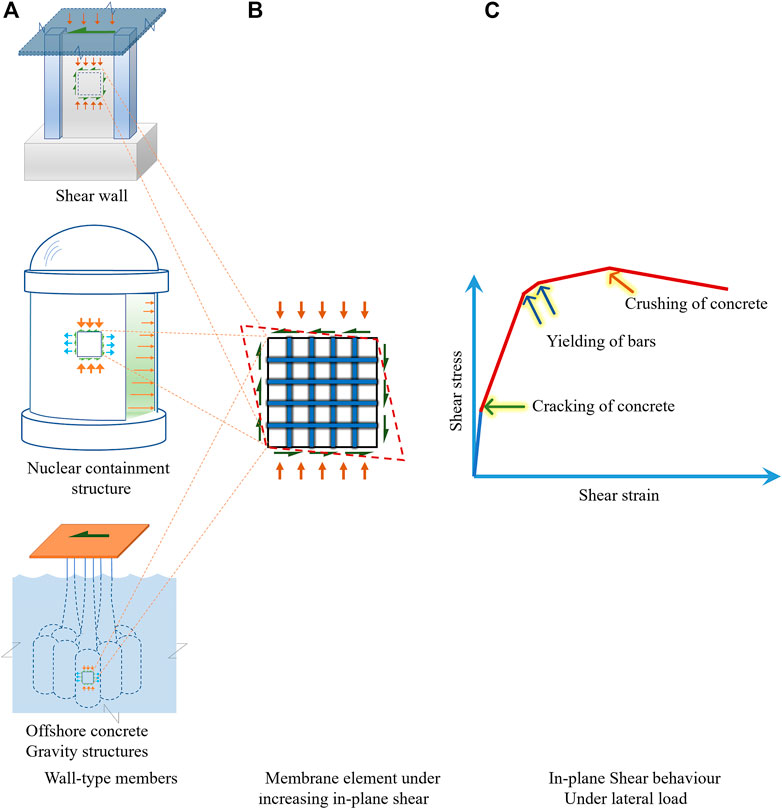
FIGURE 1. Shear behaviour in reinforced concrete structures. (A) Wall type members. (B) Membrane element under increasing in planeshear (C) In plane Shear behaviour under lateral load.
Two-dimensional (2D) membrane elements can be used to create a finite element computational model of a wall (Hsu, 1991). Establishing the post-cracking non-linear in-plane shear stress versus shear strain behaviour of a membrane element under lateral loads (Figure 1), in presence of in-plane normal stresses at the edges, can help in predicting the behaviour of the assemblage of the elements. The behaviour of a membrane element under increasing shear strain has three distinct stages: 1) initiation of cracking of concrete, 2) yielding of the reinforcing bars (rebar) in the two orthogonal directions and 3) initiation of crushing of the concrete. The Modified Compression Field Theory (MCFT) (Vecchio and Collins, 1986) and Softened Membrane Model (SMM) (Hsu and Zhu, 2002) can be used to accurately predict the response of an RC membrane element under increasing in-plane shear strain. The present study is based on the formulation of SMM.
Although after cracking, RC becomes discontinuous and heterogenous, it is treated as a continuous homogenous material with smeared properties, across the length of a membrane element. Two coordinate systems are defined to express the equations, as shown in Figure 2. First is the ℓ-t system, which represents the longitudinal (ℓ-) and transverse (t-) directions of the bars in the membrane element (Pang and Hsu, 1996). The stresses and strains in the formulation are expressed in this system. The applied normal stresses under service condition are
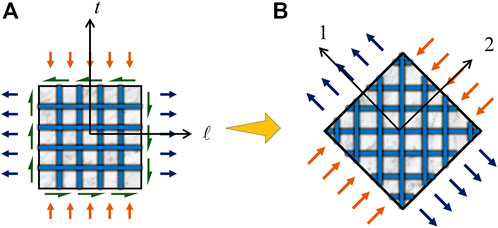
FIGURE 2. Membrane element (A) Applied stresses, (B) Principal stresses.
Second is the two to one system which represents the principal axes of in-plane stresses applied to the membrane element. The stresses and strains in cracked concrete are expressed in this system. In the presence of increasing in-plane shear in a membrane element, the state of principal stresses becomes biaxial tensile−compressive. To give importance to compression carried by concrete after cracking, the axis of compression (2-) is considered to be the leading axis with respect to the axis of tension (ℓ-). The inclination of the two to one system with respect to the ℓ-t system is denoted by
The SMM uses an orthotropic formulation to quantify the generated 2D strains. This is used to estimate the additional tensile strain generated due to compression in the orthogonal direction. This is analogous to the Poisson’s effect in a linear elastic element (Zhu 2000; Zhu and Hsu 2002). The orthotropic formulation necessities the assumption that the reinforcement grid be symmetric with respect to the principal axes of applied in-plane stresses. This particular assumption will be satisfied only when the reinforcement grid is aligned along the axes or is inclined at an angle 45°, with equal amount of reinforcement in the two directions (Hsu 1993; Hsu and Mo, 2010). However, if the reinforcement is placed asymmetric with respect to the principal axes of stresses (2–1), the axes do not remain as principal axes for the generated strains with increasing shear stress. Shear strain (
Though the SMM accurately predicts the response of symmetric elements, the shear strain (
In the present study, a 2D anisotropic formulation is introduced to quantify and subsequently model
2 Research significance
The formulation of SMM was generalised to incorporate the effect of shear‒extension coupling in a membrane element with asymmetry in reinforcement. An experimental programme was undertaken to quantify the effect of shear‒extension coupling in RC panels with asymmetry in reinforcement and tested under biaxial tension‒compression. Based on the tests, expression for
3 Softened membrane model
The SMM satisfies the principle of RC mechanics of equilibrium of forces and compatibility of strains in concrete and rebar. A summary of the equilibrium and compatibility equations, the constitutive models and the model for Poisson’s effect is provided for ready reference (Hsu and Zhu, 2002).
3.1 Equilibrium equations
The applied stresses in the ℓ-t coordinate system,
Here,
3.2 Compatibility equations
The strains in the ℓ-
It is to be noted that
3.3 Constitutive models
Based on extensive tests of panels under biaxial tension-compression, the following relationships were developed.
1) Concrete under compression (Belarbi (1991); Belarbi and Hsu (1995))
For
For
Here,
2) Concrete under tension (Belarbi and Hsu, 1994)
For
For
Here,
3) Concrete under shear (Zhu et al., 2001)
The shear stress and strain in concrete are related through the normal stresses and strains so as to use the previous constitutive relationships and avoid an empirical shear modulus.
4) Rebar under tension (Belarbi and Hsu, 1994)
The following expressions are in generic notations which are applicable for the bars along the ℓ- and t-directions.
For
For
Here,
3.4 Poisson’s effect
As mentioned before, in the SMM, the Poisson’s effect is considered through an orthotropic formulation of 2D strains in the two to one coordinate system. The uniaxial components of the strains (
Considering
The Hsu/Zhu ratio
For
For
Here,
The above equations are solved simultaneously to develop the shear stress versus strain behaviour of a membrane element.
4 Cases of asymmetry in membrane elements
In an orthotropic material, the principal axes of applied stresses coincide with the principal axes of generated strains. This is referred to as the principle of coaxiality. When the reinforcement is not symmetric, the principle of coaxiality is violated. Asymmetry of reinforcement can occur in two cases as demonstrated in Figure 3. Here, the principal axes of applied stresses (loading axes) (2–1) are shown as vertical and horizontal axes as is represented for a panel specimen under test. The reinforcement grid is shown inclined to the loading axes.
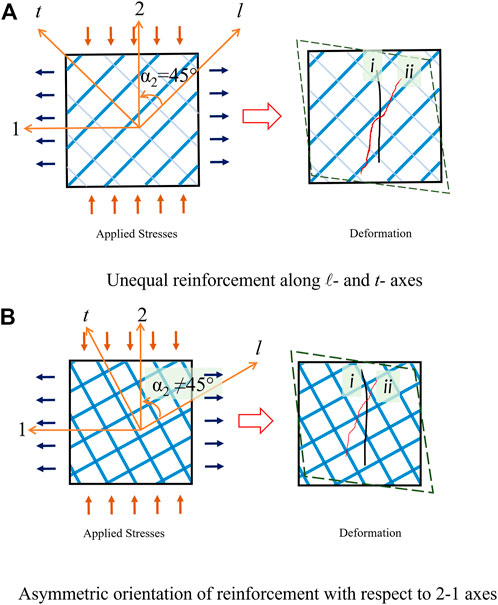
FIGURE 3. Cases of asymmetry in membrane elements. (A) Unequal reinforcement along ℓ- and t-axes. (B) Asymmetric orientation of reinforcement with respect to 2-1 axes.
Case 1)
Here, the longitudinal (ℓ-) and transverse (t-) bars are inclined at 45° to the directions of loading. However, when the amount of reinforcement along λ-axis is more than that along t-axis (
Case 2)
Here, the reinforcements along the ℓ- and t-directions are equal. However, when the reinforcement is asymmetrically inclined to the loading axes (with an angle other than 45°, within the range between 0° and 90°), the crack which initially forms along i tends to rotate and bisect the angle between the bars (marked as ii in Figure 3B).
The above two cases can occur either separately or simultaneously.
5 Model for shear-extension coupling
The limitation of SMM can be rectified by extending the orthotropic formulation to a generalised formulation of 2D strains. Kosuru and Sengupta (2018) proposed a 2D anisotropic formulation for an RC membrane element incorporating shear‒extension coupling coefficients, similar to that used in linear elastic composite materials (Robert, 1999).
Maintaining the convention of coordinate system of SMM (2- and one- are the leading and trailing axes, respectively) and noting that
Here,
The coefficients are defined as ratios of average strains, as follows.
To model the behaviour of an asymmetric membrane element precisely,
6 Experimental programme
An experimental programme was undertaken to evaluate the shear strain (
• Measures of nonlinearity based on instantaneous material stresses:
- Tensile stress in the bars, specifically the transition from pre-yield to post-yield condition. The normalised stress of the transverse bars whose amount is lower, is expressed as
- Compressive stress in concrete till crushing. The normalised stress is expressed as
• Measures of asymmetry of reinforcement:
- Difference in the amounts and grades of reinforcement in the two directions. This is expressed as the amount asymmetry index (
- Angle of inclination of the rebar grid with respect to the principal axes of applied stresses (
20 panels were tested to quantify
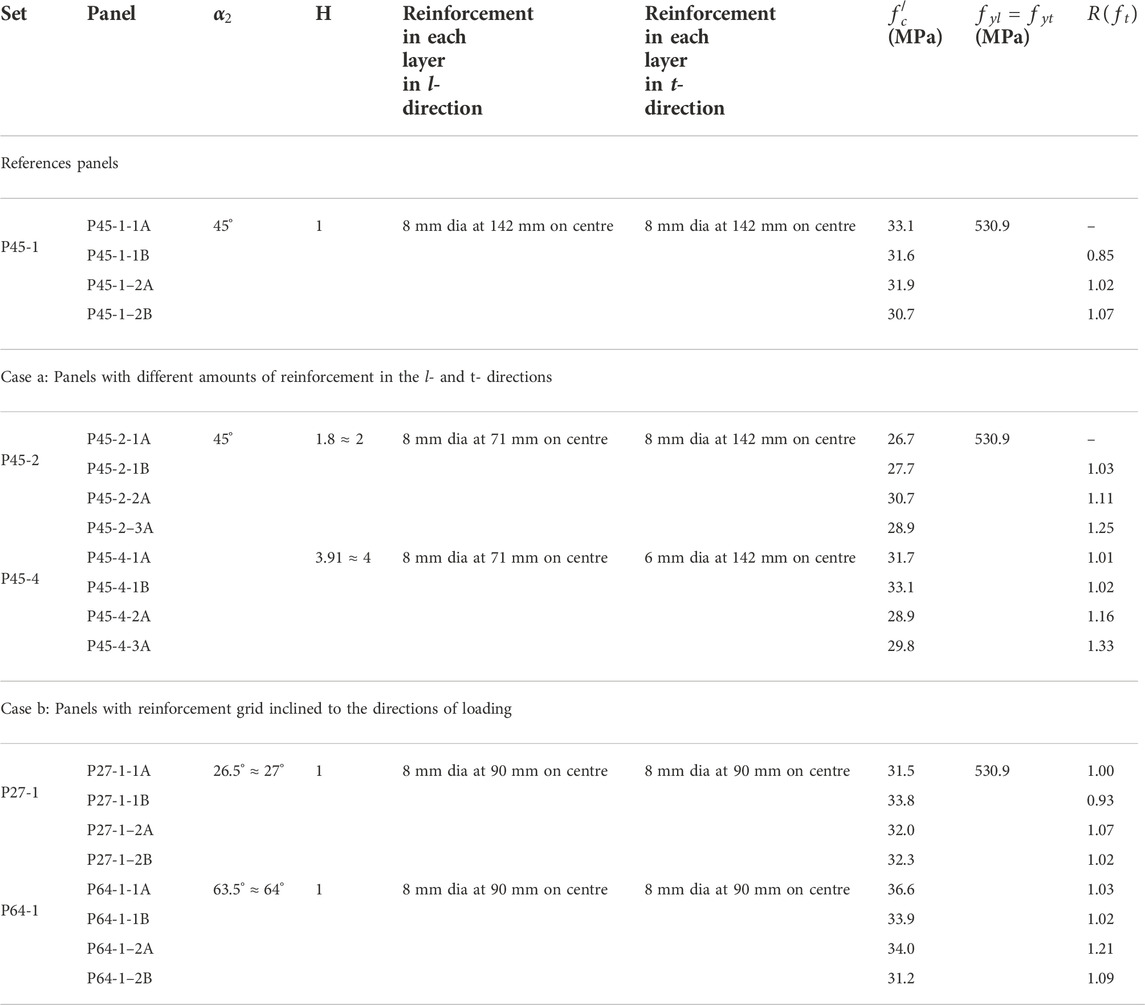
TABLE 1. - Details of test programme.
Orthotropic panels:
1) With reinforcement symmetric with respect to the axes of loading (equal amounts of reinforcement in the two directions and grid inclined at 45° to the axes). These formed the reference cases. (P45-1 set)
Anisotropic panels with unequal amounts of reinforcement in the two directions (grid inclined at 45°):
2) With ratios of amounts of reinforcement along λ- and t-directions approximately equal to 2.0. (P45-2 set)
3) With ratios of reinforcement in the two directions approximately equal to 4.0. (P45-4 set)
Anisotropic panels with grid inclined other than 45° (equal amounts of reinforcement in the two directions): Two cases were selected as follows.
4) With grid inclined at 27°. (P27-1 set)
5) With grid inclined at 64°. (P64-1 set)
Further tests can be conducted for panels with intermediate values of
6.1 Test setup
A biaxial panel testing facility is available at the Structural Engineering Laboratory of Indian Institute of Technology Madras to test RC panels under in-plane loading. Originally the facility was used to test prestressed panels under biaxial tension (Achyutha et al., 2000). This was subsequently reconfigured to conduct biaxial tension-compression tests (Sengupta et al., 2005). The facility consists of a horizontal self-equilibrating system made of frames and beams, supported on a fiber reinforced concrete floor. Loading of capacity 2000 kN can be applied in each horizontal direction. A schematic sketch of the setup is shown in Figure 4A. The components are:
1) Two stiff built-up beams and high strength tie rods of 32 mm diameter, for transferring tension. The beams are placed on heavy duty sliding bearings.
2) Two stiff reaction beams and high strength tie rods for self-equilibration, along the compression direction.
3) Eight load controlled hydraulic jacks, a set of four jacks in each direction, for applying compression or tension.
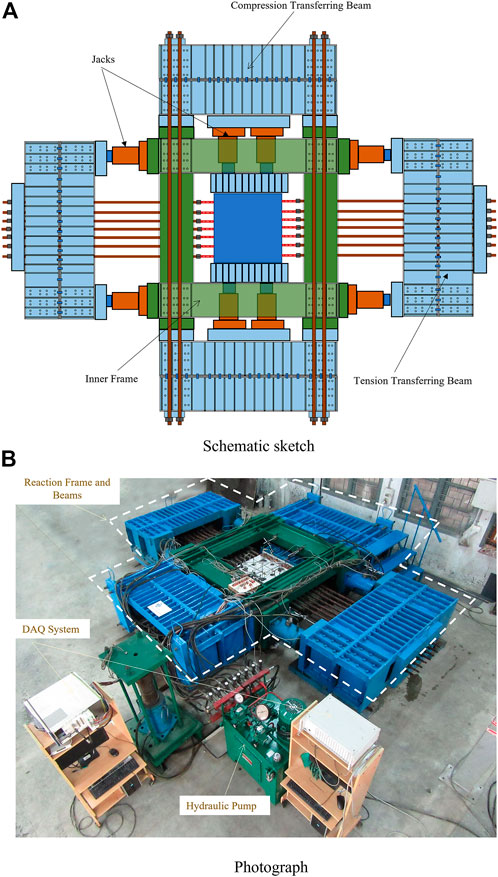
FIGURE 4. Test setup. (A) Schematic sketch. (B) Photograph.
The two sets of jacks are operated separately by two pumps, and two pairs of distribution blocks. The oil pressure from each pump is controlled by a hand operated lever. Each distribution block maintains approximately equal pressure in the four jacks connected to it. A view of the test setup is shown in Figure 4B.
6.2 Loading protocol
To investigate the effect of the chosen parameters, panel specimens were tested under sequential tension–compression. Although, increasing shear corresponds to proportional increase of tension and compression, a sequential tension–compression load path was selected to segregate the effects of tension (in terms of
6.3 Test specimens
All the panel specimens were of dimensions 800 mm × 800 mm × 100 mm. The horizontal dimensions were fixed based on the requirement that a minimum of three to four cracks form along the direction of tension within the test region. The thickness of 100 mm was selected such that the capacity of a panel with normal strength concrete, when tested under uniaxial compression, was less than the capacity of the testing facility i.e., 2000 kN. The reinforcement was provided in two layers and details are shown in Figure 5.
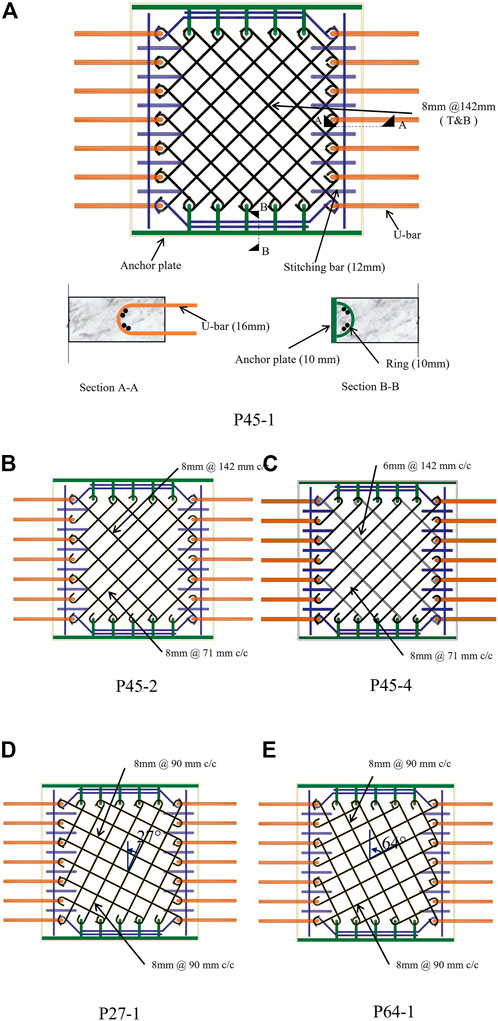
FIGURE 5. Reinforcement details of panel series. (A) P45-1 (B) P45-2 (C) P45-4 (D) P27-1 (E) P64-1.
The following features were added to avoid premature failures.
1) Stitching reinforcement was provided along the tension edges of the panel to avoid premature cracking of the edges.
2) A panel consisted of an anchorage plate along each compression edge for adequate anchorage of bars during the application of tension load.
3) The compression edges were also strengthened by placing confining steel plates along the edges, to avoid premature crushing of the edges during the application of compression.
4) Teflon sheets were placed at the compression edges to reduce friction.
6.4 Instrumentation
Load cells of capacity 500 kN were used to measure the tension load applied by the hydraulic jacks. As there was no gap to place load cells on the compression side, a hydraulic jack connected in series to the compression jacks was placed in a separate reaction standalone frame outside the panel tester, to measure the compression load.
Deformations were measured using linear variable differential transducers (LVDTs). LVDTs were fixed only on the top face of the panel. As the bottom face was inaccessible, no LVDT was placed below the panel. The average strains were calculated from the measured deformations. Arrangement of the LVDTs is shown in Figure 6. LVDTs one and two were used to record deformation along the compression direction (ε2). LVDTs three and four recorded the deformation along tension direction (ε1). LVDTs five to eight recorded the deformations along the diagonals to quantify the average shear strain (γ21).
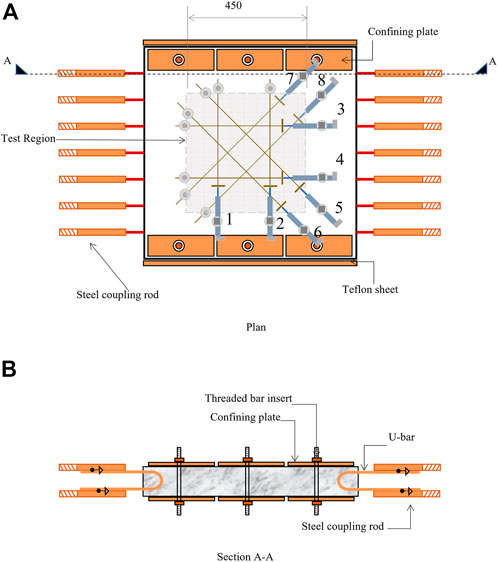
FIGURE 6. Instrumentation and additional features. (A) Plan. (B) Section A A.
7 Test results
7.1 Measurement of shear strain
Figure 7 shows a typical cracked specimen at different stages of the loading during the test. Panel P45-4-2 A is chosen for demonstration. It can be observed from the figure that the cracks which started to form perpendicular to the direction of tension rotate gradually to become parallel to the λ-direction with increasing load. This can be attributed to the higher stiffness in the λ-direction due to the presence of higher amount of reinforcement along the λ-axes.
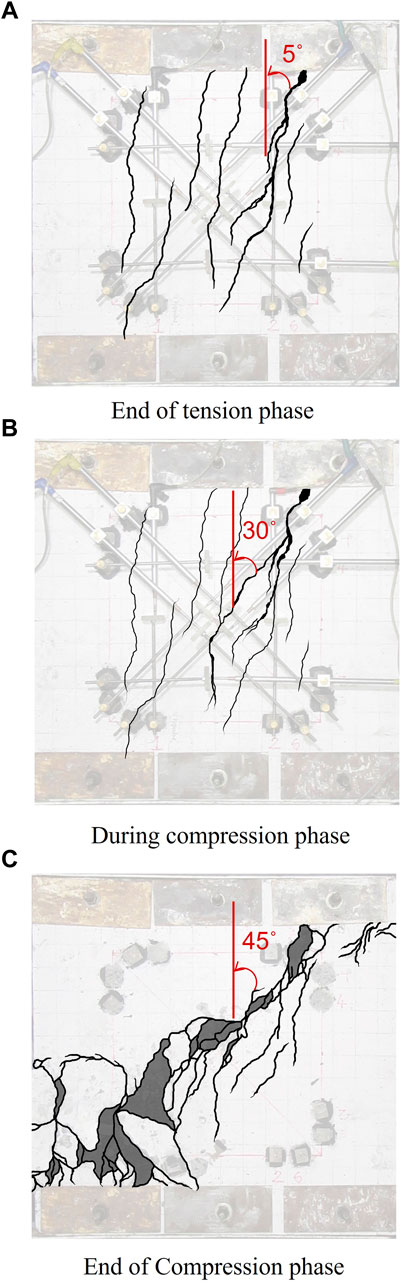
FIGURE 7. Panel P45-4-2 A at different stages of loading. (A) End of tension phase. (B) During compression phase. (C) End of Compression phase.
Shear strain
Here,
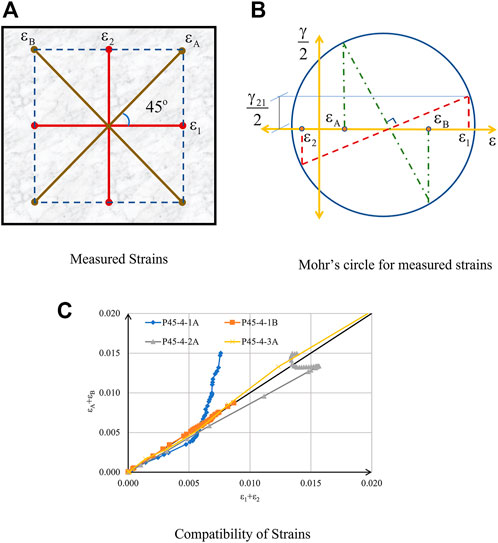
FIGURE 8. Mohr’s Compatibility check. (A) Measured Strains (B) Mohr’s circle for measured strains (C) Compatibility of Strains.
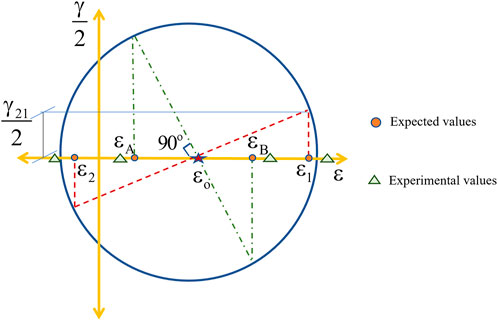
FIGURE 9. Schematic representation of best fit Mohr’s circle with RMS value of
7.2 Modelling of shear strain
Based on the method of separation of variables,
The other two parameters
7.2.1 Variation of shear strain with compressive stress in concrete
Figure 10 shows the variation of normalised
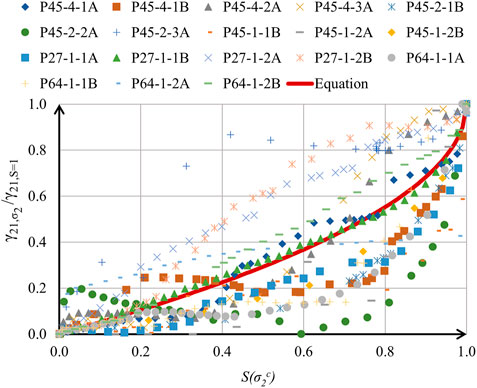
FIGURE 10. Normalised shear strain versus normalised compressive stress.
For
7.2.2 Variation of shear strain with tensile stress in reinforcement
The variation of normalised
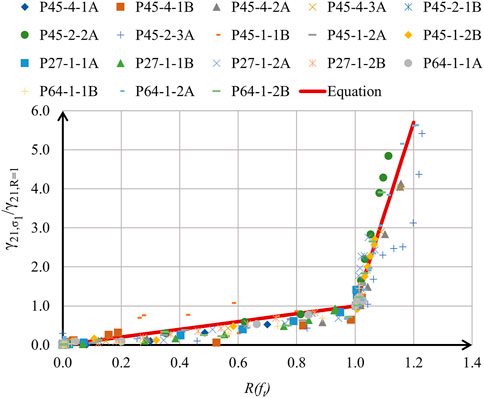
FIGURE 11. Normalised shear strain versus normalised tensile stress.
For
For
The maximum value of
7.2.3 Variation of shear strain with asymmetry in reinforcement
The magnitude of
The assumption is that there is no effect of load path, sequential or proportional. This is demonstrated in Figure 12.
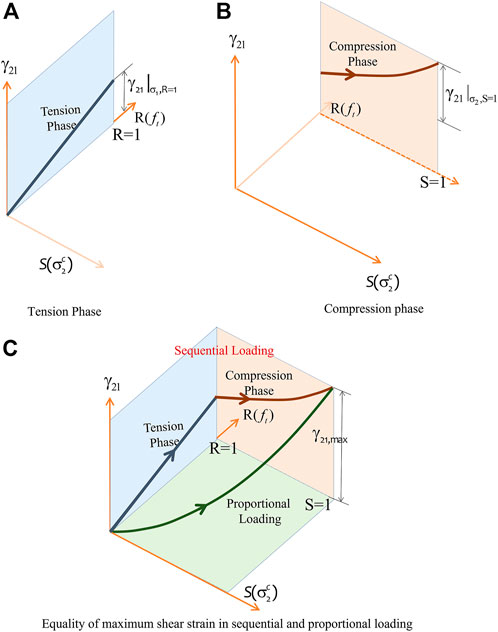
FIGURE 12. Schematic sketches showing maximum shear strain in load path. (A) Tension Phase. (B) Compression phase. (C) Equality of maximum shear strain in sequential and proportional loading.
Variation of the numerical value of
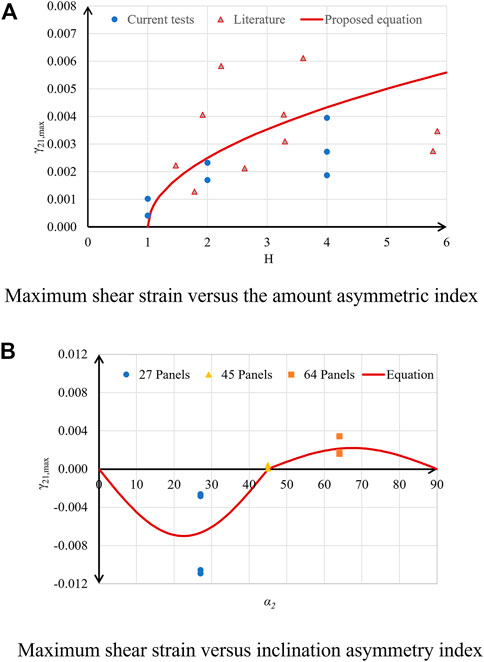
FIGURE 13. Maximum shear strain versus asymmetry. (A) Maximum shear strain versus the amount asymmetric index. (B) Maximum shear strain versus inclination asymmetry index.
For
In Figure 13A, maximum shear strain values for B-series panels (Pang and Hsu, 1995) and VB-series panels (Zhang and Hsu, 1998) are also shown along with panels from the present experimental programme. Though the panels from literature were tested under proportional loading, it can be seen that the equation proposed above predicts fairly for all the panels. This validates that sequential and proportional loading produce comparable values of maximum shear strain.
Variation of
For
For
The above equations can be substantiated by testing panels with intermediate values of
Equations 15–19 form a complete model for estimation of
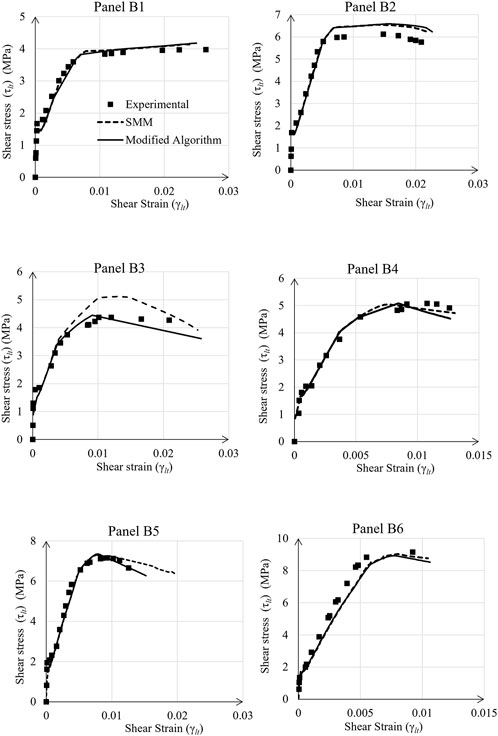
FIGURE 14. Shear stress (tlt) versus shear strain (γlt) of B series panels (Pang and Hsu,1995).
8 Conclusion
The conclusions from the present study are as follows.
1) The SMM utilises an orthotropic formulation of 2D strains to incorporate the Poisson’s effect in an RC membrane element. This does not consider rationally the shear strain generated in the principal axes of applied stresses (
2) Two cases of asymmetry were investigated: a) the amounts of reinforcement in the longitudinal and transverse directions are not equal, but the reinforcement grid is inclined at 45° to the principal axes of loading, b) the amounts of reinforcement are equal in both the directions, but the grid is not inclined at 45°.
3) The shear strain
4) A total of 20 panels were tested under biaxial tension-compression to quantify
5) The proposed model for
Data availability statement
The raw data supporting the conclusions of this article will be made available by the authors, without undue reservation.
Author contributions
Conceptualization, AS and RK; methodology, AS and RK; Experimental investigation, RK; analysis, AS and RK; writing—original draft preparation and editing, RK; writing—review, AS; visualization, RK; supervision, AS; project administration, AS. All authors have read and agreed to the published version of the manuscript.
Conflict of interest
The authors declare that the research was conducted in the absence of any commercial or financial relationships that could be construed as a potential conflict of interest.
Publisher’s note
All claims expressed in this article are solely those of the authors and do not necessarily represent those of their affiliated organizations, or those of the publisher, the editors and the reviewers. Any product that may be evaluated in this article, or claim that may be made by its manufacturer, is not guaranteed or endorsed by the publisher.
References
Achyutha, H., Paramasivam, V., Hari, K., Harsha, K. S., Koteswara Rao, P. C., and Sivathanu Pillai, C. (2000). An experimental test facility to carry out biaxial tension test on concrete panels. J. Struct. Eng. CSIR ‒ Struct. Eng. Res. Centre 27 (3), 165–168.
Bavukkatt, R. (2008). Modelling the deformation characteristics of reinforced concrete panels under biaxial tension-compression. PhD dissertation, Chennai, India: Department of Civil Engineering.
Belarbi, A., and Hsu, T. T. C. (1994). Constitutive laws of concrete in tension and reinforcing bars stiffened by concrete. Struct. J. Am. Concr. Inst. 91 (4), 465–474.
Belarbi, A., and Hsu, T. T. C. (1995). Constitutive laws of softened concrete in biaxial tension-compression. Struct. J. Am. Concr. Inst. 92 (5), 562–573.
Belarbi, A. (1991). Material laws of reinforced concrete in biaxial tension-compression. PhD dissertation, Houston: Department of Civil and Environmental Engineering.
Hsu, T. T. C., and Mo, Y. L. (2010). Unified theory of concrete structures. West Sussex, U.K: Wiley.
Hsu, T. T. C. (1991). Nonlinear analysis of concrete membrane elements. Struct. J. Am. Concr. Inst. 88 (5), 552–561.
Hsu, T. T. C., and Zhu, R. R. H. (2002). Softened membrane model for reinforced concrete elements in shear. ACI Struct. J. Am. Concr. Inst. 99 (4), 460–469.
Kosuru, R. S., and Sengupta, (2021). Effect of shear—extension coupling in a membrane element with asymmetry of reinforcement”, Proceedings of the, 17th world conference in earthquake engineering, organised by Japan Association for Earthquake Engineering (17WCEE), Sendai, Japan. 21 October 2021.
Kosuru, R. S., and Sengupta, A. K. (2018). Proceedings 11th structural engineering convention. Kolkata: Jadavpur University. 19.
Kosuru, R. S., and Sengupta, A. K. (2022). Incorporation of Shear−Extension coupling in softened membrane model. Journal of structural engineering. 12. 1-10.
Pang, X. B., and Hsu, T. T. C. (1995). Behaviour of reinforced concrete membrane elements in shear. Struct. J. ACI 92 (6), 665–679.
Pang, X. B., and Hsu, T. T. C. (1996). Fixed-angle softened-truss model for reinforced concrete. Struct. J. Am. Concr. Inst. 93 (2), 197–207.
Sengupta, A. K., and Belarbi, A. (2001). Modeling effect of biaxial stresses on average stress-strain relationship of reinforcing bar in reinforced concrete panels. Struct. J. Am. Concr. Inst. 98 (5), 629–637.
Sengupta, A. K., Perla, R. M. R., and Jacob, B. (2005). Testing RC panels under in-plane biaxial loads. Indian Concr. J. 79 (6), 51–56.
Vecchio, F. J., and Collins, M. P. (1986). The modified compression-field theory for reinforced concrete elements subjected to shear. ACI Struct. J. 83 (2), 219–231.
Zhang, L. X., and Hsu, T. T. C. (1998). Behavior and analysis of 100 MPa concrete membrane elements. J. Struct. Eng. (N. Y. N. Y). 124 (1), 24–34. doi:10.1061/(asce)0733-9445(1998)124:1(24)
Zhu, R. R. H., Hsu, T. T. C., and Lee, J. Y. (2001). Rational shear modulus for smeared crack analysis of reinforced concrete. Struct. J. Am. Concr. Inst. 98 (4), 443–450.
Keywords: anisotropic formulation, biaxial stresses, membrane element, non-linear behaviour, reinforced concrete, shear-extension coupling, shear strain
Citation: Kosuru R and Sengupta AK (2022) Experimental investigation of shear-extension coupling effect in anisotropic reinforced concrete membrane elements. Front. Built Environ. 8:1054099. doi: 10.3389/fbuil.2022.1054099
Received: 26 September 2022; Accepted: 21 November 2022;
Published: 05 December 2022.
Edited by:
Putul Haldar, Indian Institute of Technology Ropar, IndiaReviewed by:
George Papazafeiropoulos, National Technical University of Athens, GreeceEmanuele Reccia, University of Cagliari, Italy
Copyright © 2022 Kosuru and Sengupta. This is an open-access article distributed under the terms of the Creative Commons Attribution License (CC BY). The use, distribution or reproduction in other forums is permitted, provided the original author(s) and the copyright owner(s) are credited and that the original publication in this journal is cited, in accordance with accepted academic practice. No use, distribution or reproduction is permitted which does not comply with these terms.
*Correspondence: Ratnasai Kosuru, cmF0bmFzYWkyOTA0QGdtYWlsLmNvbQ==