 Junhui Huang
 Sakdirat Kaewunruen
95% of researchers rate our articles as excellent or good
Learn more about the work of our research integrity team to safeguard the quality of each article we publish.
Find out more
OPINION article
Front. Built Environ. , 24 October 2022
Sec. Transportation and Transit Systems
Volume 8 - 2022 | https://doi.org/10.3389/fbuil.2022.1034433
This article is part of the Research Topic Data Sciences in Transportation and Transit Systems View all 5 articles
The “ride comfort” of passengers generally refers to their feelings or perceptions of the compounded motions and vibrations experienced by a running train (Suzuki, 1998). There are two major approaches to improving ride comfort. The first focuses on vibration abatement techniques via an optimal driving pattern with additional train technologies to moderate train body vibrations. The other focuses on passengers’ onboard perception of various environmental factors (Chen et al., 2020), such as if surrounded passengers follow the etiquette or not, seat ergonomics, service attitude of train attendants, air quality, temperature, and catering. Passenger satisfaction also relates to travel time spent, as studied from over 80,000 survey responses (Lyons et al., 2016). These survey results showed that the time traveled by rail passengers in Great Britain had increased from 2004 to 2010 due to a shift from paper-based materials accompanying passengers to digital alternatives. However, passengers’ satisfaction with their onboard experience had decreased due to increased crowding. Many researchers have extensively examined the various aspects that can affect passengers’ ride comfort.
ISO 2631 IOS (1997), UIC 513 UIC (1994), and the Sperling index (Sperling and Betzhold, 1956) are the three most widely used vibration-based standards for assessing ride comfort and train body motion indexes. ISO 2631 and UIC 513 adopt vibrations in three directions, while the Sperling index relies on vertical or lateral vibrations. Sufficient expertise is required to execute rigorous data collection and determine those standardized indexes. Therefore, our recent research is devoted to developing alternative automation that integrates data sensing and ride-comfort level determination on a mobile phone using an advanced machine learning (ML) model (Huang and Kaewunruen, 2022). To enrich research in this domain for real-world applications (Huang and Kaewunruen, 2022), we further enhanced our algorithm to account for passenger ride comfort and angular motions—which ISO 2631 considers important for tilting trains IOS (1997),—and to showcase its new capabilities on a newly built underground railway line—the Elizabeth Line (or Crossrail) in London. To explore these new advances, three more features—including angular motions in three-dimensional space—were also employed to generate new capabilities for a robust and explainable AI model. These new capabilities are essential not only for passenger ride comfort; they are also critical to the operational safety of train–track movement and the wheel–rail interface.
Tilt trains have been introduced to increase speed on curved rail sections by tilting inwards to offset the centrifugal forces. Tilting also introduces rotation of the rolling stocks, leading to angular motions: yaw, pitch, and roll. This type of motion (or rapid change of rolling behaviours) often results in passengers and crew experiencing nausea, headache, and dizziness. Rapid and severe changes in rolling behaviours could potentially cause train derailments. Researchers have used questionnaires to evaluate the impact of the train-body tilting on ride comfort, finding that conventional methods might consider an unsatisfying comfort level satisfying. With some follow-up evaluations, researchers have concluded that an alternative that uses angular velocity as an index is desirable (Suzuki, 1998). Figure 1A depicts the directions used by the accelerometer and gyroscope. Our research found that a gyroscope embedded in mobile phones can accurately sense rotations, whereas an accelerometer only monitors linear motions. Therefore, we extended our research to enable our advanced AI model (Kaewunruen et al., 2016; Huang and Kaewunruen, 2022) to assess ride quality in both linear and rolling motions.
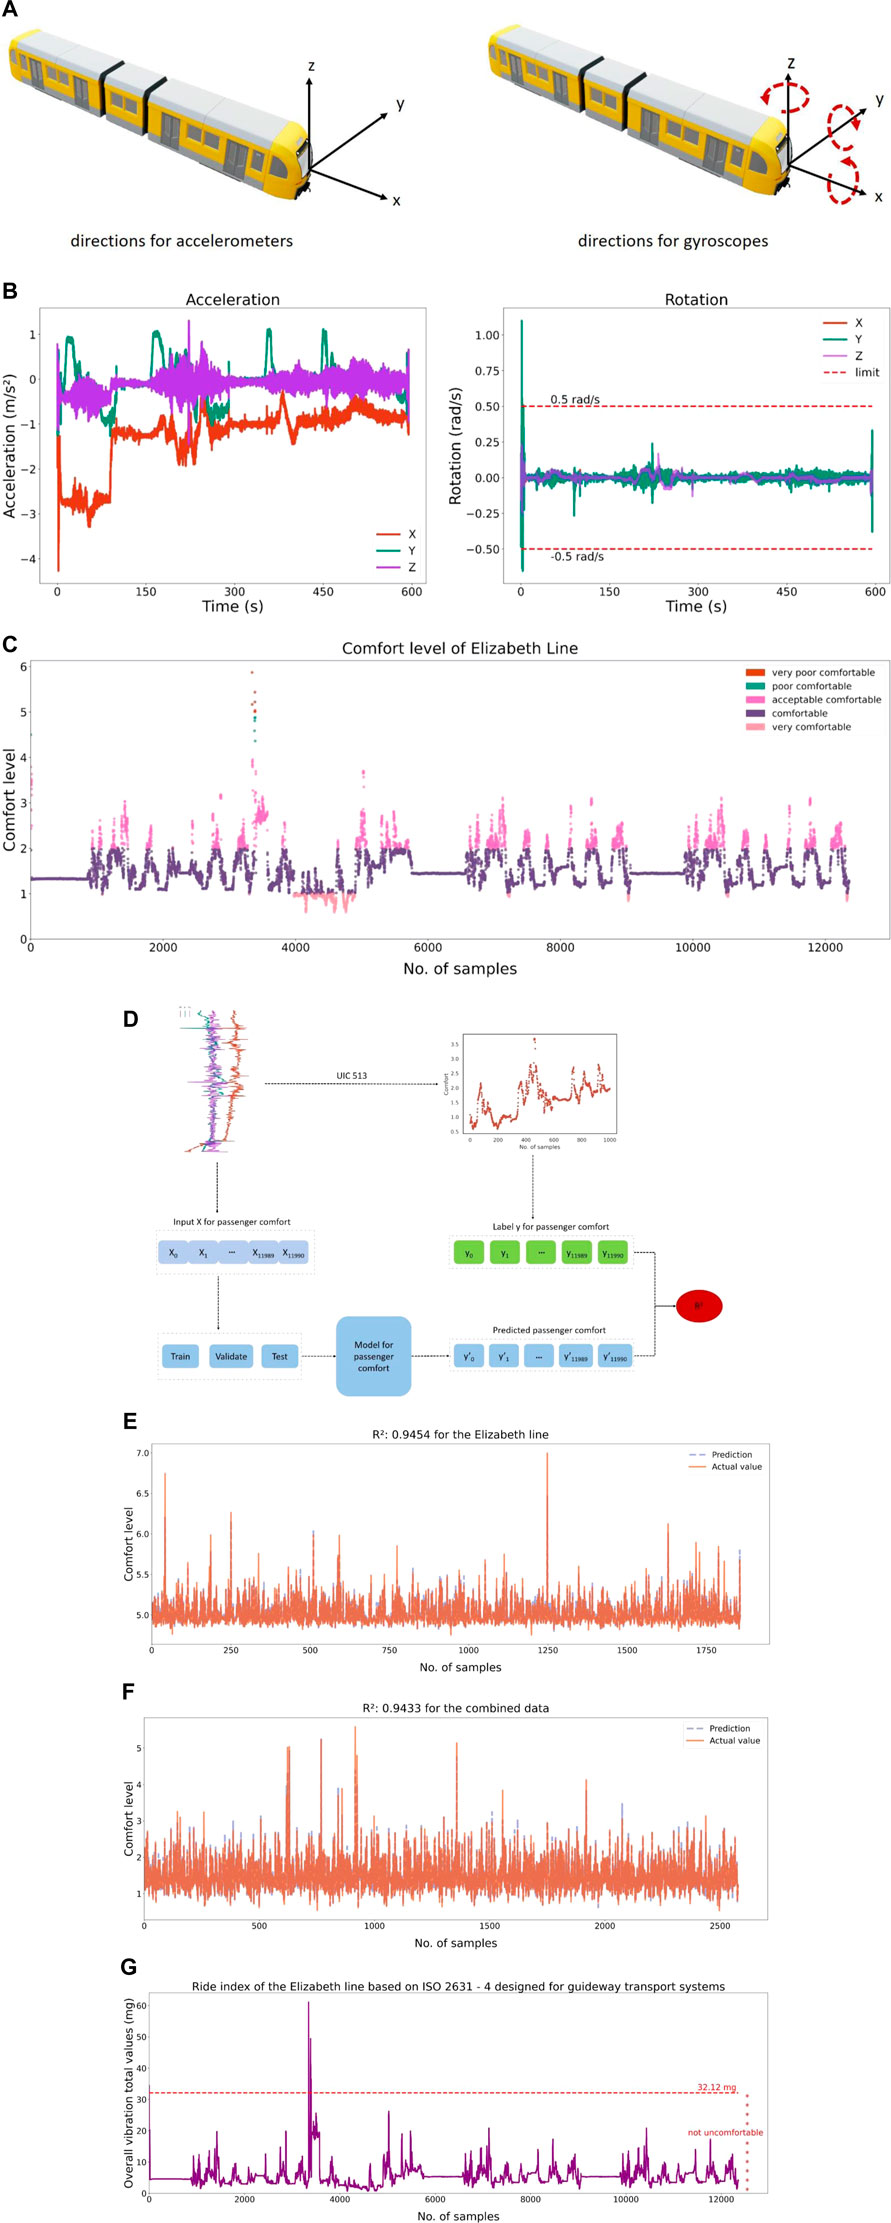
FIGURE 1. (Continued).
Figure 1B illustrates the acceleration and rotations of the Elizabeth Line. As observed from the magnitude of the accelerations, the vertical z-axis accelerations gather around 0 m/s2, while the longitudinal x-axis and lateral y-axis directions have more severe accelerations. The magnitude of the rotations commences at the peak of 1.2 rad/s and plummets within the limit of 0.5 rad/s, which may be caused by the lack of the tilting section. The rotations plot agrees with Figure 1C, revealing that most of the comfort levels are within 1–4—“good” and “acceptable” comfort. A smaller incidence for “poor” and “inferior” comfort can also be observed in Figure 1C.
Figure 1D provides an overarching framework for procuring input and labels for the model, based on the dataset. The transient comfort index in every 5s is determined using UIC 513 based on the three-axis accelerations. In the new AI model, frequency weighting has been used to contour the raw acceleration to the feelings of human beings (more details are available in Huang and Kaewunruen (2022)). The same techniques, as shown in Huang and Kaewunruen (2022) for 98% of R2, are utilized with hyper-parameter tuning to twist the AI model to the new datasets from the Elizabeth Line. Accordingly, Figure 1E reveals a 94.54% R2 by comparing actual values and predictions. Our AI model predicts well the train ride quality with additional capabilities for both ride comfort and angular motions. Figure 1F provides the model performance using the datasets, assimilating the data from the Elizabeth Line and datasets from Huang and Kaewunruen (2022). A very consistent pattern and satisfactory performance can be seen in Figure 1F. Figure 1G gives overall vibrations in X, Y, and X directions with a limit of not uncomfortable defined by ISO 2631. A consistent ride comfort level from Figures 1C,G can be observed, which implies that the Elizabeth Line can deliver a satisfying comfort level in the tested section according to either UIC 513 or ISO 2631.
Different countries use various equations to determine train-ride quality assessments; however, all are based on vibrations to evaluate ride comfort for train passengers. Our recent study revealed a reliable relationship between different mainstream methods for evaluating ride comforts, such as Sperling’s method, the r.m.s-based method proposed in ISO 2631, and the statistical method used by UIC 513 (Azzoug and Kaewunruen, 2017). The comparison between Figures 1C and G demonstrates the strong correlation between UIC 513 and ISO 2631. Ding et al. (2021) evaluated the two standards in several different high-speed train lines and their conclusions agreed with the correlation. This finding implies correlations between those methods and underpins the feasibility of our AI model for automation using any specific standard in any different country. The present study raises the possibility that our new AI model can embrace crowd-sensing and decentralize the live monitoring of train-ride quality in three-dimensional space (considering both linear and rolling acceleration), as clearly demonstrated in Figures 1E and F. This study has also demonstrated the ML model’s robustness for application to surface and underground trains. By data assimilation and automated retraining, the AI model can fully address and determine the ride quality, taking into account both ride comfort and rolling motions.
JH and SK developed the concept; JH conducted data collection, curation, and data analysis. All authors contributed to the manuscript; SK reviewed the manuscript. All authors wrote the manuscript. All authors have read and agree to the published version of the manuscript.
The authors are grateful to the European Commission for the financial sponsorship of the H2020-RISE Project No. 691135 RISEN: Rail Infrastructure Systems Engineering Network, which enables a global research network that tackles the substantial challenge of railway infrastructure resilience and advanced sensing in extreme environments (www.risen2rail.eu) (Kaewunruen et al., 2016).
The authors declare that the research was conducted in the absence of any commercial or financial relationships that could be construed as a potential conflict of interest.
All claims expressed in this article are solely those of the authors and do not necessarily represent those of their affiliated organizations, or those of the publisher, the editors, and the reviewers. Any product that may be evaluated in this article, or claim that may be made by its manufacturer, is not guaranteed or endorsed by the publisher.
Azzoug, A., and Kaewunruen, S. (2017). RideComfort: A development of crowdsourcing smartphones in measuring train ride quality. Front. Built Environ. 3, 3. doi:10.3389/fbuil.2017.00003
Chen, Z.-S., Liu, X. L., Rodriguez, R. M., Wang, X. J., Chin, K. S., Tsui, K. L., et al. (2020). Identifying and prioritizing factors affecting in-cabin passenger comfort on high-speed rail in China: A fuzzy-based linguistic approach. Appl. Soft Comput. 95, 106558. doi:10.1016/j.asoc.2020.106558
Ding, T., Lin, J., and Chen, X. (2021). “Comfort evaluation and analysis of high-speed train,” in Journal of physics: Conference series (Bristol: IOP Publishing).
Huang, J., and Kaewunruen, S. (2022). Evaluation of railway passenger comfort with machine learning. IEEE Access 10, 2372–2381. doi:10.1109/access.2021.3139465
IOS (1997). Shock—evaluation of human exposure to whole-body vibration—part 1: General requirements. Geneva, Switzerland: International Organization for Standardization, 2631–1.
Kaewunruen, S., Sussman, J. M., and Matsumoto, A. (2016). Grand challenges in transportation and Transit Systems. Front. Built Environ. 2, 4. doi:10.3389/fbuil.2016.00004
Lyons, G., Jain, J., and Weir, I. (2016). Changing times–A decade of empirical insight into the experience of rail passengers in Great Britain. J. Transp. Geogr. 57, 94–104. doi:10.1016/j.jtrangeo.2016.10.003
Sperling, E., and Betzhold, C. (1956). Beitrag zur beurteilung des fahrkomforts in schienenfahrzeugen. Glas. Ann. 80, 314–320.
Suzuki, H. (1998). Research trends on riding comfort evaluation in Japan. Proc. Institution Mech. Eng. Part F J. Rail Rapid Transit 212 (1), 61–72. doi:10.1243/0954409981530689
Keywords: rail passenger comfort, train, underground, machine learning, Elizabeth Line, Crossrail
Citation: Huang J and Kaewunruen S (2022) Train-ride quality evaluation of the Elizabeth Line using machine learning. Front. Built Environ. 8:1034433. doi: 10.3389/fbuil.2022.1034433
Received: 01 September 2022; Accepted: 10 October 2022;
Published: 24 October 2022.
Edited by:
Suraparb Keawsawasvong, Thammasat University, ThailandReviewed by:
Van Qui Lai, Ho Chi Minh City University of Technology, VietnamCopyright © 2022 Huang and Kaewunruen. This is an open-access article distributed under the terms of the Creative Commons Attribution License (CC BY). The use, distribution or reproduction in other forums is permitted, provided the original author(s) and the copyright owner(s) are credited and that the original publication in this journal is cited, in accordance with accepted academic practice. No use, distribution or reproduction is permitted which does not comply with these terms.
*Correspondence: Sakdirat Kaewunruen, cy5rYWV3dW5ydWVuQGJoYW0uYWMudWs=
Disclaimer: All claims expressed in this article are solely those of the authors and do not necessarily represent those of their affiliated organizations, or those of the publisher, the editors and the reviewers. Any product that may be evaluated in this article or claim that may be made by its manufacturer is not guaranteed or endorsed by the publisher.
Research integrity at Frontiers
Learn more about the work of our research integrity team to safeguard the quality of each article we publish.