
94% of researchers rate our articles as excellent or good
Learn more about the work of our research integrity team to safeguard the quality of each article we publish.
Find out more
ORIGINAL RESEARCH article
Front. Built Environ., 01 November 2022
Sec. Earthquake Engineering
Volume 8 - 2022 | https://doi.org/10.3389/fbuil.2022.1032643
 Carlos Zúñiga-Olvera1
 David Valverde-Burneo1
 Natividad Garcia-Troncoso1*
 Christian E. Silva2,3
 Daniel Gomez4
 Dan V. Bompa5
This study presents a comparative analysis between two structural design ideas in the Ecuadorian construction market: hidden vs. drop beams. Due to its location in a high seismic zone, structural design considerations in Ecuador must be made with care. Therefore, to offer improved strength to seismic forces, special moment frames are the most common structural system used. However, hidden beams are popular in low story buildings because of a notion of a cheaper system, despite evidence of collapse during earthquake events. In this study we look at special moment frames using hidden type and drop type beams, in terms of cost, structural, and seismic performance. A total of 32 structural models are analyzed, out of which 16 are models of buildings containing hidden beams and another 16 are drop beams. Linear and nonlinear static analysis, nonlinear local analysis, and moment curvature analysis of the modeled structures are performed to compare their seismic behavior. The structural design is carried out based on linear static analysis to obtain the total cost of all models. Additionally, a nonlinear static pushover analysis was conducted to assess roof displacement. The evidence shows that when using hidden beams, roof displacement is 20%–55% higher than when using drop beams, despite the nearly negligible differences in terms of cost. The evidence also shows that structures with drop beams, have a 22%–28% higher nominal flexural moment than structures with hidden beams, while achieving a 27%–31% higher curvature ductility. This research shows evidence on how structures with drop beams have a better behavior in high seismic risk zones when compared to structures with hidden beams, whose use although allowed, should be limited.
Ecuador is a country located in the Pacific Ring of Fire, considered a high seismic hazard zone by Beauval et al. (2018). Therefore, construction techniques in these regions need to accommodate strength and resistance properties accordingly. Amongst the recommended structural systems, special moment frames are commonly utilized systems, mainly because of the current Ecuadorian Construction Code (NEC) includes them as an allowable method for seismic resisting structures, (NEC, 2014). However, there are two special moment-frame systems, described in NEC: 1) Special moment frame with drop beams, and 2) Special moment frame with hidden beams. These systems are commonly used on five to 12-story buildings in Ecuador, and both are allowed without any additional consideration according to Lanning et al. (2016).
Despite being a topic of significant importance in earthquake engineering, the body of literature is rather limited when searching for related studies comparing structures using dropped vs. hidden special moment frames. Some research studies on this topic are focused on feasibility analyses using special moment frames with hidden beams, leaning towards limiting this type of system and recommending the use of drop beams instead. Navyashree and Sahana (2014) compared interstory drifts of hidden and drop beam systems and demonstrated that the former could present up to three times more drift than systems with the latter. According to Benavent-Climent (2005), Chira et al. (2022), this is largely expected as hidden beam floor systems have relatively low bending stiffness, lateral stiffness, and energy dissipation capacity under monotonic and cyclic loads compared with drop beam frames. Samir (2021) conducted a comparative study between solid slabs on drop beams, ribbed slabs on shallow (hidden) beams, and flat plates with or without drop panels, using performance-based analysis for medium-rise buildings. Some of his analyses included static, nonlinear, pushover, and dynamic, and he concluded that models with drop beams offer the maximum mechanical characteristics for use in seismic areas. Özbek et al. (2020) reported an experimental study where the strength and deflection of hidden and T-beams were compared. Here, hidden beams reached their yielding strength after surpassing the deflection limit. It was also concluded that hidden beams could never achieve the same strength offered by a drop beam. Regarding the differences between frames with hidden beams and flat slab systems, Samir and Diab (2014) provided evidence that there are no significant differences between both systems.
According to the Ecuadorian Construction Code, the response modification factor, R, for hidden beams is 5, which is considered a limited ductility system. Conversely, the R factor for drop beams has a value of 8. Therefore, during the design process, hidden beams are designed such that they must overcome higher seismic forces compared to those affecting drop beams (NEC, 2014; Rovello and Andrea, 2014). Interstory drift, concrete strength and R factor are important parameters considered in some seismic vulnerability index methodologies in reinforced concrete buildings, (Kassem et al., 2022a; Kassem et al., 2022b). The response modification factors for these systems are consistent with those ductility levels mentioned above. During a seismic event, hidden beam systems are expected to require bigger columns than drop beam systems, thus providing global stiffness and reducing interstory drifts. However, the depth of drop beams is limited by architectural design. On the contrary, the depth of hidden beams is limited by the slab depth within the system. Thus, practicing engineers in Ecuador usually impose this dimension between 0.2 and 0.25 m. Limited by this condition, the only way to match the stiffness of a hidden beam system with a drop beam system is by increasing the beam width.
Regarding the design methodology, the load resistance factor design method (LRFD) is used to obtain an adequate nominal flexural moment. Hidden beams have a low depth and little lever arm. Therefore, these beams will require a greater amount of rebar to obtain the same nominal flexural moment as drop beams. By having a greater amount of reinforcement ratio and low depth, the ductility decreases. This is the main reason to consider hidden beam systems as having limited ductility structural capacity, and why they should be specially treated in seismic zones (Aguiar, 2003).
As shown above, there are a limited number of numerical studies comparatively investigating the performance of hidden and drop beam special moment frames (Navyashree and Sahana, 2014; Özbek et al., 2020; Samir, 2021). These are either different loading conditions and specific seismic design requirements not representative for the Ecuadorian seismic hazard risk. Moreover, as noted above some studies indicate a limited difference in response between systems, (Samir and Diab, 2014), whilst other investigations, (Navyashree and Sahana, 2014), point to three-fold increase in drift for hidden beam systems compared with their counterparts. Considering the lack of comparative detailed studies on such frame systems under seismic loading as well as contrasting remarks in the literature, there is a need to carry out comparative assessments in the region-specific guidelines. The contribution of this paper is to provide an understanding of structural system selection and design in a regional context, with the main outcomes suitable for other regions with similar seismic action. Very few studies compare models of hidden and drop beams in terms of costs and their performance in earthquakes, which motivates this research study. The results provide evidence of differences between both structural systems in terms of story drift, construction costs, performance point, and ductility and which one is the best option to consider in high risk seismic zones.
A 3D model of a 3-story building is proposed herein to compare hidden vs. drop beam systems. Plan irregularities have not been considered; thus, they do not impact the global results by adding torsional forces. Seismic force is assumed only with 5% of accidental torsion to evaluate the translation behavior of each model. Elevation irregularities are not considered to minimize impact to interstory drift results (NEC, 2014; NEC-SE-HM, 2014).
Two cases, one with a hidden beam and one with a drop beam moment frame system, are shown in Figure 1. These systems are used on a 3-story building model, with 3 m height between floors, resulting in a 9 m high building. The plan configuration has a regular grid in both directions, with three spans of 4.5 m between axes. To compare both structural systems, the models are made with different cross-sections of the structural elements, both in beams and columns. The columns have squared cross-sections, and the beams have different sections depending on the beam type. Hidden type beams are limited in depth by the thickness of the slab; therefore, this type of beam only increases its width by 0.05 m (Table 2). Regarding drop beams, their depth is increased by 5 cm (Table 1).
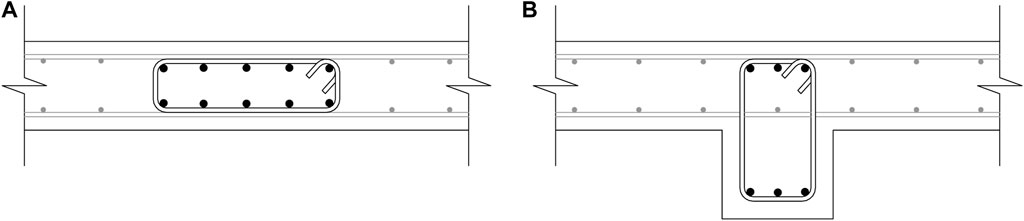
FIGURE 1. Structural system with (A) hidden beam section; (B) drop beam section.
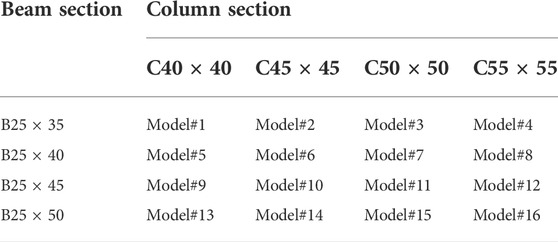
TABLE 1. List of drop beam models.
Structural analysis and design of the 32 models shown in Tables 1 and 2 are required to obtain interstory drifts, rebar requirements, and structure costs, according to the ACI 318R-19 (2019) Special Moment Frame section and the NEC-SE-HM (2014). Seismic design is completed as per NEC specifications. Here, the seismic demand is obtained by the elastic response spectra of Guayaquil city, assuming a soil type: D, (NEC, 2014). The base shear force is determined with an importance factor of 1, a mass source equal to 100% of the total dead load, and a spectral acceleration according to the fundamental period, obtained from NEC (2014), which is 0.397 s. In order to evaluate the behavior of both systems, all models are analyzed with the same spectral acceleration. The structural analysis and design are conducted considering seismic response modification factors of eight and five for drop and hidden beams, respectively.
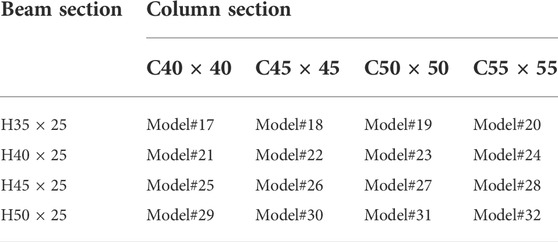
TABLE 2. List of hidden beam models.
The structural systems above are modeled using ETABS (Version 19.0.0). Material parameters

FIGURE 2. Two-way ribbed slab cross-section.
Although all 32 models are loaded considering the same gravitational loads, the structural elements’ self-weight varies since they have different cross-sections in the columns and beams. Therefore, the seismic weight depends on each model, and the lateral seismic force is assigned to rigid diaphragms. Here, a perfect fixed restraint at the base is assumed. The connections between beams and columns are considered with a rigid-zone factor of 50% at the end-length offsets.
All the modeled structures are analyzed to obtain the total cost. The cost index is used for comparison purposes to simplify the data obtained from the estimated budget. It represents values between 1 and 2. Quantity 1 represents the lowest budget of all the analyzed structures, whereas quantity two represents the highest budget. The slab structure is composed of 21 MPa concrete, hollow blocks for weight-lightening purposes, and top and bottom layers of one 12 mm fy = 420 MPa steel rebar per rib. Additionally, the cost reduction on slab construction produced by the shoring procedure on hidden beam structures is considered in this analysis. A summary of concrete slab material costs (labor included) for hidden and drop beams is shown in Table 3. The structural costs for beams and columns are estimated according to Ecuadorian unit costs from Arciniega Larrea and Suárez Coba (2016) (Table 4).
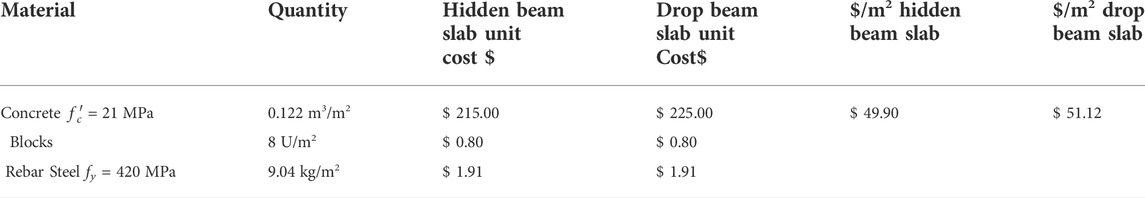
TABLE 3. Material costs for slab (Currency: US dollar).
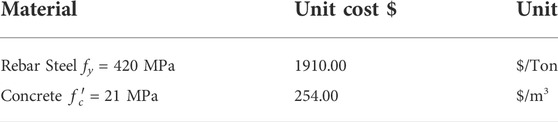
TABLE 4. Material costs for columns and beams (Currency: US dollar).
Once the longitudinal and transverse reinforcement of all the structural elements of the models have been obtained, plastic hinges are generated when a nonlinear static pushover analysis is conducted. The ETABS software package is used for the assignment of automatic plastic hinges, based on the ASCE 41–17 standard, (ASCE, 2017), at the beginning and end of the clear length of each structural element of the building models. A nonlinear static dead load case is generated to perform the nonlinear static pushover. This procedure pushes the structure laterally with a load pattern related to the elastic lateral seismic force corresponding to the model under analysis.
A series of pushover curves are obtained With all the settled information on the models. Moreover, the corresponding response elastic spectrum is also computed using the FEMA 440 method. As a result, the performance points of analysis models with H35 × 25, B25 × 35, H45 × 25, and B25 × 45 are calculated according to FEMA-440 (2005); Velásquez Londoño (2017). In addition, the base shear, roof displacement, vibration period and effective damping are obtained. This information is then used to compare the global behavior of buildings with hidden and drop beam systems.
The linear static procedure is to analyze each model’s beam with the highest rebar area. With this information, the moment-curvature diagrams for beams from models 9, 12, 25, and 28 are obtained. Then, the local behavior of the hidden and drop beams is compared. To analyze the local curvature ductility of the plastic hinge zone on hidden and drop beam elements, stress-strain diagrams of the confined and unconfined concrete are determined according to the model of Kent and Park (1971) of Eq. (1). Moreover, the stress-strain diagram of reinforcement steel was defined by the model developed by Park and Paulay (1991). Consequently, the static equilibrium equations are obtained by considering the deformation compatibility conditions of the unconfined, and confined concrete and rebar steel. Then for each concrete unit strain, the nominal moment and curvature of the section are determined, thus obtaining the moment-curvature diagram (Paulay and Priestley, 1992; Córdova, 2015).
All the variables and the adopted values appearing in Eq. 1 are defined in Table 5. Regarding reinforcement steel stress-strain curve, it is defined by Eqs. 2–4.
where m and r are:
Similarly, the variables in Eq. 2 are defined in Table 5.
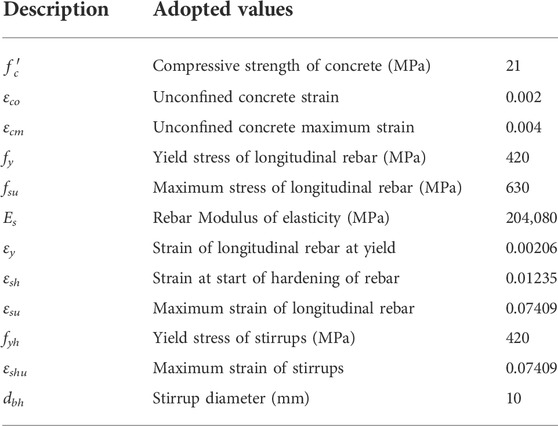
TABLE 5. Concrete and reinforcement steel stress-strain variables.
The ductility due to the curvature of the different sections is computed through:
where φu is the ultimate curvature and φy is the yield curvature of the section. According to Paulay and Priestley (1992), the yield curvature considers the first yield of the tensile rebar, and for the ultimate curvature, this corresponds to the failure point, that is the last point in the moment-curvature diagram.
Since seismic-resistant design codes emphasize that beams should not fail due to shear actions, there are some types of failure that control the flexural behavior of beam sections, these are: failure due to crushing of the concrete by rupture of the stirrups, which means that concrete loses the confinement and fails due to crushing, and tensile rupture of the longitudinal rebar. To consider the latter, the moment-curvature diagram must be interrupted when the unit strain of the tensile rebar exceeds ɛsu. While considering the former, the moment-curvature diagram must be interrupted when the unit strain of the compression concrete exceeds ɛcu, Paulay and Priestley (1992) which is established by:
where ps is the volumetric ratio of confining steel for rectangular sections pS = px + py. In this case, since we are using the Kent and Park model for confined concrete, thus
The flexural capacity and curvature ductility along plastic hinge zones, are compared between hidden and drop beams according to the structural design from Subsection 2.1. Longitudinal and transverse reinforcement is computed and thus used to obtain the flexural capacity and curvature ductility. It is expected to have higher capacity and ductility on drop beams than on hidden beams due to their depth-width relation, (Aguiar, 2003).
Interstory drift analysis was conducted in all the considered structural models, using the linear static analysis approach (Table 1, 2), and their results are summarized in Table 6.
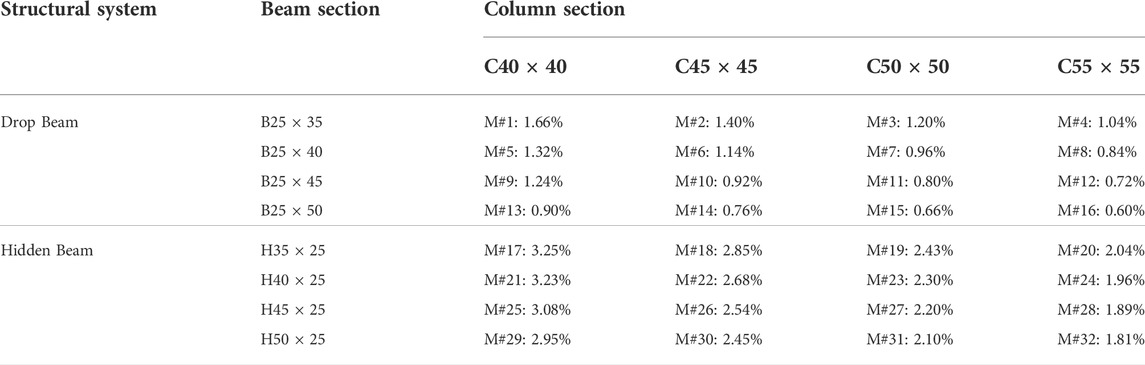
TABLE 6. Interstory drift results.
As shown in Figure 3 (drop beams), the maximum interstory drift value occurs in Model #1 with 1.66%, and the minimum value of 0.6% appears in Model #16. The influence of increasing the beam section depth is equivalent to increasing the column width and depth, which is manifested in isoline slopes, which suggests the effectiveness of drop beams when compared with hidden beams. For the case of hidden beams, the analysis results are presented in Table 6. Here, the maximum interstory drift value appears in Model #17, with 3.25%, and the minimum of 1.81% occurs in Model #32. The data suggest that increasing the column section is more effective than increasing the beam width.
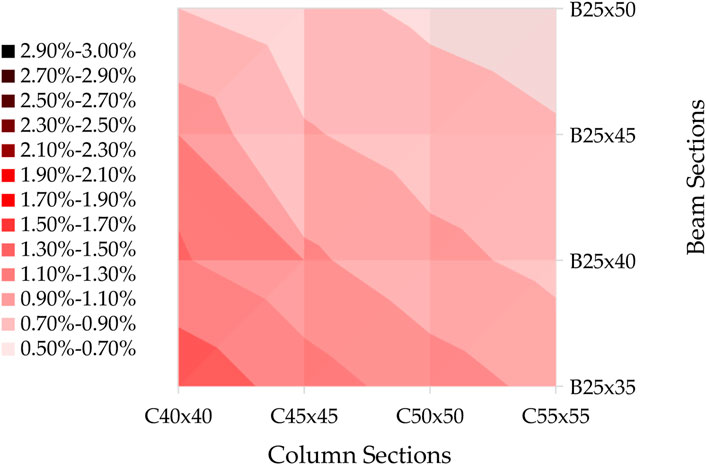
FIGURE 3. Interstory drift results of drop beam models.
A closer look at the data presented in Figures 3, 4 indicates that a 0.05 m depth increase in drop beams is equivalent to a 0.15 m width increase in hidden beams. These results show that the influence of drop beams’ depth is threefold over hidden beams’ width (Samir, 2021). It should be noted that the present study considers interstory drift limits as per the NEC: all drop beam models have a maximum interstory drift less than 2%, which is the maximum allowed by the referred code. Regarding the hidden beam system, only three models comply with the Ecuadorian Code: Model #24, Model #28, and Model #32. Based on the obtained results from the elastic analysis, it was found that the buildings containing drop beams have greater lateral stiffness, which decreases the maximum interstory drift, with respect to the results obtained in buildings containing hidden beams. The maximum drifts obtained in drop beam models were two to three times lower than those obtained in hidden beam models.
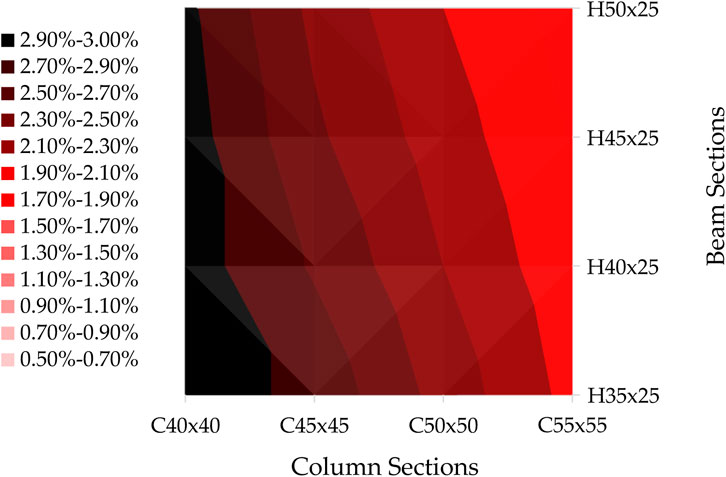
FIGURE 4. Interstory drift results of hidden beam models.
The maximum reinforcement ratio of each model is shown in Figure 5. From a seismic design standpoint, this parameter has much relevance, as ductility mainly depends on it. For hidden beam models, the reinforcement ratio is between 0.72% and 1.1%, whereas for drop beam models, the ratio lies between 0.35% and 0.66%. It proves that hidden beams require 90% more longitudinal steel than drop beams, which in turn means that the ductility will be lower and the cost higher in terms of rebar steel (Paulay and Priestley, 1992; Samir, 2021).

FIGURE 5. Required longitudinal reinforcement ratio.
During the design process, some hidden beam models presented problems with torsion and shear design. The obtained results reveal that Model #17 has a 47.22% of beams that do not comply with the torsion/shear interaction. Similarly, Model #18 has a 7.78%, and Model #21 presents an 11.11% non-compliance. Nevertheless, this could be solved by reducing the torsional constant, which was not considered in this study. Hidden beam buildings do not meet allowable criteria, requiring an increased lateral stiffening of the whole structure, either by increasing the section of beams or columns, to achieve compliance. The shear design of beams suggests that drop beams have a better performance against shear and torsion forces than hidden beams.
According to the structural design, columns C40 × 40 and C45 × 45 have a longitudinal reinforcement of 20.32 cm2, equivalent to eight 18 mm diameter bars, and columns C50 × 50 and C55 × 55 have a rebar area of 30.48 cm2, equivalent to twelve 18 mm diameter bars. Table 7 summarizes the longitudinal reinforcements of columns.
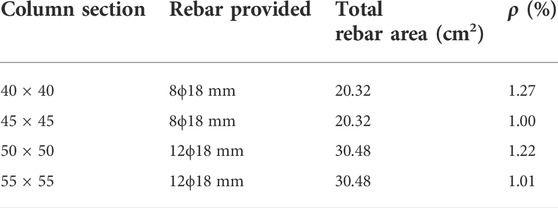
TABLE 7. Longitudinal reinforcement for columns.
Figure 6 shows the cost index for different structural sections. The results presented here indicate that cost increases as structural sections increase. The maximum cost index is 1.89 for a combination of a C55 × 55 column paired with a B25 × 50 beam, and the minimum cost index of 1 occurs for a combination of a C40 × 40 column with a B25 × 35 beam. An important finding was identified in the change of column sections, where it can be observed that the cost index increased around 30% between C45 × 45 and C50 × 50. The main reason for this is the change of the minimum longitudinal reinforcement on the columns (Table 7).
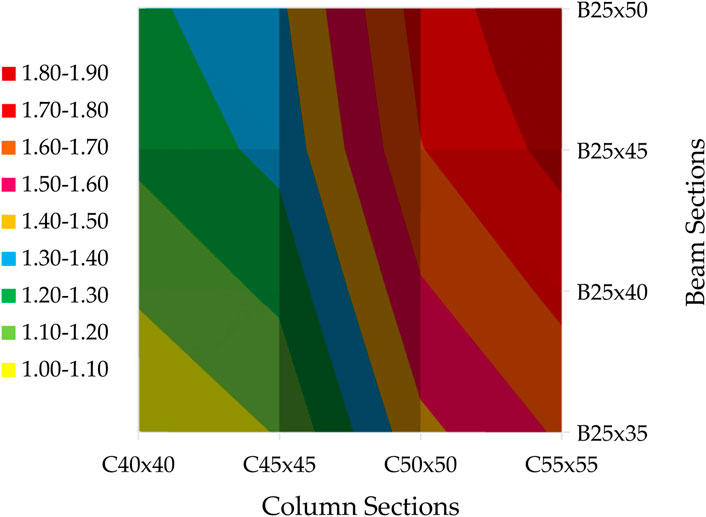
FIGURE 6. Cost index of drop beam models.
A similar situation is observed in the hidden beam case, whose cost index chart is shown in Figure 7. The most significant difference is the maximum cost index, which reaches a value of two for a combination of C55 × 55 column with an H50 × 25 beam. According to the interstory drift analysis, the models that comply with the Ecuadorian code are Model #24, Model #28, and Model #32. Cost differences with drop beam equivalent models are between 1% and 2% (Table 8), representing a negligible cost factor. A summary of superstructure costs is shown in Table 9.
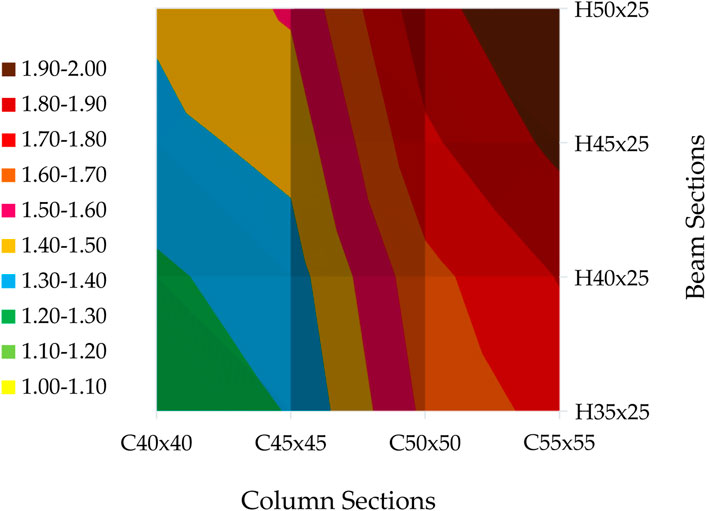
FIGURE 7. Cost index of hidden beam models.
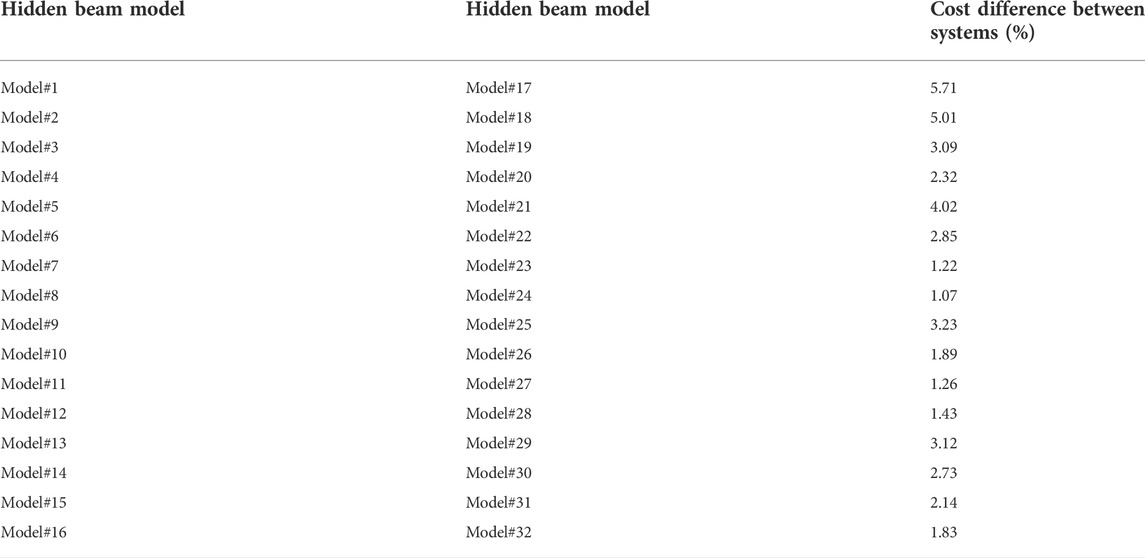
TABLE 8. Cost difference between drop and hidden beam systems.
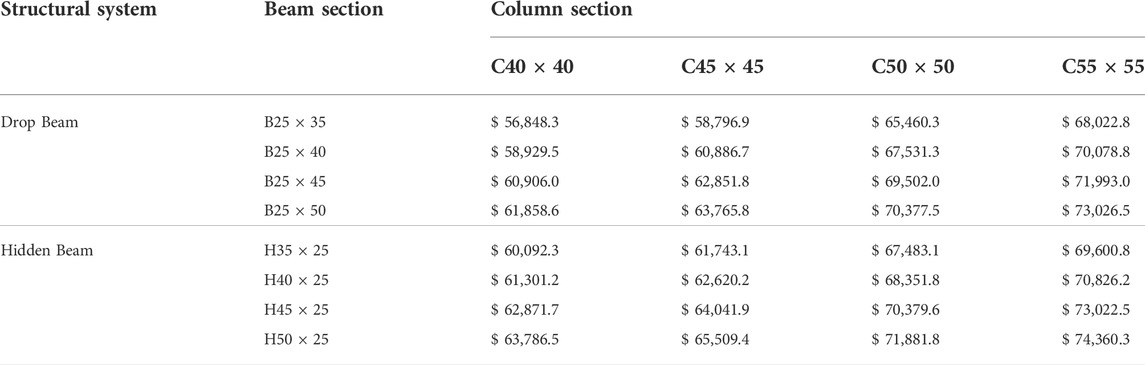
TABLE 9. Total costs for building structure.
A comparison of interstory drifts and costs shows that Model #1 and Model #32 evidence similar interstory drifts. From a seismic design standpoint, these two models also have similar behavior, with a difference of 9% between interstory drifts but with a 31% difference in costs. Since the results show that constructing buildings with drop beams instead of hidden beams is more economical and the interstory drift is small, the data implies that it is more cost-effective and technically feasible. At the same time, a lower interstory drift implies that the repair costs of the building after a seismic event are also lower.
Nonlinear static analysis was performed using the ASCE 41–17 modeling parameters for beams and columns (ASCE, 2017). A FEMA 440 equivalent linearization was used to determine the performance points and global parameters from the nonlinear static analysis (FEMA-440, 2005). The results and global parameters are shown in Table 10. Drop beam models have higher values for damping and ductility ratio than hidden beam models. Also, the effective period is higher on hidden beam models due to their low stiffness.
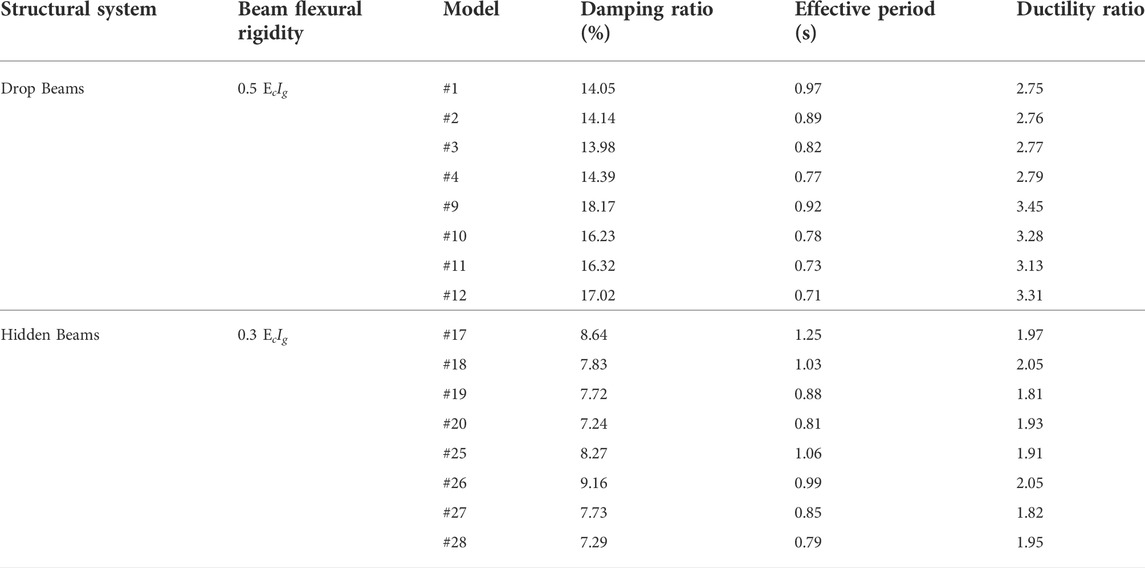
TABLE 10. FEMA 440 equivalent linearization results.
Next, the global ductility ratios are compared between hidden beam (red) and drop beam (blue) models. The results in Figure 8 suggest that drop beam models have a ductility ratio between 2.75 and 3.31. On the other hand, for hidden beams, the ductility ratio is approximately two on all the analyzed models. The ductility ratio is 50% higher in models of buildings containing drop beams than in those with hidden beams. This result is probably due to the greater height and the lower amount of rebar required by the drop beams for the same bending demand. Thus, drop beam structures have better seismic behavior when compared to hidden beam models, (Sanchez Aguilar, 2010). Changes in the width of hidden beams do not affect the system ductility. On the contrary, increasing the drop beam depth will significantly increase the system ductility ratio.
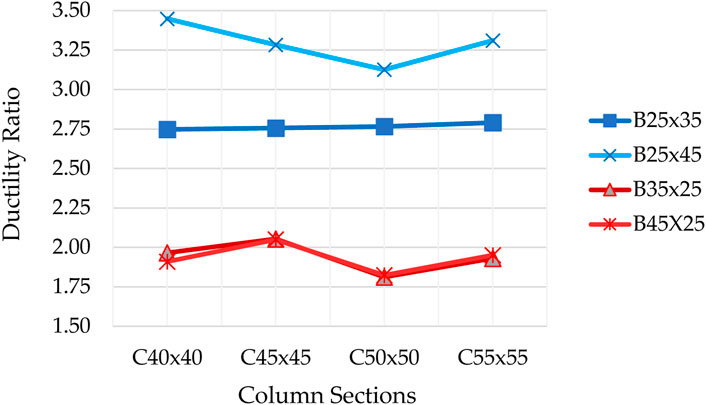
FIGURE 8. Global ductility ratio results.
The effective period is a parameter also considered in this study. Figure 9 compares the effective period for different beam/column combinations, where B refers to a drop beam and H to a hidden beam. Hidden beam models show a higher effective period than drop beam models. This result suggests that buildings with hidden beams are more flexible since they have a greater effective period than buildings with drop beams. This demonstrated that buildings with hidden beams deform more laterally in earthquakes, given their flexibility. The highest period for hidden beam models is 1.25 s, and for drop beam structures is 0.97 s, which represents a 29% difference.
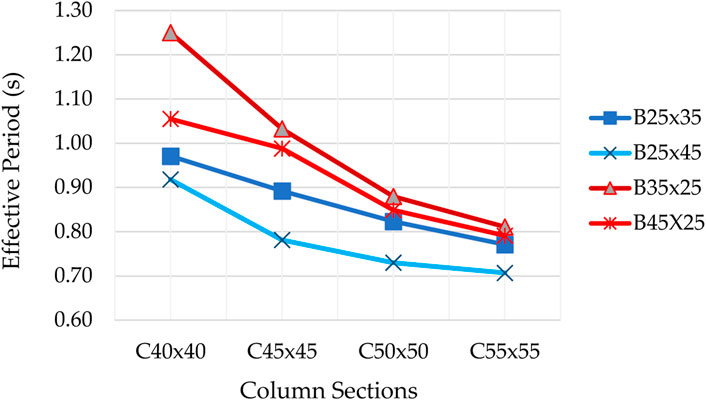
FIGURE 9. Effective period results.
Figure 10 shows the differences in damping ratios for different beam/column combinations, using the same letter scheme as Figure 9. It can be observed that for drop beam models, the damping ratios are above 14%, and for hidden beam models, the damping ratios drop below 10%. According to these results, the percentage of damping is higher in models containing drop beams (133%) than in buildings containing hidden beams (63%). This allows hidden beam model buildings to better dissipate the effects of earthquakes in the nonlinear range.
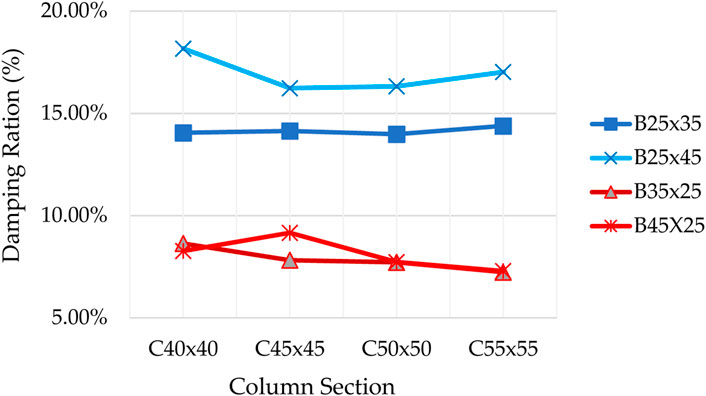
FIGURE 10. Damping ratio results.
Performance points obtained from the nonlinear static analysis following FEMA-440, exhibit differences in base shear and displacement values, according to the pushover curves of Figure 11. Values of base shear for H35 × 25 hidden beam section are between 907.70 kN and 1,272.70 kN, which can be compared with the B25 × 35 drop beam pushover curve that shows base shear values between 951.93 kN and 1,667.62 kN. According to these results, drop beam systems present higher base shear values, with a mean difference of 5.5%. In terms of displacement, drop beam systems evidence lower displacements with a mean difference of 15.6%.
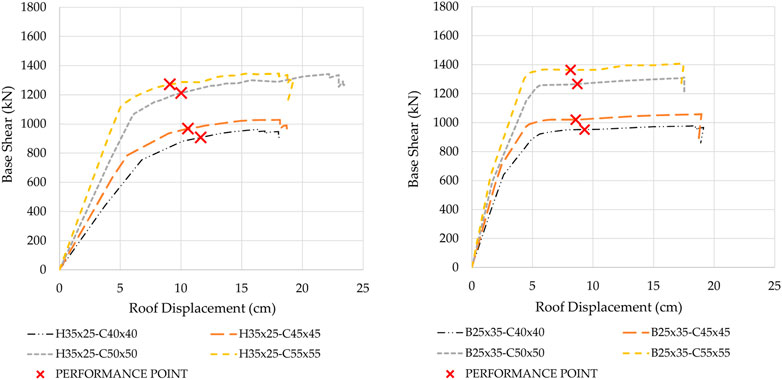
FIGURE 11. H35 × 25 and B25 × 35 Pushover curves.
In contrast with the H45 × 25 hidden beam and B25 × 45 drop beam models, higher differences are observed in the pushover curves presented in Figure 12. Here, the base shear of the H45 × 25 models is between around 999.68 kN and 1,394.60 kN, which is 23.8% lower than that of B25 × 45 drop beam model. Therefore, drop beam models show higher base shear values, and the differences increase as the beam depth increases. Regarding displacements, it can be observed that drop beam models have 20% lower displacements than hidden beam models. These results demonstrate a better seismic performance of drop beam systems instead of hidden beam systems.

FIGURE 12. H45 × 25 and B25 × 45 Pushover curves.
A summary of performance points is presented in Figure 13, where Fx is the base shear obtained by the model and Fmin is the minimum base shear obtained by the 16 analysis models, of which 8 are hidden beam models and the other eight are drop beam models, see models in Table 10. On the other axis, Ux and Umin are the roof displacement and minimum roof displacement of the 16 models, respectively. The analysis shows that the effect of stiffness on beam sections and column sections represents a decrease in displacements and an increase in base shear values. Based on the nonlinear static pushover analysis, these results show an improvement in the seismic behavior of buildings with drop beams instead of those with hidden beams. The displacement ratio defined by Ux/Umin shows that buildings with hidden beams deform more significantly than buildings with drop beams, that is to say, about 55% more with respect to the model with beam section B25 × 45 and columns of C55 × 55. At the same time, the stiffer buildings support higher basal shears with lower deformations, i.e., they have better seismic behavior, similar to Samir (2021) results.
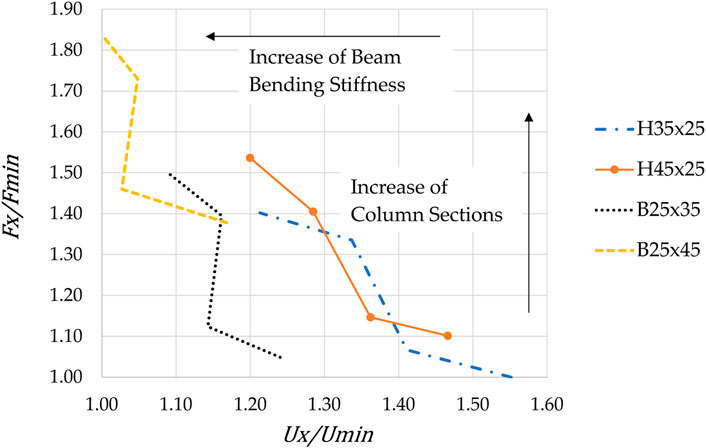
FIGURE 13. Performance point curves.
To compare ductility and flexural capacity for beams with the highest longitudinal reinforcement ratios of the models shown in Table 11, several moment-curvature diagrams were generated and overlapped in Figure 14. The main factors that affect moment-curvature diagrams are the beam cross-section, longitudinal reinforcement ratio, and stirrup spacing. Results suggest that drop beams have 20%–30% higher maximum moment values than hidden beam sections. As expected, section ductility in drop beams is higher than in hidden beams because of having a lower longitudinal reinforcement ratio. Drop beam sections’ ductility is approximately 30% higher than hidden beam sections, which demonstrates its advantages in terms of stiffness, ductility, steel reinforcement, and flexural capacity, (Paulay and Priestley, 1992; Aguiar, 2003; Córdova, 2015).
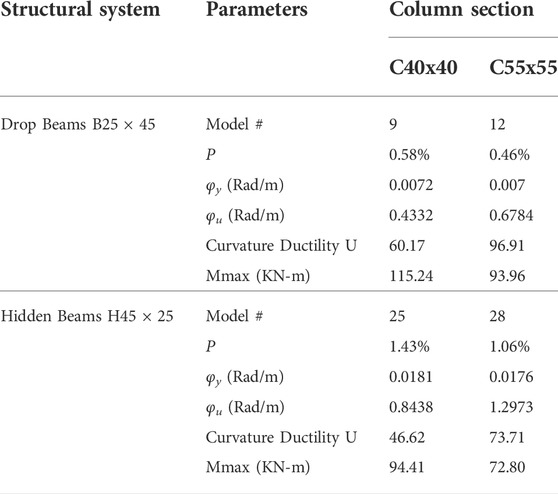
TABLE 11. Moment-curvature results.
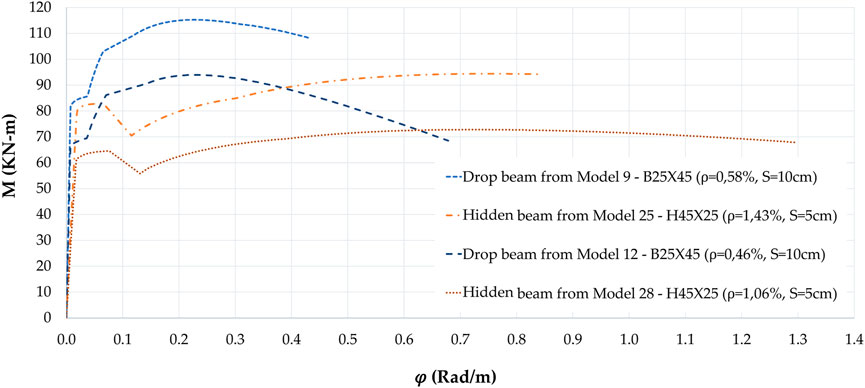
FIGURE 14. Moment-curvature diagrams.
This study presented a comparative analysis between the seismic response of two types of reinforced concrete frame systems, provided either with hidden beams embedded in the floor, or drop beams that run down the floor depth. Three-dimensional models were constructed using ETABS are constructed for selected cases of beam/column combinations of both hidden and drop structural systems. Among the 32 structural models carried out for this research, of the 16 models concerning reinforced concrete special moment frames with hidden beams, only three models comply with the maximum allowable story drift according to the Ecuadorian Construction Code. The remaining hidden beam models have unacceptable interstory drifts greater than the maximum allowable 2%. The drift parameter could only be controlled using the strongest C55 × 55 column section available in this study, combined with 40 cm, 45 cm, and 50 cm wide hidden beams. All the models concerning reinforced concrete special moment frames with drop beams complied rigorously with this allowable drift limit, ranging from 1.66% for Model #1 (B25 × 35 beams with C40 × 40 columns), to 0.60% for Model #16 (B25 × 50 beams with C55 × 55 columns).
From a budget standpoint, out of the 32 models, a significant difference between models with drop beams versus those with hidden beams could not be established. Although it is notorious that the models of buildings with hidden beams require a greater amount of rebar. However, their price is somehow compensated by the ease of labor on the beams and slabs of the same formwork surface, which is easier constructively and speeds up construction times. In any case, the price difference still exists, being more noticeable for the models composed of C40 × 40 columns, where the buildings made up of hidden beams are up to 5.71% more expensive than their drop beam counterparts. However, since only models #24, #28, and #32 comply with the maximum allowable interstory drift, these are the only models containing hidden beam buildings where a fair comparison of analysis and prices could be made. Furthermore, since any drop beam building models meet the maximum allowable interstory drift parameter, a price comparison can be made with any of these models, even including Model #1. Thus, it could be estimated that the price of a hidden beam building is as much as 31% higher than the price of a drop beam building.
For this research, the differences in the linear, nonlinear, local, and global behavior of buildings formed by hidden beams and drop beams are evident, reinforced concrete special moment frames with drop beams being more feasible from the engineering, technical and economic point of view. However, using hidden beams in buildings is not ill-advised as long as adequate design and analysis are conducted, considering the corresponding design regulations. This type of system is attractive when a design without drop beams in the slab is needed.
The raw data supporting the conclusions of this article is available by the authors, without undue reservation.
All authors listed have made a substantial, direct, and intellectual contribution to the work presented herein, and approved it for publication.
The authors declare that the research was conducted in the absence of any commercial or financial relationships that could be construed as a potential conflict of interest.
All claims expressed in this article are solely those of the authors and do not necessarily represent those of their affiliated organizations, or those of the publisher, the editors and the reviewers. Any product that may be evaluated in this article, or claim that may be made by its manufacturer, is not guaranteed or endorsed by the publisher.
ACI 318R-19 (2019). ACI 318r-19. Building code requirements for structural concrete : An ACI standard ; commentary on building code requirements for structural concrete. Code. (Farmington Hills, MI: American Concrete Institute).
Aguiar, R. (2003). Análisis sísmico por desempeño. Quito (Ecuador): Centro de Investigaciones Científicas. Escuela Politécnica del Ejército, 342.
Arciniega Larrea, D. A., and Suárez Coba, E. R. (2016). .Análisis comparativo económico-estructural de edificios de 6, 12 y 18 pisos, aplicando el Código Ecuatoriano de la Construcción (CEC-2002) y la Norma Ecuatoriana de la Construcción (NEC-15). Thesis. (Ecuador: Quito).
ASCE (2017). Seismic evaluation and retrofit of existing buildings. (Virginia, United States: American Society of Civil Engineers). asce/sei 41-17 edn. doi:10.1061/9780784414859
Beauval, C., Mariniére, J., Yepes, H., Audin, L., Nocquet, J., Alvarado, A., et al. (2018). A new seismic hazard model for Ecuador. Bull. Seismol. Soc. Am. 108, 1443–1464. doi:10.1785/0120170259
Benavent-Climent, A. (2005). Shaking table tests of reinforced concrete wide beam–column connections. Earthq. Eng. Struct. Dyn. 34, 1833–1839. doi:10.1002/eqe.507
Chira, A., Bompa, D. V., and Puskás, A. (2022). Load-deformation response of long span prestressed concrete wide beams. Guildford, England: University of Surrey, 1–28. Technical Report.
Córdova, C. (2015). Diseño de estructuras de hormigón armado. (Chile: Universidad de Santiago de Chile).
Delalibera, R. G. (2002). Análise teórica e experimental de vigas de concreto armado com armadura de confinamento. São Paulo (Brazil): Dissertagao de Mestrado, Escola de Engenharia de Sao Carlos, Universidade de Sao Paulo.
FEMA-440 (2005). FEMA 440. Improvement of nonlinear static seismic analysis procedures. (Redwood City, CA: Applied Technology Council). Report.
Kassem, M. M., Mohamed Nazri, F., Farsangi, E. N., and Ozturk, B. (2022a). Development of a uniform seismic vulnerability index framework for reinforced concrete building typology. J. Build. Eng. 47, 103838. doi:10.1016/j.jobe.2021.103838
Kassem, M. M., Nazri, F. M., Farsangi, E. N., and Ozturk, B. (2022b). Improved vulnerability index methodology to quantify seismic risk and loss assessment in reinforced concrete buildings. J. Earthq. Eng. 26, 6172–6207. doi:10.1080/13632469.2021.1911888
Kent, D. C., and Park, R. (1971). Flexural members with confined concrete. J. Struct. Div. 97, 1969–1990. doi:10.1061/jsdeag.0002957
Lanning, F., Haro, A. G., Liu, M. K., Monzón, A., Monzón-Despang, H., Schultz, A., et al. (2016). Eeri earthquake reconnaissance team report: M7. 8 muisne, Ecuador earthquake on april 16, 2016. Available at: www.eeri.org.
Navyashree, K., and Sahana, T. (2014). Use of flat slabs in multi-storey commercial building situated in high seismic zone. Int. J. Res. Eng. Technol. 3, 439–451. doi:10.15623/ijret.2014.0308069
NEC (2014). Peligro sísmico. diseño sismo resistente nec-se-ds. Available at: https://www.habitatyvivienda.gob.ec/documentos-normativos-nec-norma-ecuatoriana-de-la-construccion/.
NEC-SE-HM (2014). NEC-SE-HM. Estructuras de hormigón armado. Standard, ministerio de Desarrollo urbano y vivienda, quito, EC
Nogueira, C. G., and Rodrigues, I. D. (2017). Ductility analysis of rc beams considering the concrete confinement effect produced by the shear reinforcement: A numerical approach. Lat. Am. J. solids Struct. 14, 2342–2372. doi:10.1590/1679-78253904
Özbek, E., Aykac, B., Bocek, M., Yılmaz, M. C., Mohammed, A. K., Er, Ş. B., et al. (2020). Behavior and strength of hidden rc beams embedded in slabs. J. Build. Eng. 29, 101130. doi:10.1016/j.jobe.2019.101130
Park, R., and Paulay, T. (1991). Reinforced concrete structures. (New Jersey, United States: John Wiley & Sons).
Paulay, T., and Priestley, M. N. (1992). Seismic design of reinforced concrete and masonry buildings. (New York: Wiley). 768.
Rovello, P., and Andrea, V. (2014). Verificación del factor de reducción sísmico r, para el análisis inelástico de estructuras de hormigón armado de acuerdo al nec-11. (Guayaquil: Trabajo de graduación, Universidad Católica de Santiago de Guayaquil, Facultad de Ingeniería).
Samir, H., and Diab, M. (2014). Slabs with hidden beams, facts and fallacies. Asian J. Eng. Technol. 2, 316–319. Available at: www.ajouronline.com.
Samir, H. (2021). Drop or hidden beams vs. flat slabs, which way is forward, a performance based colloquial narration. Int. J. Eng. Res. Technol. Available at: http://www.ijert.org.
Sanchez Aguilar, M. A. R. (2010). “Diseño sísmico basado en desempeño para una edificación esencial de concreto reforzado,” Master’s thesis. (Monterrey, N.L: Instituto Tecnológico y de Estudios Superiores de Monterrey).
Keywords: reinforced concrete beams, pushover analysis, equivalente linearization, moment-curvature relationship, seismic design
Citation: Zúñiga-Olvera C, Valverde-Burneo D, Garcia-Troncoso N, Silva CE, Gomez D and Bompa DV (2022) Comparative study of the cost and behavior of RC special moment frame buildings with drop and hidden beams subjected to seismic loads. Front. Built Environ. 8:1032643. doi: 10.3389/fbuil.2022.1032643
Received: 31 August 2022; Accepted: 13 October 2022;
Published: 01 November 2022.
Edited by:
Fadzli Mohamed Nazri, Universiti Sains Malaysia (USM), MalaysiaReviewed by:
Baki Ozturk, Hacettepe University, TurkeyCopyright © 2022 Zúñiga-Olvera, Valverde-Burneo, Garcia-Troncoso, Silva, Gomez and Bompa. This is an open-access article distributed under the terms of the Creative Commons Attribution License (CC BY). The use, distribution or reproduction in other forums is permitted, provided the original author(s) and the copyright owner(s) are credited and that the original publication in this journal is cited, in accordance with accepted academic practice. No use, distribution or reproduction is permitted which does not comply with these terms.
*Correspondence: Natividad Garcia-Troncoso, bmxnYXJjaWFAZXNwb2wuZWR1LmVj
Disclaimer: All claims expressed in this article are solely those of the authors and do not necessarily represent those of their affiliated organizations, or those of the publisher, the editors and the reviewers. Any product that may be evaluated in this article or claim that may be made by its manufacturer is not guaranteed or endorsed by the publisher.
Research integrity at Frontiers
Learn more about the work of our research integrity team to safeguard the quality of each article we publish.