 Dino Rimantho
 Syaiful Syaiful2
94% of researchers rate our articles as excellent or good
Learn more about the work of our research integrity team to safeguard the quality of each article we publish.
Find out more
ORIGINAL RESEARCH article
Front. Built Environ., 24 October 2022
Sec. Sustainable Design and Construction
Volume 8 - 2022 | https://doi.org/10.3389/fbuil.2022.1030196
Indonesia currently does not use a systematic method of managing electronic waste (e-waste). The informal sector handles e-waste mostly without regard to the environment or public health. Establishing a national collection system favored by the community is the most challenging problem. Even though the waste bank system (WB) does not collect e-waste, it can provide a solution because it is well known as a recycling program by Indonesian citizens. This study proposes a WB system model for e-waste collection to interact with other stakeholders in DKI Jakarta, Field research and interviews with several essential informants were conducted. E-waste samples were identified to determine the composition of the current management and proposed an e-waste bank model as a sustainable circular economy implementation. E-waste has enormous potential for recycling, but it also has hazardous materials if not recycled properly. The government must make national regulations on e-waste management and develop cooperation between local governments, industry/producers, recycling industries, and the community to build a WB-based e-waste collection system.
The electronics sector is currently one of the world’s largest and fastest-growing manufacturing sectors (Ikhlayel, 2018; Clarke et al., 2019). E-waste builds up over three times quicker than other types of waste (Cucchiella et al., 2015). For instance, between 20 and 50 million tonnes of Waste Electronic and Electrical Equipment (WEEE, often known as e-waste) are produced (Wang et al., 2016). E-waste production reached 53.6 million tonnes in 2019 (Forti et al., 2020). Moreover, the United States produced the most e-waste in 2014 (7.1 million tonnes), followed by China (6 million tonnes) (Wang et al., 2019).
This increase in e-waste is the result of numerous factors. As wealthy cultures want the newest technology, these include the short equipment lifecycle, poor recycling (Rabani and Thakur, 2020), and the ongoing upgrading of electronic equipment (Wang et al., 2019). E-waste has been referred to as one of the most challenging classifications of garbage to manage (Borthakur and Singh, 2020). Developed nations know that recycling outdated electronic equipment helps protect the environment from dangerous chemicals (Huisman et al., 2021), but only 15% of the e-waste created in 2014 was formally disposed of through national take-back programs (Wang et al., 2016). Additionally, according to the United Nations Environmental Programme (UNEP) (Greenspace, 2008), only 10% of the world’s e-waste is recycled in industrialized nations, with the other 90% being shipped to underdeveloped nations worldwide. Furthermore, outdated or used electronic and electrical equipment (EEE) is frequently designated as a contribution to underdeveloped nations that cannot afford new electronic equipment but need to keep up with the world of expanding technology (Albuquerque et al., 2018). According to Amankwah-Amoah (2016), most of the garbage is shipped to the least developed and indebted nations, including Ghana, Nigeria, Chile, Uruguay, Vietnam, Colombia, Peru, and Ecuador. These nations lack functional recycling systems and infrastructure for handling e-waste (Abalansa et al., 2021). The quantity of WEEE sent to these nations is anticipated to rise as a culture of consumption spreads (Armijo et al., 2011; Holgate, 2018). Additionally, the receiving countries’ regulations are not too strict, making them convenient locations for the disposal of e-waste (Wang et al., 2016). Installing proper e-waste recycling, necessitating cutting-edge technologies to remove recoverable materials securely, is costly (Perkins et al., 2014). Developing nations use crude, informal recycling techniques to extract the resources from e-waste, exposing the employees to the toxic materials contained therein (Ikhlayel, 2018).
WEEE is a different type of waste compared to conventional municipal waste. Because the e-waste stream has the unique property of containing both highly toxic substances that are hazardous to health and the environment and valuable raw materials that can be recovered, conventional waste management policies better suited to handle traditional waste types cannot be applied in this case. According to a Huisman (2003) study on e-waste recycling, precious metals can be recovered from 97 percent to 98 percent, while many base metals can be recovered to over 90 percent. Hischier et al. (2005) investigated the entire Swiss WEEE recycling and disposal processes, including the processing of all resulting fractions, and contrasted the environmental effects of recycling with the impact of forgoing the initial manufacture of various raw materials. They discovered that recycling WEEE has a minor environmental impact in comparison to the impact of primary production, showing that this is the environmentally preferred course of action.
The improper treatment of WEEE is hazardous to human health and the environment since it releases heavy metals and persistent organic compounds (Robinson, 2009; Cesaro et al., 2017). E-waste is responsible for 70 percent of all identified harmful and dangerous substances in the environment today (Islam et al., 2020). Heavy metals like lead, mercury, cadmium, and beryllium are among them, as are PVC plastic pollutants like brominated flame retardants that are bad for the environment and human health. E-waste contains persistent organic pollutants (POPs), which can bio-accumulate and bio-magnify through the food chain (Borthakur, 2016). However, there are precious components in e-waste that have economic potential for recycling. A recycling system is an excellent first step in the right direction.
The practice of importing used electronic equipment and the rise in the use of electronic equipment owing to population expansion and technological advancement has made the management of e-waste in Indonesia more challenging (Ikhlayel, 2018). Indonesia currently lacks any e-waste management rules, which results in poor e-waste management (Ikhlayel, 2018). According to Rochman et al. (2017), communities transfer their e-waste to informal sectors or temporary collection points (TCPs) meant for mixed garbage collection. This results in the majority of e-waste circulation and handling taking place in the informal sector. While this is happening, neither local governments nor businesses are required to handle their post-consumer electronic items. Involving the producers in responsibility is the best strategy for overcoming this, as industrialized nations have done (Lodhia et al., 2017). The implementation of a collection mechanism that must be simple for communities and electronic producers to access is Indonesia’s most challenging problem.
By connecting the sources of e-waste with producers or recycling companies and allowing for the exchange of recyclable trash for cash, a waste bank (WB) scheme may provide a solution (Raharjo et al., 2017). WB was made into a national initiative and released as PermenLH No. 13/2012 as recycling advice. WB grows ten times in five years, distributing to 206 districts/cities throughout 30 provinces (Raharjo et al., 2021). Additionally, prior research indicated that WB must be established at the source and municipal levels. WB also serves as a drop-off location for an extended producer responsibility (EPR) program and a collection location for managing e-waste. Six of Indonesia’s top WBs are currently operational: Surabaya Bina Mandiri WB, Malang WB, East Jakarta, Mekarsari RW 03 WB, Makassar Tallo WB, Bantul Gemah Ripah WB, and Banjarmasin Central WB (Raharjo et al., 2021). WB typically accepts commercial waste such as paper, newspaper, cardboard, several kinds of plastic bottles, and different kinds of metals.
This paper discusses a proposed WB system model that can be used to collect e-waste to support circular economy programs and builds a WB model to link e-waste waste with producers and recycling agents. The proposed model is carried out by considering the actual conditions of the e-waste problem and the WB system in Indonesia. This study examines market systems and other non-technical features, including government policies. The case study was conducted in DKI Jakarta, the capital city of Indonesia, which has a relatively low level of development of the WB system as a proxy for the country as a whole.
Maintaining human health, protecting the environment, and conserving natural resources are the main goals of waste management. The material flow analysis (MFA) method examines all inputs and outputs in the system and their evaluation and comparison while considering the “metabolic” waste management system, which entails monitoring the flow and waste substances in the waste management model. The field research was conducted in DKI Jakarta. The selection of this location was determined purposively with various considerations, such as:
1) Population growth in DKI Jakarta has increased, potentially increasing the rate of e-waste generation.
2) Unavailability of data related to the volume of e-waste in DKI Jakarta
3) Not yet optimal e-waste management in DKI Jakarta.
Based on data on the rate of e-waste generation and e-waste flow that are not yet available, the methodology used is mainly data acquisition and analysis of e-waste generation schemes by buyers of electronic equipment. The field study was conducted through field visits and interviews with key informants with critical stakeholders, including consumers and repair services in five municipalities in DKI Jakarta. Furthermore, a questionnaire was used to determine the flow pattern of electronic waste in DKI Jakarta. The questionnaire was adopted from UNEP 2007 and developed according to the characteristics of the DKI Jakarta area. Questionnaires were distributed to 400 households and 54 electronic waste informal sectors.
The MFA method consists of several variations of methods as suggested by European environmental agencies to analyze the potential level of e-waste disposals, such as the time step method, the market supply method, the Carnegie Mellon method, and several other methods (Babu et al., 2007). In this study, the “use and consumption” method adopted by Nnorom and Osibanjo (2008) is applied to estimate the amount of electronic waste in the community. Estimates of the amount of electronic waste are obtained by considering the household electronic equipment inventory level. Furthermore, the amount of electronic waste is done by dividing the total inventory by the average user age. In addition, the supply level considers the number of family members in the household. Various records in the application of this method include the average number of electrical and electronic equipment in the community and the age of use. Product life is one of the essential factors in estimating the amount of electronic waste. The average lifespan of electronic equipment refers to a previous study by Oguchi et al. (2008).
This study collects the potential rate of e-waste generation from the informal sector. This study needs to be done to determine the actual situation of the potential volume of waste and the flow of electronic waste material. Data collection from the informal sector was conducted using a questionnaire survey on 54 informal sector actors, collectors, and electronics repairers. The electronics repairers in this survey are electronics service providers for television, air conditioning, refrigerators, and washing machine products.
Figure 1 explains that the informal sector actors in electronic waste have a somewhat important role in knowing the number of electronic products in the community. The survey was conducted on 54 respondents in the informal electronic waste sector in five municipal areas in DKI Jakarta. The targeted respondents in this study consisted of collectors, collectors, and electronics repairers. Furthermore, the survey shows that AC PK-type electronic products are the most collected items, amounting to 134 units. Meanwhile, the minor type of electronic product is the 52-inch plasma television. In electronic products, the type of refrigerator known to be the most is the type of 1-door refrigerator with as many as 53 units. Furthermore, the type of washing machine that was collected the most was the two-tube washing machine. The most known LED-type televisions are 17-inch LEDs. Meanwhile, the most common type of LCD television is a 32-inch LCD. Then for CRT television types, the most are the 21-inch CRT type.
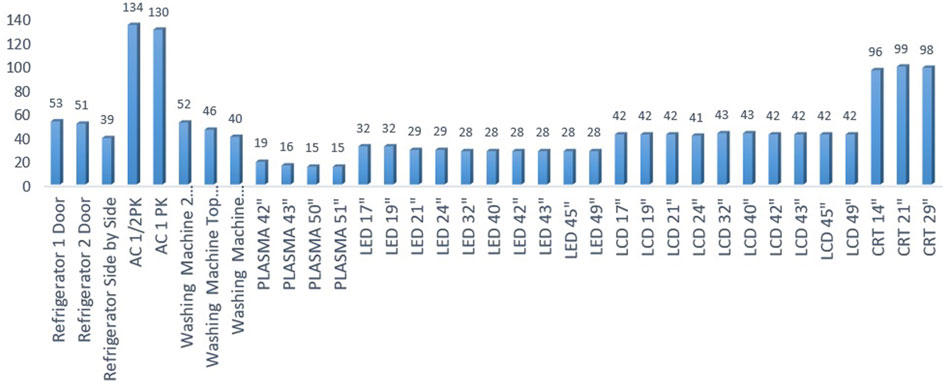
FIGURE 1. Types and quantities of electronic goods collected by the informal sector in DKI Jakarta.
The material flow analysis was then carried out based on the survey results. Material flow analysis is a model that can show the relationship between the environment and the economy and determine the dynamics in the material flow (Hinterberger et al., 2003). The definition of input here is the raw material extracted in the system, while the output is the consumption of products within the limits of a system and the accumulation of waste.
The study by Kurdve et al. (2014) explained that material flow analysis could be applied in waste management as a framework for modeling the elemental composition of waste and evaluating the performance of material management in the recycling sector. Thus, material flow analysis can be an attractive decision support tool in resource management (Brunner and Rechberger 2004). Thus, systematic material flow analysis can link a material’s source, pathway, and final disposal (Brunner and Rechberger 2004; Steubing et al., 2010). Several studies have been conducted using the material flow analysis method to measure and determine the flow of specific categories of electronic waste (Kang and Schoenung 2006; Kumar and Shrihari 2007; Oguchi et al., 2008; Steubing et al., 2010). In addition, the material flow analysis method is also used to identify the networks and chains that link the various phases of the e-waste life cycle and related stakeholders (Streicher-Porte et al., 2005; Jain and Sareen, 2006).
Based on the calculations that have been done previously, a flow of electronic waste can be made from households to dispose of the landfill. The route of e-waste flow generally begins with products produced by producers who sell electronic goods to consumers (households). Electronic expired products will become non-functional, or their functions have begun to decrease and will become waste. In some developing countries, no longer functional products will be repaired, reprocessed, or discarded. This flow route is made to determine the flow of electronic waste in DKI Jakarta, as shown in Figure 2.

FIGURE 2. The route of the flow of electronic waste in DKI Jakarta, the existing condition.
Based on Figure 2, further analysis of the material flow (mass flow analysis) can be made. In principle, the mass flow analysis method is used to determine the flow of materials from production to disposal to the environment (Oguchi et al., 2008). However, this research is only limited to calculating electronic product material flow from households to the final disposal site. Furthermore, from the results of surveys and interviews that have been carried out, the mass flow analysis of electronic products will be shown in Figure 3.
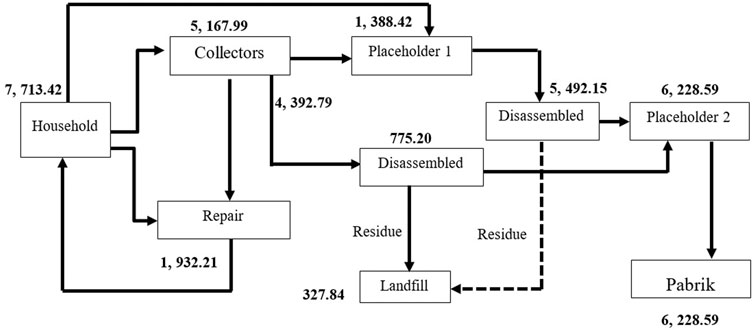
FIGURE 3. Mass Flow Analysis of electronic waste in DKI Jakarta existing conditions.
Figure 3 provides information about Mass Flow Analysis from household electronic waste until it ends up in the TPA. Electronic waste obtained from households is as much as 7,713.42 kg/year. Furthermore, the household treats the waste by repairing it to repairers, then sells it to collectors or collectors 1. The percentage of electronic waste brought to collector 1 is 18% or 1,388.42 kg/year. Meanwhile, about 67% or 5,167 kg/year are sold to collectors. Meanwhile, about 15% of the repairs are made by service personnel or as much as 1,932.21 kg/year.
In addition to being sold to collectors, electronic waste is also repaired at the repair shop. Service members also get about 15% of electronic waste from waste collectors. Thus, the total electronic waste in the repair shop is 1,932.21 kg/year. Service members buy electronic waste from collectors to get components that are still functioning and will usually be used to replace damaged components in repaired products. In addition, repairers also sell electronic products that have been repaired and function again to the public at lower prices and are adjusted to the product’s condition.
There are two activities carried out by electronic waste collectors, namely dismantling electronic products to obtain electronic components that are still functioning and obtaining materials that still have economic value, such as glass, plastic, and metal. In addition, some collectors only look for and collect damaged or used electronic products from the public and sell directly to Placeholder 1. From the survey results, it is stated that 75% of collectors directly sell to Placeholder 1. Meanwhile, the Placeholder are dismantling to get Material with an economic value of about 10%. From the results of this dismantling, the material obtained can no longer be used or has no economic value or a residue of about 5%. This residue will be disposed of in landfills and mixed with other households’ solid waste. The dismantling process at the collector level still uses simple technology and can potentially reduce the quality of the environment and human health.
At placeholder level 1, information was obtained that they also received damaged or used electronic products from the community, about 18%. As previously explained, placeholder one also receive damaged or used electronic products from collectors. Thus, the total electronic waste received is 5781.21 kg/year. Collectors 1 also carry out the dismantling process to sort them out to obtain valuable materials. The demolition process at this level is about 95%, and only about 5% becomes residue. This residue will also be disposed of in landfills and mixed with other households’ solid waste. The results from the demolition are then sold to more significant placeholder 2.
In general, collectors two have received electronic waste sorted based on the characteristics of the Material because at the previous level it was no longer mixed at the previous level. Placeholder 2obtains Material in electronic waste from 2 sources, namely collectors and collectors. Thus, the total material from e-waste that they accommodate is 6,228, 59 kg/year. The materials are then sold to factories that need them.
The total residue from electronic waste that goes into landfills is 327.80 kg/year. Thus, if it is added to the mass sold to the factory (6,228.59 kg/year) and the mass of electronic waste in the repairman (1,932.21 kg/year), the result will be equal to that in the household.
Several studies on applying the MFA method, especially in managing electronic waste, have been published. For example, research by Morf and Taverna (2004) tracked Material flows in Switzerland, where the study did not consider the presence of precious metals. Furthermore, the research only focused on base and heavy metals, chlorine, potassium, polychlorinated biphenyl, and brominated retardants. Meanwhile, the impact of material flow is the focus of research by Hischier et al. (2005). Tracing the material flow from personal computer recycling in India was revealed by Streicher-Porte et al. (2005). Tasaki et al. (2004) focused their research on Japan’s flow of brominated flame retardants. Studies on the flow of copper materials in waste management were carried out in Europe (Bertram et al., 2002). Huisman (2003) analyzed the environmental performance based on different recycling scenarios of several electronic waste products.
Estimation and calculation of e-waste disposal are needed to find an appropriate e-waste management plan and strategy in Nigeria (Ibrahim et al., 2013). In this research, the MFA method is developed based on the distributor’s sales data model. Other data are used as time and transfer coefficients from one stage to another. Furthermore, the MFA analysis revealed that computer waste still stored is 41%, reuse is 35%, and disposal is about 24%. In addition, projections of computer waste disposal are also carried out for the next 15 years to obtain an overview of the flow of computer waste material. From the results of these projections, it is found that waste storage activities by the community have an impact on the Nigerian government to make and develop plans to accommodate and manage the waste generated (Ibrahim et al., 2013).
The flow of Material from PC products, both CRT and LCD, in Santiago, Chile, consists of several stages, starting from households, repairers, scavengers, collectors, and ending at the factory (Steubing et al., 2010). The study used interviews with used computer shop owners. The informal sector related to computer waste recycling activities is very significant. Furthermore, most households buy used computers from shops or repair shops. As a result, the largest producer of computer waste is households. Thus, a better return scheme is needed to be a solution for households and the informal sector in disposing of and recycling computers that are no longer functioning. In addition, to reduce environmental and occupational health risks from the recycling process, it is necessary to have regulations that adopt better standards (Steubing et al., 2010).
Research conducted by Shinkum and Nguyen Thi Minh (2009) noted that used electronic devices from Japan are widely used in Vietnam and Cambodia. In addition, the e-waste recycling process is carried out in Guangdong, China. In the recycling process, they still do not use environmentally friendly technology. Furthermore, Japan’s percentage of personal computers disposed of for domestic disposal and recycling has decreased to 37%, while the proportion of reuse and exports has increased (Yoshida et al., 2009). Furthermore, Jain and Sareen (2006) apply the MFA method using the market supply method, which uses data generated from electronic product manufacturers in production and sales. A survey method to estimate the amount and flow of e-waste is used by (Nnorom and Osibanjo (2008)), where the volume of e-waste produced has increased in several countries such as China, India, Nigeria, and Chile. The use of the MFA method and the evaluation of economic value as an analytical tool on computer waste in India (Streicher-Porte et al., 2005).
The practice of recycling e-waste always brings informal sector workers in waste management in many developing countries (Schluep et al., 2009; ILO 2014). The reasons that encourage e-waste management and informal recycling workers in developing countries are related to various social and economic factors. Consumers in developing countries are not yet familiar with returning electronics products at the end of their lives and paying for their disposal. It is especially so that many of these countries do not have optimal returns programs for e-waste. In addition, many developing countries accept uncoordinated large quantities of e-waste imports (legal and illegal) as used equipment, and in addition, many developing countries do not yet have e-waste management infrastructure due to low technology investment. Furthermore, weak e-waste regulation in many countries has allowed the informal economy to thrive in the recycling and trading valuable secondary raw materials extracted from e-waste.
Informal sector activities in e-waste recycling generally collect materials with better economic value than solid waste. Based on the flow of materials and the price of used materials described previously, it can be calculated that the economic potential obtained from recycling activities by the informal sector is generally shown in Table 1.
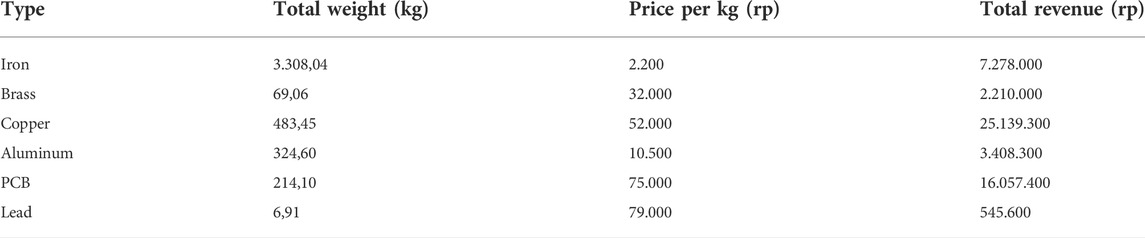
TABLE 1. Economic potential of e-waste in the informal sector.
The analysis results in Table 1 above show the economic potential obtained in each informal sector. Furthermore, from the analysis, it can be seen that Tin material is a material that has a high economic value because the market price for used tin is Rp. 79,000 per kilogram. Then followed by the price of printed circuit boards (PCBs), where the price of used PCBs is Rp. 75,000 per kilogram. Thus, Tin and PCBs are most sought after by informal sector actors.
Figure 4 provides information about the difference in income in each of the informal sectors of e-waste recycling. Furthermore, the highest total income was obtained by Collector 2 of Rp. 38,545,000 per year. Meanwhile, electronic waste collectors who carry out the recycling process earn Rp. 4,407,900 per year. While the first collectors get an income of Rp. 10,792,600 per year.
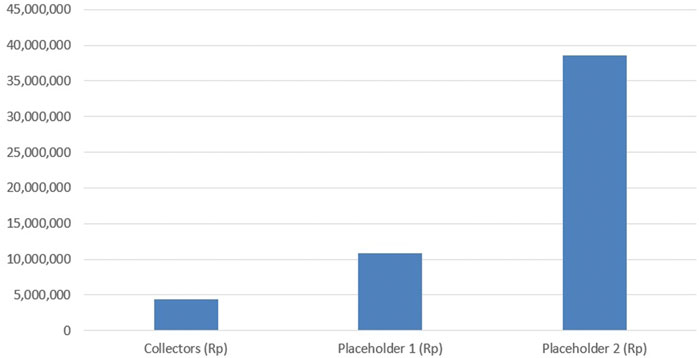
FIGURE 4. Differences in income in each of the informal e-waste recycling sectors.
One of the economic models offered to the world is the circular economy model, where in this model, goods consumed can be reprocessed (Reduce, Reuse, Recycle, Replace, Repair). The waste is reproduced to reduce the impact of waste harmful to the environment and can be reused as new products or as raw materials for other products.
The concept of a circular economy can be said to be the antithesis of a production economy emphasizing linear calculations. So there are elements that are depressed due to continuous production.
One of the implementations of the circular economy among households is the waste bank program. Communities can act as producers and consumers by processing and using household waste. The sorting results can be sold to third parties or used for daily needs.
Based on data obtained from the Ministry of Environment of the Republic of Indonesia website, the number of waste banks throughout Indonesia is around 11,646 units and spread across 34 provinces and 365 cities. Furthermore, the number of recorded customers is around 380 thousand, with a total waste collection of around 1.4 million kg/month. In addition, the total turnover obtained is around Rp. 1,198,935,210 Turnover/Month. Furthermore, this waste bank accepts all types of inorganic waste such as paper, iron, non-bottle plastic, plastic bottles, cardboard, and duplex. Based on this information, it can be seen that the Waste Bank has a high potential as a model in the circular economy.
Figure 5 illustrates the Electronic Waste Bank mediates economic circularity by collecting household electronic waste. Furthermore, Figure 5 shows that the blue arrow lines represent household electronic waste. The black arrows depict the movement of electronic waste from households to the Electronic Waste Bank, collectors, and ending up in the recycling industry. Furthermore, the green arrow is the result of recycling (raw material) processed by the recycling industry to the electronics manufacturing industry, which is then reprocessed into new electronic products. Meanwhile, the yellow arrow represents the economic value obtained from the sale of electronic waste, which starts from the recycling industry to collectors, electronic waste banks to households.
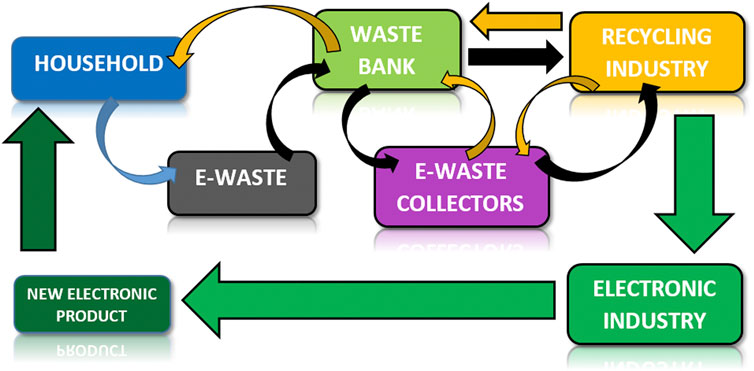
FIGURE 5. Conceptual model of circular economy implementation through waste bank.
Furthermore, people who have registered as customers at the e-waste bank will receive economic benefits from selling e-waste either directly or indirectly. In addition, the electronic waste’s sale value results from an agreement between the waste bank manager and the community.
In EWB operations, circularity is also mediated by the electronic waste collection, which is further classified by type without any recycling process. The absence of a recycling process at EWB aims to reduce the impact of pollution and decrease the quality of public health around the waste bank. EWB only functions as a collector and organizes the process of transferring electronic waste to electronic waste collectors or the recycling industry. EWB can also take advantage of CSR programs from companies with environmental quality improvement programs.
Electronic Waste Bank (EWB) generally does not yet have a definition based on existing regulations. However, in principle, the definition or definition of an Electronic Waste Bank can refer to the definition of a general Waste Bank. The Regulation of the State Minister of the Environment No. 13 of 2012 defines a Waste Bank as a place for sorting and collecting waste that can be recycled and reused, which has economic value. The study by Wijayanti and Suryani (2015) noted that one approach of waste management that is based in the community and allows the general public to participate in environmental management activities is the waste bank. In order to encourage community members to manage their garbage autonomously in their homes and equally convert it into savings, waste management has several tools at its disposal. The instruments must ensure a mutual relationship for the public to enjoy and gain from the participation process truly.
The Electronic Waste Bank (EWB) can be played as a collection/dropping point, which is a place where the public can return electronic waste that is suitable for recycling, reuse, and saleable, which is subject to EPR provisions. The economic value of electronic waste saved in an electronic waste bank incentivizes the public to be willing to sort and collect electronic waste. Meanwhile, from the producer’s point of view, an electronic waste bank is a collection/dropping point designed as a starting point to recall electronic products that have expired and are subject to EPR provisions. Electronic waste banks make it easier for producers because they do not need to build new collection/dropping points. Consequently, the producer is obliged to finance the electronic waste bank’s capital and implementation, which is mutually agreed upon based on the weight and price of the electronic waste transacted.
In general, the working mechanism of an electronic waste bank is almost the same as a conventional waste bank, where there are customers, bookkeeping, and management. The usual bank (conventional) deposited by the customer is money. Thus, in the electronic waste bank deposited by the public or customers, electronic waste has potential economic value. Meanwhile, the manager of the electronic waste bank must be a person who is creative and innovative and has an entrepreneurial spirit that aims to encourage people to deposit electronic waste through an electronic waste bank.
The formation of a waste bank can be carried out in several stages, which are illustrated in the Figure 6 below:
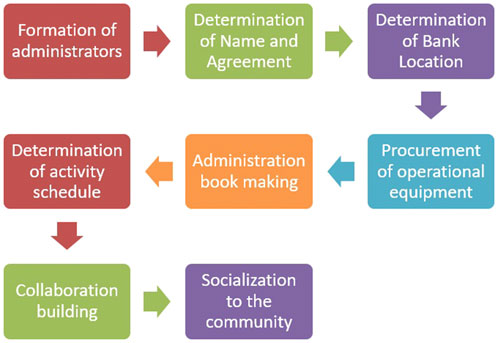
FIGURE 6. Stages of establishing the Electronic Waste Bank system.
The process of establishing and developing an electronic waste bank. Figure 6 provides information on the mechanism for establishing an electronic waste bank. This picture begins with forming an electronic waste bank organizational management resulting from a mutual agreement with the community and local government. Based on the results of the preparation of the organizational structure, proceed with the determination of the name of the electronic waste bank and mutual agreement. In the next stage, the electronic waste bank’s location will be easily accessible to the public. Meanwhile, in the next stage, operational equipment for the electronic waste bank can be procured. Equipment procurement activities can be carried out simultaneously with creating a waste bank savings book. After all the equipment and administrative books are completed, the next step is determining the schedule of activities tailored to the community’s activities. At the stage of forming cooperation, it can be done after making a schedule of activities at the waste bank. The last stage of this mechanism is socialization to the entire community regarding registering electronic waste bank members.
To be able to establish and develop BSE, several stages can be followed, as follows:
The initial socialization is the stage of introduction and debriefing related to knowledge about electronic waste banks to the public. Several things can be conveyed during this initial socialization, such as the definition of an electronic waste bank, why an electronic waste bank is a choice for electronic waste management, the mechanism for collecting electronic waste, and the distribution system for the sale of electronic waste. At the socialization stage it is more focused on emphasizing the positive side of electronic waste banks as a solution to managing electronic waste in the community. Thus the expected target is that the public can participate in the implementation of the electronic waste bank system.
Technical implementation can be carried out if there has been an agreement between residents on the implementation of the electronic waste bank. So, based on this, a more intense meeting can be held to provide a more detailed and complete explanation regarding the standard of the electronic waste bank system, the working mechanism of the bank, and the benefits derived from the electronic waste bank system. Thus, residents become more confident during the implementation of collection and deposit to the electronic waste bank. The follow-up meeting can also be a forum to agree on the name of the electronic waste bank, management, office location, weighing station, manufacturing company partners or electronic product companies, and the schedule for depositing electronic waste.
The implementation of the electronic waste bank can be carried out on a mutually agreed day. Management prepares administrative needs and operational equipment for electronic waste banks. Customers or people who have registered come to the location of the electronic waste bank office by bringing electronic waste. In addition, electronic waste bank administrators can also take electronic waste to residents’ homes according to the agreement. The customer will receive the money after the weighing and recording process. Furthermore, the money will be saved according to the amount that has been deposited.
Many challenges and problems may arise during the electronic waste bank journey, so the mentoring process from higher education institutions or community organizations must continue to assist as long as the electronic waste bank system is running. Thus, it can support finding alternative solutions to the problems at hand. The evaluation process is carried out as a form of control so that the implementation mechanism of the electronic waste bank can run well under the target that is the plan established an electronic waste bank.
The electronic waste bank system can be developed into several activities if it has been running well, for example, basic food business units, cooperatives, and business capital loans, or developed according to the needs of the community around the electronic waste bank. For example, if the electronic waste bank is located where most of the population works as farmers, it can be developed into a cooperative unit providing plant seeds and fertilizers. In developing electronic waste banks into business units, the proper direction is needed in managing the legality of these business entities.
The Working Mechanism of Waste Banks In the Regulation of the State Minister of the Environment of the Republic of Indonesia Number 13 of 2012 Article 5 concerning Guidelines for the Implementation of Reduce, Reuse, and Recycle through Waste Banks, there are working mechanisms of Waste Banks, namely:
1) The selection of customer waste must sort electronic waste before being deposited into an electronic waste bank, where electronic waste is sorted by electronic waste category: large household appliances, electrical and electronic equipment, communication products, lights, batteries, and others.
2) The delivery of waste to the electronic waste bank is carried out according to the agreed schedule.
3) Electronic waste deposited into an electronic waste bank is then separated according to the product type.
3) The officer records the type and amount of electronic waste after separation. The results are then converted into rupiah values written in the savings book.
4) The proceeds from the sale of electronic waste submitted are entered into a savings book, and profit sharing from the sale of electronic waste between savers and implementers.
5) The Waste Bank has collaborated with electronics companies or other manufacturing companies appointed and agreed upon so that the collected electronic waste is immediately transported to the following electronics processing site.
The process or management of electronic waste in an electronic waste bank can be seen in the Figure 7 below.
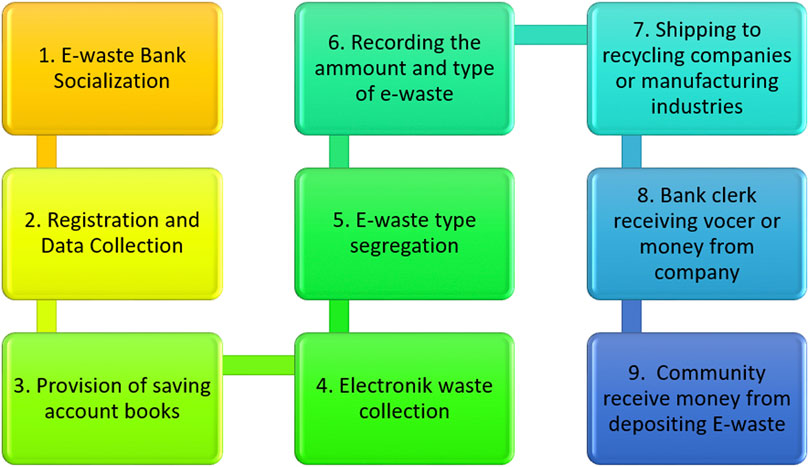
FIGURE 7. Mechanism of waste management in electronic waste bank.
Waste management is one form of implementing a circular economy. The Ellen MacArthur Foundation, 2013 (2013:7), a community that popularized the circular economy, argues that the core of the circular economy is to design waste, so the products consumed can be recycled and used as a source of reproduction. Second, segregation of long-term and short-term waste. Third, the energy needed in this system is green, reducing the use of non-renewable energy sources.
The above statement makes waste management the main design of the circular economy concept by examining product components and paying attention to the energy sources used to manage these products. In the picture, it can be seen that the waste from consumption was selected into two types, namely manufacturing and food. Before being disposed of directly, as consumers, we can recycle the waste into various processed products.
A statement from (Rizoa et al., 2017) (2017:6) emphasizes that waste management is a critical aspect of the circular economy, where reducing, reusing, and recycling activities will affect the production cycle. In a circular economy, waste management is carried out by both producers and consumers. Based on research by (Nells et al., 2016) (2016:3) on waste management in Germany, the circular economy aims to turn waste management into resource management. Raw materials used for the industry are obtained from processed waste. Germany built a sewage treatment plant, opened up job opportunities, and succeeded in inviting large industrial industries to participate in their waste management. Circular models like this provide benefits not only for humans but also for the environment. By referring to the definitions above, the circular economy approach, the emphasis is on micro design, where externalities (waste) can be managed properly, so that waste can also benefit the economic cycle and provide added value to the environment by reducing the impact of pollution.
The concept of sustainable development is closely related to environmental problems. In this concept, economic growth still needs to be maintained by considering its ecological and social aspects. For this reason, a new concept is needed in understanding economic growth that is in line with sustainable development. Seeing this urgency, the concept of green growth has become a focus in pursuing sustainable development. Green growth is an effort to make the process of economic growth run by using more efficient, cleaner, and more resilient resources without slowing down the economic growth rate (Hallegatte et al., 2012).
A green economy discipline studies efforts to achieve sustainable development through green economic growth. The process of green growth in line with sustainable development can be achieved by implementing a circular economy. A circular economy is an economy built on a production-consumption system that maximizes the use of output from a linear energy production and consumption system (Korhonen et al., 2018).
The circular economy is based on an integrative approach that considers the relevant factors to shift from the classical linear economic growth model (Androniceanu et al., 2021). The circular economy can be understood as an alternative model that will encourage producers to find innovative solutions to reducing waste production and in line with green production and efficient use of resources (Stankevičienė et al., 2020).
The manifestation of this concept is the application of the 5R principles in economic activities, namely Reduce, Reuse, Recycle, Recover, and Revalue. The application of the circular economy in the form of the recycling industry is projected to have the potential to create 1,000 new companies and more than 3 million employees throughout Indonesia. It could contribute US$ 14 billion or equivalent to Rp 200 trillion to GDP by 2030 (Mairizal et al., 2021), reduce waste by 50 percent, and reduce greenhouse gas emissions by 29–41 percent by 2030 (Fasa, 2021).
Schroeder et al. (2019) noted that several SDG targets are closely related to the circular economy concept, for example, target 6, to ensure the availability and management of clean water. In addition, target 7 ensures access to affordable, reliable, sustainable and modern energy. Target 8 is to promote inclusive and sustainable economic growth, comprehensive and productive employment opportunities, and decent work for all. Target 12 is to ensure sustainable patterns of production and consumption. Target 15 is protecting, restoring, and promoting sustainable use of terrestrial ecosystems, managing forests sustainably, stopping desertification, reversing land degradation, and halting biodiversity.
Furthermore, although implementing a circular economy in Indonesia is an opportunity to increase GDP and economic growth rates as well as environmental conservation, there are several challenges and obstacles to its implementation. These challenges and obstacles, broadly speaking, include information literacy; changing the behavior/habits of consumers and producers to adapt to the new habits of the 5R principles; product market; capital that requires an investment of at least 18 billion dollars; environmentally friendly technological innovation; human resource capacity; lack of infrastructure support capacity; and an adequate, clear and firm regulatory framework.
Government policies encourage the implementation of a circular economy, namely Presidential Regulation Number 97 of 2017 concerning National Policies and Strategies for the Management of Household Waste and Waste Similar to Household Waste (Perpres Jaktranas). The Perpres Jaktranas contains two things: policy directions for reducing and handling household waste and similar household waste; and strategies, programs, and targets for reducing and handling household waste and household-like waste. The policy target based on the Jaktranas Presidential Regulation is the reduction of household waste and waste similar to household waste by 30 percent or 20.9 million tons; and the handling of household waste and waste similar to household waste by 70 percent or 49.9 million tons in 2025, compared to the projected landfill of 70.8 million tons. The scope of policies, strategies, and programs that involve multi-stakeholders, namely ministries and institutions at the central and regional (provincial, city/district) levels in a synergistic manner.
Waste management policies are regulated in Presidential Regulation Number 83 of 2018 concerning Marine Waste Management. In this Presidential Regulation, there is an Action Plan for Handling Marine Debris 2018–2025 which is embodied through strategies, including a national movement to increase stakeholder awareness; waste management originating from the land; waste management on the coast and the sea; financing mechanisms, institutional strengthening, supervision, and law enforcement; and research and development. The existence of this policy is a form of follow-up to the government’s commitment to handling marine plastic waste by up to 70 percent by 2025.
Preparing a circular economy National Action Plan (RAN) is currently underway in its development. This preparation is very much needed because implementing a circular economy is not merely a business matter but also requires a framework that policy makers, namely support from the government. In the formulation of circular economy policies, there are three main scopes of regulations: first, product manufacturing, which includes the management of reuse, repair, recycling, and re-value in the context of manufacturing (manufacturing). Second, support for environmentally friendly technology research and innovation. Third, providing a market ecosystem for environmentally friendly products (Milios, 2018). In addition, due to its relationship with environmental conservation efforts and social aspects, in formulating policies, it is necessary to apply risk mitigation (Johansson et al., 2020).
The circular economy implementation policy is multi-sectoral and requires the synergistic involvement of relevant stakeholders because an upstream to downstream regulatory scheme is needed. Stakeholders in policy formulation consist of government, business/industry, academia, and civil society within the framework of the quadruple helix model. The government is a regulator in providing legal framework support, financing mechanisms, and governance. Moreover, academics function in environmentally friendly technology research, innovation activities, and scientific recommendations. Furthermore, the industrial business sector develops business models and products and implements sustainable production. In addition, civil society functions in information literacy to the public, linking cooperation networks and monitoring and evaluating policies.
One of the world’s most significant and fastest growing industrial industries today is the electronics industry. E-waste accumulates more than three times faster than other types of waste. The e-waste bank (WB) model can offer a solution by linking e-waste sources with manufacturers or recycling businesses and enabling the exchange of recyclable waste for money. This study shows that there are economic benefits derived from recycling activities. Furthermore, the e-waste model can be one of the solutions to drive the circular economy in Indonesia. In addition, there are several difficulties and obstacles in implementing a circular economy in Indonesia, although there are opportunities to increase GDP and the rate of economic growth and environmental preservation. Because a regulatory framework is needed from upstream to downstream, the circular economy implementation policy is multi-sectoral and requires cooperative participation from related parties.
The original contributions presented in the study are included in the article/Supplementary Material, further inquiries can be directed to the corresponding author.
DR developed ideas and wrote down the contents of the manuscript. SS contributed as the supervisor, and corrected the content along with corresponding authors. N contributed as the supervisor and corrector. US contributed as the supervisor and corrector.
The authors declare that the research was conducted in the absence of any commercial or financial relationships that could be construed as a potential conflict of interest.
All claims expressed in this article are solely those of the authors and do not necessarily represent those of their affiliated organizations, or those of the publisher, the editors and the reviewers. Any product that may be evaluated in this article, or claim that may be made by its manufacturer, is not guaranteed or endorsed by the publisher.
The Supplementary Material for this article can be found online at: https://www.frontiersin.org/articles/10.3389/fbuil.2022.1030196/full#supplementary-material
Abalansa, S., El Mahrad, B., Icely, J., and Newton, A. (2021). Electronic waste, an environmental problem exported to developing countries: The GOOD, the BAD and the UGLY. Sustainability 13, 5302. doi:10.3390/su13095302
Albuquerque, C. A., Mello, C. H. P., Paes, V. C., Balestrassi, P. P., and Souza, L. B. (2018). “Electronic junk: Best practice of recycling and production forecast case study in Brazil,” in Lecture notes in management and industrial engineering (Berlin, Heidelberg, Germany: Springer), 127–134.
Amankwah-Amoah, J. (2016). Global business and emerging economies: Towards a new perspective on the effects of e-waste. Technol. Forecast. Soc. Change 105, 20–26. doi:10.1016/j.techfore.2016.01.026
Androniceanu, A., Kinnunen, J., and Georgescu, I. (2021). Circular economy as a strategic option to promote sustainable economic growth and effective human development. J. Int. Stud. 14 (1), 60–73. doi:10.14254/2071-8330.2021/14-1/4
Armijo, C., Puma, A., and Ojeda, S. (2011). “A set of indicators for waste management programs,” in Proceedings of the 2nd International Conference on Environmental Engineering and Applications (ICEEA 2011), Shanghai, China, 19–21 August 2011 (IACSIT Press).
Babu, B. R., ParandeA, K., and Basha, C. A. (2007). Electrical and e-waste: A global environmental problem. Waste manage. Res. 25, 307–318. doi:10.1177/0734242x07076941
Bertram, M., Graedel, T. E., Rechberger, H., and Spatari, S. (2002). The contemporary European copper cycle: Waste management subsystem. Ecol. Econ. 42, 43–57. doi:10.1016/s0921-8009(02)00100-3
Borthakur, A. (2016). International perspectives/special report: Health and environmental hazards of electronic waste in India. J. Environ. Health 78, 18–23.
Borthakur, A., and Singh, P. (2020). Mapping the emergence of research activities on E-waste: A scientometric analysis and an in-depth review. Amsterdam, Netherlands: Elsevier, 191–206.
Brunner, P. H., and Rechberger, H. (2004). Practical handbook of material flow analysis. Boca Raton(EN): Lewis Publishers.
Cesaro, A., Belgiorno, V., Vaccari, M., Jandric, A., Chung, T. D., Dias, M. I., et al. (2017). A device-specific prioritization strategy based on the potential for harm to human health in informal WEEE recycling. Environ. Sci. Pollut. Res. 25, 683–692. doi:10.1007/s11356-017-0390-7
Clarke, C., Williams, I. D., and Turner, D. A. (2019). Evaluating the carbon footprint of WEEE management in the UK. Resour. Conserv. Recycl. 141, 465–473. doi:10.1016/j.resconrec.2018.10.003
Cucchiella, F., d'Adamo, I., Koh, S. L., and Rosa, P. (2015). Recycling of WEEEs: An economic assessment of present and future e-waste streams. Renew. Sustain. Energy Rev. 51, 263–272. doi:10.1016/j.rser.2015.06.010
Fasa, A. W. H. (2021). Legal aspects and the policies of the Indonesian government regarding circular economy in order to achieve sustainable development goals. Rechtsvinding J. 10, 3. doi:10.33331/rechtsvinding.v10i3.774
Forti, V., Baldé, C. P., Kuehr, R., and Bel, G. (2020). The global E-waste monitor 2020: Quantities, flows, and the circular economy potential. Tokyo, Japan: United Nations University.
Greenpeace (2008). Poisoning the poor electronic waste in Ghana. Available at: https://www.resource-recovery.net/sites/default/files/poisoning_the_poor_electronic_waste_in_ghana.pdf (Accessed June 2, 2022).
Hallegatte, S., Heal, G., Fay, M., and Treguer, D. (2012). From growth to green growth – a framework. Cambridge, Massachusetts, United States: National Bureau of Economic Research.
Hinterberger, F., Giljum, S., and Hammer, M. (2003). Material flow accounting and analysis (MFA). A valuable tool for analyses of society–nature interrelationships. Vienna: Europe Research Institute.
Hischier, R., Wager, P., and Gauglhofer, J. (2005). Does WEEE recycling make sense from an environmental perspective? The environmental impacts of the Swiss take-back and recycling systems for waste electrical and electronic equipment (WEEE). Environ. Impact Assess. Rev. 25 (5), 525–539. doi:10.1016/j.eiar.2005.04.003
Holgate, P. (2018). How do we tackle the fastest growing waste stream on the planet? Geneva, Switzerlands: World Economic Forum.
Huisman, J., Magalini, F., Kuehr, R., Maurer, C., Ogilvie, S., Poll, J., et al. (2021). Review of directive 2002/96 on waste electrical and electronic equipment (WEEE)—final report. Brussels, Belgium: European Comission.
Huisman, J. (2003). The QWERTY/EE concept, quantifying recycability and eco-efficiency for end-of-life treatment of consumer electronic products. Delft: Delft University of Technology.
Ikhlayel, M. (2018). An integrated approach to establish e-waste management systems for developing countries. J. Clean. Prod. 170, 119–130. doi:10.1016/j.jclepro.2017.09.137
International Labour Organization (2014). Tackling informality in e-waste management: The potential of cooperative enterprises, international labour office sectoral activities department (SECTOR). Geneva: Cooperatives Unit.
Islam, A., Ahmed, T., Awual, R., Rahman, A., Sultana, M., Aziz, A. A., et al. (2020). Advances in sustainable approaches to recover metals from e-waste-A review. J. Clean. Prod. 244, 118815. doi:10.1016/j.jclepro.2019.118815
Jain, A., and Sareen, R. (2006). E-waste assessment methodology and validation in India. J. Mat. Cycles Waste Manag. 8, 40–45. doi:10.1007/s10163-005-0145-2
Johansson, N., Velis, C., and Corvellec, H. (2020). Towards clean material cycles: Is there a policy conflict between circular economy and non-toxic environment? Waste Manag. Res. 38 (7), 705–707. doi:10.1177/0734242x20934251
Kang, H. Y., and Schoenung, J. M. (2006). Estimation of future outflows and infrastructure needed to recycle personal computer systems in California. J. Hazard. Mater. 137 (2), 1165–1174. doi:10.1016/j.jhazmat.2006.03.062
Korhonen, J., Honkasalo, A., and Seppälä, J. (2018). Circular economy: The concept and its limitations. Ecol. Econ. 143, 37–46. doi:10.1016/j.ecolecon.2017.06.041
Kumar, P., and Shrihari, S. (2007). “Estimation and material flow analysis of waste electrical and electronic equipment (WEEE) - a case study of mangalore city, Karnataka, India,” in Proceedings of the International Conference on Sustainable Solid Waste Management, Chennai, India, 5-7 September 2007, 148–154.
Lodhia, S., Martin, N., and Rice, J. (2017). Extended producer responsibility for waste televisions and computers: A regulatory evaluation of the Australian experience. J. Clean. Prod. 164, 927–938. doi:10.1016/j.jclepro.2017.07.020
Mairizal, Aulia Qisthi, Sembada, A. Y., Tse, K. M., and Rhamdhani, M. A. (2021). Electronic waste generation, economic values, distribution map, and possible recycling system in Indonesia. J. Clean. Prod. 293, 126096. doi:10.1016/j.jclepro.2021.126096
Milios, L. (2018). Advancing to a circular economy: Three essential ingredients for a comprehensive policy mix. Sustain. Sci. 13 (3), 861–878. doi:10.1007/s11625-017-0502-9
Morf, L., and Taverna, R. (2004). Metallische und nichtmetallische Stoffe im Elektronikschrott. Schriftenreihe Umwelt Nr. 374, Hg. Bundesamt für Umwelt, Wald und Landschaft (BUWAL). Bern: Bern University of Technology.
Nells, M., Grünes, J., and Morscheck, G. (2016). Waste management in Germany, development to a suistainable circular economy? Procedia Environ. Sci. 35, 6–14. doi:10.1016/j.proenv.2016.07.001
Nnorom, I. C., and Osibanjo, O. (2008). Electronic waste (e-waste): Material flows and management practices in Nigeria. Waste Manag. 28 (8), 1472–1479. doi:10.1016/j.wasman.2007.06.012
Oguchi, M., Kameya, T., Yagi, S., and Urano, K. (2008). Product flow analysis of various consumer durables in Japan. Resour. Conservation Recycl. 52, 463–480. doi:10.1016/j.resconrec.2007.06.001
Perkins, D. N., Drisse, M. N. B., Nxele, T., and Sly, P. D. (2014). E-Waste: A global hazard. Ann. Glob. Health 80, 286–295. doi:10.1016/j.aogh.2014.10.001
Rabani, B., and Thakur, B. (2020). Recycling potential of E-waste for jammu city. Int. J. Prog. Res. Sci. Eng. 1, 29–32.
Raharjo, S., Matsumoto, T., Ihsan, T., Rachman, I., and Gustin, L. (2017). Community-based solid Waste Bank program for municipal solid waste management improvement in Indonesia: A case study of padang city. J. Mat. Cycles Waste Manag. 19 (1), 201–212. doi:10.1007/s10163-015-0401-z
Raharjo, S., Wulandari, S., and Fitriani, S. (2021). waste Bank system improvement for electronic waste recycling in Indonesia: A case study of padang city. IOP Conf. Ser. Earth Environ. Sci. 802, 012053. doi:10.1088/1755-1315/802/1/012053
Rizoa, V., Toukko, K., and Behrens, A. (2017). The circular economy: A review of definitions, processes and impacts. Brussels, Belgium: Centre for European Policy Studies.
Robinson, B. H. (2009). E-waste: An assessment of global production and environmental impacts. Sci. Total Environ. 408, 183–191. doi:10.1016/j.scitotenv.2009.09.044
Rochman, F. F., Ashton, W. S., and Wiharjo, M. G. M. (2017). E-waste, money and power: Mapping electronic waste flows in Yogyakarta, Indonesia. Environ. Dev. 24, 1–8. doi:10.1016/j.envdev.2017.02.002
Schluep, M., Hagelüken, C., Kuehr, R., Magalini, F., Maurer, C., Meskers, C., et al. (2009). Sustainable innovation & technology transfer industrial sector studies: Recycling from e-waste to resources. Available at: http://www.unep.org/pdf/Recycling_From_e-waste_to_resources.pdf (Accessed July 14, 2016).
Schroeder, P., Anggraeni, K., and Weber, U. (2019). The relevance of circular economy practices to the sustainable development goals. J. Industrial Ecol. 23 (1), 77–95. doi:10.1111/jiec.12732
Stankevičienė, J., Nikanorova, M., and Çera, G. (2020). Analysis of green economy dimension in the context of circular economy: The case of baltic sea region. E a M. Ekon. a Manag. 23 (1), 4–18. doi:10.15240/tul/001/2020-1-001
Steubing, B., Böni, H., Schluep, M., Silva, U., and Ludwig, C. (2010). Assessing computer waste generation in Chile using material flow analysis. Waste Manag. 30, 473–482. doi:10.1016/j.wasman.2009.09.007
Streicher-Porte, M., Widmer, R., Jain, A., Bader, H. P., Scheidegger, R., and Kytzia, S. (2005). Key drivers of the e-waste recycling system: Assessing and modelling e-waste processing in the informal sector in Delhi. Environ. Impact Assess. Rev. 25, 472–491. doi:10.1016/j.eiar.2005.04.004
Tasaki, T., Hashimoto, S., Terazono, A., and Moriguchi, Y. (2004). Product-level material flow anylsis: A case study of car in Japan. Brussels, Belgium: Centre for European Policy Studies.
The Ellen MacArthur Foundation (2013). . Available at: https://www.ellenmacarthurfoundation.org/publications.Towards the circular economy, opportunities for the consumer goods sector
Wang, B., Ren, C., Dong, X., Zhang, B., and Wang, Z. (2019). Determinants shaping willingness towards on-line recycling behaviour: An empirical study of household e-waste recycling in China. Resour. Conserv. Recycl. 143, 218–225. doi:10.1016/j.resconrec.2019.01.005
Wang, Z., Zhang, B., and Guan, D. (2016). Take responsibility for electronic-waste disposal. Nature 536, 23–25. doi:10.1038/536023a
Keywords: e-waste, waste bank, strategy, circular economy, informal sector, sustainability
Citation: Rimantho D, Syaiful S, Nurfaida and Sulandari U (2022) Electronic waste bank model as a solution for implementing circular economy: Case study DKI Jakarta-Indonesia. Front. Built Environ. 8:1030196. doi: 10.3389/fbuil.2022.1030196
Received: 28 August 2022; Accepted: 11 October 2022;
Published: 24 October 2022.
Edited by:
Viktoria Mannheim, University of Miskolc, HungaryReviewed by:
Klara Tóthné Szita, EMI nltd Hungary, HungaryCopyright © 2022 Rimantho, Syaiful, Nurfaida and Sulandari. This is an open-access article distributed under the terms of the Creative Commons Attribution License (CC BY). The use, distribution or reproduction in other forums is permitted, provided the original author(s) and the copyright owner(s) are credited and that the original publication in this journal is cited, in accordance with accepted academic practice. No use, distribution or reproduction is permitted which does not comply with these terms.
*Correspondence: Dino Rimantho, ZGluby5yaW1hbnRob0B1bml2cGFuY2FzaWxhLmFjLmlk
Disclaimer: All claims expressed in this article are solely those of the authors and do not necessarily represent those of their affiliated organizations, or those of the publisher, the editors and the reviewers. Any product that may be evaluated in this article or claim that may be made by its manufacturer is not guaranteed or endorsed by the publisher.
Research integrity at Frontiers
Learn more about the work of our research integrity team to safeguard the quality of each article we publish.