 Chuloh Jung
 Naglaa Sami Abdelaziz Mahmoud
 Nahla Alqassimi
95% of researchers rate our articles as excellent or good
Learn more about the work of our research integrity team to safeguard the quality of each article we publish.
Find out more
ORIGINAL RESEARCH article
Front. Built Environ. , 16 September 2022
Sec. Indoor Environment
Volume 8 - 2022 | https://doi.org/10.3389/fbuil.2022.1018395
This article is part of the Research Topic Design of Efficient and Healthy Buildings View all 6 articles
Much previous research in different countries describes a strong dependence on temperature and humidity for indoor air pollutants generated from building materials. Since many types of building materials are complexly applied in residential buildings in UAE and are constantly using air-conditioning, the result might be different from the characteristics of indoor air pollutants from a small chamber experiment. This paper aims to investigate the relationship between the concentration of indoor air pollutants according to changes in temperature and humidity in newly built apartments before moving in. As a methodology, a field measurement was performed in 23 housing units in five different residential towers in Ajman, United Arab Emirates. Before the measurement, a 7-day bake-out was completed, and the target units were measured 30 days before moving in. The result showed that formaldehyde (HCHO) and VOCs such as benzene (C6H6), toluene (C7H8), ethylbenzene (C8H10), xylene (C8H10), and styrene (C8H8) have consistent humidity dependence within the range of 15 %–60% of relative humidity (RH). It was impossible to confirm the temperature dependency since it showed different characteristics for each apartment between 22°C and 33°C. There is a limit to predicting the occurrence of indoor air pollutants in the apartment only with microclimatic factors since there are many other variables, such as various building materials, management history of materials, and construction methods. However, it was proven that there is an emission cut-off point where the generation of indoor air pollutants deviates from a linear relationship in the RH 40%–50% and 25°C. These temperature and humidity ranges are synchronized with daily life ranges.
The residents of Dubai spend more than 90% of their time indoors due to hot arid desert weather (Jung and Awad, 2021a). This lifestyle makes them easily exposed to Sick Building Syndrome (SBS) faster than in any other metropolis (Awad and Jung, 2021). An environment with poor indoor air quality deteriorates the health of the occupants (Jung and Al Qassimi, 2022). Formaldehyde (HCHO) and Volatile Organic Compounds (VOCs) such as Benzene (C6H6), Toluene (C7H8), Ethylbenzene (C8H10), Xylene (C8H10), and Styrene (C8H8) are representative indoor air pollutants (Arar and Jung, 2021).
The generation of these indoor air pollutants from building materials is the main factor affecting the indoor air pollution of the residential environment (Jung et al., 2021a; Jung and Awad, 2021b). VOC emission from building materials is affected by the environmental conditions to which the materials are exposed and the influence of internal characteristics such as the type of material and the total amount of VOC contained in the material (Jung et al., 2021b). For Indoor Air Quality (IAQ) tests related to building materials, data are primarily collected under controlled environmental conditions such as small chamber tests since they can control other contaminants and experimental conditions, and most target materials with a clear history (Darling et al., 2012; Yauk et al., 2020). Therefore, it is possible to identify contaminants’ emission mechanisms and influencing factors in building materials via a small chamber experiment (Uhde and Schulz, 2015).
However, experiments on generating hazardous substances under controlled conditions have very different emission characteristics than living spaces such as apartments (Lee et al., 2012; Xue et al., 2016). Compared to the small chamber environment, the indoor environment is affected by microclimate factors subject to a wide variety of interior finishing materials, and control is limited (Zheng et al., 2011).
It is reported that VOC emission in building materials generally depends on temperature and humidity, which are representative of indoor microclimate factors (Xiong et al., 2013; Xie and Suuberg, 2021). In addition, the characteristics of these building materials will affect the indoor air condition of the house (Xiong and Zhang, 2010).
Several previous studies have reported seasonal changes in the concentration of temperature and humidity influence factors (Chithra and Nagendra, 2012; Deng and Lau, 2019). Most studies are on the solid relationship between the indoor concentration of Formaldehyde (HCHO) and temperature and humidity or suggest a linear relationship between temperature and absolute humidity (Sachan et al., 2017). There is a lack of research on the effects of pollutants in indoor spaces by focusing on temperature and humidity factors (Al Horr et al., 2016).
Therefore, this study investigates the relationship between the concentration of indoor air pollutants according to changes in temperature and humidity in newly built apartments before moving in.
Volatile Organic Compounds (VOCs) emit toxic indoor air pollutants from certain solids or liquids. VOCs such as Formaldehyde (HCHO), Benzene (C6H6), Toluene (C7H8), Ethylbenzene (C8H10), Xylene (C8H10), and Styrene (C8H8) are known for adverse health effects and VOCs concentration is usually ten times higher in indoors than outdoors. VOCs are emitted by a wide array of products numbering in the thousands.
Exposure to VOCs can cause a variety of negative health effects called SBS (Sick Building Syndrome), including irritation to the eyes, nose, and throat, headaches and the loss of coordination, nausea, and damage to the liver, kidneys, or central nervous system (Table 1). Some VOCs are suspected or proven carcinogens. Benzene (C6H6) and Ethylbenzene (C8H10) exposure are linked with an increased risk of leukemia and hematopoietic cancers. Toluene (C7H8) and Xylene (C8H10) are non-carcinogenic, but they may produce reproductive adverse effects; especially when exposures are chronic at low to high concentrations (Masekameni et al., 2019).

TABLE 1. The effects of hazardous substances on the human body.
VOCs are widely used as ingredients in household products such as paints, varnishes, and wax for cleaning, disinfecting cosmetics, degreasing, and hobby products. Fuels are also made up of organic chemicals. All of these products can release organic compounds while you are storing or using them.
Table 2 shows the physical properties of typical chemical substances reported in indoor environments: Formaldehyde (HCHO), Benzene (C6H6), Toluene (C7H8), Ethylbenzene (C8H10), Xylene (C8H10), and Styrene (C8H8). The intrinsic properties of these chemicals also act as a direct cause of differences in the emission properties of chemicals.
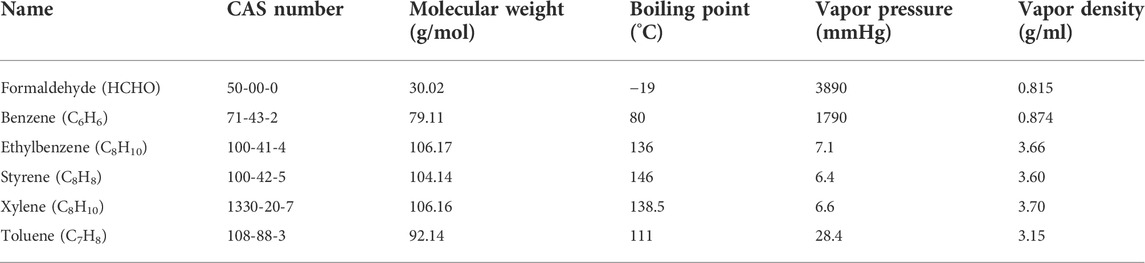
TABLE 2. Physical intrinsic properties of chemical substances.
In the relationship between a chemical’s intrinsic boiling point and volatility, the one with the lower boiling point vaporizes first, and the higher the volatility (Mirzaei et al., 2016). The boiling point is a measure of intermolecular attraction because a high boiling point means solid intermolecular attraction (Zhong et al., 2012). In addition, intermolecular attraction is generally said to be highly volatile when the molecular weight is negligible. The smaller the molecular weight is, the weaker the intermolecular force is and thus evaporates quickly (Regmi et al., 2012; Ravula et al., 2019).
Da Silva et al. (2017) reported that, in the case of individual VOC chemicals, the relationship between the boiling point and the concentration in the chamber showed a negative linear relationship, and a chemical with a high boiling point showed a low concentration in the small chamber.
Also, considering the relationship between vapor pressure and volatile chemical substances, vapor pressure refers to the partial pressure of water vapor in the atmosphere (Chapman, 2011). Chemical substances with high vapor pressure are more likely to evaporate on the surface of the liquid, and at this time, the volatility increases (Torimoto et al., 2010). Vapor pressure is related to the nature of the liquid to vaporize, and if the vapor pressure is high, the tendency of molecules to evaporate occurs. As the temperature rises, the water vapor pressure increases; thus, the emission of chemicals tends to depend on the water vapor pressure (Shirazi et al., 2019). Therefore, temperature’s effect on chemical emission is due to the positive impact of temperature on the diffusion of VOCs and water vapor pressure (Chung et al., 2019).
Xu and Zhang (2011) reported that the relationship between vapor pressure and chamber concentration of individual VOC chemicals showed a static linear relationship and that chemicals with high vapor pressure had higher chamber concentrations. On the other hand, the relationship between the polarity and volatility of chemicals is that non-polar components are highly volatile (Aruoja et al., 2014). Those soluble in water are highly polar, and those insoluble in water are non-polar. Most nonpolar molecules are highly volatile because of the low intermolecular attraction (Zhang et al., 2017).
Rizk et al. (2016) reported that the adsorption of VOC chemicals in flooring materials is generally divided into two types, namely, hydrophilic and hydrophobic, related to the proportionality constant of polarity and non-polarity. Water molecules tend to adsorb hydrophilic substances. Therefore, when the Relative Humidity (RH) increases, the hydrophilic chemical is further desorbed, thus the amount of emission in the room (Huang et al., 2021).
In other words, the volatility of chemical substances is related to experimental environments, such as temperature and humidity. As the temperature and absolute humidity increase, the vapor pressure rises, and volatility occurs when the vapor pressure increases (Davis et al., 2016). Therefore, indoor building materials can be predicted to volatilize actively in an environment with a high temperature, increasing the amount of generation indoors (Rauert et al., 2015; Persson et al., 2019).
The intrinsic properties of each chemical and the emission effect are firmly related. The characteristics of this correlation help predict the emission pattern and emission amount of specific VOCs (Zheng et al., 2010).
Chemical emission in building materials is affected by many factors (Zhang et al., 2014). Many researchers report that the emission mechanism varies depending on the type of building material and climatic and environmental factors, and the intrinsic properties of each hazardous substance. In particular, it depends on temperature and humidity (Missia et al., 2010).
The emission of chemical substances in building materials is generally divided into diffusion inside the building material and surface emission through a complex material transport process (Asdrubali et al., 2017).
The diffusion of chemicals inside a building material is affected by the material’s concentration, pressure, temperature, or density (Huang et al., 2015). It is also proportional to the intrinsic diffusion coefficient for each chemical substance. Each chemical’s diffusion coefficient depends on molecular weight, volume, and temperature. In particular, it relates to the characteristics of the building material in which diffusion occurs. This indicates that the emission properties of chemicals may vary depending on the type of building material (Kim et al., 2011).
On the other hand, surface emission of chemical substances from building materials occurs by the action of evaporation and convection between the surface of the material and the air layer above it (Huang et al., 2013). Surface emission is proportional to the mass transfer coefficient for each chemical. It depends on the generation environment in which the physical properties of the air at the boundary layer, materials’ surface properties, and the surface airflow’s velocity act.
In other words, the surface-emission process in the path of chemical substances generated in building materials tends to be more dependent on the environment in which it occurs, and the diffusion process in building materials depends on the characteristics of the material (Xiong et al., 2012). Since these two processes generally occur consecutively, it can be said that the emission of chemical substances from building materials is due to environmental and material characteristics based on the inherent characteristics of chemical substances (Bourdin et al., 2014).
Previous studies to secure emission data from building materials were experiments through artificial climate rooms or chambers in which climatic and environmental factors can be controlled (Table 3).
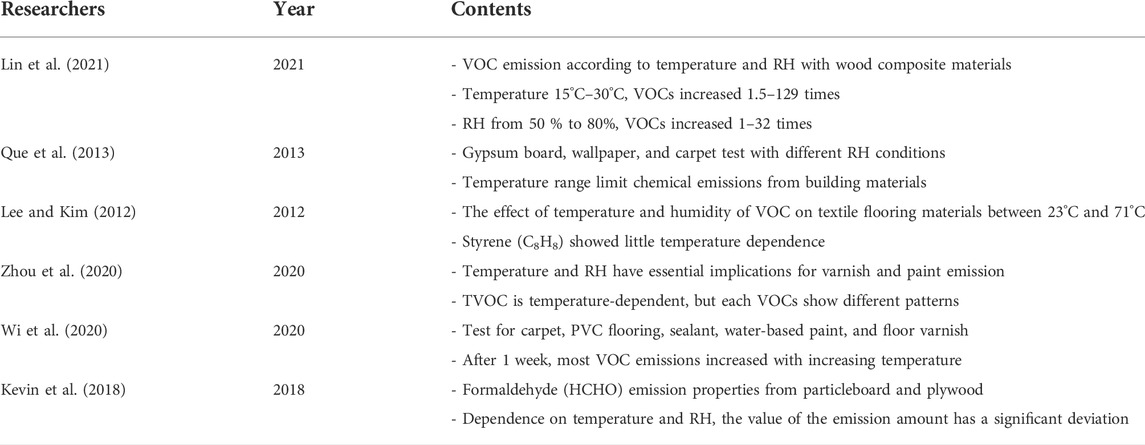
TABLE 3. The review of relevant previous research.
Lin et al. (2021) tested VOC emission characteristics according to temperature and RH through a chamber experiment with wood composite materials. It was reported that when the temperature increased from 15°C to 30°C, the VOCs increased by 1.5–129 times, and when the RH increased from 50 % to 80%, it increased by 1–32 times (Suzuki, 2019).
The emission of chemicals from building materials is significantly affected by temperature and relative humidity. However, the increase in temperature and humidity does not always increase, and there are many other influencing factors, such as temperature range, VOC type, and material type (Jiang et al., 2017).
Que et al. (2013) tested gypsum board, wallpaper, and carpet under different RH conditions and concluded that the emission properties depend on the material types. Studies show that the chemical and temperature range limit chemical emissions from building materials.
Lee and Kim (2012) studied the effect of temperature and humidity of VOC on textile flooring materials when the temperature range was 23°C–71°C and the relative humidity was 0 % and 45% under zero ventilation (equilibrium state). He reported that VOC substances such as Styrene (C8H8) showed little temperature dependence, but low volatility compounds such as Benzothiazole (C7H5NS) showed strong temperature dependence. His experiments found that all VOC substances were not dependent on the typical room temperature range of 23°C–30°C. Therefore, although building materials’ emission depends on temperature and humidity, it is affected by the content used in experiments such as bakeout (Kang et al., 2010).
Zhou et al. (2020) revealed that temperature and humidity have essential implications for varnish and paint emission through a small chamber experiment using paint and varnish. TVOC appeared to be temperature-dependent, but individual VOC showed a different pattern, so it was necessary to understand the temperature dependence for each material. In the case of humidity, it is reported that it is difficult to detect the trend of fluctuations.
Wi et al. (2020) measured VOC emission for carpet, PVC flooring, sealant, water-based paint, and floor varnish. After the material’s ventilation for about 1 week, most VOC emissions increased with increasing temperature.
It is reported that VOC emission increased when the humidity was increased to 50%. Still, when the experiment was conducted after 3 weeks of ventilation, VOC emission from the building material showed a tendency independent of temperature and humidity. This means that depending on the experience (difference in the content of internal pollutants), such as ventilation of materials, the dependent tendency according to temperature and humidity can be different (Liang et al., 2016a).
Kevin et al. (2018) report on Formaldehyde (HCHO) emission properties in particleboard and plywood. Although it shows dependence on temperature and humidity, the value of the emission amount has a significant deviation, which is reported to be caused by improper experimental control, the difference in testing procedure, the effect of time elapse of material, and the difference in emission mechanism for each material.
In other words, it was identified that the chemical substances generated from building materials tend to be dependent on temperature and humidity but may show a different tendency on factors such as the type of material, temperature range, and material history (Verdier et al., 2014).
Therefore, not all experiments show a dependence on temperature and humidity. It can be seen that the material’s experience (contaminant content) and the range of temperature and humidity are essential variables.
The contents described above are the contents of experiments in a controllable environment with building materials. The emission characteristics of building materials in the living space of an actual house may be different (Wang et al., 2018).
The indoor space has more influencing factors than the experimental space (Kim et al., 2012). Despite this, it is necessary to study whether the principles shown in building materials will be applied. Examining how many reduction measures can be achieved by controlling temperature and humidity in living conditions is essential.
Xiong et al. (2021) report that the winter concentration is higher than the summer in the seasonal indoor concentration survey. It can be seen that they are not related. The indoor concentration of VOC is affected by many parameters: the type of pollutants such as furniture, fluctuating temperature, relative humidity, ventilation rate, internal activity, and adsorption effect.
Liang et al. (2016b) concluded there is a strong correlation with temperature by measuring Formaldehyde (HCHO) in apartment buildings. That temperature has the most vital explanatory power, such as temperature, humidity, and household location.
In addition, Hazarika et al. (2019) stated that the concentration of Benzene (C6H6) and TVOC was different in the summer season, when the temperature and humidity were high, compared to the mid-season and winter season. He said that further research was needed. Takigawa et al. (2012) report change in chemical substances according to humidity changes in newly built apartment houses before moving in. The concentrations of VOCs tend to increase with the increase in humidity. However, it was reported that toluene was not significantly affected by the rise and fall of humidity. It can be seen that the dependence trend on temperature and humidity for each material may be different.
According to Kim et al. (2012), when the indoor air temperature is generally between 17°C and 28°C, in the case of floor heating, the concentration of VOCs fluctuates depending on the temperature conditions of the flooring (temperature of 50°C–60°C). His study reported that the formaldehyde was not released from the floor ash at 23°C–29°C. It is said that formaldehyde was mainly released when the temperature was raised to 50°C.
Therefore, it is concluded that most plywood flooring materials can affect indoor air pollution when used for floor heating (Lee and Kim, 2012). This indicates that temperature and humidity generally affect the emission of chemicals in building materials, but the influence decreases in the temperature range of daily living conditions (Liang et al., 2015).
The target housing in this study was the apartments in Ajman, completed in 2020, and the overview of the measured households is shown in Figure 1 and Table 4.
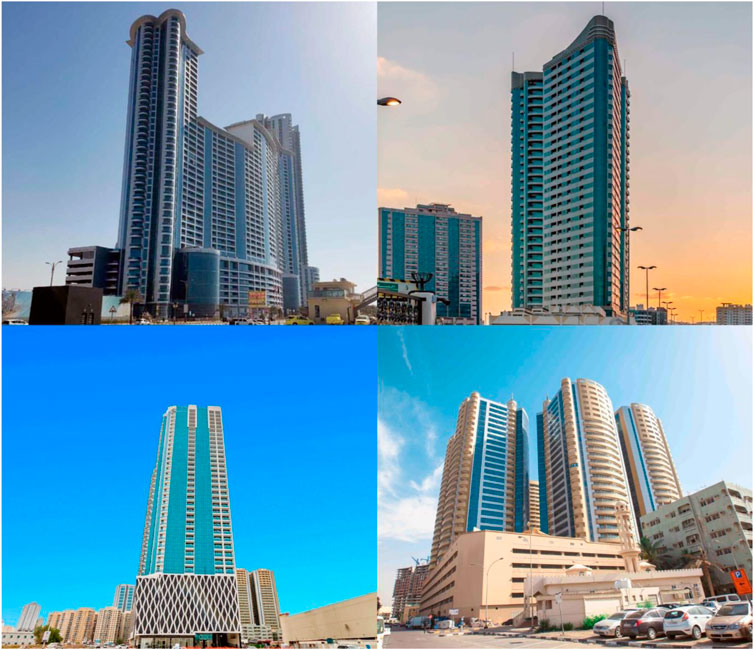
FIGURE 1. Apartments in Ajman, UAE (upper left: Ajman Corniche residence, upper right: Conqueror tower, bottom left: Oasis towers, bottom right: Horizon tower).
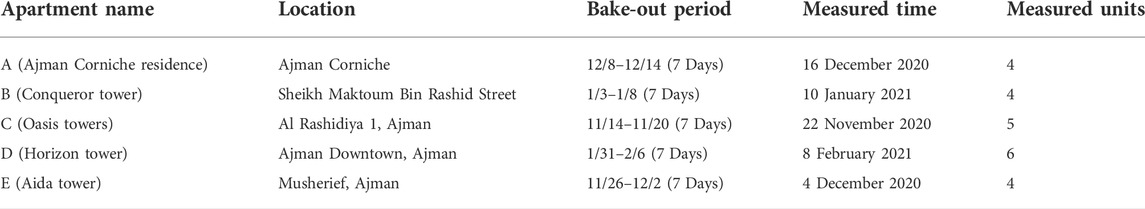
TABLE 4. Overview of the target housing.
The measured housing units were constructed according to a standardized procedure. Since there are no seismic activities in UAE, the structure of high-rise residential buildings is reinforced concrete with a flat slab, which is different from other countries using beams and girders. There is no reinforced concrete load-bearing wall structure in high-rise residential buildings because most of the residential buildings in UAE are more than 40 stories. Cinder blocks are used to fill the gap between reinforced concrete columns. Cement and insulation spray is the next step. The final wall finish will be either an aluminum panel or paint. They were measured 30 days before moving in, and a bake-out was performed 7 days before the measurement.
Each apartment’s floor plan with the area is shown in Figure 2, and the measurement point is the middle point of the living room. The height of the living room varies between 3.1 and 3.2 m. Since the same developer, AQAAR, built it, they used the same type of central A/C and similar types of building materials such as floor tiles, floor marbles, water paint wall finish, and the same kind of built-in closet (Aqaar, 2021). When all the units were measured, they were not occupied.
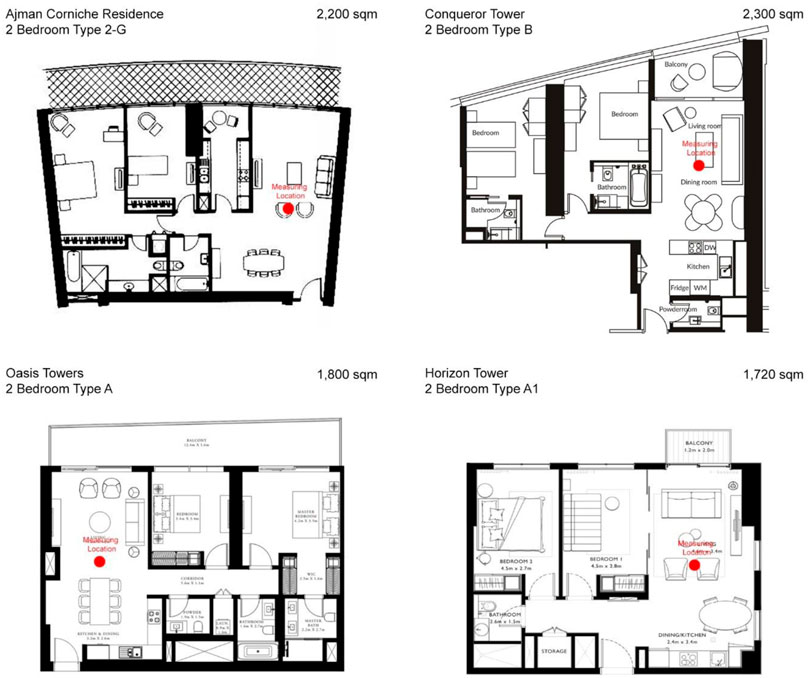
FIGURE 2. Floor plans for Ajman Corniche residence, Conqueror tower, Oasis towers, and Horizon tower.
In addition, the temperature and humidity of the indoor air were measured during the measurement, and the distribution of the average temperature and humidity and standard deviation of the measured households for each apartment is shown in Table 5.
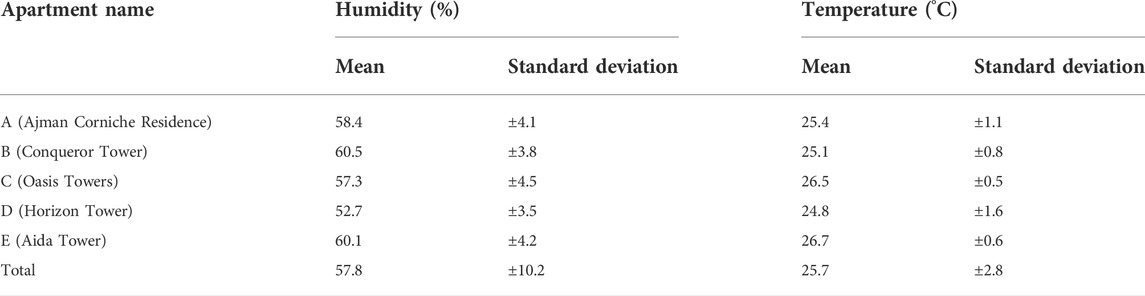
TABLE 5. Temperature and humidity distribution in target housing units.
The measured indoor air pollutants were Formaldehyde (HCHO) and VOCs. The measurement method is based on the WHO standards, measured at 1.5 m from the living room center from 10 a.m. to 6 p.m. (Table 6) (WHO, 2021). For the first step to measure formaldehyde (HCHO) concentration, all windows and interior furniture doors are opened for 30 min to perform natural ventilation before sampling. As the second step, close all the windows for more than 5 h to prevent airflow (Shrubsole et al., 2019). The furniture doors and the built-in cabinet are opened to allow air movement for indoor air pollutants collection. In the third step, a sample is collected with a DNPH (2,4-Dinitrophenylhydrazine) cartridge after 5 h, rolled up with tinfoil to block any possible light effects (Sarigiannis et al., 2011). At this time, the natural and forced ventilation are sealed, and samples are collected. An ozone scrubber is used when collecting air samples, and 15 L is collected for 20 min using a precise mini suction pump (0.5 ml/min). The air samples in the last step are precisely analyzed by HPLC (High-Performance Liquid Chromatography). In the TVOC concentration measurement method, the two stages of the formaldehyde (HCHO) sampling method is the same, and a Tenax tube is used in the third step (Rovelli et al., 2019). The last step analyzes the air sample by GC/MS (Gas Chromatography/Mass Spectroscopy). However, since the device used in this study is a direct-reading method for instantaneous values, it measures instantaneous concentrations multiple times, unlike the collection method of process test methods (Rizk et al., 2018). In addition, since this study also aims to identify the influencing factors, it has the meaning of multiple measurements to collect time-variation values rather than one-time measurements in one building (Yu and Kim, 2010). To avoid the errors of manual reading, two minimum and maximum readings were excluded, especially from the measurement of formaldehyde (HCHO).
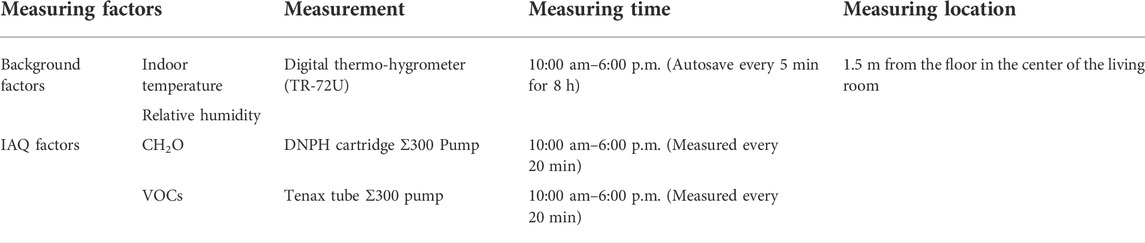
TABLE 6. Measuring IAQ factors and methods.
Figures 3–5 show the change in the concentration of formaldehyde (HCHO) according to the humidity change for the measured households of A (Ajman Corniche Residence), D (Horizon Tower), and E (Aida Tower). The change in the concentration of formaldehyde (HCHO) indicates the fluctuation pattern of the exponential function graph. The value of R2 indicates the degree of fit between the measured value and the exponential function graph. In analyzing the measurement results of this experiment, the suitability of the linear graph and the exponential function graph was reviewed to find a graph suitable for the fluctuation of the measurement result value. In most cases, the compatibility with the exponential function graph was higher, so this was applied.
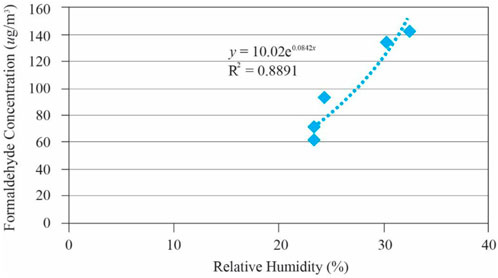
FIGURE 3. CH2O concentration change according to humidity change in A (Ajman Corniche residence).
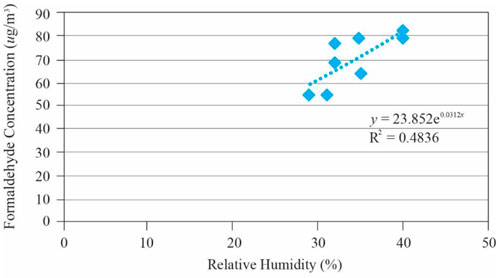
FIGURE 4. CH2O concentration change according to humidity change in D (Horizon tower).
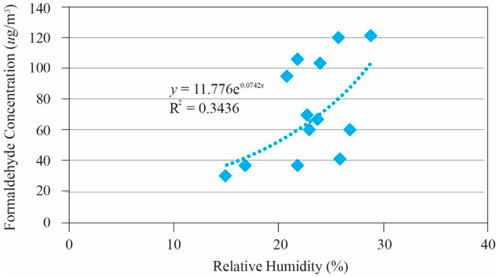
FIGURE 5. CH2O concentration change according to humidity change in E (Aida tower).
In addition, Table 7 summarizes the R2 values of each chemical for each apartment. R2 is a coefficient indicating the fit with the linear graph in the case of the whole. Examining the distribution characteristics of chemical substances according to humidity change for each apartment, the fluctuation pattern of each chemical substance according to humidity change in all apartments shows a quantitative exponential relationship.
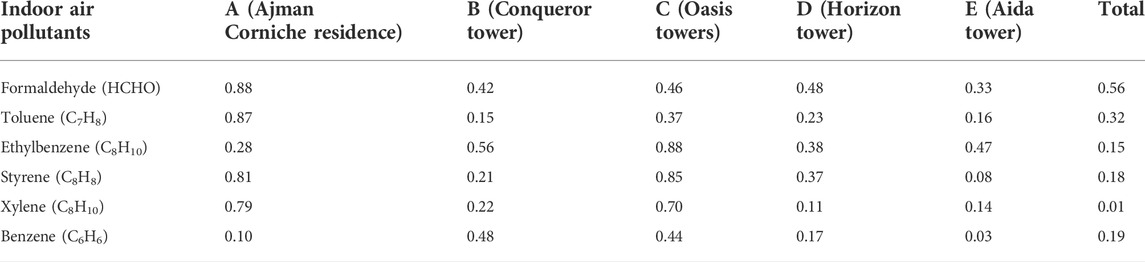
TABLE 7. Coefficient (R2) between each chemical and humidity.
In the case of A (Ajman Corniche Residence), the value of R2 was found to be between 0.88 (CH2O) and 0.10 (C6H6), as it differs for each material. Also, B (Conqueror Tower) is 0.56 (C8H10)–0.15 (C7H8), C (Oasis Towers) is 0.89 (C8H10)–0.38 (C7H8), D (Horizon Tower) is 0.48 (CH2O)–0.11 (C8H10), and E (Aida Tower) is 0.47 (C8H10)–0.03 (C6H6). The humidity within the measured household for each apartment is about 20 %–60%, the humidity range in daily life. Although there was a difference in the degree of each apartment, the correlation with humidity dependence was consistently shown.
Figure 6 shows the concentration distribution of chemical substances according to the indoor humidity change for all 23 homes. As shown in Figure 6, although there is a difference in the degree of each indoor air pollutants, there is a static and linear dependence on the humidity in all indoor air pollutants. As a result of verifying the suitability of the linear graph and the exponential function graph in the analysis of the measured values, the linear graph were adopted because the suitability of the entire target house was higher.
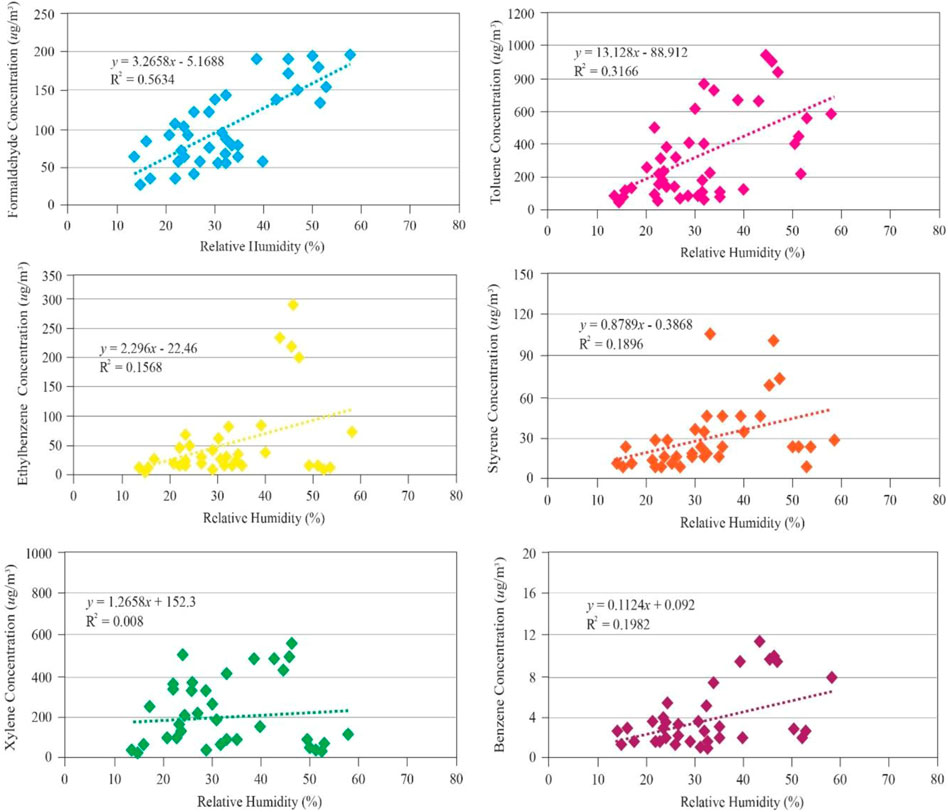
FIGURE 6. Formaldehyde (HCHO) and VOCs distribution according to indoor humidity change.
Formaldehyde (HCHO) showed the most significant dependence on humidity (R2 = 0.5 6). Analyzing this again by chemical substance, the value of R2 for formaldehyde (HCHO) was 0.56 for all subjects, and it was found to exist between 0.88 and 0.34 for each apartment.
In the case of Toluene (C7H8) as a whole, the value of R2 is 0.31, 0.87 to 0.15 for each apartment, 0.15 for Ethylbenzene (C8H10) as a whole, 0.89 to 0.29 for each apartment, and 0.18 for Styrene (C8H8) as a whole, 0.86 to 0.07 for each apartment. In the case of Xylene (C8H10), it was found that the value of R2 was between 0.01 for all, 0.80–0.11 for each apartment, 0.19 for Benzene (C6H6), and 0.48–0.03 for each apartment.
In the suitability analysis of the linear relationship in chemical substances, except for a few cases [Benzene (C6H6) in apartments A (Ajman Corniche Residence) and E (Aida Tower), Toluene (C7H8) in B (Conqueror Tower) and E (Aida Tower), and Styrene (C8H8) in E (Aida Tower)], the case where the entire house was analyzed in each apartment It was confirmed that the relative weakening as compared to the point of analysis.
In the case of the apartment to be surveyed, as it is a building of the same company, it can be said that the building materials and construction procedures are standardized, so they are generally similar. Therefore, analysis of the effect of temperature and humidity on chemical substances in a house is judged to be a factor that causes a difference in the results between the fundamental analysis and the analysis for individual apartment units.
In the analysis of the entire house, it was found that Ethylbenzene (C8H10) and Styrene (C8H8) showed a high temporary emission amount slightly out of a linear relationship within the range of about 40–50% of RH. It can be predicted that a high source of indoor pollutants exists within a limited humidity range. The cause of this phenomenon is whether it is due to the diversity of materials applied indoors, management conditions, and inherent characteristics of chemicals. Whether this is due to the difference is judged to require further study. In particular, Formaldehyde (HCHO) is a material with hydrophilicity. It can be predicted to have a strong relationship with humidity. It was confirmed that it is a substance that consistently shows a strong dependence according to changes in humidity in the analysis of the entire apartment.
Figures 7–9 show the pattern of toluene concentration change according to temperature change for the measured households of A (Ajman Corniche Residence), D (Horizon Tower), and E (Aida Tower) among the survey apartments.
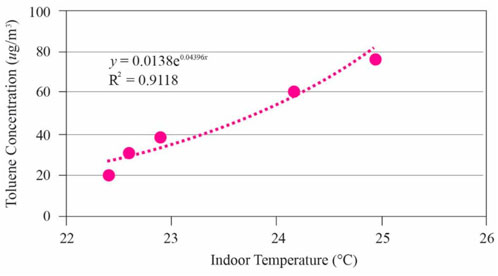
FIGURE 7. C7H8 concentration change according to temperature change in A (Ajman Corniche residence).
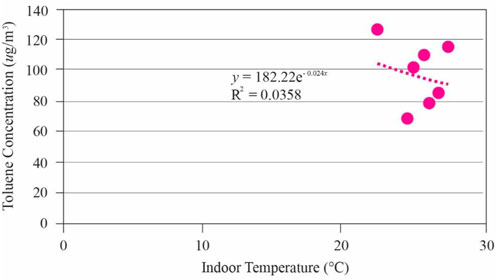
FIGURE 8. C7H8 concentration change according to temperature change in D (Horizon tower).
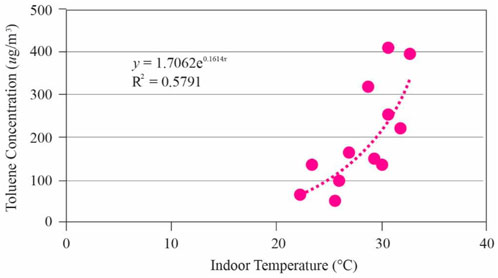
FIGURE 9. C7H8 concentration change according to temperature change in E (Aida tower).
The change in the concentration of toluene indicates the fluctuation pattern of the exponential function graph, and the value of R2 indicates the degree of fit between the measured value and the exponential function graph. Table 8 summarizes the R2 values of each chemical for each apartment. R2 is a coefficient indicating the fit with the linear graph in the case of the whole.
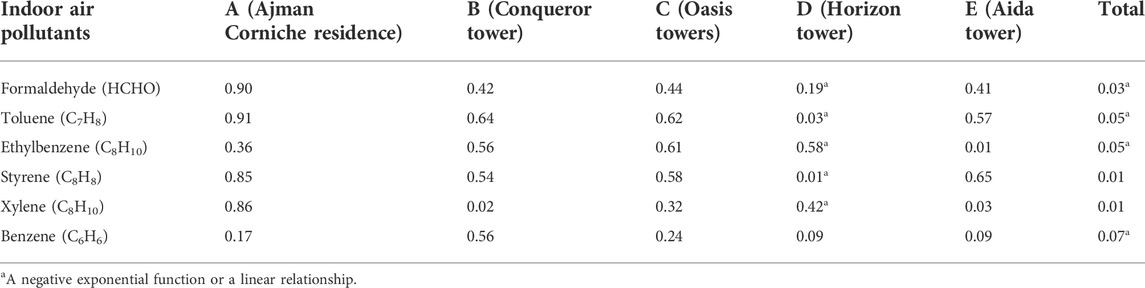
TABLE 8. Coefficient (R2) between each chemical and temperature.
Looking at the distribution characteristics of chemical substances according to temperature change for each apartment, in the case of apartment A (Ajman Corniche Residence), the R2 value indicates the degree of fit between the changing pattern of Formaldehyde (HCHO), Benzene (C6H6), Toluene (C7H8), Ethylbenzene (C8H10), Xylene (C8H10), and Styrene (C8H8) and the exponential function graph was 0.90 (CH2O) to 0.17 (C6H6), in B (Conqueror Tower) 0.64 (C7H8) to 0.01 (C8H10), in C (Oasis Towers) 0.61 (C8H10) to 0.24 (C6H6), in E (Aida Tower) 0.66 (C8H8) to 0.01 (C8H10).
However, in the case of D (Horizon Tower), the value of R2 was negative for all materials except Benzene (C6H6), and it was found to exist between −0.58 (C8H10) and −0.01 (C8H8). A (Ajman Corniche Residence), B (Conqueror Tower), C (Oasis Towers), and E (Aida Tower) show the same tendency to establish a positive proportional relationship. In contrast, D (Horizon Tower) shows a negative association except for only Benzene (C6H6).
Table 9 shows the distribution of the average concentration of each pollutant for each household measured by apartment. In the case of D (Horizon Tower), the concentration (amount of generation) is minimal compared to other apartments, and the standard deviation is relatively small, so it can be seen that the distribution range of the concentration change according to temperature and humidity is very small compared to other substances.
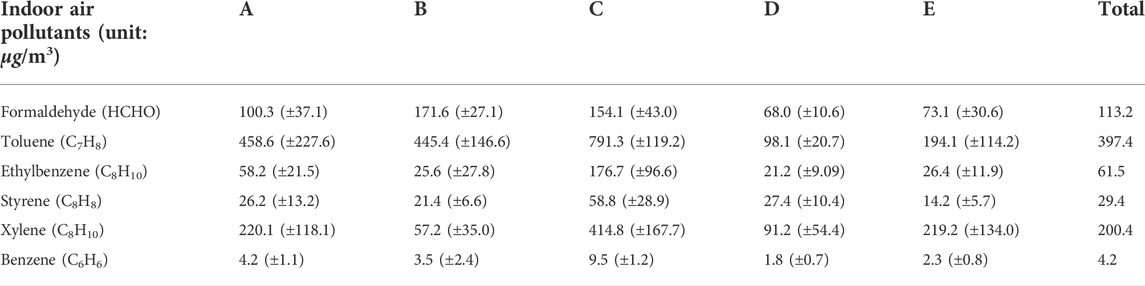
TABLE 9. Average concentration distribution of each chemical.
This characteristic can also be confirmed in Figures 7–9. The toluene emission concentration of other apartments is generally higher than 200 ug/m3 to close to 1,000 ug/m3.
On the other hand, it can be seen that apartment D shows a low concentration distribution from less than 140 ug/m3 to 60 ug/m3. It was confirmed that, unlike humidity, the degree of chemical generation strongly influenced the temperature-dependent tendency at temperature, and the temperature dependence was weakened below a certain amount.
On the other hand, as a result of examining the relationship between the distribution of indoor chemicals and temperature for all measurement households, as shown in Table 8, the correlation coefficient R2 does not show a linear trend in the indoor temperature range of 23°C–33°C. When looking at each material, the value of R2 exists between 0.90 and 0.40, except for D (Horizon Tower), where the concentration of formaldehyde (HCHO) in each apartment was negative. Toluene (C7H8) exists between 0.91 and 0.51, Ethylbenzene (C8H10) exists between 0.61 and 0.01, and Styrene (C8H8) exists between 0.85 and 0.55. Xylene (C8H10) ranges from 0.87 to 0.01, and Benzene (C6H6) ranges from 0.56 to 0.09.
As such, although there is a difference in degree for each apartment, they all show a quantitative linear relationship, and it can be evaluated that they offer suitable suitability, except for Xylene (C8H10) in B (Conqueror Tower), Ethylbenzene (C8H10) in E (Aida Tower). However, when the case of D (Horizon Tower) is added, it can be seen that the suitability is significantly weakened, as described above. Therefore, it was determined that the trend identification of the overall target housing was attributed to the characteristics of individual apartments. It can be seen that the tendency of dependence on temperature rather than the degree of consistent support on humidity, as described above, is weakened.
Also, looking at the temperature and humidity characteristics of the house used for the analysis, the humidity is in the range of 7.1 %–64.4%, and average humidity of 28.8% is reported. Compared with the 31.9% (±11.2%) in this study, it is judged that the humidity distribution is similar.
Meanwhile, Figure 10 shows the concentration distribution of each chemical according to temperature change for the entire measurement generation. As can be seen from the figure, the concentration distribution of each chemical according to the temperature change does not show a linear relationship. Instead, it offers two distribution groups that form a bell shape. It can be seen that there is a case group with a high incidence around the room temperature of 25°C, and a bell-shaped distribution group exists, although the degree of occurrence is small at around 32°C compared to 25°C. It is understood that there is a temperature division point where the generation of chemical substances in the indoor air condition in the house increases.
FIGURE 10. Formaldehyde (HCHO) and VOCs distribution according to indoor temperature change.
Formaldehyde (HCHO) is a hydrophilic material, and a strong relationship with humidity can be predicted. Still, in the case of Ethylbenzene (C8H10) and Styrene (C8H8), there is a case where the temporary release amount slightly deviates from the linear relationship within the range of about 40%–50% of the RH. It can be predicted that a high generating source among indoor pollutant sources exists within a limited humidity range. Further research is needed to determine whether the cause of this phenomenon is due to the diversity of materials applied indoors or differences in management conditions and inherent characteristics of chemical substances.
There is a temperature breakpoint where the generation of chemicals in the indoor air condition in a house increases. This distribution characteristic can be considered related to the existence of a temperature range in which radiation is activated for each material due to the features of the building material. In addition, it can be considered that different construction methods for each apartment influence indoor concentration. These results should be studied more closely in future studies.
Much previous research in different countries describes a strong dependence on temperature and humidity for chemicals generated from building materials. However, since many types of building materials are complexly applied in housing and the residential buildings in UAE are constantly using air-conditioning, it appears different from the characteristics of chemical generation in a precise small chamber environment. The results of the study are as follows.
First, Formaldehyde (HCHO), Benzene (C6H6), Toluene (C7H8), Ethylbenzene (C8H10), Xylene (C8H10), and Styrene (C8H8) have consistent humidity dependence within the range of 15%–60% of RH in the room. Among the above chemicals, it was shown that Formaldehyde (HCHO) showed a strong dependence.
However, as for the temperature, it was impossible to confirm the consistent support as it showed different characteristics for each house or apartment within the indoor temperature range of 22°C–33°C. This indicates that the microclimate factor that suppresses or controls the generation of indoor pollutants requires more attention to humidity and temperature, and humidity control is a controllable factor that can reduce pollutants.
Second, when the emission amount is much smaller than the average concentration of the entire house and the emission amount’s standard deviation is minimal, the temperature dependence is weakened when the concentration emission range according to the temperature change is minimal. Identifying a certain concentration level for this is a part that needs to be systematically studied in the future.
Third, there is an emission cut-off point where the generation of chemical substances deviates from a linear relationship in the range of relative humidity of 40%–50% and the room temperature of 25°C. These temperature and humidity ranges imply a lot of meaning and importance as they are the ranges in daily life.
Fourth, there is a limit to predicting the occurrence of chemical substances in a house only with microclimatic factors such as temperature and humidity. Other than that, there are many variables, such as the types of various building materials, management experience (contaminant content) of materials, and construction and application characteristics.
Fifth, in future research, more systematic study is required to identify the complex factors that affect the emission of pollutants in the indoor environment and their influence in a hot desert climate.
The original contributions presented in the study are included in the article/Supplementary Material, further inquiries can be directed to the corresponding author.
All authors contributed significantly to this study. CJ and NA identified and secured the example buildings used in the study. The data acquisition system and sensors were designed and installed by CJ and NA and responsible for data collection. CJ and NA performed data analysis. The manuscript was compiled by CJ and reviewed by NA. All authors have read and agreed to the published version of the manuscript.
The authors would like to express their gratitude to Ajman University for APC support and the Healthy and Sustainable Built Environment Research Center at Ajman University for providing an excellent research environment.
The authors declare that the research was conducted in the absence of any commercial or financial relationships that could be construed as a potential conflict of interest.
All claims expressed in this article are solely those of the authors and do not necessarily represent those of their affiliated organizations, or those of the publisher, the editors and the reviewers. Any product that may be evaluated in this article, or claim that may be made by its manufacturer, is not guaranteed or endorsed by the publisher.
Al Horr, Y., Arif, M., Kaushik, A., Mazroei, A., Katafygiotou, M., and Elsarrag, E. (2016). Occupant productivity and office indoor environment quality: A review of the literature. Build. Environ. 105, 369–389. doi:10.1016/j.buildenv.2016.06.001 |
Aqaar (2021). Aqaar projects. Retrieved from: https://www.aqaar.com/.
Arar, M., and Jung, C. (2021). Improving the indoor air quality in nursery buildings in united Arab emirates. Int. J. Environ. Res. Public Health 18 (22), 12091. doi:10.3390/ijerph182212091 | |
Aruoja, V., Moosus, M., Kahru, A., Sihtmäe, M., and Maran, U. (2014). Measurement of baseline toxicity and QSAR analysis of 50 non-polar and 58 polar narcotic chemicals for the alga Pseudokirchneriella subcapitata. Chemosphere 96, 23–32. doi:10.1016/j.chemosphere.2013.06.088 | |
Asdrubali, F., Ferracuti, B., Lombardi, L., Guattari, C., Evangelisti, L., and Grazieschi, G. (2017). A review of structural, thermo-physical, acoustical, and environmental properties of wooden materials for building applications. Build. Environ. 114, 307–332. doi:10.1016/j.buildenv.2016.12.033 |
Awad, J., and Jung, C. (2021). Evaluating the indoor air quality after renovation at the greens in Dubai, united Arab emirates. Buildings 11 (8), 353. doi:10.3390/buildings11080353 |
Bourdin, D., Mocho, P., Desauziers, V., and Plaisance, H. (2014). Formaldehyde emission behavior of building materials: On-site measurements and modeling approach to predict indoor air pollution. J. Hazard. Mater. 280, 164–173. doi:10.1016/j.jhazmat.2014.07.065 | |
Chapman, D. M. (2011). Behavior of titania-supported vanadia and tungsta SCR catalysts at high temperatures in reactant streams: Tungsten and vanadium oxide and hydroxide vapor pressure reduction by surficial stabilization. Appl. Catal. A General 392 (1-2), 143–150. doi:10.1016/j.apcata.2010.11.005 |
Chithra, V. S., and Nagendra, S. S. (2012). Indoor air quality investigations in a naturally ventilated school building located close to an urban roadway in Chennai, India. Build. Environ. 54, 159–167. doi:10.1016/j.buildenv.2012.01.016 |
Chung, W. C., Mei, D. H., Tu, X., and Chang, M. B. (2019). Removal of VOCs from gas streams via plasma and catalysis. Catal. Rev. 61 (2), 270–331. doi:10.1080/01614940.2018.1541814 |
Da Silva, C. F., Stefanowski, B., Maskell, D., Ormondroyd, G. A., Ansell, M. P., Dengel, A. C., et al. (2017). Improvement of indoor air quality by MDF panels containing walnut shells. Build. Environ. 123, 427–436. doi:10.1016/j.buildenv.2017.07.015 |
Darling, E. K., Cros, C. J., Wargocki, P., Kolarik, J., Morrison, G. C., and Corsi, R. L. (2012). Impacts of a clay plaster on indoor air quality assessed using chemical and sensory measurements. Build. Environ. 57, 370–376. doi:10.1016/j.buildenv.2012.06.004 |
Davis, R. E., McGregor, G. R., and Enfield, K. B. (2016). Humidity: A review and primer on atmospheric moisture and human health. Environ. Res. 144, 106–116. doi:10.1016/j.envres.2015.10.014 | |
Deng, S., and Lau, J. (2019). Seasonal variations of indoor air quality and thermal conditions and their correlations in 220 classrooms in the Midwestern United States. Build. Environ. 157, 79–88. doi:10.1016/j.buildenv.2019.04.038 |
Hazarika, S., Borah, P., and Prakash, A. (2019). The assessment of return probability of maximum ozone concentrations in an urban environment of Delhi: A generalized extreme value analysis approach. Atmos. Environ. 202, 53–63. doi:10.1016/j.atmosenv.2019.01.021 |
Huang, S., Xiong, J., and Zhang, Y. (2013). A rapid and accurate method, ventilated chamber C-history method, of measuring the emission characteristic parameters of formaldehyde/VOCs in building materials. J. Hazard. Mater. 261, 542–549. doi:10.1016/j.jhazmat.2013.08.001 | |
Huang, S., Xiong, J., and Zhang, Y. (2015). Impact of temperature on the ratio of initial emittable concentration to total concentration for formaldehyde in building materials: Theoretical correlation and validation. Environ. Sci. Technol. 49 (3), 1537–1544. doi:10.1021/es5051875 | |
Huang, Y., Yu, Q., Li, M., Jin, S., Fan, J., Zhao, L., et al. (2021). Surface modification of activated carbon fiber by low-temperature oxygen plasma: Textural property, surface chemistry, and the effect of water vapor adsorption. Chem. Eng. J. 418, 129474. doi:10.1016/j.cej.2021.129474 |
Jiang, C., Li, D., Zhang, P., Li, J., Wang, J., and Yu, J. (2017). Formaldehyde and volatile organic compound (VOC) emissions from particleboard: Identification of odorous compounds and effects of heat treatment. Build. Environ. 117, 118–126. doi:10.1016/j.buildenv.2017.03.004 |
Jung, C., Al Qassimi, N., Arar, M., and Awad, J. (2021). The analysis of indoor air pollutants from finishing material of new apartments at business bay, Dubai. Front. Built Environ. 7, 765689. doi:10.3389/fbuil.2021.765689 |
Jung, C., and Al Qassimi, N. (2022). Investigating the emission of hazardous chemical substances from mashrabiya used for indoor air quality in hot desert climate. Sustainability 14 (5), 2842. doi:10.3390/su14052842 |
Jung, C., and Awad, J. (2021). Improving the IAQ for learning efficiency with indoor plants in university classrooms in ajman, united Arab emirates. Buildings 11 (7), 289. doi:10.3390/buildings11070289 |
Jung, C., Awad, J., Mahmoud, N. S. A., and Salameh, M. (2021). An analysis of indoor environment evaluation for the Springs development in Dubai, UAE. Open House Int. 46, 651–667. doi:10.1108/OHI-11-2020-0165 |
Jung, C., and Awad, J. (2021). The improvement of indoor air quality in residential buildings in Dubai, UAE. Buildings 11 (6), 250. doi:10.3390/buildings11060250 |
Kang, D. H., Choi, D. H., Lee, S. M., Yeo, M. S., and Kim, K. W. (2010). Effect of bake-out on reducing VOC emissions and concentrations in a residential housing unit with a radiant floor heating system. Build. Environ. 45 (8), 1816–1825. doi:10.1016/j.buildenv.2010.02.010 |
Kevin, E. I., Ochanya, O. M., Olukemi, A. M., Bwanhot, S. T. N., and Uche, I. (2018). Mechanical properties of urea formaldehyde particle board composite. Am. J. Chem. Biochem. Eng. 2 (1), 10–15. doi:10.11648/j.ajcbe.20180201.12 |
Kim, H. S., Lee, B. H., Kim, H. J., and Yang, H. S. (2011). Mechanical–thermal properties and VOC emissions of natural-flour-filled biodegradable polymer hybrid bio-composites. J. Polym. Environ. 19 (3), 628–636. doi:10.1007/s10924-011-0313-5 |
Kim, S. S., Kang, D. H., Choi, D. H., Yeo, M. S., and Kim, K. W. (2012). VOC emission from building materials in residential buildings with radiant floor heating systems. Aerosol Air Qual. Res. 12 (6), 1398–1408. doi:10.4209/aaqr.2011.11.0222 |
Lee, S., Kwon, G., Joo, J., Kim, J. T., and Kim, S. (2012). A finish material management system for indoor air quality of apartment buildings (FinIAQ). Energy Build. 46, 68–79. doi:10.1016/j.enbuild.2011.10.044 |
Lee, Y. K., and Kim, H. J. (2012). The effect of temperature on VOCs and carbonyl compounds emission from wooden flooring by thermal extractor test method. Build. Environ. 53, 95–99. doi:10.1016/j.buildenv.2011.10.016 |
Liang, W., Lv, M., and Yang, X. (2016). The combined effects of temperature and humidity on initial emittable formaldehyde concentration of a medium-density fiberboard. Build. Environ. 98, 80–88. doi:10.1016/j.buildenv.2015.12.024 |
Liang, W., Lv, M., and Yang, X. (2016). The effect of humidity on formaldehyde emission parameters of a medium-density fiberboard: Experimental observations and correlations. Build. Environ. 101, 110–115. doi:10.1016/j.buildenv.2016.03.008 |
Liang, W., Yang, S., and Yang, X. (2015). Long-term formaldehyde emissions from medium-density fiberboard in a full-scale experimental room: Emission characteristics and the effects of temperature and humidity. Environ. Sci. Technol. 49 (17), 10349–10356. doi:10.1021/acs.est.5b02217 | |
Lin, W. T., Chen, C. Y., Lee, C. C., Chen, C. C., and Lo, S. C. (2021). Air phthalate emitted from flooring building material by the micro-chamber method: Two-stage emission evaluation and comparison. Toxics 9 (9), 216. doi:10.3390/toxics9090216 | |
Masekameni, M. D., Moolla, R., Gulumian, M., and Brouwer, D. (2019). Risk assessment of benzene, toluene, ethyl benzene, and xylene concentrations from the combustion of coal in a controlled laboratory environment. Int. J. Environ. Res. Public Health 16 (1), 95. doi:10.3390/ijerph16010095 |
Mirzaei, A., Leonardi, S. G., and Neri, G. (2016). Detection of hazardous volatile organic compounds (VOCs) by metal oxide nanostructures-based gas sensors: A review. Ceram. Int. 42 (14), 15119–15141. doi:10.1016/j.ceramint.2016.06.145 |
Missia, D. A., Demetriou, E., Michael, N., Tolis, E. I., and Bartzis, J. G. (2010). Indoor exposure from building materials: A field study. Atmos. Environ. 44 (35), 4388–4395. doi:10.1016/j.atmosenv.2010.07.049 |
Persson, J., Wang, T., and Hagberg, J. (2019). Indoor air quality of newly built low-energy preschools–Are chemical emissions reduced in houses with eco-labelled building materials? Indoor Built Environ. 28 (4), 506–519. doi:10.1177/1420326x18792600 |
Que, Z. L., Wang, F. B., Li, J. Z., and Furuno, T. (2013). Assessment on emission of volatile organic compounds and formaldehyde from building materials. Compos. Part B Eng. 49, 36–42. doi:10.1016/j.compositesb.2013.01.008 |
Rauert, C., Harrad, S., Stranger, M., and Lazarov, B. (2015). Test chamber investigation of the volatilization from source materials of brominated flame retardants and their subsequent deposition to indoor dust. Indoor air 25 (4), 393–404. doi:10.1111/ina.12151 | |
Ravula, S., Larm, N. E., Mottaleb, M. A., Heitz, M. P., and Baker, G. A. (2019). Vapor pressure mapping of ionic liquids and low-volatility fluids using graded isothermal thermogravimetric analysis. ChemEngineering 3 (2), 42. doi:10.3390/chemengineering3020042 |
Regmi, B. P., Monk, J., El-Zahab, B., Das, S., Hung, F. R., Hayes, D. J., et al. (2012). A novel composite film for detection and molecular weight determination of organic vapors. J. Mat. Chem. 22 (27), 13732–13741. doi:10.1039/c2jm31623d |
Rizk, M., Guo, F., Verriele, M., Ward, M., Dusanter, S., Blond, N., et al. (2018). Impact of material emissions and sorption of volatile organic compounds on indoor air quality in a low energy building: Field measurements and modeling. Indoor air 28 (6), 924–935. doi:10.1111/ina.12493 | |
Rizk, M., Verriele, M., Dusanter, S., Schoemaecker, C., and Locoge, N. (2016). Fast sorption measurements of volatile organic compounds on building materials: Part 1–Methodology developed for field applications. Build. Environ. 99, 200–209. doi:10.1016/j.buildenv.2015.12.017 | |
Rovelli, S., Cattaneo, A., Fazio, A., Spinazzè, A., Borghi, F., Campagnolo, D., et al. (2019). VOCs measurements in residential buildings: Quantification via thermal desorption and assessment of indoor concentrations in a case-study. Atmosphere 10 (2), 57. doi:10.3390/atmos10020057 |
Sachan, A., Castro, M., Choudhary, V., and Feller, J. F. (2017). vQRS based on hybrids of CNT with PMMA-POSS and PS-POSS Copolymers to reach the sub-PPM detection of ammonia and formaldehyde at room temperature despite moisture. Chemosensors 5 (3), 22. doi:10.3390/chemosensors5030022 |
Sarigiannis, D. A., Karakitsios, S. P., Gotti, A., Liakos, I. L., and Katsoyiannis, A. (2011). Exposure to major volatile organic compounds and carbonyls in European indoor environments and associated health risk. Environ. Int. 37 (4), 743–765. doi:10.1016/j.envint.2011.01.005 | |
Shirazi, S. A., Abdollahipoor, B., Martinson, J., Windom, B., Foust, T. D., and Reardon, K. F. (2019). Effects of dual-alcohol gasoline blends on physiochemical properties and volatility behavior. Fuel 252, 542–552. doi:10.1016/j.fuel.2019.04.105 |
Shrubsole, C., Dimitroulopoulou, S., Foxall, K., Gadeberg, B., and Doutsi, A. (2019). IAQ guidelines for selected volatile organic compounds (VOCs) in the UK. Build. Environ. 165, 106382. doi:10.1016/j.buildenv.2019.106382 |
Suzuki, M. (2019). Bayesian modeling of volatile organic compound emissions from three softwoods in Hokkaido, Japan. J. Wood Sci. 65 (1), 8–9. doi:10.1186/s10086-019-1790-8 |
Takigawa, T., Saijo, Y., Morimoto, K., Nakayama, K., Shibata, E., Tanaka, M., et al. (2012). A longitudinal study of aldehydes and volatile organic compounds associated with subjective symptoms related to sick building syndrome in new dwellings in Japan. Sci. Total Environ. 417, 61–67. doi:10.1016/j.scitotenv.2011.12.060 | |
Torimoto, T., Tsuda, T., Okazaki, K. I., and Kuwabata, S. (2010). New frontiers in materials science opened by ionic liquids. Adv. Mat. 22 (11), 1196–1221. doi:10.1002/adma.200902184 | |
Uhde, E., and Schulz, N. (2015). Impact of room fragrance products on indoor air quality. Atmos. Environ. 106, 492–502. doi:10.1016/j.atmosenv.2014.11.020 |
Verdier, T., Coutand, M., Bertron, A., and Roques, C. (2014). A review of indoor microbial growth across building materials and sampling and analysis methods. Build. Environ. 80, 136–149. doi:10.1016/j.buildenv.2014.05.030 |
Wang, Q., Li, S., Dong, M., Li, W., Gao, X., Ye, R., et al. (2018). VOCs emission characteristics and priority control analysis based on VOCs emission inventories and ozone formation potentials in Zhoushan. Atmos. Environ. 182, 234–241. doi:10.1016/j.atmosenv.2018.03.034 |
WHO (2021). WHO guidelines for indoor air quality : Selected pollutants. Retrieved from: https://www.euro.who.int/__data/assets/pdf_file/0009/128169/e94535.pdf.
Wi, S., Kim, M. G., Myung, S. W., Baik, Y. K., Lee, K. B., Song, H. S., et al. (2020). Evaluation and analysis of volatile organic compounds and formaldehyde emission of building products in accordance with legal standards: A statistical experimental study. J. Hazard. Mater. 393, 122381. doi:10.1016/j.jhazmat.2020.122381 | |
Xie, S., and Suuberg, E. (2021). The effects of temperature and relative humidity on trichloroethylene sorption capacities of building materials under conditions relevant to vapor intrusion. J. Hazard. Mater. 401, 123807. doi:10.1016/j.jhazmat.2020.123807 | |
Xiong, C., Wang, N., Zhou, L., Yang, F., Qiu, Y., Chen, J., et al. (2021). Component characteristics and source apportionment of volatile organic compounds during summer and winter in downtown Chengdu, southwest China. Atmos. Environ. 258, 118485. doi:10.1016/j.atmosenv.2021.118485 |
Xiong, J., Liu, C., and Zhang, Y. (2012). A general analytical model for formaldehyde and VOC emission/sorption in single-layer building materials and its application in determining the characteristic parameters. Atmos. Environ. 47, 288–294. doi:10.1016/j.atmosenv.2011.10.063 |
Xiong, J., Wei, W., Huang, S., and Zhang, Y. (2013). Association between the emission rate and temperature for chemical pollutants in building materials: General correlation and understanding. Environ. Sci. Technol. 47 (15), 8540–8547. doi:10.1021/es401173d | |
Xiong, J., and Zhang, Y. (2010). Impact of temperature on the initial emittable concentration of formaldehyde in building materials: Experimental observation. Indoor Air 20 (6), 523–529. doi:10.1111/j.1600-0668.2010.00675.x | |
Xu, J., and Zhang, J. S. (2011). An experimental study of relative humidity effect on VOCs’ effective diffusion coefficient and partition coefficient in a porous medium. Build. Environ. 46 (9), 1785–1796. doi:10.1016/j.buildenv.2011.02.007 |
Xue, Y., Zhou, Z., Nie, T., Wang, K., Nie, L., Pan, T., et al. (2016). Trends of multiple air pollutants emissions from residential coal combustion in Beijing and its implication on improving air quality for control measures. Atmos. Environ. 142, 303–312. doi:10.1016/j.atmosenv.2016.08.004 |
Yauk, M., Stenson, J., Donor, M., and Van Den Wymelenberg, K. (2020). Evaluating volatile organic compound emissions from cross-laminated timber bonded with a soy-based adhesive. Buildings 10 (11), 191. doi:10.3390/buildings10110191 |
Yu, C. W. F., and Kim, J. T. (2010). Building pathology, investigation of sick buildings—VOC emissions. Indoor Built Environ. 19 (1), 30–39. doi:10.1177/1420326x09358799 |
Zhang, X., Gao, B., Creamer, A. E., Cao, C., and Li, Y. (2017). Adsorption of VOCs onto engineered carbon materials: A review. J. Hazard. Mater. 338, 102–123. doi:10.1016/j.jhazmat.2017.05.013 | |
Zhang, Z., Provis, J. L., Reid, A., and Wang, H. (2014). Geopolymer foam concrete: An emerging material for sustainable construction. Constr. Build. Mater. 56, 113–127. doi:10.1016/j.conbuildmat.2014.01.081 |
Zheng, J., Zheng, Z., Yu, Y., and Zhong, L. (2010). Temporal, spatial characteristics and uncertainty of biogenic VOC emissions in the Pearl River Delta region, China. Atmos. Environ. 44 (16), 1960–1969. doi:10.1016/j.atmosenv.2010.03.001 |
Zheng, Q., Lee, D., Lee, S., Kim, J. T., and Kim, S. (2011). A health performance evaluation model of apartment building indoor air quality. Indoor Built Environ. 20 (1), 26–35. doi:10.1177/1420326x10393719 |
Zhong, L., Lee, C. S., and Haghighat, F. (2012). Adsorption performance of titanium dioxide (TiO2) coated air filters for volatile organic compounds. J. Hazard. Mater. 243, 340–349. doi:10.1016/j.jhazmat.2012.10.042 | |
Keywords: critical emission point, formaldehyde (HCHO), volatile organic compounds (VOCs), indoor temperature, relative humidity
Citation: Jung C, Mahmoud NSA and Alqassimi N (2022) Identifying the relationship between VOCs emission and temperature/humidity changes in new apartments in the hot desert climate. Front. Built Environ. 8:1018395. doi: 10.3389/fbuil.2022.1018395
Received: 13 August 2022; Accepted: 05 September 2022;
Published: 16 September 2022.
Edited by:
Roberto Alonso González-Lezcano, CEU San Pablo University, SpainReviewed by:
Daniel Arranz Paraíso, Universidad San Pablo CEU, SpainCopyright © 2022 Jung, Mahmoud and Alqassimi. This is an open-access article distributed under the terms of the Creative Commons Attribution License (CC BY). The use, distribution or reproduction in other forums is permitted, provided the original author(s) and the copyright owner(s) are credited and that the original publication in this journal is cited, in accordance with accepted academic practice. No use, distribution or reproduction is permitted which does not comply with these terms.
*Correspondence: Chuloh Jung, Yy5qdW5nQGFqbWFuLmFjLmFl
Disclaimer: All claims expressed in this article are solely those of the authors and do not necessarily represent those of their affiliated organizations, or those of the publisher, the editors and the reviewers. Any product that may be evaluated in this article or claim that may be made by its manufacturer is not guaranteed or endorsed by the publisher.
Research integrity at Frontiers
Learn more about the work of our research integrity team to safeguard the quality of each article we publish.