 Alemayehu Ayele
 Matebie Meten
 Kifle Woldearegay3
94% of researchers rate our articles as excellent or good
Learn more about the work of our research integrity team to safeguard the quality of each article we publish.
Find out more
ORIGINAL RESEARCH article
Front. Built Environ., 26 September 2022
Sec. Earthquake Engineering
Volume 8 - 2022 | https://doi.org/10.3389/fbuil.2022.1014214
The study area is located in one of the most earthquake prone regions in southern Ethiopia, which is characterized by small-to-intermediate earthquake occurrences causing damage to buildings. Predicting liquefaction hazard potential and local site effects are imperative to manage earthquake hazard and reduce the damage to buildings and loss of lives. The objectives of this work were to perform the equivalent linear response analysis (ELA) and shear wave velocity (Vs.)-based liquefaction hazard analysis and classify the site into different seismic site classes based on the European and American codes. The SPT-N and Vs.30 values showed the site falls in the C and D classes based on the NEHRP (2015) code but falls in the B and C classes based on the EC8 (2003) code. The susceptibility of liquefaction was evaluated using grain size analysis curves. Moreover, peak ground acceleration (PGA), spectral acceleration (SA), and maximum strain (%), which are very critical to understanding the local site effects, were estimated by the DeepsoilV.7 program. The cyclic stress ratio and cyclic resistance ratio were used to calculate the factor of safety (FS). A liquefaction potential index (LPI), probability of liquefaction (PL), and probability of liquefaction induced ground failure (PG) were used to assess the probability of liquefaction. The peak ground acceleration (g) values ranged from 0.166 to 0.281 g, whereas spectral acceleration (g) was found to be high at 0.1–1s. The liquefaction susceptibility screening criteria revealed that the study area is highly susceptible to liquefaction. FS is < 1 for a liquefied site, but FS is > 1 for non-liquefied sites. In comparison to non-liquefied sites, the liquefaction forecast site has a liquefaction potential index value of 0–54.16, very likely high PL, and high PG. The findings will be helpful in the design of structures and in solving practical challenges in earthquake engineering.
Globally, earthquake hazard is causing thousands of victims and deaths, hundreds of billion dollars of infrastructure damages, and environmental losses (Pirhadi et al., 2018; Irinyemi et al., 2022). The earthquake activities in Ethiopia are mostly associated with the Afar depression, the escarpment and the Ethiopian rift system as these areas are seismic source zones due to their tectonic, geologic and seismic characteristics (Gouin, 1979; Mammo, 2005; Ayele, 2017; Wilks et al., 2017; Fentahun et al., 2021). The main Ethiopian rift (MER) system is mainly responsible for triggering earthquakes in Ethiopia (Wilks et al., 2017; Lamessa et al., 2019). It has resulted in the loss of human lives and damage to infrastructure (Gouin, 1979; Kebede and Van Eck, 1997; Mammo, 2005; Ayele et al., 2021).
Liquefaction is one of the most devastating seismic hazards related to earthquakes in the world. It occurs when earthquake shaking and increased pore water pressure reduce the strength and stiffness of soil (Marcuson, 1978; Papathanassiou et al., 2011; Tehran et al., 2016; Bahari et al., 2020; Ansari et al., 2022). Therefore, the evaluation of the liquefaction susceptibility and its resistance is an important component of seismic hazard assessment in an earthquake-prone region. In many towns in Ethiopia, including the research area, a recent earthquake with a moment magnitude (Mw > 5) in 2016 of the Gregorian calendar (G.C) caused damage to buildings (Wilks et al., 2017; Lamessa et al., 2019) but no research in the study area has yet been done on the prediction of earthquake-induced liquefaction hazard and local site effects analysis, which is aimed at minimizing such earthquake hazards. Earthquake-induced liquefaction can cause the failure of foundations, soil embankments, and dams, especially in cities built on young alluvial and lacustrine sediments. These failures ultimately affect the social and financial status of the region (Pokhrel et al., 2013; Ahmad et al., 2019; Subedi and Acharya, 2022). As a result, the damage from earthquake-induced liquefaction is often worse than the damage caused by the other effects of an earthquake around the world. Therefore, sites that may be highly prone to earthquake-induced liquefaction and local site effects related to amplification should be identified in order to reduce the damage from the earthquake disaster and loss of lives. The liquefaction potential of soils depends on grain size distribution, fines content, geological time, sedimentation, permeability, earthquake magnitude, and earthquake duration (Özaydın, 2007; Meisina et al., 2022). Therefore, identifying the liquefaction susceptibility criteria is very important to evaluate the area with high susceptibility to liquefaction.
The liquefaction potential evaluation of soils is determined using laboratory (Polito, 2001; Bray et al., 2004; Li et al., 2022) and in-situ tests (Rahman and Siddiqua, 2017; Subedi and Acharya, 2022). Due to its high cost and the difficulty of bringing undisturbed samples and conducting high quality tests, the simplified procedure based on in-situ tests such as standard penetration tests (SPT), cone penetration tests (CPT), and Vs. measurements is widely practiced in the United States and most parts of the world. The simplified procedure, which was originated by Seed and Idriss (1971), uses SPT data for evaluating the liquefaction potential of granular soils (Seed et al., 1984; Youd et al., 2001; Youd and Idriss, 2001; Rahman, 2019). Over the years, the simplified procedure has been revised and updated with additional data and has become the most commonly used way to assess the liquefaction potential of granular soils (Harder, 1997; Robertson and Wride, 1998; Goren and Gelisli, 2017; Bahari et al., 2020). The CPT is used for liquefaction hazard evaluations (Robertson and Wride, 1988; Ahmad et al., 2021), which has also been revised and updated by Seed and de Alba (1986), Stark and Olson (1995), Olsen (1997), Robertson and Wride (1998), and Boulanger and Idriss (2014). The liquefaction potential evaluation based on the SPT and CPT data are fairly well developed. However, the penetration tests may be impractical or unreliable at some sites when penetration tests are not conveniently performed at all depths. A promising alternative to the deterministic-based approaches is provided by in situ measurements of small-strain Vs. to estimate the liquefaction potential of soils (Andrus and Stokoe, 1997; Andrus and Stokoe, 2000; Zhang, 2010; Ji et al., 2021). This study applied Vs. measurements using Multichannel analysis of surface wave (MASW) as; 1) the Vs. measurements are possible in hard soils where the SPT and CPT are difficult to penetrate or to collect undisturbed stiff soil samples or at the site where these may not be permitted; 2) Vs. is a basic mechanical property of soil materials directly related to the small-strain shear modulus; 3) the small-scale shear modulus is a parameter required for estimating the dynamic properties of soil and soil structure interaction analyses (Youd et al., 2001); and 4) it is non-invasive, cost-effective, and covers large areas in a short period of time. A factor of safety (FS) is used to determine the liquefaction potential (Uyanık et al., 2013; Ji et al., 2021). Iwasaki, (1978) has suggested a liquefaction potential index (LPI) to predict the severity of liquefaction at a specific site. A LPI is estimated by a FS against liquefaction at different depths. Equivalent linear response analysis (ELA) has been applied to determine peak ground acceleration (PGA) to estimate the cyclic stress ratio (Satyam and Towhata, 2016; Putti and Satyam, 2018; Hashash et al., 2020). The study area is located in the basin of thick lacustrine sediments, which can amplify the earthquake ground motion and may probably cause an earthquake-induced liquefaction hazard. Its vicinity to active seismic zones, rapid industrialization, poor control of construction practices and quality, lack of site effect information, and increased population growth rate make the study area highly susceptible to earthquake damage in the future. Therefore, this demands ELA and liquefaction potential analysis in Hawassa town. In this study, we used Vs-based liquefaction potential evaluation and ELA by supplementing SPT values in Hawassa town. In addition, we also used FS against liquefaction, LPI, probability of liquefaction (PL), and probability of ground failure (PG) to estimate the probability of liquefaction in the study area. The objectives of this work are to perform the equivalent linear response analysis (ELA), evaluation of liquefaction susceptibility, Vs-based liquefaction hazard analysis, and classify the site into different engineering classes based on the European and American codes. The Vs. and SPT were used to characterize the study area, whereas ELA was applied to determine PGA (g), 5% damped SA (g) and maximum strain (%) using the DeepsoilV.7 program. FS was utilized to evaluate the susceptibility of liquefaction. In addition, LPI, PL, and PG were used in this research work to evaluate the probability of liquefaction. The results showed amplification, probability of liquefaction, and ground deformation occuring at a shallow depth.
Hawassa town is located in the southern branch of the Main Ethiopian Rift (MER) system. The study area is geographically located at longitude 7°
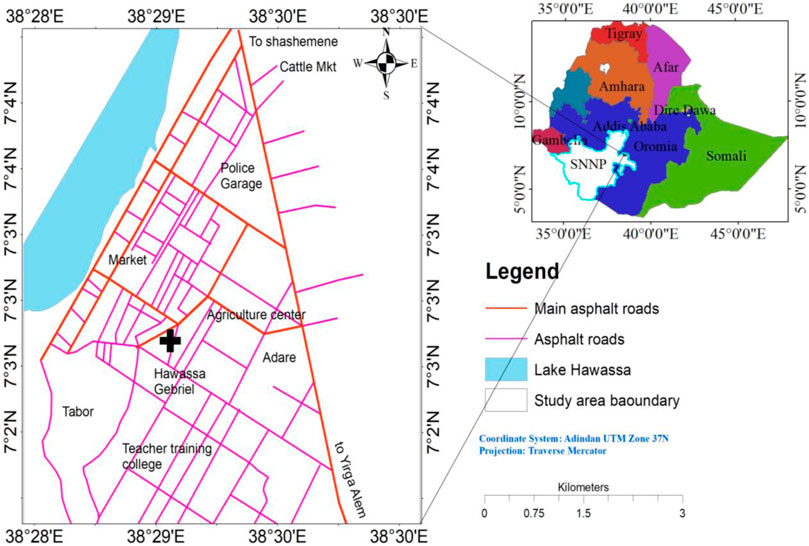
FIGURE 1. Location map of the study area.
The MER forms an active plate boundary between the Africa (Nubia) and Somalia plates in the northern East African Rift (EAR) system. In addition, the MER is an example of mature continental rifting at the northernmost part of the EAR. Thus, the EAR is one of the most geologically active features on Earth (Chorowicz, 2005; Lamessa et al., 2019). The MER is divided into northern, central and southern main sectors (Agostini et al., 2011; Wilks et al., 2017) based on the lithospheric characteristics (Keranen et al., 2004), crustal thickness and modification (Keranen and Klemperer, 2008). Hawassa town is located in the southern main Ethiopia rift (SMER) segment, which is largely fault controlled and actively deformed (Corti et al., 2013). As a result, it has faced low to intermediate magnitude earthquakes (Mw > 5) in recent years, which caused damage to buildings and created public concern in Hawassa town (Wilks et al., 2017).
Hawassa geology is composed of upper Miocene to Pliocene volcanic rocks of the Nazret group dominated by rhyolitic ignimbrites that form the basement of the MER (Woldegabriel, 1990; Žáček et al., 2014). According to Žáček et al. (2014), the lithological units in Hawassa town and its environs include (Figure 2) fluvial sediments, alluvial sediments, polygenetic sediments, Wondo Koshe pumice fall and flow deposits, scoria cones, tuff cones, Hawassa basalts, and Hawassa rhyolitic ignimbrites. A total of 19 Multichannel Analysis of Surface Wave (MASW), 10 SPT data (ARCON Design Build plc, 2018), and 10 BH (borehole) data (SDCSE, 2019) points which were used in this study are shown on the geological map (Figure 2).
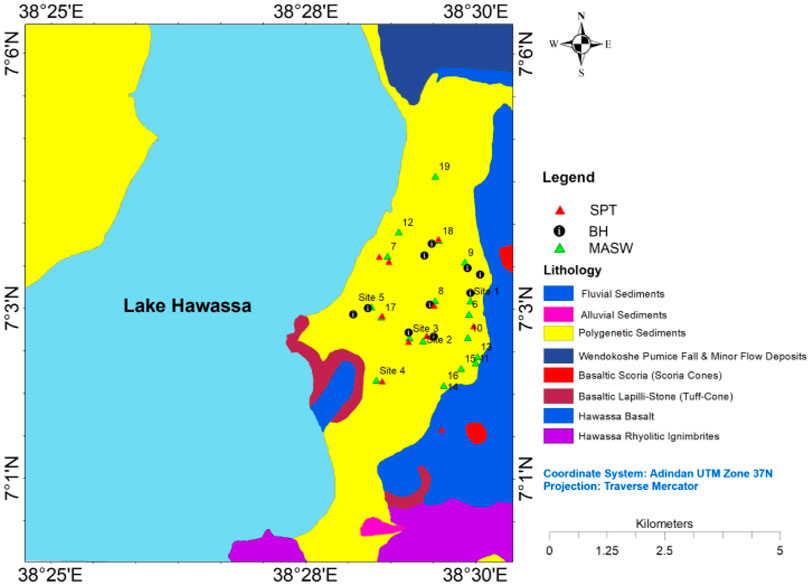
FIGURE 2. Geological map of the study area and its environs (modified after Žáček et al., 2014) with MASW, SPT, and BH data points.
The Vs. is the geotechnical parameter used to measure the mechanical properties of a soil. The Vs.30 is the travel time averaged shear wave velocity in the topmost 30 m of depth. In this study, insitu Vs. measurements were conducted at the different sites of Hawassa town using MASW in the field. MASW is a surface wave analysis method which is used to measure the Vs. at a surveyed site (Kramer, 1996; Nath and Jakka, 2012; Putti and Satyam, 2018; Kamel and Badreddine, 2020). Then, Vs.30 was calculated using Eq. 1 (Boore, 2004):
where Vs.30 is the shear wave velocity up to a depth of 30 m, Vi is the shear wave velocity for the ith layer in m/s, hi is the thickness of the ith soil layer in meters, and N is the number of layers in the top 30 m soil strata. SPT-N values are used to evaluate the dynamic properties of soils. The SPT was conducted inside boreholes using a standard hammer by weighing 63.5 kg and falling freely from a height of 760 mm based on the procedure of British standards (Figure 3A). Figure 3B shows SPT-N values of the last 300 mm of penetration for the corresponding depths in the wooden core boxes. A total of 19 MASW data points were collected for site characterization and classification (Figure 2). However, five typical sites of MASW data points were chosen for the detailed ELA and liquefaction hazard analysis by supplementing 10 SPT and 10 borehole (BH) data.
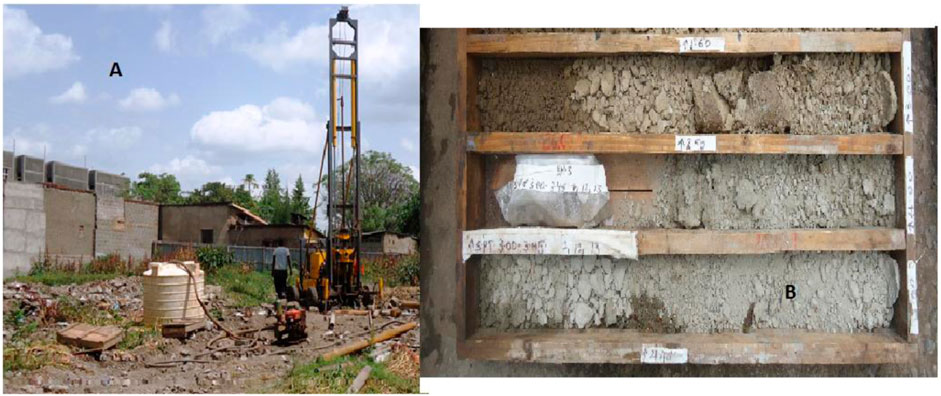
FIGURE 3. (A) Field investigations and excavation (B) SPT samples and wooden core boxes.
The liquefaction susceptibility is evaluated based on the properties of the soil. Many researchers (Tsuchida, 1970; Kramer, 1996; Seed et al., 2003; Bahari et al., 2020) have used the particle size, shape and gradation of soil to evaluate the susceptibility of liquefaction, while some research has reported the age of the deposit and depth of the groundwater level for the evaluation of susceptibility to liquefaction (Youd and Hoose, 1977; Youd and Perkins, 1987; Kavazanjian et al., 1997; Satyam and Towhata, 2016; Naik et al., 2020; Subedi and Acharya, 2022). In this study, the site’s susceptibility to liquefaction was evaluated according to (Tsuchida, 1970), which is very easy, acceptable worldwide, and shows gradation curve boundaries for most liquefiable and non-liquefiable soils (Figure 4).
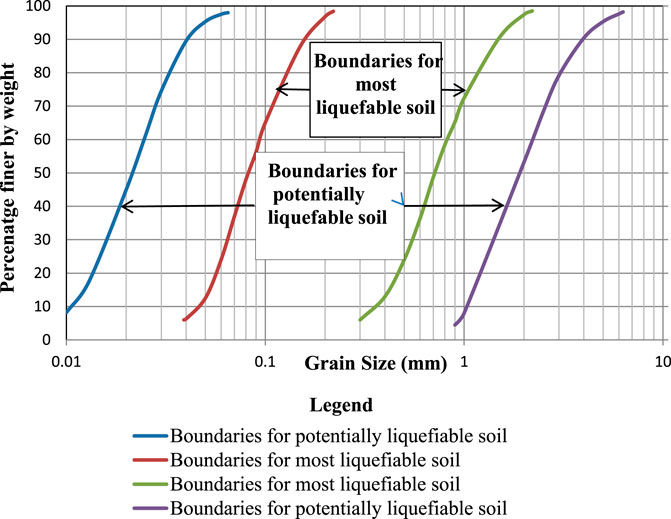
FIGURE 4. Limits in the gradation curves separating liquefiable and non-liquefiable soils (after Tsuchida, 1970).
A FS is used to evaluate liquefaction hazards using Vs. Several studies were used to estimate FS based on the Vs. data (Andrus and Stokoe, 2000; Oshnavie and Khalkha, 2019; Bahri et al., 2020; Ji et al., 2021) and it was calculated using Eq. 2 (Seed and Idriss, 1982).
where FS is the factor of safety, CSR is the cyclic stress ratio, and CRR is the cyclic resistance ratio. When the FS is > 1, it is assumed that no liquefaction will occur, but when the FS is < 1, liquefaction will occur. The CSR is the average cyclic shear stress (
where
where rd is stress reduction coefficient and z is a depth.
CRR, which is the cyclic resistance of a soil during an earthquake, is determined using the relationship between measured Vs., stress-corrected shear wave velocity (Vs1) and magnitude scaling factor (MSF) (Andrus and Stokoe, 1997; Youd et al., 2001; Uyanık, 2002; Uyanık and Taktak, 2009; Ortiz-Hernández et al., 2022) and thus CRR calculated using Eq. 5 (Andrus and Stokoe 2000).
where
where FC is the average fines content in percent by mass. The gradation curve showed the FC >40%. As a result, Eq. 6c was used to estimate the
To estimate Vs1 of soils (Sykora, 1987; Robertson et al., 1992; Uyanık et al., 2013) have used measured Vs. Thus, Vs.1 was calculated using Eq. 7 (Andrus and Stokoe, 2000).
where
where MSF is the magnitude scaling factor, Mw is the moment magnitude, and n is the standard, which depends on the amount of earthquake Mw. The standard value of n is −3.3 for Mw < 7.5 and n is −2.5 for Mw > 7.5 (Andrus and Stokoe, 1997; Andrus and Stokoe, 2000). Wilks et al. (2017) and Ayele (2017) have suggested the earthquake Mw of the study area has occurred in the past was less than 7.5. Therefore, the standard value of −3.3 was used. For the estimation of liquefaction potential index (LPI), Iwasaki et al. (1982) proposed equation for LPI, which was later summarized by Iwasaki, (1986), was used (Eqs 9a, 9b, 9c, 9d, and 9e).
where z is the depth of the midpoint of the soil layer, dz is the differential increment of depth, w (z) is the weighting factor, and F (z) is the severity factor. Eq. 10 shows the probability of liquefaction (PL) at each site was calculated using Eq. 10 (Juang et al., 2003).
where PL is the probability of liquefaction and FS is the factor of safety. PG is required information for making risk-based design decisions. Therefore, the PG for near foundation was estimated using Eq. 12 (Li et al., 2006).
where PG is probability of liquefaction induced ground failure and LPI is liquefaction potential index.
ELA was used to model non-linear soil parameters in terms of equivalent linear soil properties. The earlier researchers used peak ground acceleration (PGA), spectral acceleration (SA), and maximum strain (%) to predict the ground motion (Kramer, 1996; Yoshida et al., 2001; Eker et al., 2015; Putti and Satyam, 2018; Hashash et al., 2020; Soltani-Azar, 2022). Due to the unavailability of strong ground motion in Ethiopia, the Northridge ground motion (Mw 6.69) was consulted as an input motion from the Pacific Earthquake Engineering Research Center (PEER, 2010) database (http://peer.berkeley.edu) based on the target response spectrum of the region (Kramer, 1996; Kebede and Van Eck, 1997; Mammo, 2005; Yee et al., 2013; Alemu et al., 2018; Bahari et al., 2020). In addition, several researchers adopted the material properties from the families of normalized shear modulus reduction and damping curves of the DEEPSOILV.7 program for cohesionless soil (Seed and Idriss, 1970; Seed et al., 1986; Idriss, 1990; Mammo, 2005; Carlton and Abrahamson, 2014; Alemu et al., 2018; Rahman, 2019; Nguyen et al., 2020). Likewise, the families of normalized shear modulus reduction and damping curves developed by Seed et al. (1986) were consulted for this study, which were later modified (Darendeli, 2001) (Figures 5A,B).
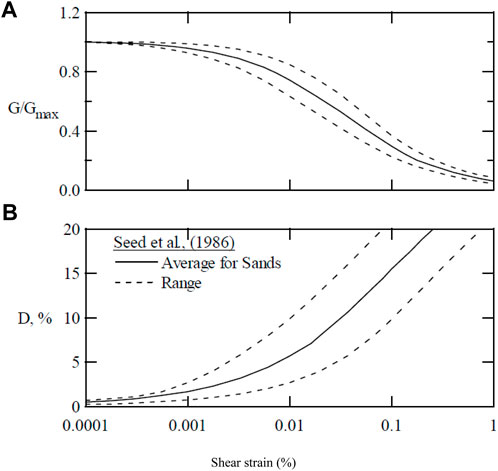
FIGURE 5. (A) Normalized modulus reduction (G/Gmax) and (B) material damping (D) curve (Seed et al., 1986) and later modified by (Darendeli, 2001).
A total of 19 MASW were conducted for the site characterization and classification to evaluate the local site conditions. The Vs.30 was used to characterize and classify the research region according to the seismic design codes. The estimated Vs.30 values of the study area range from 248.9 m/s to 371.3 m/s as shown in Table 1. The site class was classified as C and D classes based on the NEHRP (2015) code, but B and C classes were classified based on the EC8 (2003) code. The MASW data showed that 17 surveyed sites belong to the D class for NEHRP (2015) but C based on the EC8 (2003), whereas two sites were found to be C according to NEHRP (2015) (Figure 6A) and B based on the EC8 (2003) (Figure 6B). In addition, the study area was dominated by D seismic classes for NEHRP (2015) and C seismic classes for EC8 (2003). As compared to the previous studies (Eurocode-8, 2003; BSSC, 2015; Alemu et al., 2018), this study was given similar seismic site classes.
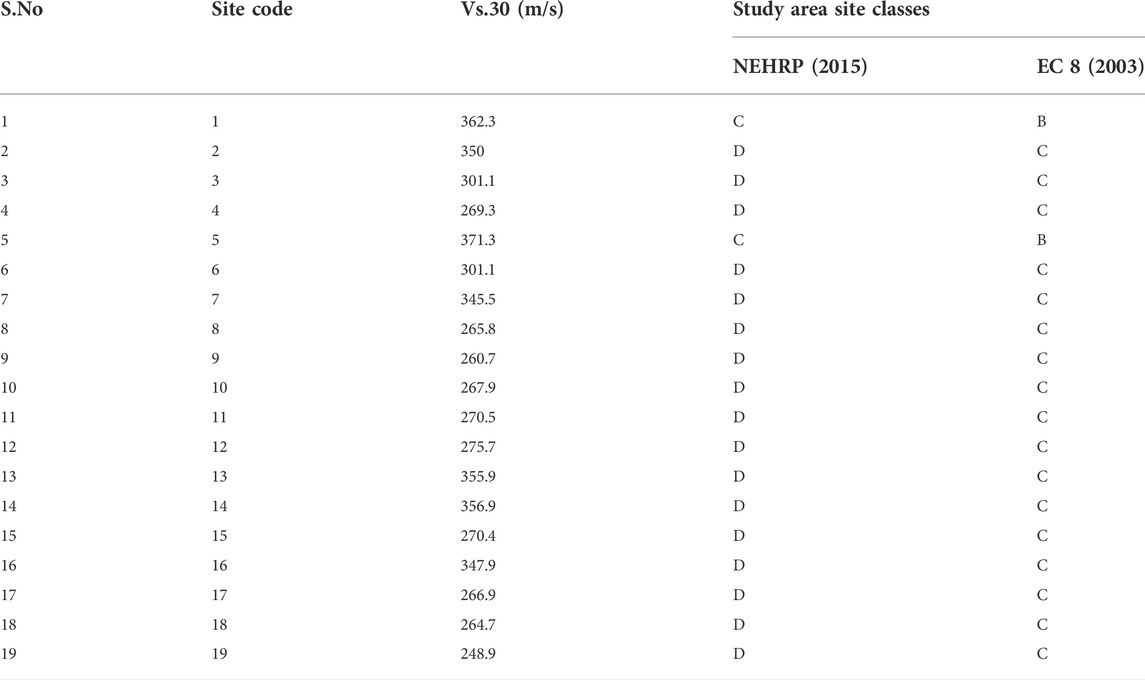
TABLE 1. The MASW data of the study area.
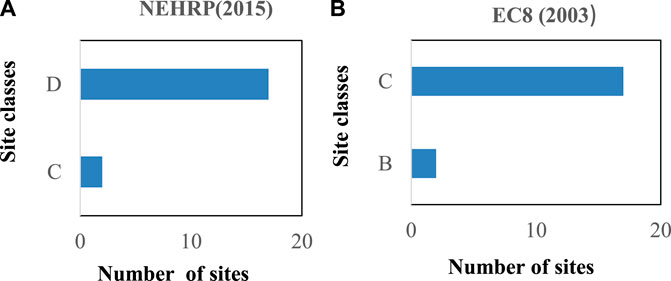
FIGURE 6. (A) Histogram of NEHRP (2015) site classification and (B) Histogram of site EC8 (2003) classification.
The results in Figure 7 showed the gradation curve in the research area. It was plotted that the soil samples taken from the study area were at a depth of 3 m, 6m, and 12 m. As it was seen from the results, the plotted grain size analysis curves of Hawassa town showed silty sand soil. From the graphs, the percentage of fines content (FC) was greater than 40%. The findings of this work are similar to those of Alemu et al. (2018).
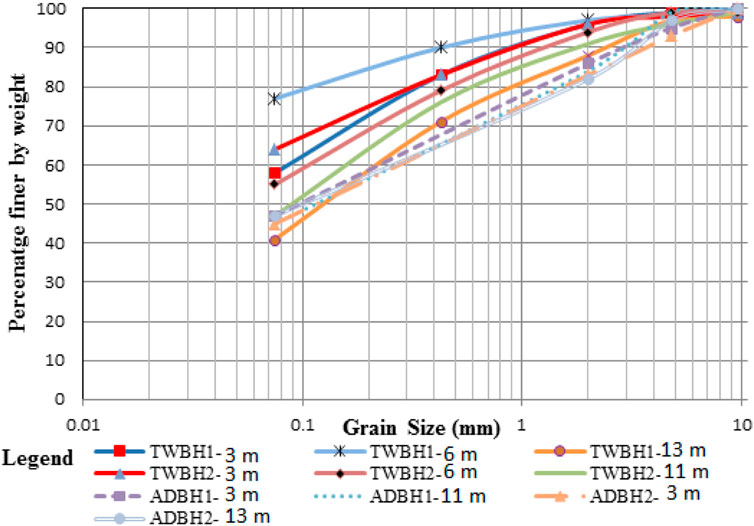
FIGURE 7. Grain size curves of the soil in the study area.
The SPT-N values at different depths and the lithological descriptions are shown at Table 2. Within the investigated depth of 0–13 m, volcanic materials such as silty sand soil profile were encountered. The volcanic material demonstrated variegated, light brown, and dull color. The SPT-N values revealed the resedimented pryroclastic material from loose/soft to medium stiff.
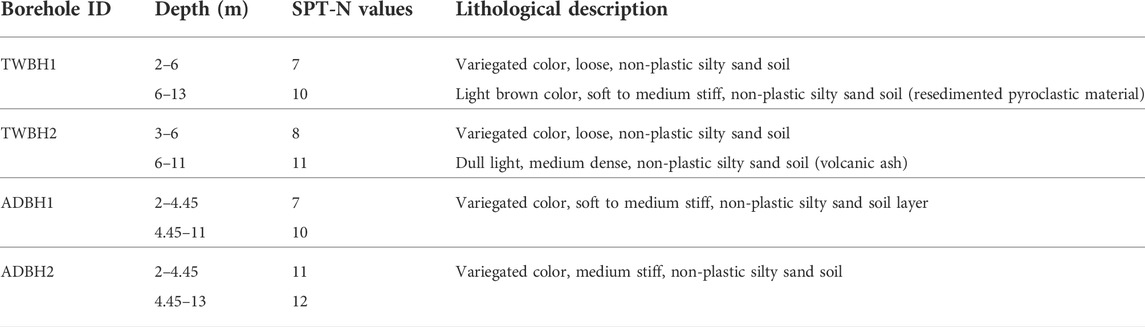
TABLE 2. SPT-N values and lithological descriptions.
Table 3 showed the laboratory results of soil in the study area. Each soil sample in the study area was classified based on the unified soil classification (USC). The Atterberg limit value was not possible (NP) to determine for each soil sample due to the absence of the plasticity property of soil. Thus, each soil sample in the research area showed silty sand (SM) soil. The FC (%) was greater than 40% for the analyzed soil in the study area. The results of this study are also the same as the previous results of Alemu et al. (2018).
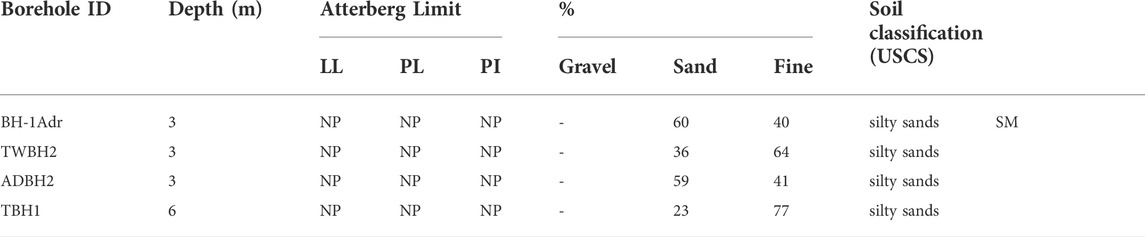
TABLE 3. Summarized geotechnical results in the study area.
Ground motion prediction parameters were determined using PGA (g) and SA (g) at the typical five sites. The Northridge ground motion with Mw 6.69 from the PEER database was used as an input to simulate the propagation of seismic waves from engineering bedrock to the ground surface. The soil thickness, groundwater table, density, and Vs. were used to simulate earthquake ground motion at a depth of 30 m since it is used as an input to evaluate local effects at a site. Then, for all five typical sites, the variation of PGA (g), maximum strain (%) and SA (g) at different depths were generated. At the ground surface, the generated PGA (g) values in Figure 8A showed: (i) 0.281 g for site 1, (ii) 0.234 g for site 2, (iii) 0.203 g for site 3, (iv) 0.166 g for site 4 and (v) 0.18 g for site 5. As a result, all the sites increased the reference input motion due to the local site effects. The results showed that the higher PGA (g) value was observed at site 1 as compared to other sites due to the shallow occurrence of the groundwater table (Rahman and Siddiqua, 2017; Alemu et al., 2018) The small increases of PGA (g) values were observed at site 4. In addition, the PGA (g) for site 1, site 2, site 3, site 4 and site 5 showed very low values at a depth range between 5 and 11 m. However, PGA (g) was found higher from the ground surface to a depth of 5 m for the five sites (Figure 8A). The plots of depth versus PGA (g) for the five sites followed similar patterns. The typical five sites in the study area showed high amplification from the considered depth to the surface for the input motion.
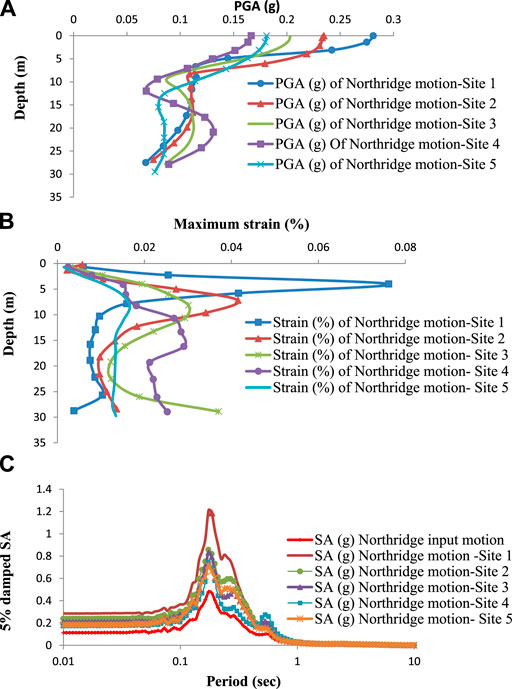
FIGURE 8. (A) PGA (g), (B) maximum strain (%) and (C) 5% damped SA (g) for site 1, site 2, site 3, site 4 and site 5.
The earthquake ground motion was greatly influenced by site local soil conditions, as shown by PGA values in Figure 8A. This result is also comparable to Alemu et al. (2018) but it showed more PGA (g) value as compared to other research works (Mammo, 2005; Ayele, 2017). As a result, the PGA (g) values for Hawassa town have the potential to amplify an earthquake ground motion to a significant degree, even more than the one provided by the seismic codes of Ethiopia (ES EN 1998:2015), which may aggravate the occurrence of earthquake-induced liquefaction. This result implies that the study area has got a higher PGA (g) value than the one specified by the well seismic standards (ES EN 1998:2015; Alemu et al., 2018; Puti and Satyam, 2018).
The maximum strain (%) for the five sites of Hawassa town was indicated (Figure 8B) at site 1; the maximum strain (%) was found to be increased at a depth of 5 m and then decreased up to the depth of investigation; at site 2, the maximum strain (%) was increased at a depth of 8 m and then showed a decreasing trend at a depth of 22 m before increase; at site 3, the maximum strain (%) was increased at a depth of 9 m, decreased at a depth of 23 m and finally started to increase at a depth of 28 m; at site 4, the maximum strain (%) was increased up to depth of 18 m before starts to a decreasing and at site 5, the maximum strain (%) was increased up to depth of 10 m and then it was decreased from a depth of 10–30 m. In addition, a higher strain was observed at site 1 than other sites whereas low strain was exhibited at site 5 (Figure 8B). Therefore, larger stress deformation will be expected for site 1 than the other sites for the simulated earthquake ground motion. The 5% damped SA (g) for the five sites of Hawassa town showed very high values at a period of 0.1–1 s (Figure 8C). At the period of 0.1–1 s, the 5% damped SA (g) of site 1, site 2, site 3, site 4 and site 5 was forecasted to be very high for the input ground motion. The analysis of 5% damped SA (g) was found to be 1.2 g for site 1, 0.81 g for site 2, 0.8 g for site 3, 0.71 g for site 4 and 0.7 g for site 5. The higher value of 5% damped SA (g) was observed at site 1 whilst the lower value of 5% damped SA (g) was shown at site 5. The highest value of 5% damped SA (g) at site 1 indicates that there will be high amplification for the earthquake Mw 6.69. From Figures 8A–C, it was also observed that the 5% damped SA (g) at the typical sites was nearly similar to that of Alemu et al. (2018).
The soil samples were analyzed to determine the susceptibility of liquefaction soil in the study area. Thus, the geotechnical characteristics of different soil samples were determined using the grain size distribution curves. The curves indicated the grain size of soils with engineering properties (Figure 9). In addition, the grain size curves also showed that the soils in all the analyzed samples were silty sand soils. As a result, the curve indicated the high liquefaction susceptibility of these soils (Tsuchida, 1970; Rahman and Siddiqua, 2017) as per the screening criteria. The grain size curves demonstrated all the soil samples in the research area at a depth of 1–13 m (Figure 9) fall at the boundaries of most liquefiable soil (Tsuchida, 1970) according to the preliminary screening liquefaction susceptibility criteria. In addition, the grain size analysis of the silty sand soil demonstrated that the soils are susceptible to liquefaction as per the screening criteria (Tsuchida, 1970; Rahman and Siddiqua, 2017; Alemu et al., 2018). As a result, the liquefaction susceptibility of soils mainly depends on the soil type of the site. The grain size distribution curve in this study exhibited high liquefaction susceptibility at the boundaries of most liquefiable soils (Figure 9) as compared to earlier research works (Seged and Haile, 2010; Satyam and Towhata, 2016).
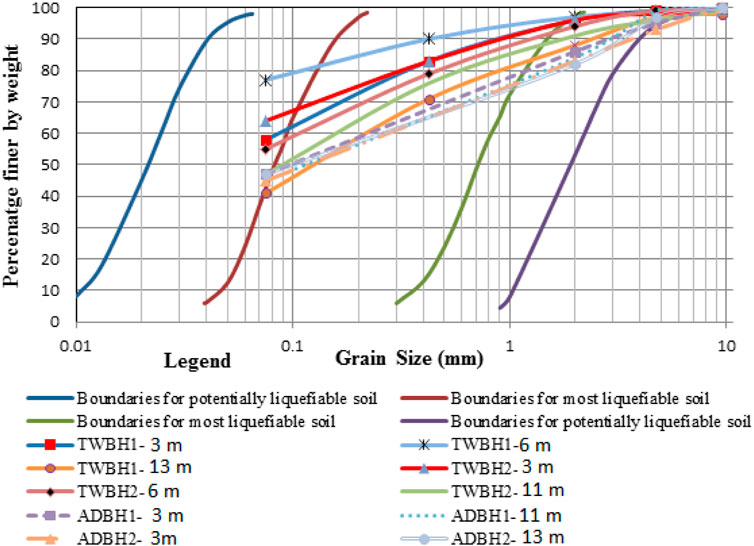
FIGURE 9. Liquefaction susceptibility criteria curves of silty sandy soil in the study area.
The study area comprised silty sand soil with a relative density of less than 50% based on the geotechnical data (ARCON Design Build plc, 2018). Therefore, liquefaction susceptibility was expected in the silty sand soil according to the screening criteria (Kramer, 1996; Kavazanjian et al., 1997). This is because the soil with a lower relative density was more susceptible to liquefaction than that with a soil higher relative density. The depth of groundwater in the study area ranges from 2 to 56 m (SDCSE, 2019). Therefore, the soil with a shallow ground water level shows higher liquefaction susceptibility than deep ground groundwater level (Kramer, 1996; Kavazanjian et al., 1997; Bourenane et al., 2018).
The CSR, CRR, and FS values were estimated to evaluate the liquefaction potential at five selected sites in Hawassa town. The liquefaction potential analysis for these sites was simulated with Mw 6.69 of Northridge earthquake ground motion. Therefore, based on the FS values, each liquefiable layer was delineated. At site 1, it was evident that the groundwater level (GWL) from the BH data were observed at a depth of 2 m. The Vs., CSR, CRR, and FS were determined up to a depth of 30 m. The plots of Vs., CSR, CRR, and FS versus depth are shown in Figure 10A. It was observed that, the Vs. for this site ranges from 168 m//s to 542 m/s. The VS was found to decrease up to 5 m before it started increasing up to a depth of 25 m. In addition, the Vs. showed a decrease in values at a depth >25 m. The CSR value was varied from 1.29 to 1.45. Therefore, the CSR values were greater than the FS limit. The value of CRR ranged from 0.007334 to 1.755. CRR value was less than FS limit as it goes to a depth of 9.5 m whereas CRR values were found to be greater than the FS limit when the depth is greater than 11.9 m. The FS values range from 0.00543 to 1.285. In addition, the FS was <1 when its depth ranges from 2 m up to 11.9 m depth while the FS was >1 at a depth starts from 11.9 m up to 30 m. Finally, the CSR, CRR, and FS values of the site have shown that liquefaction is expected from a depth range of 2 m up to 11.9 m, indicating the site was found to be liquefiable.
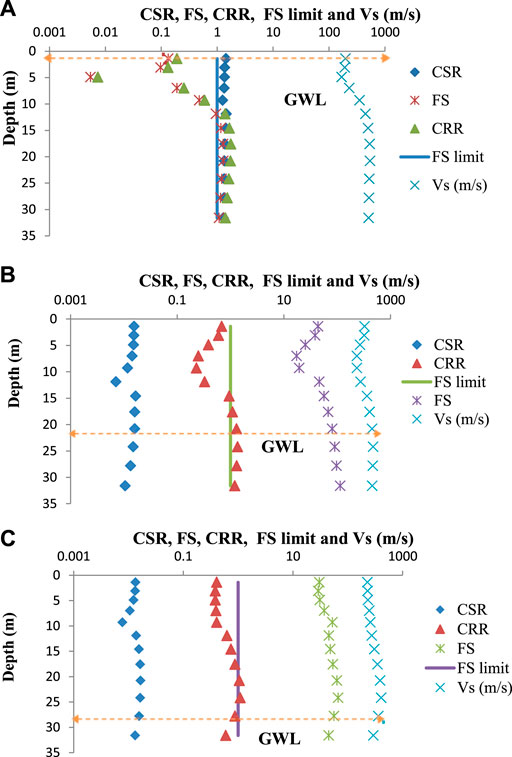
FIGURE 10. CSR, CRR, FS, and FS limit (A) at site 1, (B) at site 2 and (C) at site 3.
According to the results of site 2 (Figure 10B), the GWL from the BH data were found at a depth of 22.5 m, the Vs., CSR, CRR, and FS profile plot with a depth have shown that Vs. values range from 269 m/s to 452 m/s, CSR from 0.00708 to 0.016, and CRR from 0.229 to 1.361. The Vs. values decreased at a depth of 10 m before they started to increase. The FS at this site was greater than one that means it ranged from 17.38 to 114.29. According to the values of CSR and CRR, CSR was less than CRR. As a result, the FS value exceeds one. The values of FS at this site have shown that there is no liquefaction hazard at the given earthquake motion. From the BH data at site 3 (Figure 10C), the GWL was encountered at a depth of 27 m. As it was seen from the profile plot of depth versus Vs. it varies from 233 m/s to 390 m/s. This profile analysis shows that (i) the Vs. decreases from the surface to a depth of 9.5 m, increases at a depth of 11 m, and decreases at a depth of 30 m, (ii) the CSR values varies from 0.07749 to 0.0165, (iii) CRR values varies from 0.406 to 1.052, and (iv) FS ranges from 52.0407 to 63.41. Based on the comparison of CSR, CRR, and FS values, CRR higher than CSR and thus FS was greater than one. When the FS was >1for this site, then liquefaction will not be induced for the given earthquake ground motion. From the BH data at site 4, the GWL was encountered at 27.5 m. The Vs., CSR, CRR, and FS profile versus depth were presented in Figure 11A. The Vs. profile has been exhibited from 241 m/s to 284 m/s. Furthermore, the Vs. were increased at a depth of 9.5 m. After this depth, the Vs. have shown decreasing or relatively constant. The values of CSR ranged from 0.00442 to 0.0203, CRR from 0.292 to 0.481 and the FS from 23.5 up to 66.2. The analysis of CSR and CRR has shown that CRR values are greater than CSR. Due to the higher value of CRR, the FS was found to be greater than one, indicating that this site doesn’t have any liquefaction problem. As it was seen from the results of site 5 in Figure 11B, the GWL was found at a depth of 24.8 m. The plot of Vs. value of this site ranges from 291 m/s to 444 m/s. In addition, its profile has shown that Vs. increase from the ground surface to a depth of 30 m. The CSR varied from 0.051 to 0.0123 while the CRR ranges from 0.423 up to 1.26. The earthquake resistance force at this site was greater than that of the driving cyclic stress at this site. Since the FS is > 1, the liquefaction problem doesn’t not exist on this site. Generally, the liquefaction potential is predicted where there is possibility of increase in pore water pressure and loss of shear strength occurred in a soil. Hence, the liquefaction potential was predictable at site 1 (Figure 10A) due to increase in pore water pressure and loss of shear strength occurred in a soil (Ganapathy and Rajawat, 2012; Setiawan and Jaksa, 2018; Subedi and Acharya, 2022), but the soil at site 2 as shown in Figure 10B and site 3 at Figure 10C, site 4 at Figure 11A and site 5 at Figure 11B was not predictable as they had no chance of pore water pressure and loss of shear strength for the given ground motion (Naik et al., 2020). Thus, the result of this study was supported by the findings of Ji et al. (2021).
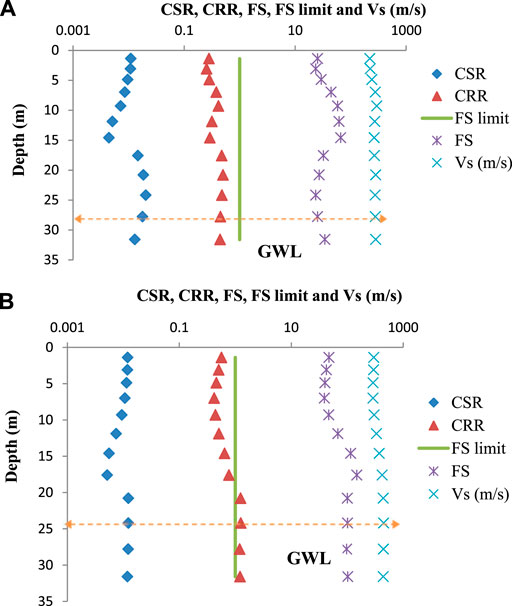
FIGURE 11. CSR, CRR, FS, and FS limit (A) at site 4 and (B) at site 5.
The LPI was evaluated for the selected sites to check the site probability of each liquefied layer. The LPI and PL were estimated for the sites by FS, whereas PG was determined for the five sites in Hawassa town based on the LPI values. The LPI values for the sites in Hawassa town have a range from 0 up to 54.16 as shown in Table 4. For the selected sites, the LPI values ranged from very 0 to 54.16 liquefaction potential categories. The LPI value was found to be 54.16 for site 1, 0 for site 2, site 3, site 4 and site 5. In addition, the liquefaction potential category for site 1 was found to be 54.16 and 0 for the site 2, site 3, site 4, and site 5. The PL and FS of site 1 varied from 0.21 to 1 and 0.00543 to 1.285, respectively. The PL for site 2, site 3, site 4, and site 5 were found to be less than 0 while the FS of site 2, site 3, site 4 and site 5 were greater than 23. Based on the classification of the PL and FS, site 1 is almost certain that it will liquefy for Mw 6.69. The PG value for site 1 varied from 0.0073 to 0.993, while the PG for site 2, site 3, site 4, and site 5 was nearly zero.
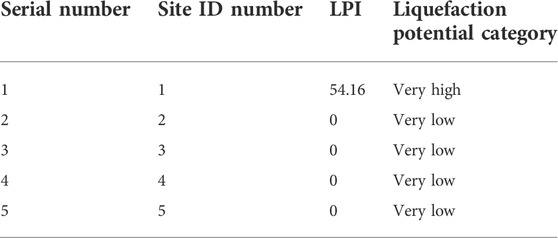
TABLE 4. LPI and liquefaction potential categories for site 1, 2, 3, 4 and 5 at Hawassa town.
The description of the risk of PG values for site 1 indicated a range from low to extremely high, while the description of the risk of PG values for site 2, site 3, site 4, and site 5 falls from extremely low to none. The LPI values for site 1 (Figure 12) has shown an increases from the surface to a depth of 9.3 m, decreases at a depth of 11.5 m and finally goes to zero from 14.6 to 30 m. According to the LPI values, only site 1 has very high liquefaction potential category but site 2, site 3, site 4, and site 5 have no liquefaction potential. The PG at site 1 will not cause ground failure at a depth greater than 11.5 m (Figure 12). As a result, the likelihood of liquefaction ground failure at a shallow depth should be considerable. The PL (Figure 12) will be higher at a shallow depth up to 10 m and then decrease from 11.6 to 30 m. The results of PL and PG for site 1 showed very high but for site 2, site 3, site 4, and site 5 very low values similar to Bahari et al. (2020).
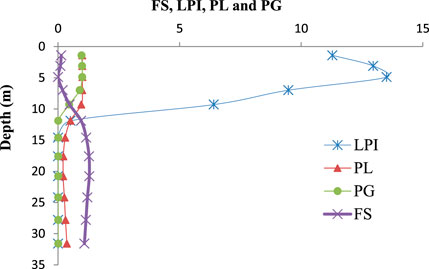
FIGURE 12. FS, LPI, PL and PG at site 1.
In the paper entitled “Site response and liquefaction hazard analysis of Hawassa town, Main Ethiopian Rift”, the ELA, liquefaction susceptibility criteria, FS, LPI, PL, and PG, which are most widely used in earthquake engineering, were employed. The main conclusions are summarized as follows:
✓ The Vs.30 values ranged from 248.9 m/s to 371.3 m/s. As a result, the study area falls into C and D seismic site classes on the accordance of NEHRP (2005) but into B and C based on the EC 8 (2003) code.
✓ The liquefaction susceptibility criteria demonstrated that the soils in the study area are highly susceptible to liquefaction since all the soil samples in the study area fall at the boundaries of most liquefiable soil.
✓ The ground motion prediction parameters like PGA (g), 5% damped SA (g), and maximum strain (%) were estimated for the study area in order to predict the potential of liquefaction for the earthquake of Mw6.69 with a PGA of 0.11 g using the DeepsoilV.7 program.
✓ The PGA (g) ranged for the sites at the ground surface from 0.166 to 0.281 g. So, the PGA (g) value is amplified at the shallow depth due to the local site effects.
✓ The maximum strain (%) has shown that the ground deformation reaches its maximum strain (%) at a shallow depth for the selected sites.
✓ The large value of 5% damped SA (g) occurred from 0.1 to 1 s but reached maximum values at 0.4 s. As a result, the engineering structure damage will be greater at selected sites when the period reaches 0.4s. Therefore, the Hawassa town needs site-specific seismic design in the period range between 0.1 and 1 s due to local site effects to minimize the settlement and deformation of civil engineering structures.
✓ FS value ranged from 0.00543 to 114.29. As a result, only one site is likely to liquefy due to high pore water pressure and loss of shear strength in the soil, but the other sites are unlikely to liquefy with similar conditions.
✓ LPI demonstrated that only one site has a very high probability of liquefaction due to high liquefaction potential values.
✓ The PL results also showed that only one site will liquefy at Mw 6.69, but the other typical sites will not liquefy.
✓ Generally, the FS, LPI, PL, and PG values have shown that there is a site that will be susceptible to liquefaction and ground settlements at a shallow depth. The site which is more susceptible to liquefaction hazards is due to increased pore water pressure and loss of shear strength in the soil.
✓ The results from this study suggest that the Ethiopian seismic code (ES EN 1998:2015) should be revised and updated by incorporating local site effects into the current seismic code to minimize earthquake hazard in the region. Moreover, enforcing the Ethiopian building codes will also reduce the susceptibility of the town.
✓ The results of this study and others revealed that comprehensive study of ELA and Vs-based liquefaction hazard analysis helps better understand the site conditions for seismic microzonation, earthquake mitigation and prevention purposes, and earthquake resistant design.
✓ The concerned government bodies at the town, region, and federal levels should take tangible action to mitigate the earthquake induced-liquefaction problems by densification of likely highly liquefiable sites. In general, the results from this study will provide important information for researchers, engineering designers, earthquake engineers, and planners to minimize earthquake induced-liquefaction hazards in Hawassa town.
Some of the data analyzed during this study was included in this article. The remaining datasets used for this study are available from the corresponding author and can be accessed upon reasonable request.
For the completion of this manuscript, AA was collected, processed, compiled, analyzed, and simulated the site response data using the DeepsoilV.7 program, liquefaction analysis, and write-up. MM and KW have critically reviewed the draft manuscript and have done technical editing and English correction in order to improve the overall quality of the manuscript. All the authors read and approved the final manuscript.
The author would like to thank both supervisors for their guidance and supervision on this research. He also would like to extend his gratitude to acknowledge ARCON Design Build plc for providing geotechnical data. The SDCSE would also be thanked for providing borehole data. Without the DeepsoilV.7 software and the Pacific Earthquake Engineering Research Center (PEER) database (http://peer.berkeley.edu), this article would not have been realized. Hence, they should be acknowledged for this important role.
CSR, Cyclic Resistance Ratio; CSR, Cyclic Stress Ratio; EAR, East African Rift System; EC8, Eurocode-8; ELA, Equivalent Linear Response analysis; FC, Fines content; FD, Frequency Domain; FS, Factor of Safety; GWT, Groundwater table; LPI, Liquefaction Potential Index; MER, Main Ethiopian Rift System; Mw, moment magnitude; NEHRP, National Earthquake Hazards Reduction Program; PEER, Pacific Earthquake Engineering Research Center; PG, Probability of liquefaction induced ground failure; PGA, Peak Ground Acceleration; PL, Probability of Liquefaction; SA, Spectral Acceleration; SMER, Southern Main Ethiopia Rift; SPT-N, Standard Penetration test blow counts; TWBH1- 3 m, Tikuri woha Borehole 1 grain size curve at 3 m depth; TWBH1-6 m, Tikuri woha Borehole 1 grain size curve at 6 m depth; TWBH1-13 m, Tikuri woha Borehole 1 grain size curve at 13 m depth; TWBH2-3 m, Tikuri woha Borehole two grain size curve at 3 m depth; TWBH2-6 m, Tikuri woha Borehole two grain size curve at 6 m depth; TWBH2-11 m, Tikuri woha Borehole two grain size curve at 11 m depth; ADBH1-3 m, Adare Borehole 1 grain size curve at 3 m depth; ADBH1-11 m, Adare Borehole 1 grain size curve at 11 m depth; ADBH2-3 m, Adare Borehole two grain size curve at 3 m depth; ADBH2-13 m, Adare Borehole two grain size curve at 13 m depth; Vs, Shear wave velocity; Vs.30, Average shear wave velocity up to a depth of 30 m.
The authors declare that the research was conducted in the absence of any commercial or financial relationships that could be construed as a potential conflict of interest.
All claims expressed in this article are solely those of the authors and do not necessarily represent those of their affiliated organizations, or those of the publisher, the editors, and the reviewers. Any product that may be evaluated in this article, or claim that may be made by its manufacturer, is not guaranteed or endorsed by the publisher.
Agostini, A., Bonini, M., Corti, G., Sani, F., and Mazzarini, F. (2011). Fault architecture in the main Ethiopian rift and comparison with experimental models: Implications for rift evolution and nubia–Somalia kinematics. Earth Planet. Sci. Lett. 301 (3-4), 479–492. doi:10.1016/j.epsl.2010.11.024
Ahmad, M., Tang, X. W., Qiu, J. N., and Ahmad, F. (2019). Evaluating seismic soil liquefaction potential using bayesian belief network and C4. 5 decision tree approaches. Appl. Sci. 9 (20), 4226. doi:10.3390/app9204226
Ahmad, M., Tang, X. W., Qiu, J. N., Ahmad, F., and Gu, W. J. (2021). Application of machine learning algorithms for the evaluation of seismic soil liquefaction potential. Front. Struct. Civ. Eng. 15 (2), 490–505. doi:10.1007/s11709-020-0669-5
Alemu, B. E., Worku, A., Wassie, G. M., and Habtesellasie, G. T. (2018). “Ground response analysis of representative sites of Hawassa city,” in Geotechnical earthquake engineering and soil dynamics V: Seismic hazard analysis, earthquake ground motions, and regional-scale assessment (Reston, VA: American Society of Civil Engineers), 422–434.
Andrus, R. D., and Stokoe, K. H. (1997). “Liquefaction resistance based on shear wave velocity,” in NCEER Workshop on Evaluation of liquefaction Resistance of soils, technical report NCEER-97-0022. Editors T. L. Youd, and I. M. Idriss. 89–128.
Andrus, R. D., and Stokoe, K. H. (2000). Liquefaction resistance of soils from shear-wave velocity. J. Geotech. Geoenviron. Eng. 126 (11), 1015–1025. doi:10.1061/(asce)1090-0241(2000)126:11(1015)
Andrus, R. D., Stokoe, K. H., Chung, R. M., and Juang, C. H. (2003). Guidelines for evaluating liquefaction resistance using shear wave velocity measurements and simplified procedures, 176. Springfield, VA: National Institute of Standards and Technology.
Ansari, A., Zahoor, F., Rao, K. S., and Jain, A. K. (2022). Liquefaction hazard assessment in a seismically active region of himalayas using geotechnical and geophysical investigations: A case study of the jammu region. Bull. Eng. Geol. Environ. 81 (9), 1–19. doi:10.1007/s10064-022-02852-3
Ayele, A. (2017). Probabilistic seismic hazard analysis (PSHA) for Ethiopia and the neighboring region. J. Afr. Earth Sci. 134, 257–264. doi:10.1016/j.jafrearsci.2017.06.016
Ayele, A., Woldearegay, K., and Meten, M. (2021). A review on the multi-criteria seismic hazard analysis of Ethiopia: With implications of infrastructural development. Geoenvironmental Disasters 8 (1), 9–22. doi:10.1186/s40677-020-00175-7
Bahari, B., Hwang, W., Kim, T. H., and Song, Y. S. (2020). Estimation of liquefaction potential in Eco-Delta City (Busan) using different approaches with effect of fines content. Int. J. Geoeng. 11 (1), 14–30. doi:10.1186/s40703-020-00121-4
Boore, D. M. (2004). Estimating s(30) (or NEHRP site classes) from shallow velocity models (depths < 30 m). Bull. Seismol. Soc. Am. 94 (2), 591–597. doi:10.1785/0120030105
Boulanger, R. W., and Idriss, I. M. (2014). CPT and SPT based liquefaction triggering procedures. Rep. No. UCD/CGM.- 14, 1.
Bourenane, H., Bouhadad, Y., and Tas, M. (2018). Liquefaction hazard mapping in the city of Boumerdès, Northern Algeria. Bull. Eng. Geol. Environ. 77 (4), 1473–1489. doi:10.1007/s10064-017-1137-x
Bray, J. D., Sancio, R. B., Riemer, M. F., and Durgunoglu, T. (2004). “Liquefaction susceptibility of fine-grained soils,” in Proc., 11th Int. Conf. on Soil Dynamics and Earthquake Engineering and 3rd Int. Conf. on Earthquake Geotechnical Engineering (Singapore: Stallion Press), 655–662.1
BSSC (Building Seismic Safety Council). (2015). Edition NEHRP recommended Seismic Provisions for New Buildings and Other Structures, FEMA P-1050-1 (Provisions and Commentary), Washington, D.C
Carlton, B., and Abrahamson, N. (2014). Issues and approaches for implementing conditional mean spectra in practice. Bull. Seismol. Soc. Am. 104, 503–512. doi:10.1785/0120130129
Chorowicz, J. (2005). The east African rift system. J. Afr. Earth Sci. 43 (1-3), 379–410. doi:10.1016/j.jafrearsci.2005.07.019
Corti, G., Philippon, M., Sani, F., Keir, D., and Kidane, T. (2013). Re‐orientation of the extension direction and pure extensional faulting at oblique rift margins: Comparison between the Main Ethiopian Rift and laboratory experiments. Terra nova. 25 (5), 396–404. doi:10.1111/ter.12049
Darendeli, M. B. (2001). Development of a new family of normalized modulus reduction and material damping curves. Texas: The University of Texas at Austin.
Eker, A. M., Koçkar, M. K., and Akgün, H. (2015). Evaluation of site effect within the tectonic basin in the northern side of Ankara. Eng. Geol. 192, 76–91. doi:10.1016/j.enggeo.2015.03.015
Eurocode-8 (2003). BS-EN 1998-1, Design of structures for earthquake resistance, part 1: General rules, seismic actions and rules for buildings. Brussels: European Committee for Standardization.
Fentahun, T. M., Bagyaraj, M., Melesse, M. A., and korme, T. (2021). Seismic hazard sensitivity assessment in the Ethiopian Rift, using an integrated approach of AHP and DInSAR methods. Egypt. J. Remote Sens. Space Sci. 24 (3), 735–744. doi:10.1016/j.ejrs.2021.05.001
Ganapathy, G. P., and Rajawat, A. S. (2012). Evaluation of liquefaction potential hazard of Chennai city, India: Using geological and geomorphological characteristics. Nat. Hazards (Dordr). 64 (2), 1717–1729. doi:10.1007/s11069-012-0331-1
Goren, S., and Gelisli, K. (2017). Determination of the liquefaction potential of soils of the northern sea command site (İstanbul, TTurkey based on SPT data. Adv. Biol. Earth Sci. 2 (2), 192–203.
Grasso, S., Massimino, M. R., and Sammito, M. S. V. (2020). New stress reduction factor for evaluating soil liquefaction in the coastal area of Catania (Italy). Geosciences 11 (1), 12. doi:10.3390/geosciences11010012
Harder, L. F. (1997). “Application of the Becker penetration test for evaluating the liquefaction potential of gravelly soils,” in Proc., NCEER Workshop on Evaluation of Liquefaction Resistance of Soils, 129–148.
Hashash, Y. M. A., Musgrove, M,I., Harmon, J. A., Okan, I., Xing, G., Groholski, D. R., et al. (2020). DEEPSOIL 7.0, User Manual. Urbana, IL: Board of Trustees of University of Illinois at Urbana-Champaign.
Idriss, I. M. (1990). in Response of soft soil sites during earthquakes. Editor H. Bolton Seed Memorial. ProcSymposium.
Irinyemi, S. A., Lombardi, D., and Ahmad, S. M. (2022). Seismic hazard assessment for Guinea, west Africa. Sci. Rep. 12 (1), 1–12. doi:10.1038/s41598-022-06222-7
Iwasaki, T. (1978). A practical method for assessing soil liquefaction potential based on case studies at various sites in Japan. Proc. Second Int. Conf. Microzonat. Safer Constr. Res. Appl. 2, 885–896.
Iwasaki, T. (1986). Soil liquefaction studies in Japan: State-of-the-art. Soil Dyn. Earthq. Eng. 5 (1), 2–68. doi:10.1016/0267-7261(86)90024-2
Iwasaki, T., Tokida, K. I., Tatsuoka, F., Watanabe, S., Yasuda, S., and Sato, H. (1982). “Microzonation for soil liquefaction potential using simplified methods,” in Proceedings of the 3rd international conference on microzonation (Seattle, 1310–1330.32
Ji, Y., Kim, B., and Kim, K. (2021). Evaluation of liquefaction potentials based on shear wave velocities in Pohang City, South Korea. Int. J. Geoeng. 12 (1), 3–10. doi:10.1186/s40703-020-00132-1
Juang, C. H., Yuan, H., Lee, D. H., and Lin, P. S. (2003). Simplified cone penetration test-based method for evaluating liquefaction resistance of soils. J. Geotech. Geoenviron. Eng. 129 (1), 66–80. doi:10.1061/(asce)1090-0241(2003)129:1(66)
Kamel, F., and Badreddine, S. (2020). Liquefaction analysis using shear wave velocity. Civ. Eng. J. 6 (10), 1944–1955. doi:10.28991/cej-2020-03091594
Kavazanjian, J. R, E., Matasovic, N., Hadj-Hamou, T., and Sabatini, P. J. (1997). Geotechnical engineering circular no. 3. design guidance: Geotechnical earthquake engineering for highways. Volume II-design examples. Washington, D.C, 20590.
Kebede, F., and Van Eck, T. (1997). Probabilistic seismic hazard assessment for the Horn of Africa based on seismotectonic regionalisation. Tectonophysics 270 (3-4), 221–237. doi:10.1016/s0040-1951(96)00215-6
Keranen, K., and Klemperer, S. L. (2008). Discontinuous and diachronous evolution of the Main Ethiopian Rift: Implications for development of continental rifts. Earth Planet. Sci. Lett. 265 (1-2), 96–111. doi:10.1016/j.epsl.2007.09.038
Keranen, K., Klemperer, S. L., and Gloaguen, R. (2004). Three-dimensional seismic imaging of a protoridge axis in the Main Ethiopian rift. Geol. 32, 949. doi:10.1130/G20737.1
Kramer, S. L. (1996). Geotechnical earthquake engineering. New Jersey: Prentice Hall Upper Saddle River, 07458.
Lamessa, G., Mammo, T., and K Raghuvanshi, T. (2019). Homogenized earthquake catalog and b-value mapping for Ethiopia and its adjoining regions. Geoenvironmental Disasters 6 (1), 16–24. doi:10.1186/s40677-019-0131-y
Li, D. K., Juang, C. H., and Andrus, R. D. (2006). Liquefaction potential index: A critical assessment using probability concept. J. Geoengin. 1 (1), 11–24.
Li, P., Tian, Z., Bo, J., Zhu, S., and Li, Y. (2022). Study on sand liquefaction induced by Songyuan earthquake with a magnitude of M5. 7 in China. Sci. Rep. 12 (1), 1–12. doi:10.1038/s41598-022-13549-8
Liu, A. H., Stewart, J. P., Abrahamson, N. A., and Moriwaki, Y. (2001). Equivalent number of uniform stress cycles for soil liquefaction analysis. J. Geotech. Geoenviron. Eng. 127 (12), 1017–1026. doi:10.1061/(asce)1090-0241(2001)127:12(1017)
Mammo, T. (2005). Site-specific ground motion simulation and seismic response analysis at the proposed bridge sites within the city of Addis Ababa, Ethiopia. Eng. Geol. 79 (3-4), 127–150. doi:10.1016/j.enggeo.2005.01.005
Marcuson, W. F. (1978). Definition of terms related to liquefaction. J. Geotech. Engrg. Div. 104, 1197–1200. doi:10.1061/ajgeb6.0000688
Meisina, C., Bonì, R., Bozzoni, F., Conca, D., Perotti, C., Persichillo, P., et al. (2022). Mapping soil liquefaction susceptibility across Europe using the analytic hierarchy process. Bull. Earthq. Eng. 20 (11), 5601–5632. doi:10.1007/s10518-022-01442-8
Naik, S. P., Gwon, O., Park, K., and Kim, Y. S. (2020). Land damage mapping and liquefaction potential analysis of soils from the epicentral region of 2017 Pohang Mw 5.4 earthquake, South Korea. Sustainability 12 (3), 1234. doi:10.3390/su12031234
Nath, R. R., and Jakka, R. S. (2012). “Effect of bedrock depth on site classification,” in 15th world conference on earthquake engineering 15WCEE (Lisbon, Portugal, 24–28.
Nguyen, V. Q., Aaqib, M., Nguyen, D. D., Luat, N. V., and Park, D. (2020). A site-specific response analysis: A case study in hanoi, vietnam. Appl. Sci. 10 (11), 3972. doi:10.3390/app10113972
Olsen, R. S. (1997). “Cyclic liquefaction based on the cone penetrometer test,” in Proceedings of the NCEER Workshop on Evaluation of Liquefaction Resistance of Soils (BuffaloNew York: State University of), 225–276.
Ortiz-Hernández, E., Chunga, K., Pastor, J. L., and Toulkeridis, T. (2022). Assessing susceptibility to soil liquefaction using the standard penetration test (SPT)—a case study from the city of portoviejo, coastal Ecuador. Land 11 (4), 463. doi:10.3390/land11040463
Özaydın, K. (2007). Liquefaction on Soils. 6thEarthquake Engineering Congress in Istanbul. Turkey, 231–255.
Papathanassiou, G., Seggis, K., and Pavlides, S. (2011). Evaluating earthquake-induced liquefaction in the urban area of Larissa, Greece. Bull. Eng. Geol. Environ. 70-1, 79–88. doi:10.1007/s10064-010-0281-3
Peer, (2010). Strong Ground motion database user manual. Beta Version. California: Pacific earthquake engineering center.
Pirhadi, N., Tang, X., Yang, Q., and Kang, F. (2018). A new equation to evaluate liquefaction triggering using the response surface method and parametric sensitivity analysis. Sustainability 11-1, 112. doi:10.3390/su11010112
Pokhrel, R. M., Kuwano, J., and Tachibana, S. (2013). A kriging method of interpolation used to map liquefaction potential over alluvial ground. Eng. Geol. 152 (1), 26–37. doi:10.1016/j.enggeo.2012.10.003
Polito, C. (2001). “Plasticity based liquefaction criteria,” in Proc. of the 4th intl. Conf. on recent advances in geotechnical earthquake engineering and soil dynamics.
Putti, S. P., and Satyam, N. (2018). Ground response analysis and liquefaction hazard assessment for Vishakhapatnam city. Innov. Infrastruct. Solut. 3-1, 12–14. doi:10.1007/s41062-017-0113-4
Rahman, M. (2019). Probabilistic seismic Hazard analysis with nonlinear site response and liquefaction potential evaluation for deep sedimentary deposits. PhD dissertation. Canada: University of British Columbia.
Rahman, M., and Siddiqua, S. (2017). Evaluation of liquefaction-resistance of soils using standard penetration test, cone penetration test, and shear-wave velocity data for Dhaka, Chittagong, and Sylhet cities in Bangladesh. Environ. Earth Sci. 76-5, 207–214. doi:10.1007/s12665-017-6533-9
Robertson, P. K., Woeller, D. J., and Finn, W. D. L. (1992). Seismic cone penetration test for evaluating liquefaction potential under cyclic loading. Can. Geotech. J. 29 (4), 686–695. doi:10.1139/t92-075
Robertson, P. K., and Wride, C. E. (1998). Evaluating cyclic liquefaction potential using the cone penetration test. Can. Geotech. J. 35 (3), 442–459. doi:10.1139/t98-017
Satyam, N. D., and Towhata, I. (2016). Site-specific ground response analysis and liquefaction assessment of Vijayawada city (India). Nat. Hazards (Dordr). 81 (2), 705–724. doi:10.1007/s11069-016-2166-7
Seed, H. B., and Idriss, I. M. (1970). Report No: Eerc 70-10. EERC, university of California.Soil moduli and damping factors for dynamic response analyzes
Seed, H. B., and Idriss, I. M. (1982). Ground motions and soil liquefaction during earthquakes. Oakland: Earthquake Engineering Research Institute Monograph.
Seed, H. B., Tokimatsu, K., Harde, r. L. F., and Chung, R. M. (1984). The Influence of SPT procedures in soil liquefaction resistance evaluations report no. UCB/EERC-84/15. Earthquake Engineering Research Center. Berkeley, California.
Seed, H. B., Wong, R. T., Idriss, I. M., and Tokimatsu, K. (1986). Moduli and damping factors for dynamic analyses of cohesionless soils. J. Geotech. Engrg. 112 (11), 1016–1032. doi:10.1061/(asce)0733-9410(1986)112:11(1016)
Seed, H. B., and De Alba, P. (1986). “Use of SPT and CPT tests for evaluating the liquefaction resistance of sands,” in Use of in situ tests in geotechnical engineering, 281–302.ASCE
Seed, H. B., and Idriss, I. M. (1971). Simplified procedure for evaluating soil liquefaction potential. J. Soil Mech. Found. Div. 97 (9), 1249–1273. doi:10.1061/jsfeaq.0001662
Seed, R. B., Cetin, K. O., Moss, R. E. S., Kammerer, A. M., Wu, J., Pestan, J. M., et al. (2003). Recent advances in soil liquefaction engineering: a unified and consistent framework, EERC-2003–06. Berkeley, California: Earthquake Engineering Research Institute.
Seged, H., and Haile, M. (2010). Earthquake induced liquefaction analysis of Tendaho earth-fill dam. Zede J. 27, 1–11.
Setiawan, B., and Jaksa, M. (2018). Liquefaction assessment using the CPT and accounting for Soil ageing. Aceh Int. J. Sci. Technol. 7 (3), 162–168. doi:10.13170/aijst.7.3.11544
Soltani-Azar, S., Madhu, M., Udaya Kumar, V., Dhingra, S., Kumar, N., Singh, S., et al. (2022). Nutritional aspects of people living with HIV (PLHIV) amidst COVID-19 pandemic: An insight. Curr. Pharmacol. Rep., 1–15. doi:10.1007/s40495-022-00301-z
Stark, T. D., and Olson, S. M. (1995). Liquefaction resistance using CPT and field case histories. J. Geotech. Engrg. 121 (12), 856–869. doi:10.1061/(asce)0733-9410(1995)121:12(856)
Subedi, M., and Acharya, I. P. (2022). Liquefaction hazard assessment and ground failure probability analysis in the Kathmandu Valley of Nepal. Geoenvironmental Disasters 9 (1), 1–17. doi:10.1186/s40677-021-00203-0
Sykora, D. W. (1987). Creation of a data base of seismic shear wave velocities for correlation analysis. Vicksburg, MS: Geotechnical LaboratoryU.S. Army Engineer Waterways Experiment Station. Miscellaneous Paper GL–87–26.
Tehran, B., Mehrzad, B., Haddad, A., and Jafarian, Y. (2016). Centrifuge and numerical models to investigate liquefaction-induced response of shallow foundations with different contact pressures. Int. J. Civ. Eng. 14 (2), 117–131. doi:10.1007/s40999-016-0014-5
Tsuchida, H. (1970). “Prediction and countermeasure against the liquefaction in sand deposits,” in Abstract of the seminar in the port and harbor (Chiyods, Tokyo: Research Institute), 31–333.
Uyanık, O., Ekinci, B., and Uyanık, N. A. (2013). Liquefaction analysis from seismic velocities and determination of lagoon limits Kumluca/Antalya example. J. Appl. Geophys. 95, 90–103. doi:10.1016/j.jappgeo.2013.05.008
Uyanık, O. (2002). Potential liquefaction analysis method based on shear wave velocity. PhD dissertation. Turkey: The School of Natural and Applied Sciences. DEU.
Uyanik, O., and Taktak, A. G. (2009). A New method for liquefaction analysis from shear wave velocity and Predominant Resonance Period. J. Nat. Appl. Sci. 13, 1.
Wilks, M., Ayele, A., Kendall, J. M., and Wookey, J. (2017). The 24th January 2016 Hawassa earthquake: Implications for seismic hazard in the Main Ethiopian rift. J. Afr. Earth Sci. 125, 118–125. doi:10.1016/j.jafrearsci.2016.11.007
Woldegabriel, G., Aronson, J. L., and Walter, R. C. (1990). Geology, geochronology, and rift basin development in the central sector of the Main Ethiopia Rift. Geol. Soc. Am. Bull. 102 (4), 439–458. doi:10.1130/0016-7606(1990)102<0439:ggarbd>2.3.co;2
Yee, E., Stewart, J. P., and Tokimatsu, K. (2013). Elastic and large-strain nonlinear seismic site response from analysis of vertical array recordings. J. Geotech. Geoenviron. Eng. 139 (10), 1789–1801. doi:10.1061/(asce)gt.1943-5606.0000900
Yoshida, N., Tokimatsu, K., Yasuda, S., Kokusho, T., and Okimura, T. (2001). Geotechnical aspects of damage in Adapazari city during 1999 Kocaeli, Turkey earthquake. Soils Found. 41 (4), 25–45. doi:10.3208/sandf.41.4_25
Youd, T. L., Idriss, I. M., Andrus, R. D., Arango, I., Castro, G., Christian, J. T., et al. (2001). Liquefaction resistance of soils: Summary report from the 1996 NCEER and 1998 NCEER/NSF workshops on evaluation of liquefaction resistance of soils. J. Geotech. Geoenviron. Eng. 127, 817–833. doi:10.1061/(asce)1090-0241(2001)127:10(817)
Youd, T. L., and Hoose, S. N. (1977). “Liquefaction susceptibility and geologic setting,” in Proc., 6th World Conf. on Earthquake Engineering Roorkee (India: Indian Society of Earthquake Technology), 37–42.6
Youd, T. L., and Idriss, I. M. (2001). Liquefaction resistance of soils: Summary report from the 1996 NCEER and 1998 NCEER/NSF workshops on evaluation of liquefaction resistance of soils. J. Geotech. Geoenviron. Eng. 127 (4), 297–313. doi:10.1061/(asce)1090-0241(2001)127:4(297)
Youd, T. L., and Perkins, D. M. (1987). Mapping of liquefaction severity index. J. Geotech. Engrg. 113 (11), 1374–1392. doi:10.1061/(asce)0733-9410(1987)113:11(1374)
Žáček, V., Rapprich, V., Aman, Y., Berhanu, B., Čížek, D., Dereje, K., et al. (2014). Explanation booklet to the set of geoscience maps of Ethiopia at a scale 1: 50,000: Sub-sheet 0738-C4 Hawassa. 46 pgs., 3 annexes, 4 maps Czech geological survey, prague; AQUATES a.s., prague; geological survey of Ethiopia. Addis Ababa.
Keywords: shear wave velocity, factor of safety, equivalent linear response analysis, liquefaction susceptibility, liquefaction hazard evaluation
Citation: Ayele A, Meten M and Woldearegay K (2022) Site response and liquefaction hazard analysis of Hawassa town, Main Ethiopian Rift. Front. Built Environ. 8:1014214. doi: 10.3389/fbuil.2022.1014214
Received: 08 August 2022; Accepted: 31 August 2022;
Published: 26 September 2022.
Edited by:
Mahmood Ahmad, University of Engineering and Technology, Peshawar, PakistanReviewed by:
Denise-Penelope N. Kontoni, University of the Peloponnese, GreeceCopyright © 2022 Ayele, Meten and Woldearegay. This is an open-access article distributed under the terms of the Creative Commons Attribution License (CC BY). The use, distribution or reproduction in other forums is permitted, provided the original author(s) and the copyright owner(s) are credited and that the original publication in this journal is cited, in accordance with accepted academic practice. No use, distribution or reproduction is permitted which does not comply with these terms.
*Correspondence: Alemayehu Ayele, YWxleDk4Z2VvQGdtYWlsLmNvbQ==
Disclaimer: All claims expressed in this article are solely those of the authors and do not necessarily represent those of their affiliated organizations, or those of the publisher, the editors and the reviewers. Any product that may be evaluated in this article or claim that may be made by its manufacturer is not guaranteed or endorsed by the publisher.
Research integrity at Frontiers
Learn more about the work of our research integrity team to safeguard the quality of each article we publish.