
95% of researchers rate our articles as excellent or good
Learn more about the work of our research integrity team to safeguard the quality of each article we publish.
Find out more
ORIGINAL RESEARCH article
Front. Built Environ. , 21 April 2021
Sec. Indoor Environment
Volume 7 - 2021 | https://doi.org/10.3389/fbuil.2021.676607
This article is part of the Research Topic Innovative Human-Centric Investigations and Technologies for Human Wellbeing and Health in the Built Environment View all 8 articles
The comfort requirements of occupants influence indoor-environmental factors and energy performance of buildings. Occupants are typically exposed to a multitude of indoor-environmental factors, including a variety of different thermal, auditory, visual, and air quality conditions. However, the bulk of past research and derivative indoor-environmental codes and standards concerning the comfort of occupants address the multiple indoor-environmental stimuli in isolation. Starting from a brief review of past research on multi-perceptual indoor-environmental assessments of occupants, the present study pursues an experimental approach to explore the potential cross-modal effects on the evaluation of indoor-environmental thermal, visual, and acoustic aspects. In this context, a laboratory space including two adjacent identical mock-up office rooms was used to conduct multi-aspect parametric studies with human participants. Different thermal, visual, and auditory conditions were maintained in these two units. In the course of the present study, 296 participants were exposed, on a short-term basis, to different combinations of thermal, visual, and auditory conditions. The experiments were intended to explore if the evaluation of one aspect of the indoor environment could be influenced by differences in the values pertaining to the other aspects. The experimental results are presented and discussed, including their limitations.
Building standards and guidelines regarding human comfort commonly address indoor-environmental requirements in isolation (Mahdavi et al., 2020a). However, typical indoor environments, such as office settings, are multi-dimensional and include a multitude of indoor-environmental factors (e.g., thermal, auditory, visual, and air quality conditions). In this context, not only single-aspect but also several multi-aspect research efforts have been conducted to better understand indoor-environmental exposure situations (Torresin et al., 2018; Schweiker et al., 2020). The more widely conducted single-aspect research efforts study the influence of one indoor-environmental aspect at a time, including the perception of occupants on thermal, visual, auditory, or air quality circumstances (see e.g., Edwards and Torcellini, 2006; Galasiu and Veitch, 2006; Wu and Mahdavi, 2014; Vardaxis et al., 2018).
Multi-aspect research efforts, on the other hand, investigate the combined effects of multiple indoor-environmental aspects, such as thermal and acoustic aspects or visual and acoustic aspects (see e.g., Bennett and Rey, 1972; Fanger et al., 1977; Höfert, 1988; Clausen et al., 1993; Laurentin et al., 2000; Nagano and Horikoshi, 2001, 2005; Pan et al., 2003; Witterseh et al., 2004; Balazova et al., 2007; Clausen and Wyon, 2008; Wong et al., 2008; Newsham et al., 2009; Tiller et al., 2010; Huang et al., 2012; Azmoon et al., 2013; Varjo et al., 2015; Te Kulve et al., 2016; Chinazzo et al., 2018, 2019; Jamrozik et al., 2018; Toftum et al., 2018; Yang and Moon, 2018, 2019). The combination of thermal and visual variables was most commonly studied (see e.g., Laurentin et al., 2000; Te Kulve et al., 2016; Chinazzo et al., 2018; Toftum et al., 2018). Comparatively fewer studies included other combinations of indoor-environmental conditions, such as visual and air quality circumstances (Newsham et al., 2009) or thermal and acoustic conditions (Nagano and Horikoshi, 2005; Tiller et al., 2010).
While such past research efforts on multi-aspect indoor-environmental exposure entail much valuable information, their overall yield is arguably limited (Mahdavi et al., 2020b) and their findings are frequently inconclusive. For instance, Nagano and Horikoshi (2005) show that the operative temperature has an influence on the auditory comfort evaluation of participants, but the thermal sensation evaluation of participants was not shown to be affected by noise. Another study (Pellerin and Candas, 2003) reports an influence of noise on thermal comfort in warm circumstances. However, the results imply no effect of temperature on auditory comfort, sensation, and preference. Other studies analyze the effect and interaction of thermal and visual conditions. Thereby, one study (Azmoon et al., 2013) suggests that higher light levels result in an improvement of thermal comfort evaluation, whereas another study (Yang and Moon, 2018) report that electric lighting has no impact on the thermal sensation of occupants. A recent effort (Bellia et al., 2021) explores the interaction between lighting and thermal comfort. Thereby, the authors confirm the findings of previous studies (Huebner et al., 2016; Wang et al., 2018) concerning the inconsistency of interactions between colored light and thermal perception. As potential reasons for this circumstance, the authors mention non-standardized methodologies or poor control of indoor-environmental conditions (Bellia et al., 2021). Moreover, the small number of test participants or gender-related differences could have played a role in the observed inconsistency.
The partly contradictory findings of previous research efforts pertaining to the impact of multi-aspect indoor-environmental factors on occupants point to the persisting need for further studies toward a deeper understanding of the perceptual processes and behavioral patterns of occupants under multi-aspect exposure situations. The present study is not suggested to remedy this situation as any single study is likely to achieve such a feat. Rather, the objective is to incrementally contribute to the corpus of past, ongoing, and future studies in this area. The expectation is that the growing extent and quality of experimental research in this area would facilitate the development of improved—more comprehensive—models of the complex processes of human perception and evaluation of complex indoor-environmental conditions.
The main aim of the conducted experimental study was to further explore the evaluation of people on multi-aspect indoor-environmental exposure situations under controlled conditions. To this end, the main research questions were coined in terms of the following null hypotheses:
H0_1 Participants’ thermal sensation/comfort evaluation of the same thermal conditions will not be affected by a difference in visual and/or auditory conditions.
H0_2 Participants’ visual sensation/comfort evaluation of the same visual conditions will not be affected by a difference in thermal and/or auditory conditions.
H0_3 Participants’ auditory sensation/comfort evaluation of the same auditory conditions will not be affected by differences in thermal and/or visual conditions.
As described in the following section of this article, the “differences” in visual and auditory conditions mentioned in these hypotheses were realized in terms of two distinctive settings in each case (i.e., with/without glare/noise). The collected data in the course of the experiments were analyzed to find out if these null hypotheses could be rejected.
This study was carried out including a total of 296 voluntary participants (189 females and 107 males). The individuals were mainly students between 21 and 23 years (47%), and between 24 and 26 years (29%). Table 1 includes information on the distributions of age, height, and weight of the participants differentiated according to gender. Most female individuals were at a height of 161–170 cm with a weight below 60 kg, whereas most male individuals were at a height of 171–180 cm, and a weight in the range of 71–80 kg.
To maintain consistency regarding the thermal resistance of the clothing of participants, they were asked to wear light indoor clothing. Specifically, choices of garment pieces were communicated to the participants prior to the experiments. Individual details of the clothing ensembles were visually inspected before the experiments and recorded as part of the questionnaires. Based on this information, the mean thermal resistance of the clothing can be suggested to be 0.6 ± 0.1 clo (in the summer term) and 0.7 ± 0.1 clo (in the winter term). The relative similarity of the winter and summer time clothing levels is due to the aforementioned clothing request communication to the participants. During the experiments, participants did not carry scarves, hats, or jackets.
The participants received general information about the experiments and the related procedure. This study strictly adhered to ethical principles and all participation was voluntary. None of the participants reported hearing or vision difficulties. The activities of participants during the experiment comprised quiet, seated office work, corresponding to an estimated metabolic rate of 1 met DIN EN ISO 7730 2006 (DIN, 2006). During the experiments, participants did not have the opportunity to control any devices (e.g., windows, blinds, light switches) or interact with other participants.
This study was carried out in a laboratory space in a university building in Vienna, Austria, involving two identical mock-up office units each with a floor area of 12 m2 and a volume of 30 m3 (3/4 m, height 2.5 m). Figure 1 illustrates a schematic plan of the two mock-up offices that are equipped with eight workplaces (four workplaces in each office unit). Each workplace included a table, a chair, a computer, a notepad, and a pen (see Figure 1). The office units did not have access to natural daylight and the window blinds were in the closed position throughout the experiments. The space was mechanically ventilated throughout the experiments.
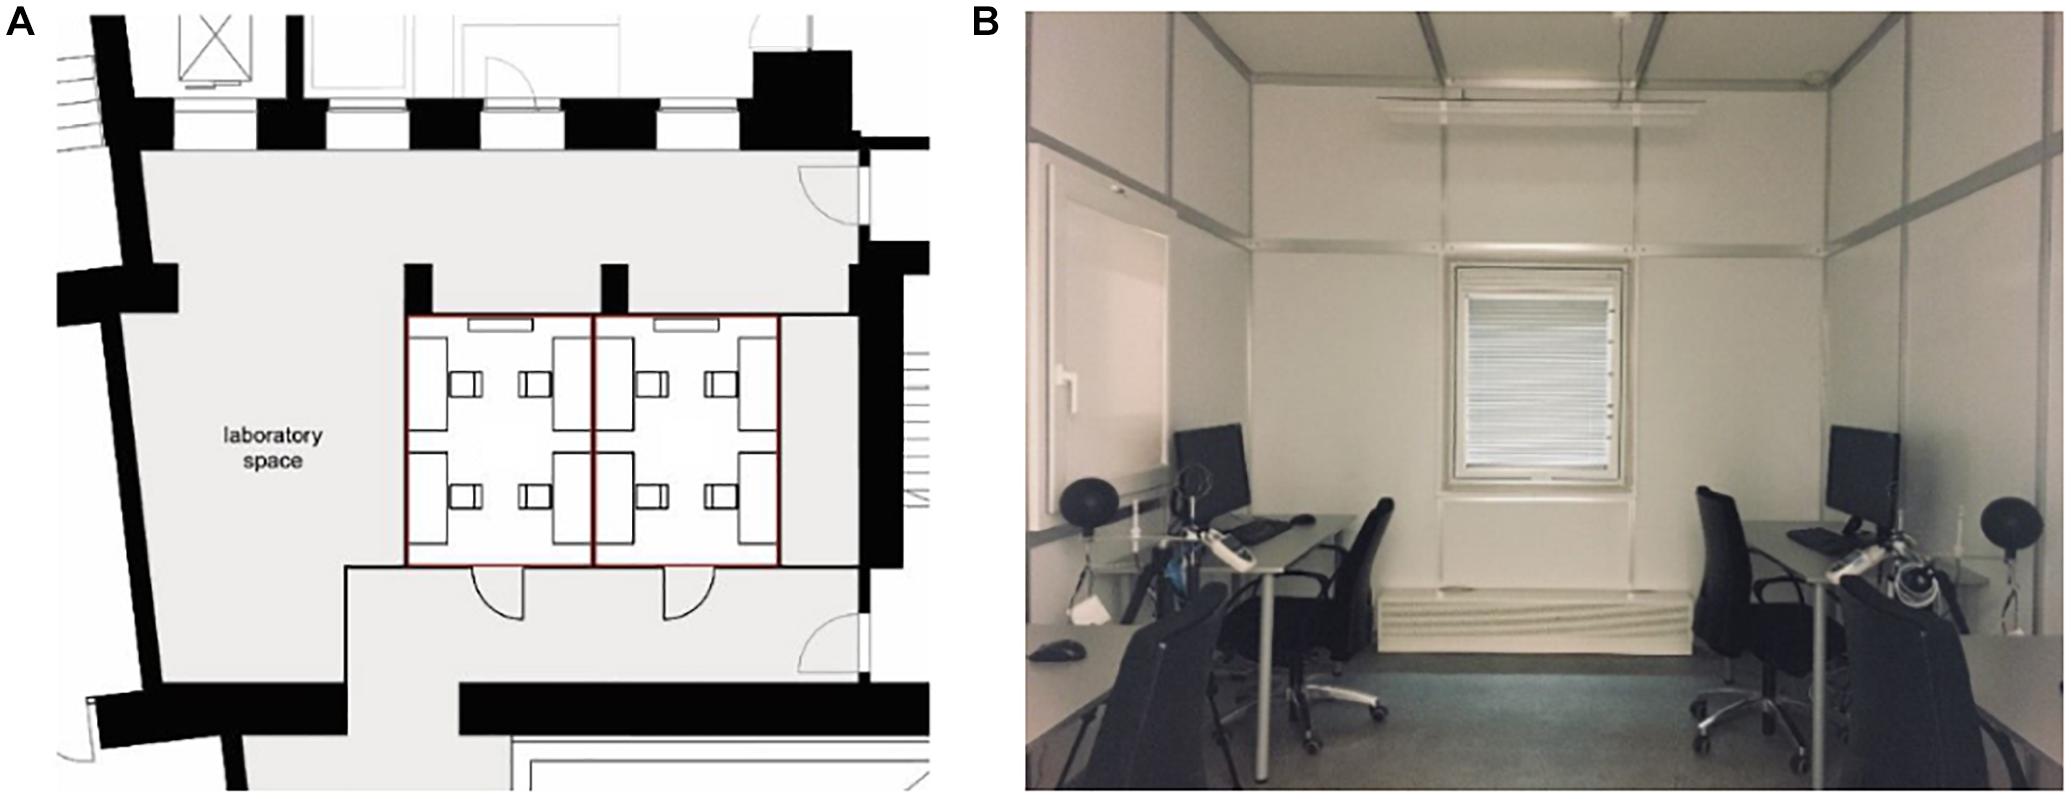
Figure 1. Schematic plan (including the position of low-velocity supply air diffusers in each room) (A) and view (B) of the mock-up office spaces within the larger laboratory space.
The laboratory space was equipped with a monitoring infrastructure to collect data regarding indoor-environmental conditions. Specifically, indoor-environmental parameters including air temperature and humidity, globe temperature, air velocity, CO2 concentration, illuminance, and sound pressure level were measured during the experiments. “Outdoor” auditory conditions, including the emulated traffic noise, were controlled in the larger laboratory space where the two mock-up spaces are located. To this end, a loudspeaker system was positioned outside the two mock-up office units. Table 2 provides an overview of the measurement devices of the used monitoring infrastructure. In addition, the glare intensity (expressed in terms of UGR) was measured using a digital reflex camera [Canon 70D (DSLR), Lens: SIGMA 4.5 mm/2.8 EX DC—Circular Fisheye] together with the software LMK LabSoft and the Add-on LMK Glare Analysis (LMK, 2020). Thereby, the UGR values were calculated according to the UGR method described by CIE 117-1995 (CIE, 1995).
Twelve different indoor-environmental circumstances (hereafter referred to as the “scenarios”) were created to test different combinations of thermal, visual, and auditory conditions. In the course of the present study, participants occupied the two mock-up office units, in groups of three or four, on a short-term basis.
In order to examine the different scenarios, a between-subject experiment was conducted. Thereby, participants were randomly exposed to 1 out of the 12 scenarios. Table 3 gives an overview of the different combinations of indoor-environmental conditions. The scenario code of Table 3 can be interpreted as follows: “T,” “V,” and “A” represent thermal (air temperature), visual, and auditory conditions. In case of thermal conditions, three distinct temperature ranges were maintained, namely “T1” (23.5 ± 0.5°C), “T2” (24.5 ± 0.5°C), and “T3” (25.5 ± 0.5°C). With regard to visual conditions, two visual settings were maintained, namely “V1” (involving no glare, UGR = 3.4) and “V2” (involving glare, UGR = 19.8). While the properties of a visual environment can be represented in terms of multiple indicators, the presence of direct or indirect sources of glare is considered to be a key, when assessing the perceived visual discomfort of occupants. Given the specific circumstance of the test bed (no daylight), UGR was deemed to be an appropriate and practically measurable indicator of the exposure of participants to visual conditions that could be potentially perceived as uncomfortable. The glare-inducing light source was positioned directly in the participants’ view field 70 cm above the desk level. In a similar way, with regard to auditory conditions, two settings were realized, namely “A1” involving a rather quiet acoustic condition [measured sound pressure level at the workstation = 40 dB(A)], and “A2” involving a louder condition due to the emulated traffic noise [measured sound pressure level at the workstation = 61 dB(A)]. Frequency spectrum information (octave band center frequency) regarding these two acoustic conditions is provided in Table 4.
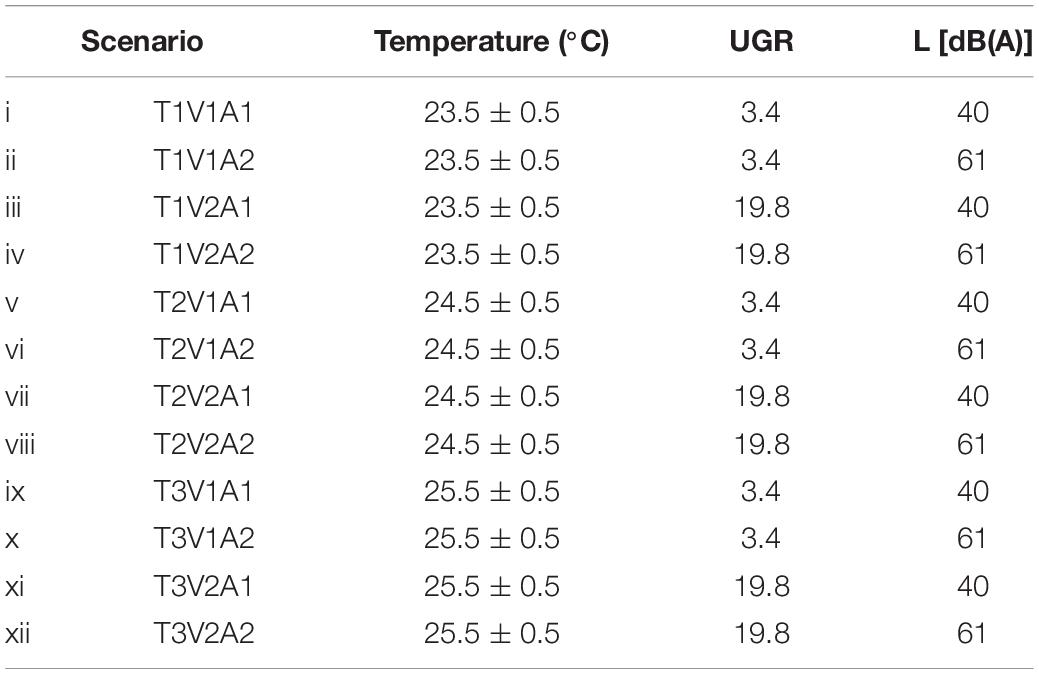
Table 3. Experimental scenario specifications with regard to prevailing thermal (air temperature), visual (glare level), and auditory (ambient sound level) conditions.

Table 4. Frequency spectrum (octave band center frequency) for the two ambient sound conditions A1 and A2 (with/without noise).
Throughout the experiments, a number of indoor-environmental variables (e.g., air temperature, air velocity, relative humidity, CO2 concentration) were monitored. Specifically, the indoor-environmental variables were measured on two positions in each room at a height of 1 m. As the values of the above listed variables remained fairly consistent across all scenarios, they were not considered to constitute differences in the experimental settings.
The exposure to the 12 indoor-environmental conditions was counterbalanced to ensure that all scenarios occurred equally often in the morning and in the afternoon. Moreover, the experimental study was carried out in both winter (December 2018 till January 2019) and summer seasons (May 2019).
Figure 2 schematically illustrates the experimental procedure. After a short adaptation phase and introduction to the general procedure of the experiment, the individuals were exposed to one of the scenarios on a short-term basis (lasting about 40 min). In the course of the experiment, participants performed simple reading and comprehension tasks (simulated typical office work) and were asked to complete a number of questionnaires. The first questionnaire pertained to general background information (e.g., age, gender). Later, participants were asked to give feedback with regard to thermal, visual, and acoustic sensation as well as comfort. Thereby, the questionnaires were formatted as categorical scales (CS) including a 7-point sensation scale and a 6-point comfort scale. The 7-point thermal sensation scale (ASHRAE Standard 55,2017) comprises the levels, namely cold, cool, slightly cool, neutral, slightly warm, warm, and hot. The 6-point thermal comfort scale includes the levels, namely very uncomfortable, uncomfortable, slightly uncomfortable, slightly comfortable, comfortable, and very comfortable. Note that, in this contribution, the numeric values corresponding to the thermal sensation scale levels are from −3 (cold) to +3 (hot). The numeric values associated with the thermal comfort scale levels are from 1 (very uncomfortable) to 6 (very comfortable). The sensation and comfort scales (and the numeric values) used for visual and acoustic evaluations were analogous to the thermal ones (see Table 5). At the end of the session, the individuals evaluated their general impression and the features of the room (e.g., ventilation, room size, and design features). The responses of participants to the questionnaires were collected and analyzed by using R (2021), which is a language and environment for statistical computing and graphics. In addition to the standard descriptive statistics, a more detailed analysis was conducted via Analysis of Variance (ANOVA) to formally evaluate the null hypotheses formulated at the outset. ANOVA can be described as “a statistical technique that assesses potential differences in a scale-level-dependent variable by a nominal-level variable having 2 or more categories” (Statistics Solution, 2020) or “a statistical procedure used to compare the mean values on some variable between two or more independent groups” (Boslaugh, 2012). Prior to the analysis of variance, the assumptions (i.e., independent samples, normality, and equal variances) were checked (Elliott and Woodward, 2007). In addition, a post-hoc Tukey’s Honestly Significant Difference (Tukey’s HSD) test was performed to compare pairwise scenarios.

Figure 2. Schematic illustration of the typical temporal sequence (in minutes) of the experiments (Q1 denotes the initial questionnaire and thermal, visual, and acoustic assessment, and Q2 denotes the post-adaptation questionnaire concerning thermal, visual, and acoustic sensation and comfort assessment).
As mentioned earlier, the research design of the experiments included two assumptions, which needed to be verified a priori in order to allow for a meaningful interpretation of the main results. On the one hand, it was assumed that the visual evaluation of participants would be significantly influenced by the introduction of the glare source in the environment. On the other hand, the second assumption suggested that the auditory evaluation participants would be significantly influenced by the introduction of a noise source and the resulting higher ambient sound levels. To examine these assumptions, the resulting mean visual and auditory comfort votes are shown in Table 6. Thereby, the mean visual comfort votes in the three temperature conditions (T1, T2, and T3) show that participants evaluated the scenario “V1A1” (including no glare and no noise) as being more comfortable than the scenario “V2A1” (including glare but no noise). The mean auditory comfort votes in the scenarios “V1A1” (including no glare and no noise) and “V1A2” (including noise but no glare) are also included in Table 6. Thereby, consistent with the assumption, participants evaluated the scenario without noise as more comfortable than the scenario with noise (a comfort vote of 1 denotes very uncomfortable and a vote of 6 denotes very comfortable).

Table 6. Mean (μ) and SE of thermal, visual, and acoustic sensation and comfort votes of participants.
As mentioned at the outset, the main objective of the experimental study was to specifically explore if the thermal evaluation of participants would be affected by glare-inducing visual circumstances or interference due to traffic noise. In this context, Figure 3 and Table 6 show, for all scenarios (see Table 3), the subjective evaluations of participants on thermal, visual, and acoustic comfort and sensation, including the mean and standard error (SE).
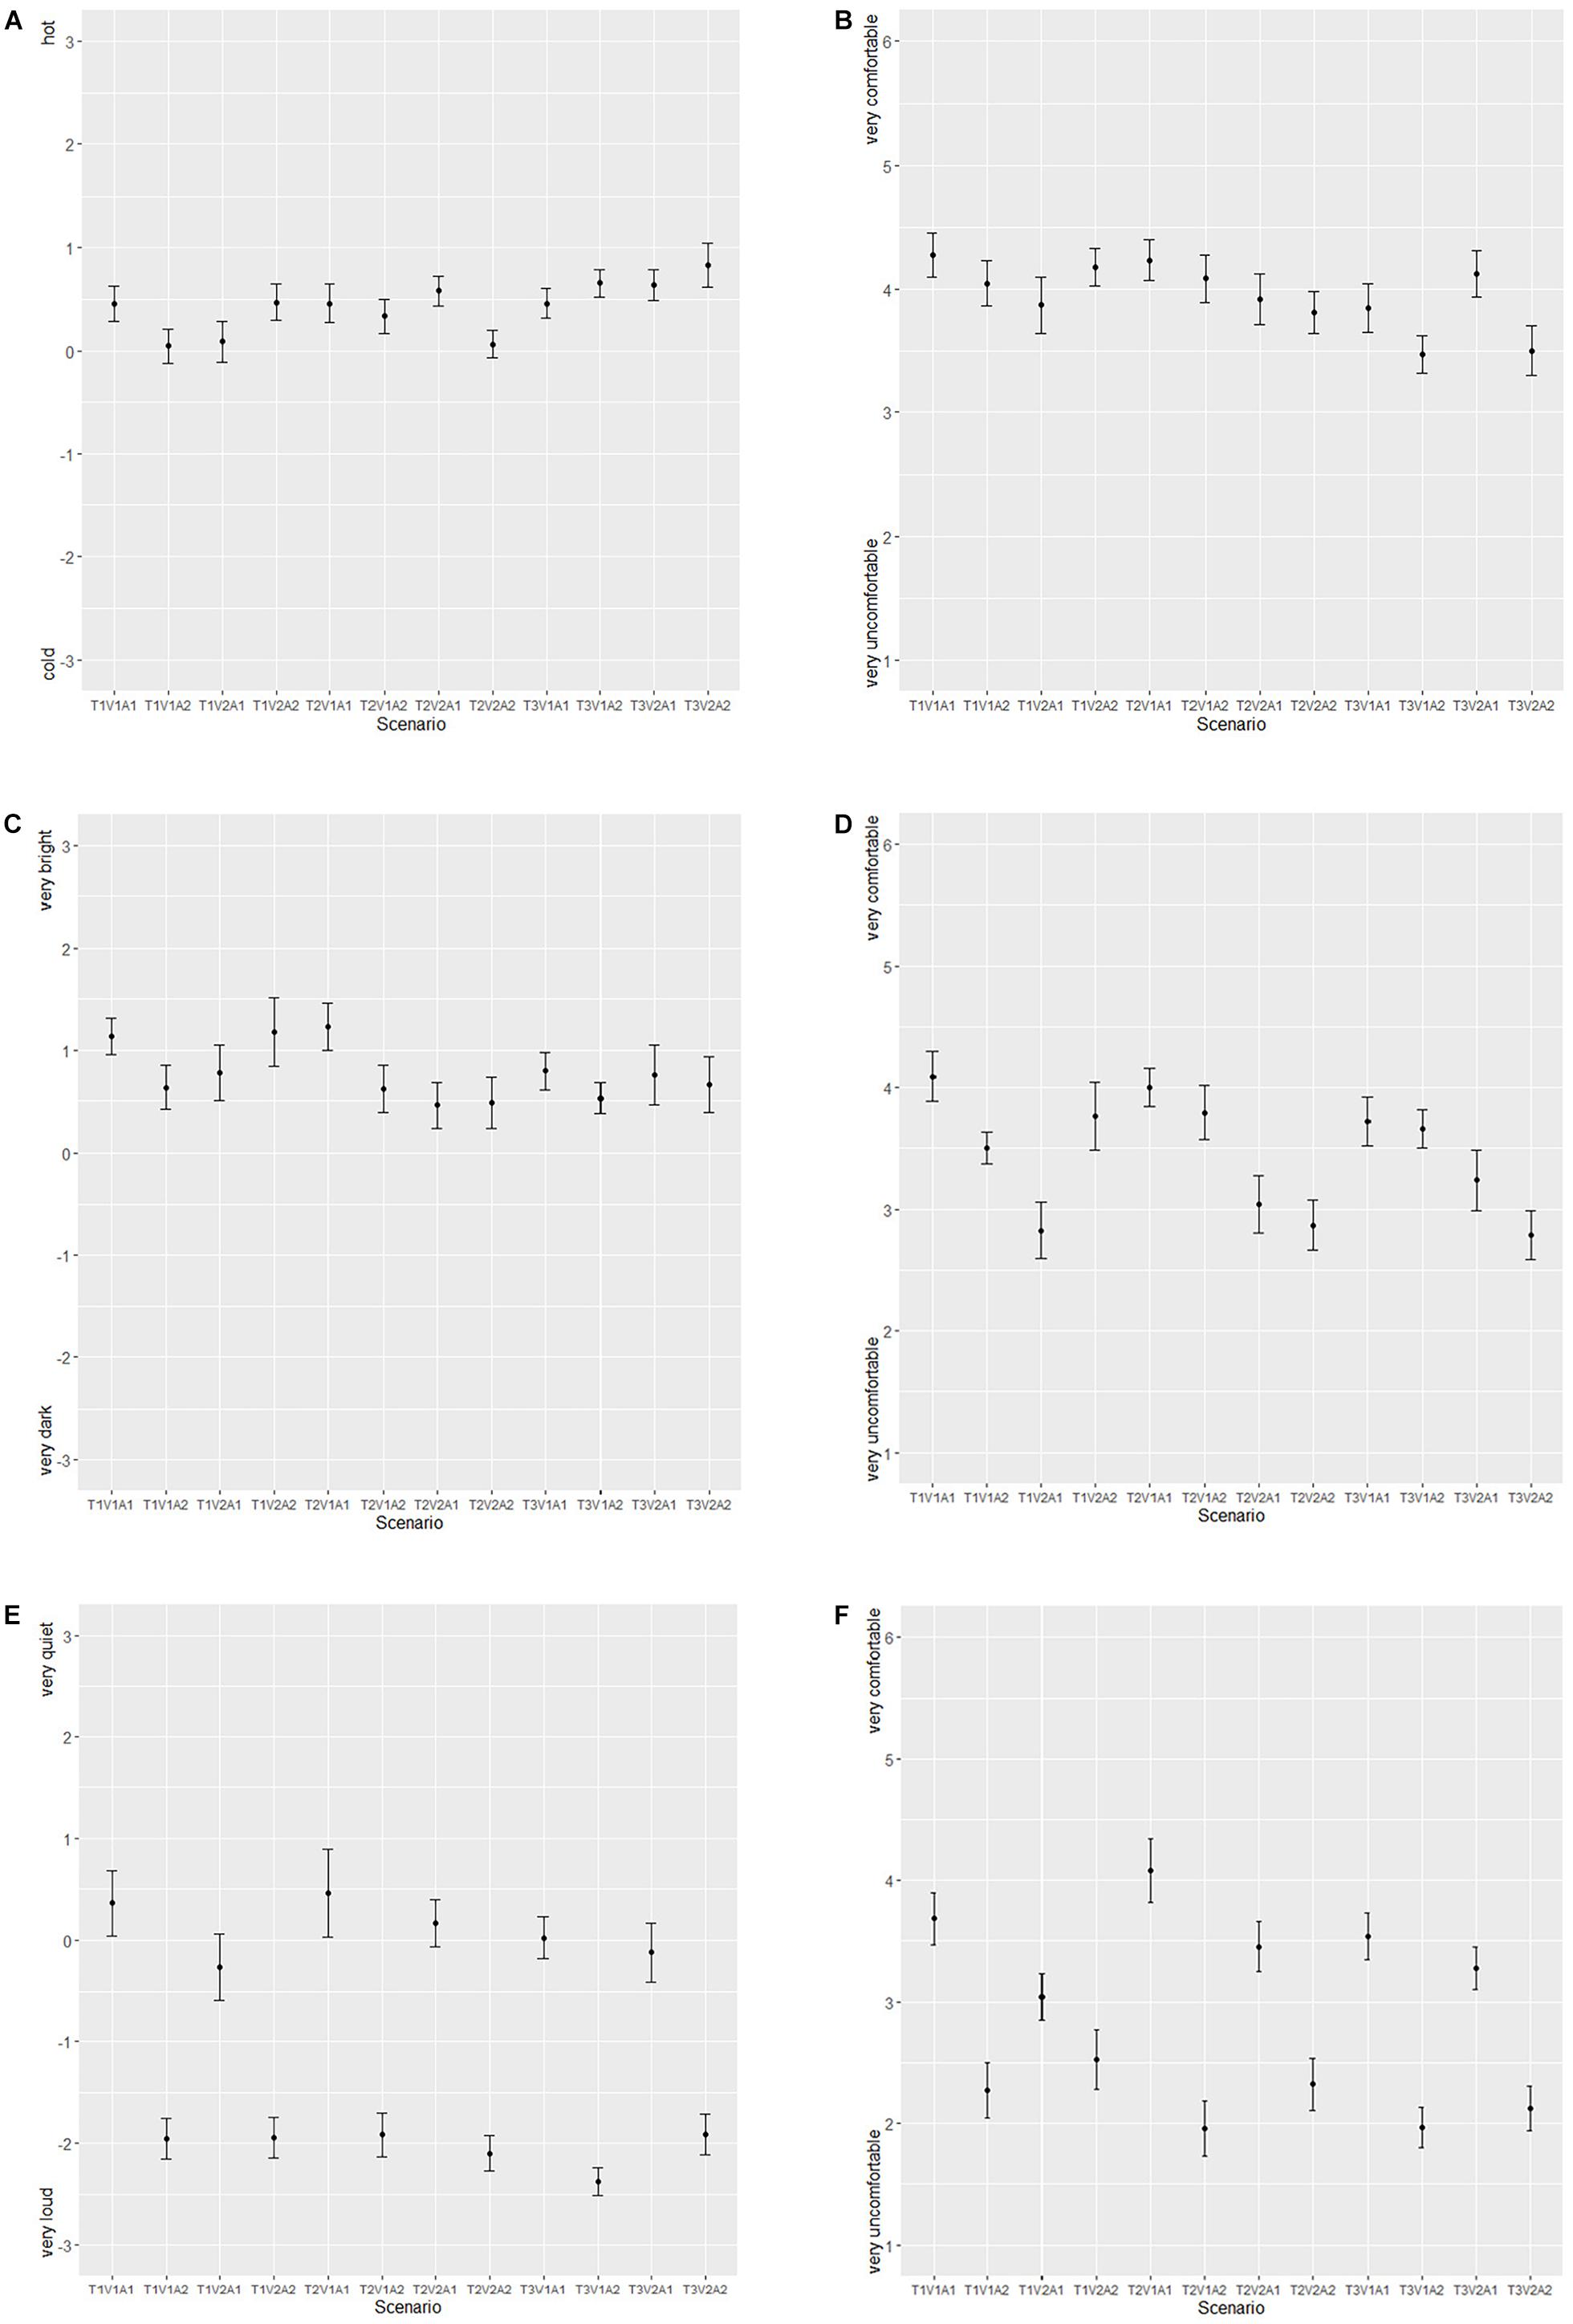
Figure 3. The thermal sensation (A) and thermal comfort (B), visual sensation (C) and visual comfort (D), and acoustic sensation (E) and acoustic comfort (F) of participants.
The thermal, visual, and acoustic sensation and comfort evaluations of participants for all three temperature ranges (T1, T2, and T3) are given in Figure 4. Thereby, to enhance the comparison possibility of the results, they are depicted in terms of the respective underlying distributions. Participants’ mean thermal, visual, and acoustic sensation and comfort votes are included in Table 7. Note that the number of participants is fairly similar in the four groups of scenarios. Moreover, the collected data were further analyzed (see Figure 5) to explore the potential differences in the evaluation of thermal sensation of participants due to the experimental time period (winter vs. summer) and gender of participants (female vs. male).
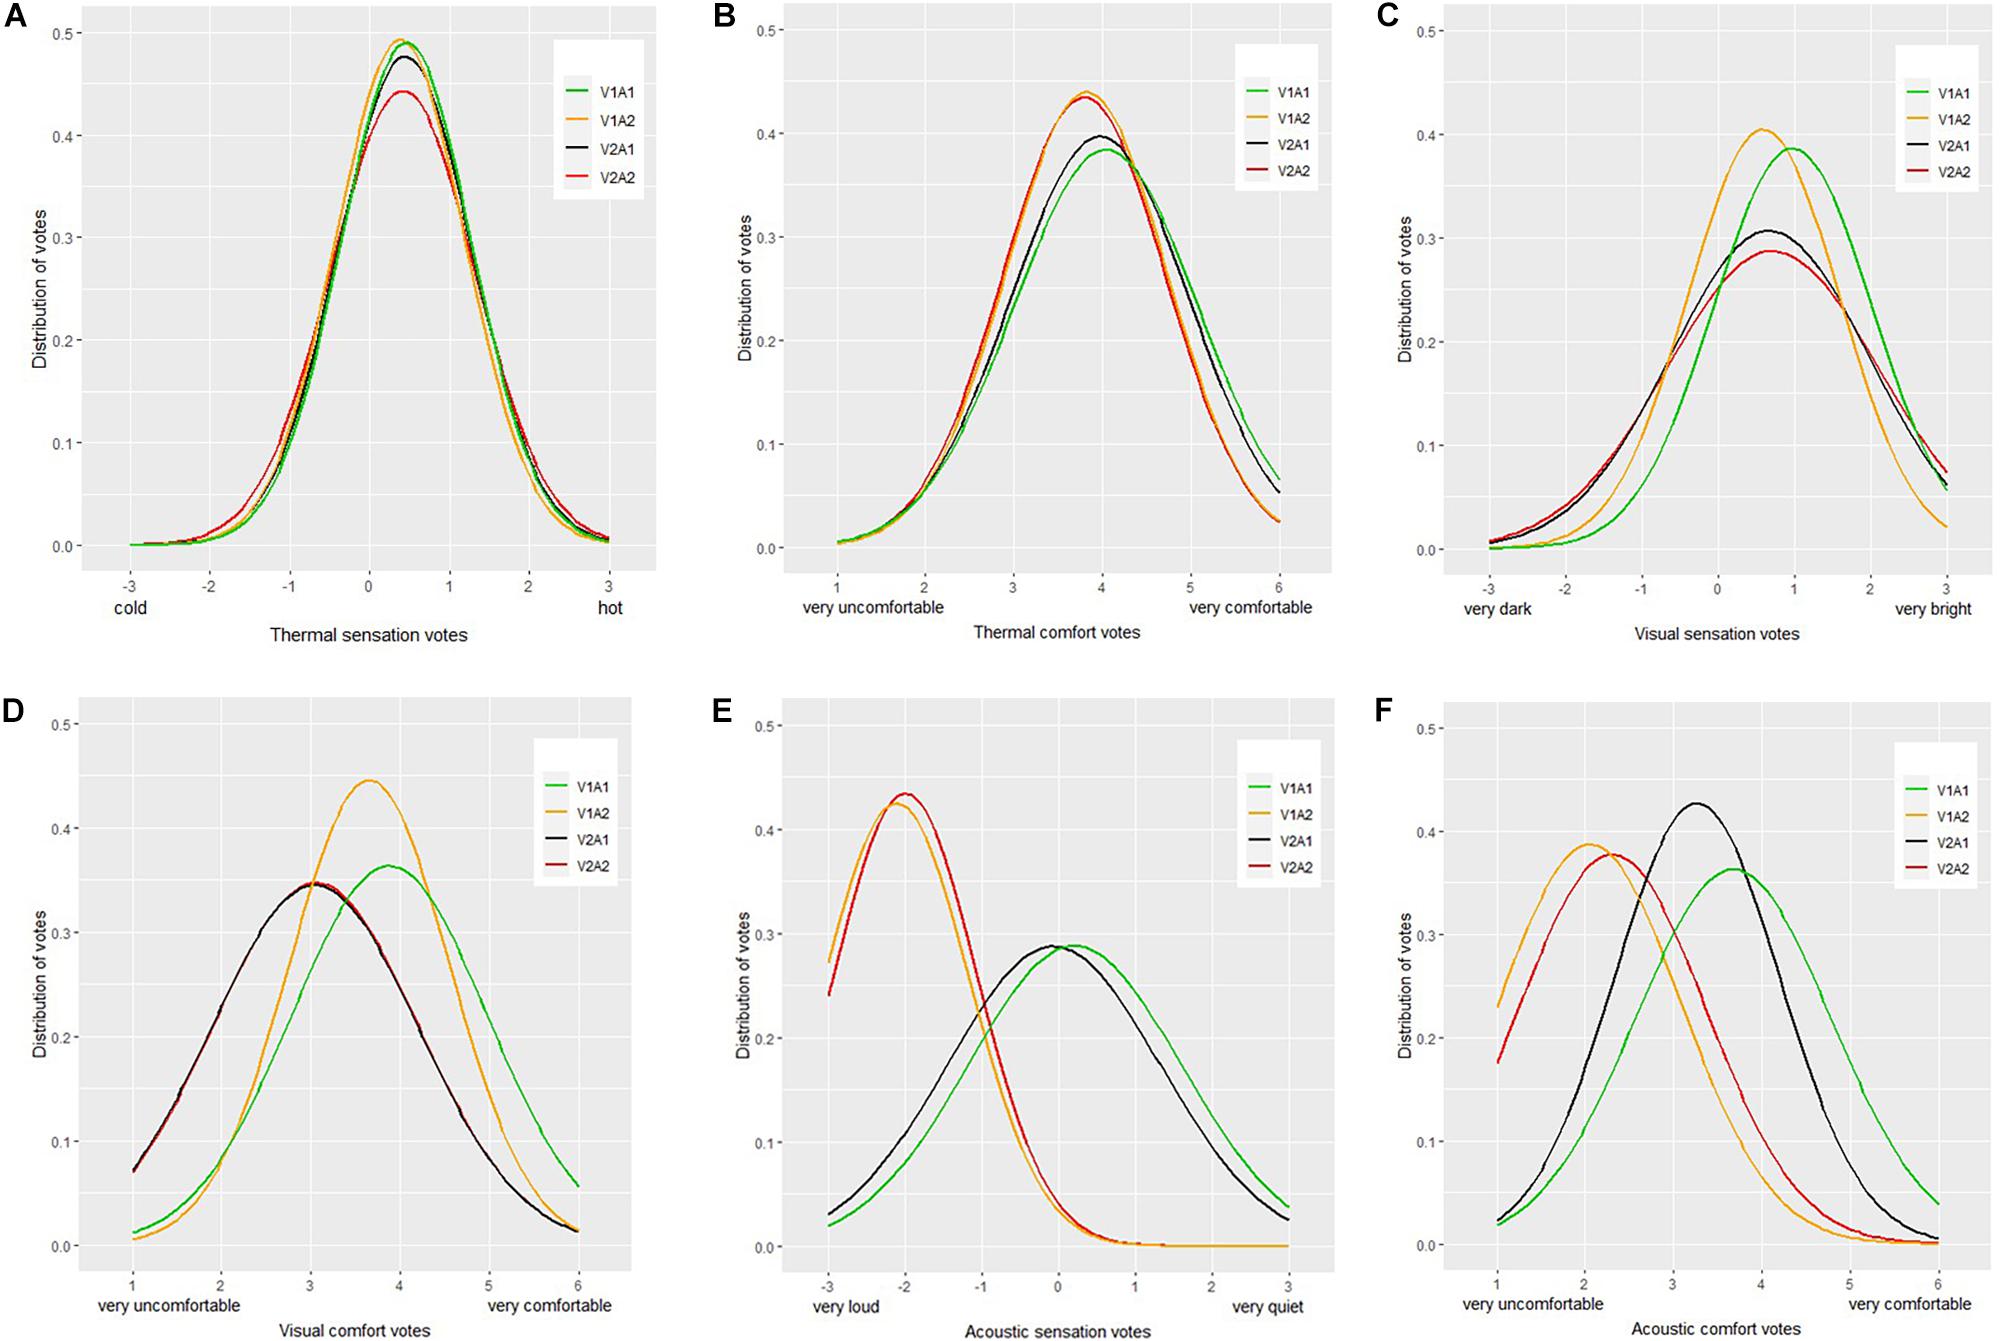
Figure 4. Distribution of the evaluation of thermal sensation (A) and comfort (B), visual sensation (C) and comfort (D), and acoustic sensation (E) and comfort (F) of participants.

Table 7. Mean (μ) and SE of thermal, visual, and acoustic sensation and comfort votes of participants.
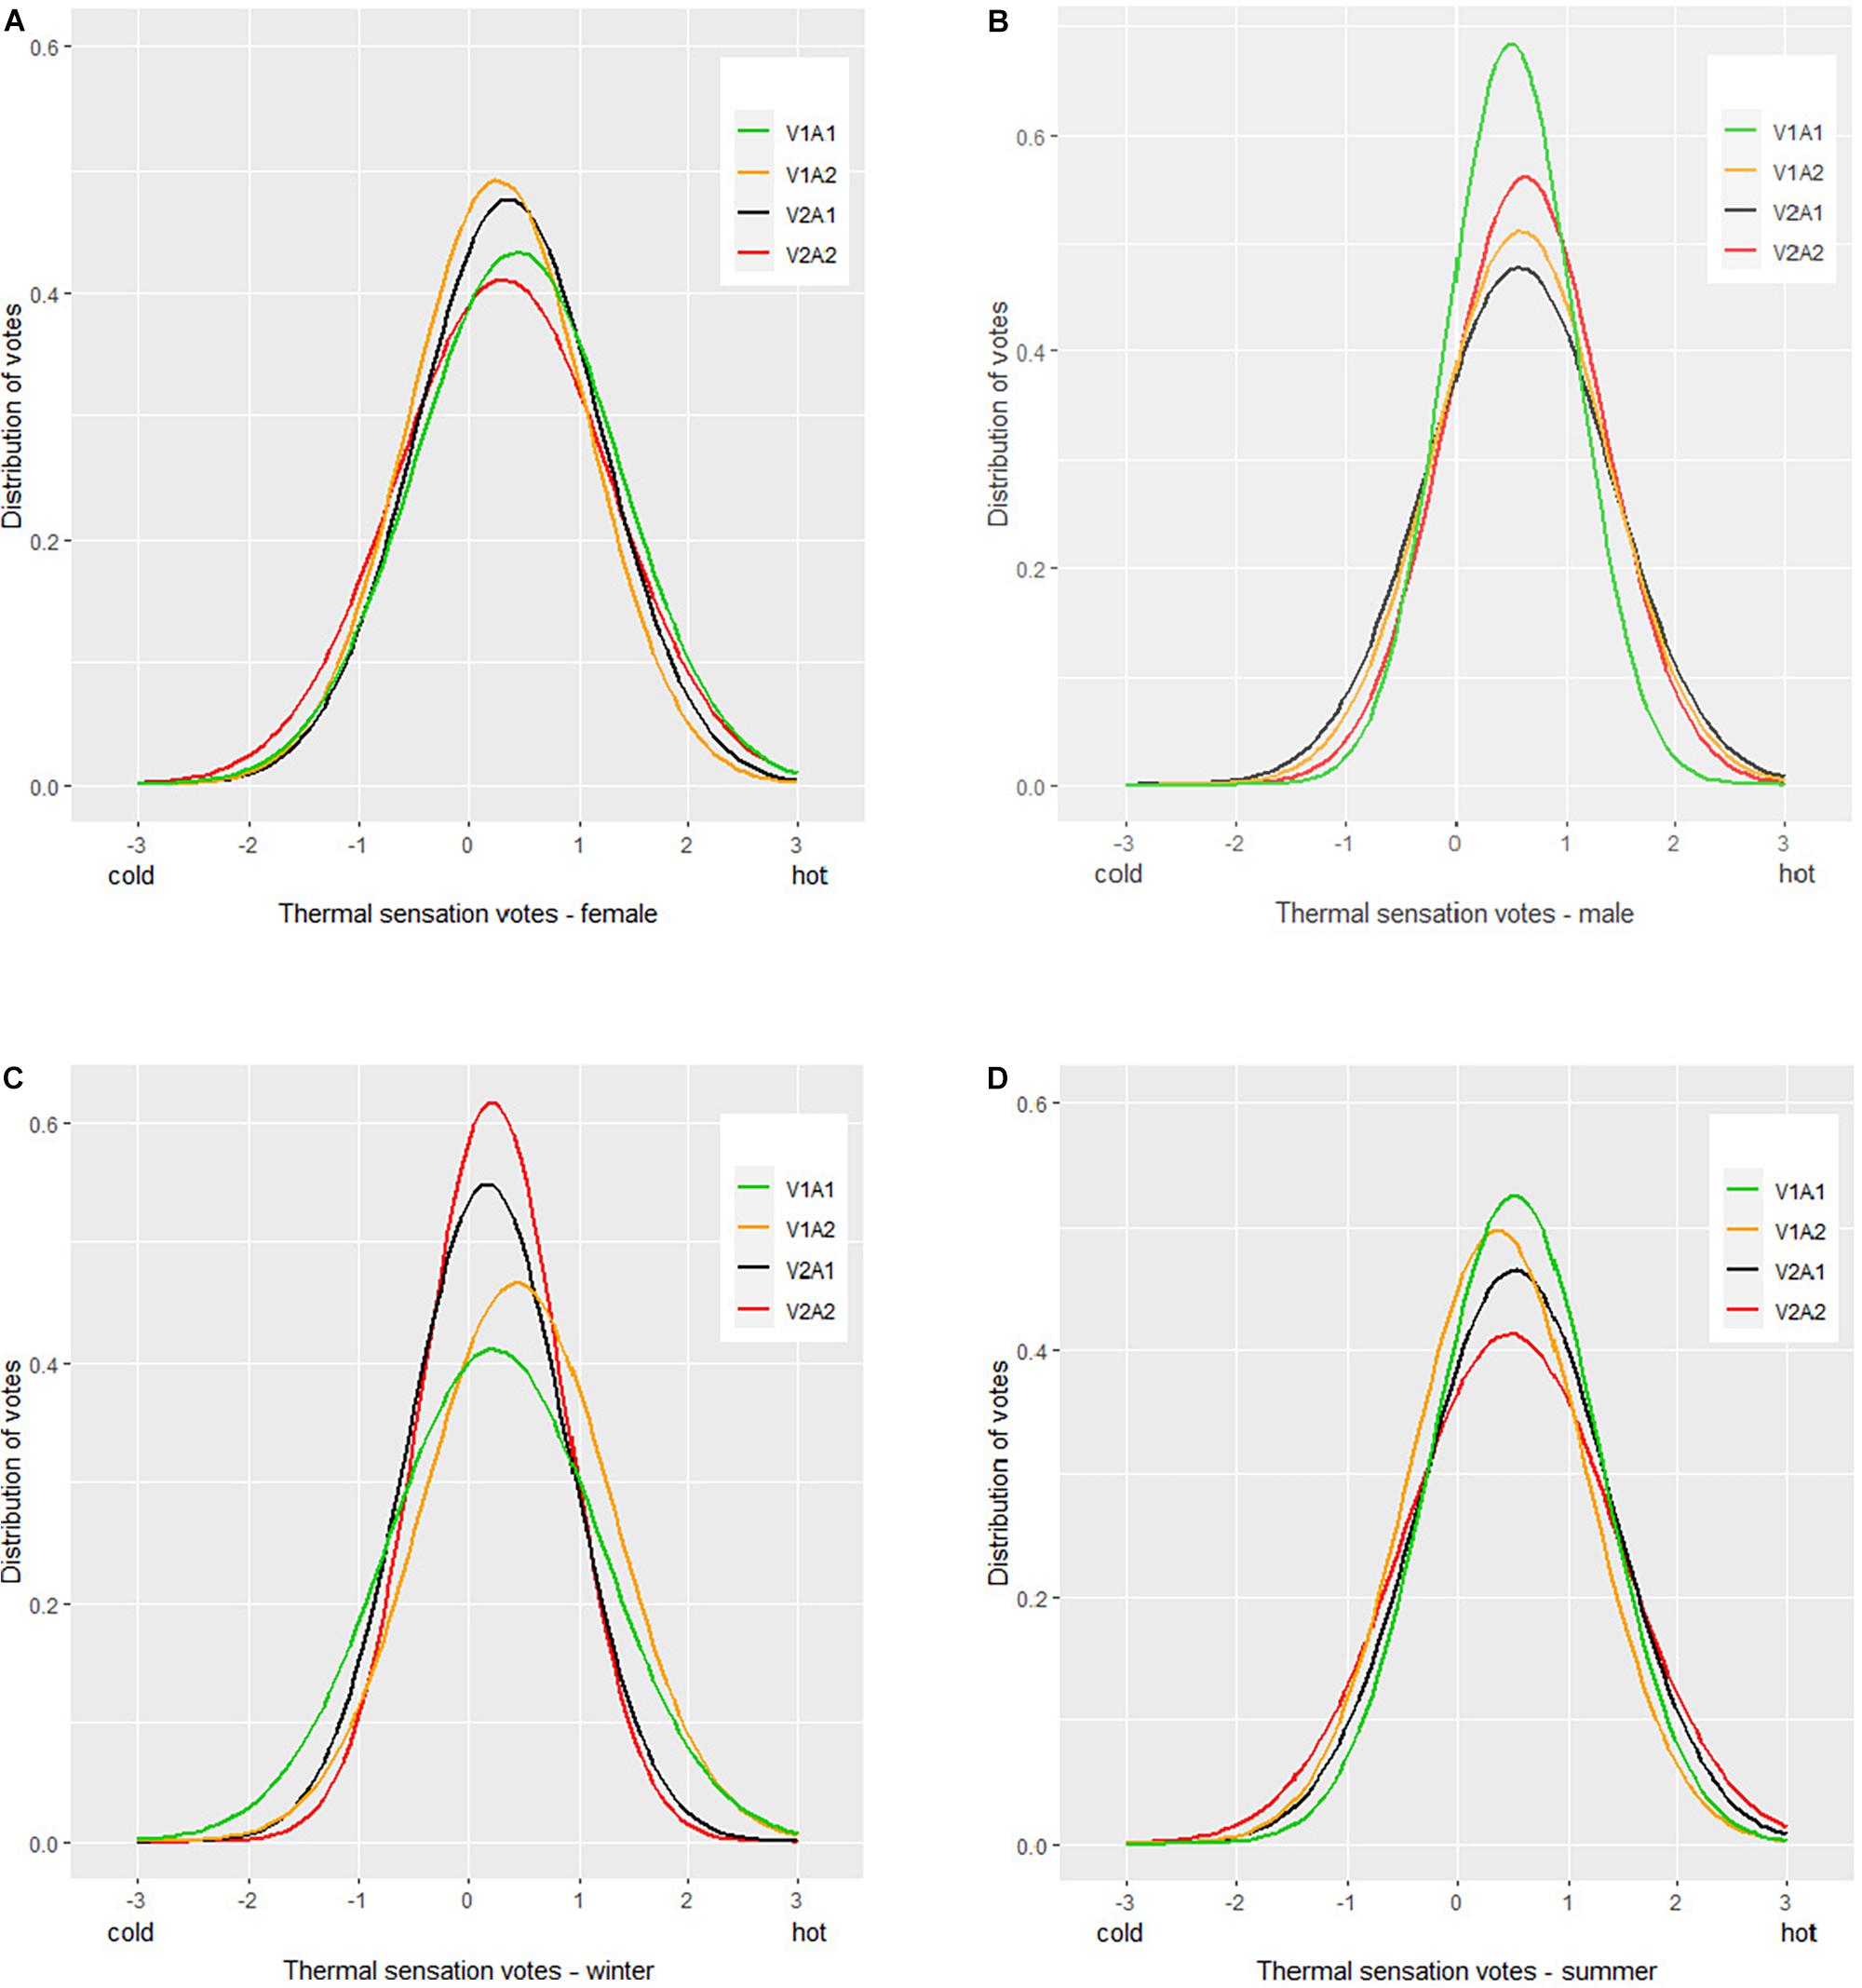
Figure 5. Distribution of the evaluation of thermal sensation of participants differentiated based on gender [female (A) and male (B)] and experimental time period [winter (C) and summer (D)].
The analysis of these findings in terms of descriptive statistics does not display a noteworthy influence of changes in the visual or auditory dimensions of the exposure situation of participants on the thermal sensation votes (Figure 4A). As to the thermal comfort evaluation, only a slight effect of the introduction of the noise factor either on its own (Scenario “V1A2”) or in combination with glare (Scenario “V2A2”) can be discerned (Figure 4B). However, this is not due to the indifference in participants to introducing either glare or noise. As Figure 4 demonstrates, the votes of participants on visual sensation and comfort as well as on acoustic sensation and comfort noticeably shifted when glare or noise was introduced. Nonetheless, a cross-modal influence of these stimuli on thermal evaluations could not be inferred from the results of our experiments (Figure 4). The differentiation of the collected data according to the applicable period of experiments and the gender of participants did not reveal any significant tendencies (see Figure 5).
As mentioned earlier, in order to formally evaluate the null hypotheses formulated at the outset, an ANOVA was performed, followed by a post-hoc Tukey’s HSD test to compare pairwise scenarios. The level of significance was fixed at p = 0.05.
Figures 6–8 show the differences in mean levels of thermal (T1, T2, and T3), visual, and acoustic sensation and comfort evaluations. Thereby, each graph includes six pairwise comparisons of different scenarios. For each pairwise comparison, the difference in observed means is illustrated by showing the 95% CI. A CI estimates the population mean for each scenario and contains a point estimate and a margin of error. The point estimate represents the difference between a pair of means, whereas the upper and lower limits of the CI show the variability in the samples. A 95% CI indicates that one can be 95% confident that the CI includes the group mean.
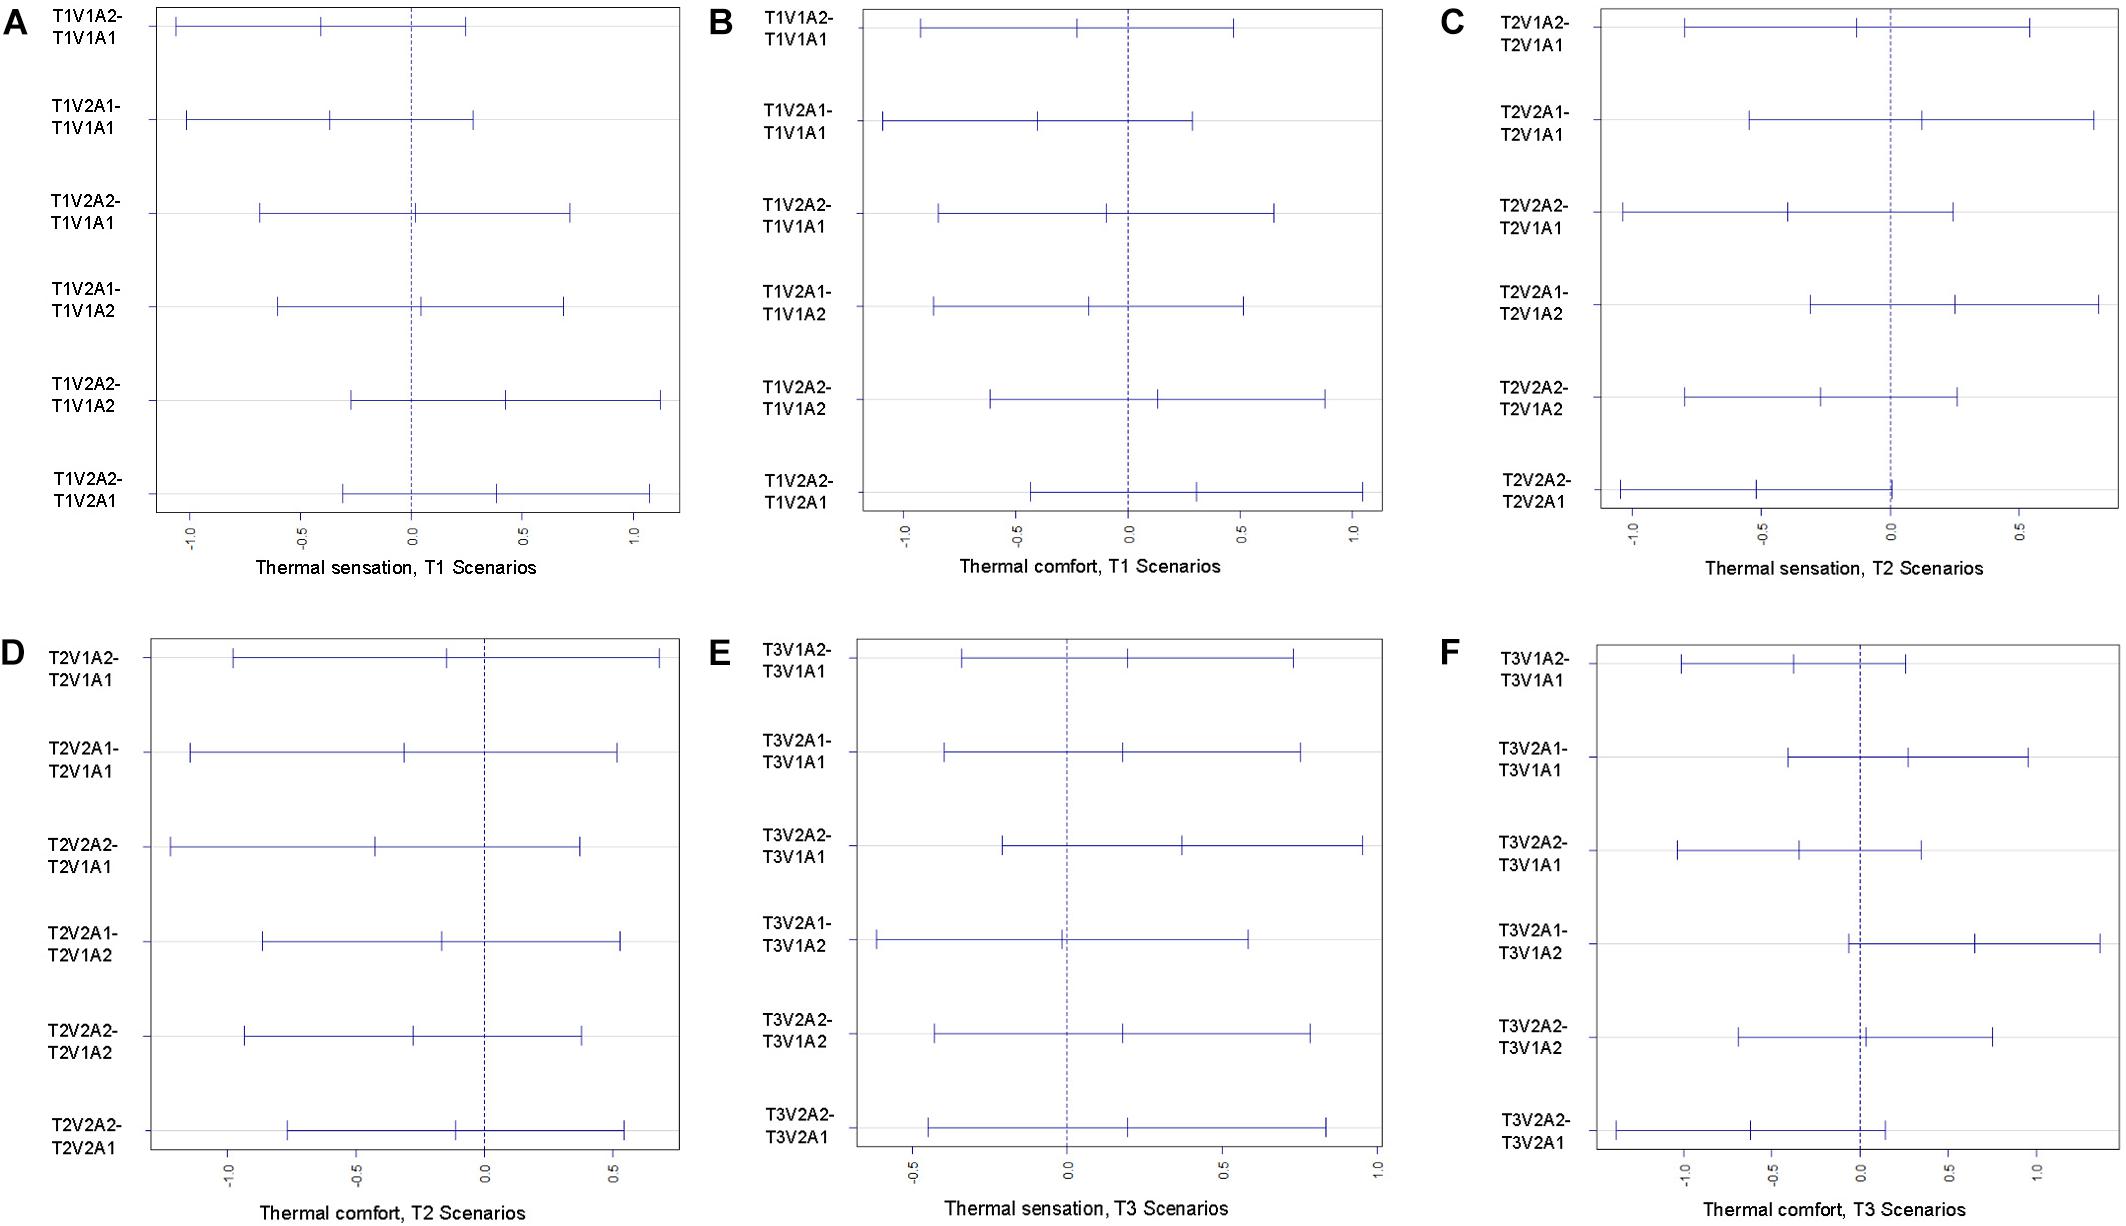
Figure 6. Differences in mean levels of thermal sensation (A) and comfort (B) votes in T1 Scenarios, thermal sensation (C) and comfort (D) votes in T2 Scenarios, and thermal sensation (E) and comfort (F) votes in T3 Scenarios.
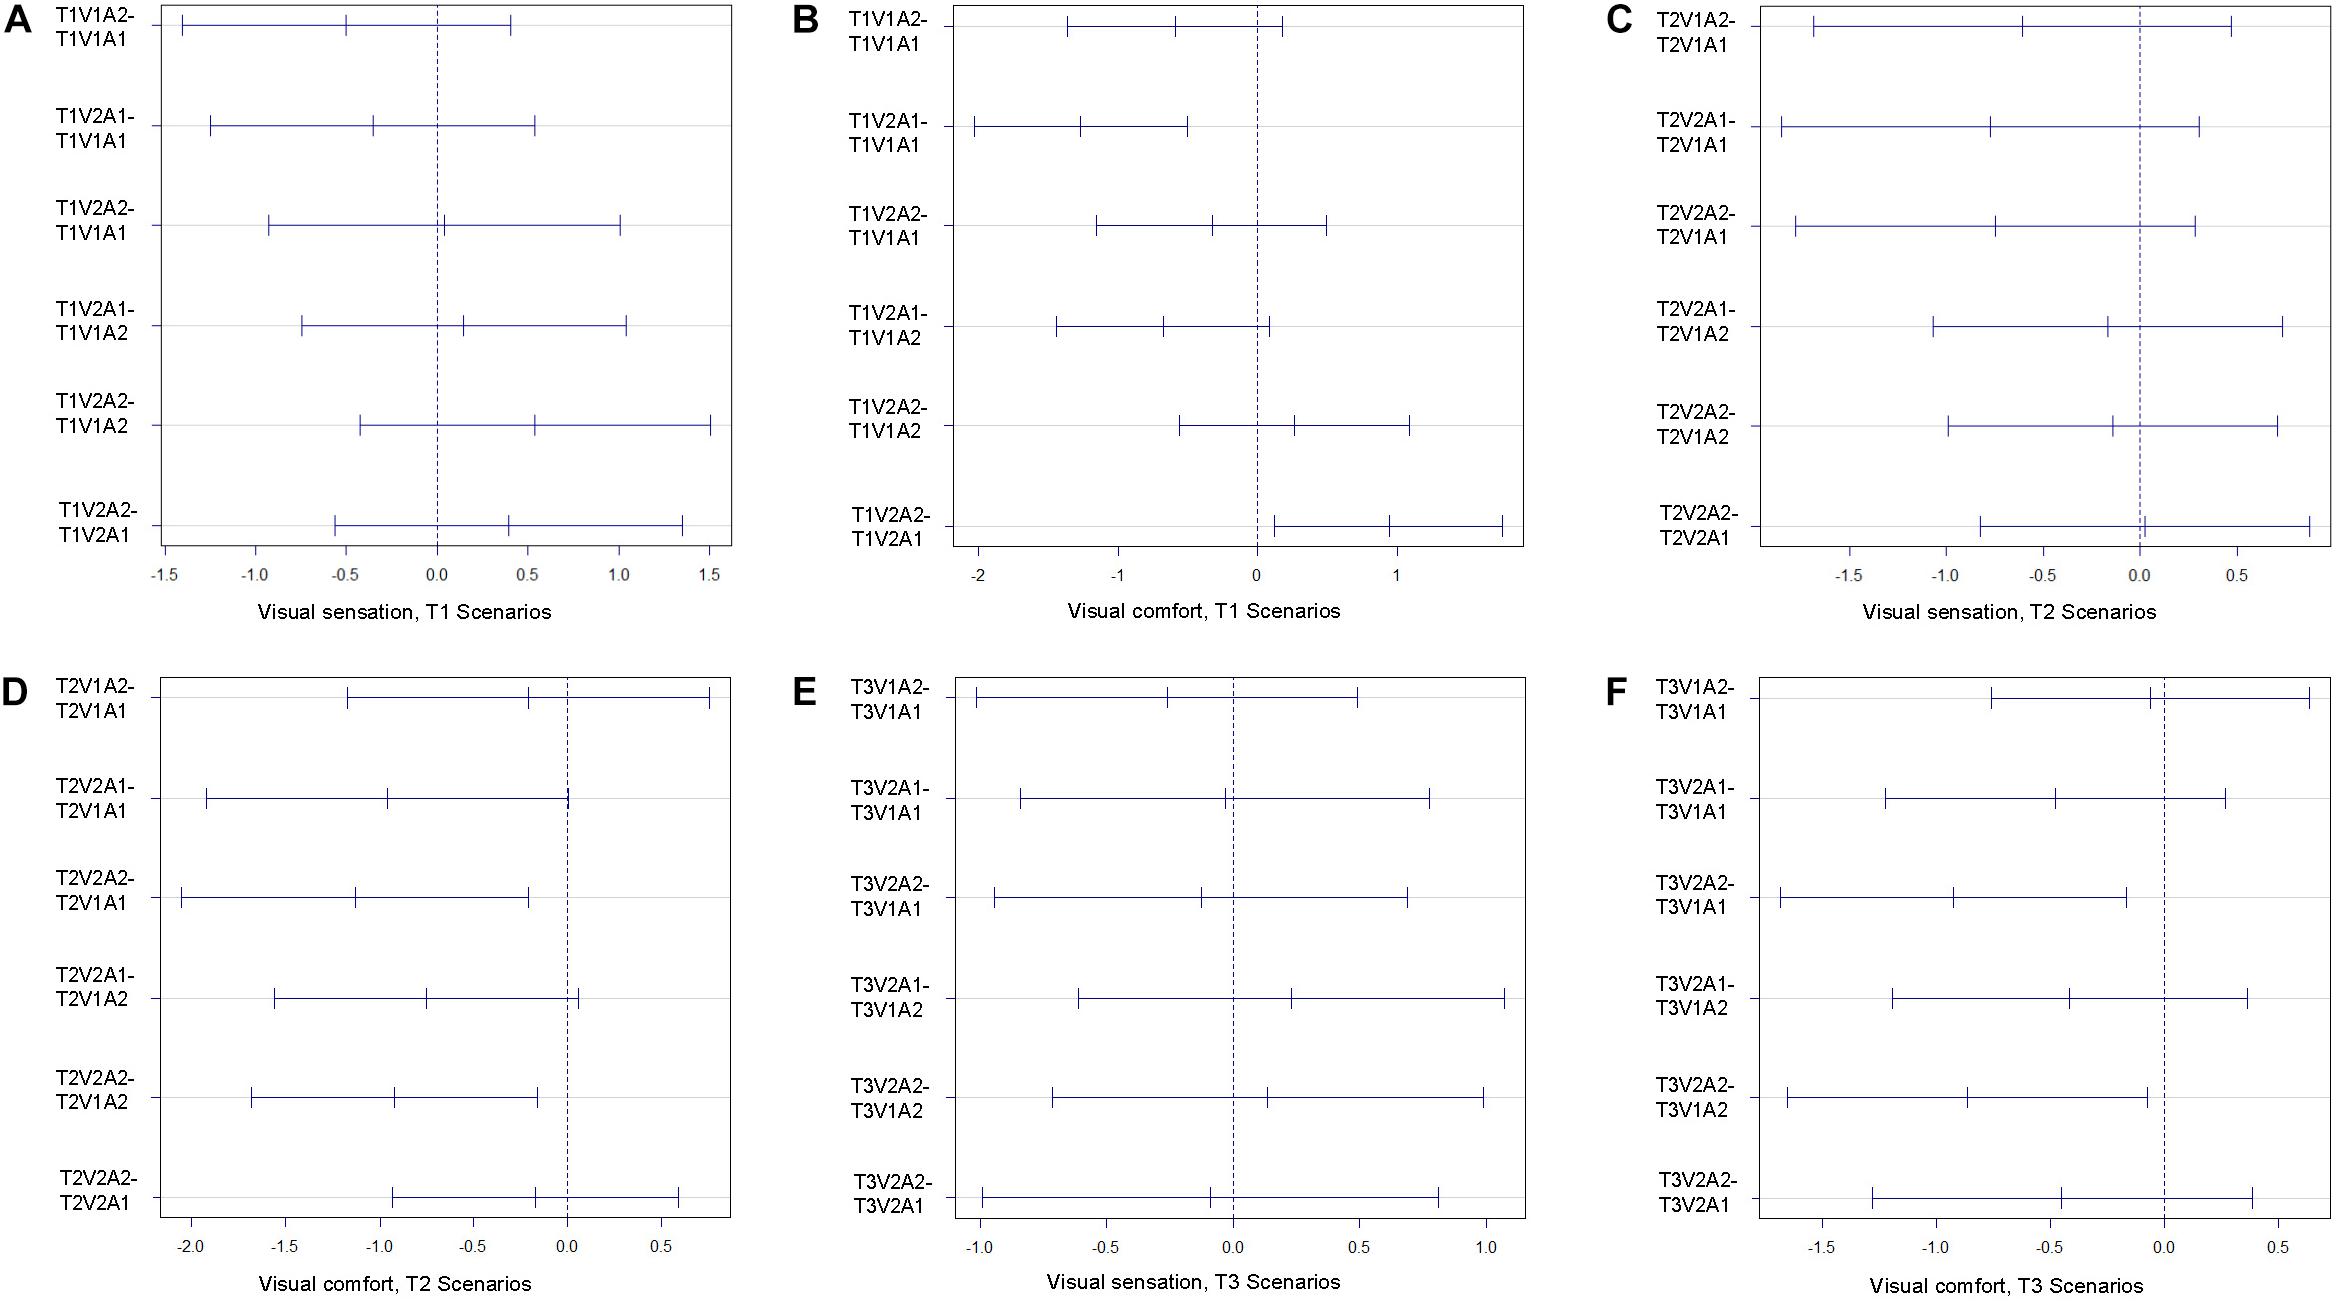
Figure 7. Differences in mean levels of visual sensation (A) and comfort (B) votes in T1 Scenarios, visual sensation (C) and comfort (D) votes in T2 Scenarios, and visual sensation (E) and comfort (F) votes in T3 Scenarios.
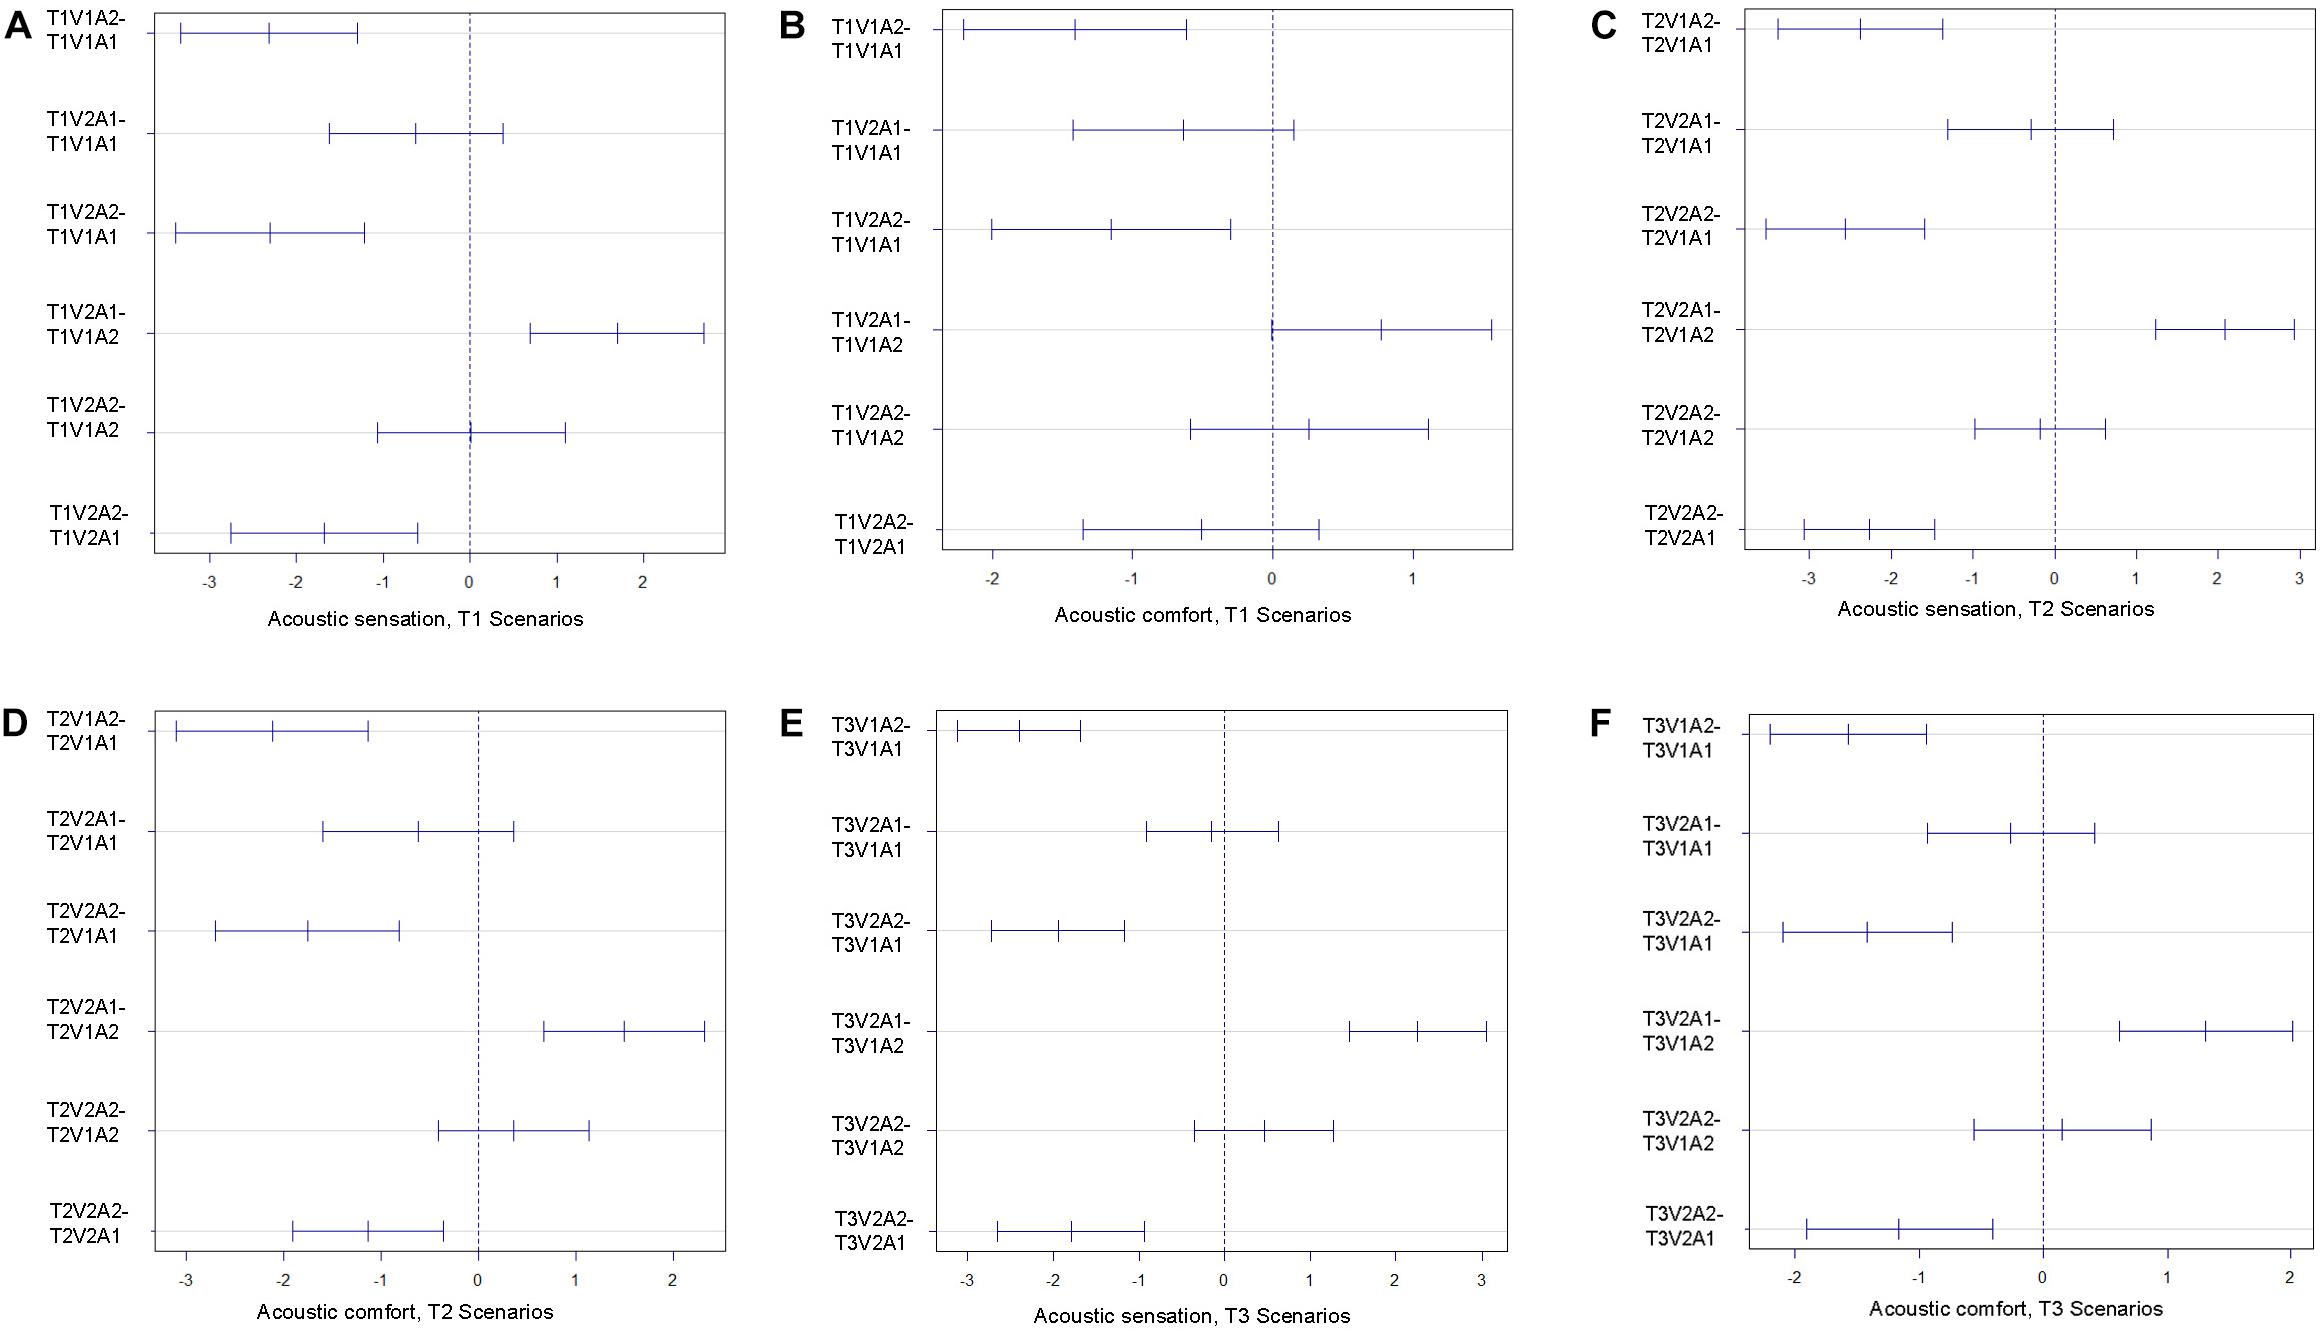
Figure 8. Differences in mean levels of acoustic sensation (A) and comfort (B) votes in T1 Scenarios, acoustic sensation (C) and comfort (D) votes in T2 Scenarios, and acoustic sensation (E) and comfort (F) votes in T3 Scenarios.
The CIs of different scenarios are illustrated in Figures 6–8 to determine the differences between the group means. From Figure 6, it can be seen that all pairwise comparisons contain zero in the CIs. This indicates that the differences in mean levels are not statistically significant. Thus, no significant groupwise differences exist among all three temperature conditions (T1, T2, and T3). The p-values derived from the pairwise comparison (post-hoc Tukey’s HSD test) concerning thermal sensation and comfort were larger than 0.05. This indicates that no significant effects of the thermal evaluation of participants were found between scenarios with different visual or auditory conditions as well as between scenarios including differences in both visual and acoustic circumstances.
The acoustic evaluation of participants showed, as expected, statistically significant differences between scenarios with or without noise (the p-values derived from pairwise comparison between different auditory conditions were < 0.001). Likewise, statistically significant differences (p < 0.001) were found in most pairwise comparisons of the visual comfort evaluation of participants under different visual conditions (with and without glare). However, this was not the case, when the visual sensation evaluations of participants in scenarios with and without glare were compared (p > 0.05).
To summarize, the results of the conducted experimental study do not provide conclusive and statistically significant evidence toward rejecting null hypotheses H0_1 to H0_3 (see “Research Questions” section). For the specific configurations considered in this study, the cross-domain effects arising from multi-domain indoor-environmental exposure situations could not be demonstrated.
As stated in the “Introduction” section, the primary objective of the present research was to examine the potential cross-domain effects arising from multi-domain indoor-environmental exposure situations. Specifically, we investigated if the evaluation of one component (e.g., thermal) of a multi-domain exposure situation of participants could be influenced by changes in other components (e.g., visual and/or acoustic). The investigation was conducted in terms of controlled short-term experimental studies with participants who experienced different combinations of the exposure components. This included three thermal settings (three temperature ranges), two visual settings (with and without a source of glare), and two acoustic settings (with and without traffic noise exposure). To conduct the investigation in a systematic manner, a number of null hypotheses were formulated at the outset, suggesting that the differences in one component of the exposure do not influence the evaluations of participants on other components. The thermal, visual, and acoustic sensation and comfort votes were obtained from 296 participants. The results were analyzed and visualized via means of descriptive statistics. Moreover, a comprehensive ANOVA was performed to explore if the aforementioned null hypotheses could be rejected.
Neither the inspection of the results of the descriptive statistics nor those of the ANOVA provided a basis for the rejection of the formulated initial null hypotheses. As such, the findings regarding the thermal sensation and comfort votes of participants do not point to any clearly discernible cross-modal effect among all scenarios. Thus, from the present investigation, it cannot be inferred that the subjective evaluation of similar thermal conditions would be significantly affected by additional levels of visual or auditory exposure. Likewise, the evaluations of the visual and acoustic aspects of the environment were not shown to be influenced by differences in the values of the variables pertaining to the other aspects. Given the absence of clear and measurable signal (i.e., the absence of non-overlapping ranges around mean tendencies of the votes in various treatments), one might be inclined to suggest that individual, purely short-term studies in emulated settings and with limited parametric configurations are unlikely to disclose strong indications of cross-domain effects on the indoor-environmental perception and comfort assessments of people. This is likely to be the case even if such studies are carefully and systematically conducted.
It is important to emphasize that the present study, given its limitations, does not warrant a general or universal judgment concerning the scope and magnitude of cross-modal effects in multi-aspect exposure situations. Although our study benefited from the participation of a relatively large group of 296 participants, the sample cannot be considered representative. The sample composition was fairly limited with regard to the distribution of age, occupation, health, and cultural background of participants. The majority of the participants were young, healthy, European students between 21 and 26 years. Presumably, the perception and preferences of thermal, visual, and acoustic comfort and sensation could vary more in a sample including a broader and diverse group of participants. Another limitation pertains to the concerns associated with the Hawthorne effect. Even though participants were not aware of the details and ultimate objectives of the experiments, and even though the experimental setting resembled typical offices, they were still cognizant of the fact that they were in a laboratory setting and that they were being observed. Moreover, it has to be noted that, given the between-subject design of the experiments, each participant was exposed only once to a specific indoor-environmental condition. Consequently, the interindividual differences among the participants could introduce a certain uncertainty in the results.
We should also point out that the two auditory conditions maintained differed not only in terms of the respective sound intensity levels, but also in terms of their characteristics (typical background conditions in one case vs. clear presence of traffic noise in the other case). A further—and significant—limitation concerns the inherent nature of short-term occupancy studies. The initial unfamiliarity with the environment and the lack of long-term adaptation processes suggest that the findings may not apply to more realistic settings and long-term occupancy conditions in real-life indoor environments. Yet another limitation is due to the relatively small number of scenarios that could be maintained and tested. Specifically, only three (relatively close) thermal ranges could be considered. And only two—albeit clearly distinct—states could be realized for each of the two variables (noise and glare).
Future research efforts need to address these limitations in multiple directions. Aside from sample size and composition, and more broad ranges of the values of the multi-aspect exposure variables, longer term and more realistic settings including not only office spaces, but also other typologies such as educational buildings should be considered. This would also probably necessitate the deployment of field study techniques. At the other end of the spectrum of research design, highly specialized neurophysiologically oriented laboratory studies could shed light on the specifics of the scope and causal mechanisms of intersensory information processing and modes of their reflection in human experience, evaluation, and behavior. The results of such detailed investigations may not be immediately transportable to the highly applied field of indoor-environmental comfort assessment, but may inspire and guide experimental and field studies at the appropriate scale and level of resolution. This observation would in turn imply the need for further multidisciplinary and collaborative field and laboratory studies in different research and academic institutions around the world such that an extensive set of environmental conditions in diverse settings could be investigated and fitting inferences for the practical applications could be made.
The raw data supporting the conclusions of this article will be made available by the authors, without undue reservation.
Ethical review and approval was not required for the study on human participants in accordance with the local legislation and institutional requirements. Written informed consent for participation was not required for this study in accordance with the national legislation and the institutional requirements.
CB co-developed the initial research idea, co-developed and implemented the research design, managed the experimental runs, co-analyzed the data, and co-operated in structuring and writing this article. AM co-developed the initial research idea, co-developed the research design, co-analyzed the data, and co-operated in structuring and writing the manuscript. Both authors contributed to the article and approved the submitted version.
The authors declare that the research was conducted in the absence of any commercial or financial relationships that could be construed as a potential conflict of interest.
The contributions of authors to the occupancy research in general and the specific treatment of the present article, in particular, have benefited from their participation in the IEA EBC Annex 79 activities and related discussions. We would also like to specifically acknowledge the support of Matthias Schuss, Dawid Wolosiuk, and Josef Lechleitner toward the configuration of visual and auditory settings and related data collection. This study would have not been possible without the voluntary participation and kind support of 296 students at TU Wien. We acknowledge TU Wien Bibliothek for financial support through its Open Access Funding Programme.
ASHRAE Standard 55 (2017). Thermal Environmental Conditions for Human Occupancy. Atlanta, GA: American Society of Heating, Refrigerating, and Air-Conditioning Engineers, Inc.
Azmoon, H., Dehghan, H., Akbari, J., and Souri, S. (2013). The relationship between thermal comfort and light intensity with sleep quality and eye tiredness in shift work nurses. J. Environ. Public Health 2013:639184.
Balazova, I., Clausen, G., and Wyon, D. P. (2007). “The influence of exposure to multiple indoor environmental parameters on human perception, performance and motivation,” in Proceedings of the Clima 2007 WellBeing Indoors, (Helsinki: FINVAC).
Bellia, L., Alfano, F. R., Fragliasso, F., Palella, B. I., and Riccio, G. (2021). On the interaction between lighting and thermal comfort: an integrated approach to IEQ. Energy Build. 231:110570. doi: 10.1016/j.enbuild.2020.110570
Bronkhorst (2020). Flow Meter Accuracy & Repeatability. Available online at: https://www.bronkhorst.com/int/blog-1/flow-meter-accuracy-repeatability/. [Accessed 30 November, 2020]
Chinazzo, G., Wienold, J., and Andersen, M. (2018). Combined effects of daylight transmitted through coloured glazing and indoor temperature on thermal responses and overall comfort. Build. Environ. 144, 583–597. doi: 10.1016/j.buildenv.2018.08.045
Chinazzo, G., Wienold, J., and Andersen, M. (2019). Variation in thermal, visual and overall comfort evaluation under coloured glazing at different temperature levels. J. Int. Colour Assoc. 23, 45–54.
CIE (1995). CIE 117-1995: Discomfort Glare in Interior Lighting, Commission Internationale de l’Eclairage. ISBN: 9783900734701. Vienna: CIE.
Clausen, G., and Wyon, D. P. (2008). The combined effects of many different indoor environmental factors on acceptability and office work performance. HVAC R Res. 14, 103–113. doi: 10.1080/10789669.2008.10390996
Clausen, G., Carrick, L., Fanger, P. O., Kim, S. W., Poulsen, T., and Rindel, J. H. (1993). A comparative study of discomfort caused by indoor air pollution, thermal load and noise. Indoor Air 3, 255–262. doi: 10.1111/j.1600-0668.1993.00006.x
DIN (2006). DIN EN ISO 7730: 2006-05. Ergonomics of the Thermal Environment - Analytical Determination and Interpretation of Thermal Comfort using Calculation of the PMV and PPD Indices and Local Thermal Comfort Criteria. Berlin: DIN.
Edwards, L., and Torcellini, P. (2006). Literature Review of the Effects of Natural Light on Building Occupants. Golden: NREL.
Elliott, A. C., and Woodward, W. A. (2007). Statistical Analysis Quick Reference Guidebook: With SPSS Examples. Thousand Oaks, CA: SAGE Publications.
Fanger, P. O., Breum, N. O., and Jerking, E. (1977). Can colour and noise influence man’s thermal Comfort? Ergonomics 20, 11–18. doi: 10.1080/00140137708931596
Galasiu, A. D., and Veitch, J. A. (2006). Occupant preferences and satisfaction with the luminous environment and control systems in daylit offices: a literature review. Energy Build. 38, 728–742. doi: 10.1016/j.enbuild.2006.03.001
Höfert, W. (1988). “Lärm und Blendung: Zu einigen Effekten kombinierter Umgebungsstressoren,” in Akustik zwischen Physik und Psychologie, ed. A. Schick 207–211.
Huang, L., Zhu, Y., Ouyang, Q., and Cao, B. (2012). A study on the effects of thermal, luminous, and acoustic environments on indoor environmental comfort in offices. Build. Environ. 49, 304–309. doi: 10.1016/j.buildenv.2011.07.022
Huebner, G. M., Shipworth, D. T., Gauthier, S., Witzel, C., Raynham, P., and Chan, W. (2016). Saving energy with light? Experimental studies assessing the impact of colour temperature on thermal comfort. Energy Res. Soc. Sci. 15, 45–57. doi: 10.1016/j.erss.2016.02.008
Jamrozik, A., Ramos, C., Zhao, J., Bernau, J., Clements, N., Wolf, T. V., et al. (2018). A novel methodology to realistically monitor office occupant reactions and environmental conditions using a living lab. Build. Environ. 130, 190–199. doi: 10.1016/j.buildenv.2017.12.024
Laurentin, C., Bermtto, V., and Fontoynont, M. (2000). Effect of thermal conditions and light source type on visual comfort appraisal. Light. Res. Technol. 32, 223–233. doi: 10.1177/096032710003200406
LMK (2020). Software LMK LabSoft and Add-on LMK Glare Analysis. Available online at: https://www.technoteam.de/product_overview/photometer_colorimeter/software_addon_application/lmk_glare_analysis/index_eng.html (Accessed 30 November, 2020)
Mahdavi, A., Berger, C., Bochukova, V., Bourikas, L., Hellwig, R. T., Jin, Q., et al. (2020a). Necessary conditions for multi-domain indoor environmental quality standards. Sustainability 12:8439. doi: 10.3390/su12208439
Mahdavi, A., Berger, C., Jamrozik, A., Chinazzo, G., Edappilly, L. P., and Schweiker, M. (2020b). “Understanding multi-aspect indoor-environmental exposure situations: Past insights and future needs,” in Proceedings of the 16th Conference of the International Society of Indoor Air Quality & Climate (Indoor Air 2020), (Seoul: COEX).
Nagano, K., and Horikoshi, T. (2001). New index of combined effect of temperature and noise on human comfort: summer experiments on hot ambient temperature and traffic noise. Arch. Complex Environ. Stud. 13, 3–4.
Nagano, K., and Horikoshi, T. (2005). New comfort index during combined conditions of moderate low ambient temperature and traffic noise. Energy Build. 37, 287–294. doi: 10.1016/j.enbuild.2004.08.001
Newsham, G., Mancini, S., Veitch, J., Marchand, R., Lei, W., Charles, K., et al. (2009). Control strategies for lighting and ventilation in offices: effects on energy and occupants. Intell. Build. Int. 1, 101–121. doi: 10.3763/inbi.2009.0004
Pan, Z., Kjaergaard, S. K., and Mølhave, L. (2003). A chamber-experiment investigation of the interaction between perceptions of noise and odor in humans. Int. Arch. Occup. Environ. Health 76, 598–604. doi: 10.1007/s00420-003-0464-3
Pellerin, N., and Candas, V. (2003). Combined effects of temperature and noise on human discomfort. Physiol. Behav. 78, 99–106. doi: 10.1016/S0031-9384(02)00956-3
R (2021). The R Project for Statistical Computing. Available online at: https://www.r-project.org/ (Accessed 22 March, 2021)
Schweiker, M., Ampatzi, E., Andargie, M. S., Andersen, R. K., Azar, E., Barthelmes, V. M., et al. (2020). Review of multi-domain approaches to indoor environmental perception and behaviour. Build. Environ. 176:106804. doi: 10.1016/j.buildenv.2020.106804
tatistics Solution (2020). ANOVA. Available online at: https://www.statisticssolutions.com/manova-analysis-anova/ (Accessed November 30, 2020).
Te Kulve, M., Schellen, L., Schlangen, L. J. M., Frijns, A., and van Marken Lichtenbelt, W. D. (2016). “Light intensity and thermal responses,” in Proceedings of 9th Windsor Conference, (Windsor: Windsor Great Part).
Tiller, D. K., Wang, L. M., Musser, A., and Radik, M. J. (2010). Combined effects of noise and temperature on human comfort and performance. ASHRAE Trans. 116, 522–540.
Toftum, J., Thorseth, A., Markvart, J., and Logadóttir, Á (2018). Occupant response to different correlated colour temperatures of white LED lighting. Build. Environ. 143, 258–268. doi: 10.1016/j.buildenv.2018.07.013
Torresin, S., Pernigotto, G., Cappelletti, F., and Gasparella, A. (2018). Combined effects of environmental factors on human perception and objective performance: a review of experimental laboratory works. Indoor Air 28, 525–538. doi: 10.1111/ina.12457
Vardaxis, N. G., Bard, D., and Waye, K. P. (2018). Review of acoustic comfort evaluation in dwellings—Part I: associations of acoustic field data to subjective responses from building surveys. Build. Acoustics 25, 151–170. doi: 10.1177/1351010X18762687
Varjo, J., Hongisto, V., Haapakangas, A., Maula, H., Koskela, H., and Hyönä, J. (2015). Simultaneous effects of irrelevant speech, temperature and ventilation rate on performance and satisfaction in open-plan offices. J. Environ. Psychol. 44, 16–33. doi: 10.1016/j.jenvp.2015.08.001
Wang, H., Liu, G., Hu, S., and Liu, C. (2018). Experimental investigation about thermal effect of colour on thermal sensation and comfort. Energy Build. 173, 710–718. doi: 10.1016/j.enbuild.2018.06.008
Witterseh, T., Wyon, D. P., and Clausen, G. (2004). The effects of moderate heat stress and open-plan office noise distraction on SBS symptoms and on the performance of office work. Indoor Air 14, 30–40. doi: 10.1111/j.1600-0668.2004.00305.x
Wong, L. T., Mui, K. W., and Hui, P. S. (2008). A multivariate-logistic model for acceptance of Indoor Environmental Quality (IEQ) in offices. Build. Environ. 43, 1–6. doi: 10.1016/j.buildenv.2007.01.001
Wu, Y. C., and Mahdavi, A. (2014). Assessment of thermal comfort under transitional conditions. Build. Environ. 76, 30–36. doi: 10.1016/j.buildenv.2014.03.001
Yang, W., and Moon, H. J. (2018). Cross-modal effects of illuminance and room temperature on indoor environmental perception. Build. Environ. 146, 280–288. doi: 10.1016/j.buildenv.2018.10.007
Keywords: indoor environment, multi-aspect exposure, thermal, visual, acoustic comfort
Citation: Berger C and Mahdavi A (2021) Exploring Cross-Modal Influences on the Evaluation of Indoor-Environmental Conditions. Front. Built Environ. 7:676607. doi: 10.3389/fbuil.2021.676607
Received: 05 March 2021; Accepted: 01 April 2021;
Published: 21 April 2021.
Edited by:
Francesco Salamone, Italian National Research Council, ItalyReviewed by:
Simone Torresin, University of Trento, ItalyCopyright © 2021 Berger and Mahdavi. This is an open-access article distributed under the terms of the Creative Commons Attribution License (CC BY). The use, distribution or reproduction in other forums is permitted, provided the original author(s) and the copyright owner(s) are credited and that the original publication in this journal is cited, in accordance with accepted academic practice. No use, distribution or reproduction is permitted which does not comply with these terms.
*Correspondence: Christiane Berger, Y2hyaXN0aWFuZS5iZXJnZXJAdHV3aWVuLmFjLmF0
Disclaimer: All claims expressed in this article are solely those of the authors and do not necessarily represent those of their affiliated organizations, or those of the publisher, the editors and the reviewers. Any product that may be evaluated in this article or claim that may be made by its manufacturer is not guaranteed or endorsed by the publisher.
Research integrity at Frontiers

Learn more about the work of our research integrity team to safeguard the quality of each article we publish.