
94% of researchers rate our articles as excellent or good
Learn more about the work of our research integrity team to safeguard the quality of each article we publish.
Find out more
ORIGINAL RESEARCH article
Front. Built Environ., 12 April 2021
Sec. Sustainable Design and Construction
Volume 7 - 2021 | https://doi.org/10.3389/fbuil.2021.670996
This article is part of the Research TopicMaterials and Technologies for Low-Carbon ConcreteView all 7 articles
Upcycling and reclaiming of low quality or stored coal combustion fly ashes could enable to tap into a voluminous resource of supplementary cementitious materials (SCMs) for low-carbon blended cements. Low reactivity fly ashes are usually either too crystalline or too coarse. Beneficiation treatments for coarse fly ashes comprise size classification or milling processes to extract or produce fine size fractions of higher pozzolanic reactivity. This article compares the effect of size classification and milling treatments on the reactivity of a siliceous fly ash (FA). The intrinsic chemical reactivity is assessed using the R3 heat release test method. The results showed significant increases of 57 and 40% for fine classified and milled fly ash compared to the initial fly ash, respectively. In addition heat release and portlandite consumption were measured for blended cements with 30 wt.% Portland cement replacement by the fly ashes. Both test results are combined to calculate the degree of reaction of the fly ashes over time in blended cement. The results demonstrate a strong effect of particle size on fly ash reactivity and degree of reaction. It is shown that increasing the inherent reactivity of fly ashes is an effective way of both accelerating compressive strength gain and enhancing late age strength with fine classified fly ashes reaching equivalent strength as neat Portland cement by 28 days and attaining a strength activity index of 137% by 90 days.
To meet CO2 reduction targets and keep global temperature rise below 2°C, carbon-intensive industries such as cement production need to change their operations and processes drastically (Lehne and Preston, 2018). In case of the cement industry measures need to go beyond improving process efficiency, switching to alternative fuels or electrification, mainly because the production of clinker involves significant CO2 emissions from the decarbonation of raw materials, i.e., limestone (Scrivener et al., 2016; Favier et al., 2018). In addition, material efficiency and carbon capture and storage or use will be needed to completely mitigate emissions and meet reduction targets (CEMBUREAU, 2016; IEA, 2018).
A proven and effective way of increasing material efficiency is the partial replacement of clinker by supplementary cementitious materials (SCMs) (Scrivener et al., 2016). As supplies of conventional SCMs such as blast furnace slags and freshly produced coal combustion fly ash (FA) are already running low and are expected to further reduce in the future, new types and sources of SCMs will need to step in Juenger et al. (2019). Amongst the wide variety of materials being evaluated and studied, reclaimed or low-quality fly ashes may provide large volumes of SCMs (McCarthy et al., 2017). Fly ashes are the most important by-product of coal combustion and represent around 85% of the total amount of coal combustion by-products (Miller, 2005). The annual production is estimated around 1 billion of tons (Harris et al., 2019), with multiple billions of tons available in landfills. Depending on the region small (6% in South Africa) to large amounts (50% United States and 90% Europe) are currently used, mainly in the construction industry in the production of cement and concrete, but also in geotechnical applications such as mine backfilling and soil improvement or as fertilizers (Miller, 2005; Kruger, 2017). Nevertheless, millions of tons of fly ashes are still disposed of in landfills or ponds, in some cases because of logistic reasons such as local oversupply and transport costs, more often because the fly ash characteristics do not comply with specifications for use (Diaz-Loya et al., 2019). Common quality issues are excessive levels of organic matter (residual coal), sulfate or moisture, or too low reactivity and performance related to unfavorable fineness or high levels of inert crystalline phases such as quartz, mullite, etc (Al-Shmaisani et al., 2019).
Fly ash characteristics are determined by the origin and processing of the burned coal, the combustion technology and the fly ash precipitator technology (Snellings et al., 2012; Dong et al., 2013). Coal combustion fly ashes are comprised mainly of spherical particles with a size distribution from less than 1 to about 300 μm (Snellings et al., 2012) or even 600 μm (Jow, 2017). The fineness or particle size distribution is one of the main fly ash properties affecting its performance in Portland cement and concrete and is therefore regulated by standard specifications such as ASTM C618 or EN 450-1. The properties of fly ash blended concrete such as strength, abrasion resistance, and freeze-thaw resistance are closely related with the fineness and particle-size distribution of the fly ash used and improve with increasing fly ash fineness (Ramezanianpour, 2014; Hemalatha and Ramaswamy, 2017; Sevim and Demir, 2019). The beneficial effect of fly ash fineness is usually explained by a combination of enhanced filler effect and higher pozzolanic reactivity (Obla et al., 1999; Jones et al., 2006; Chindaprasirt et al., 2007).
To meet requirements on particle size distribution and improve fly ash performance as SCM, beneficiation treatments such as classification, milling or grinding can be applied (Yao et al., 2015; Kruger, 2017). Most commonly used in classifying fly ashes are air classifiers or sieves. Where air classifiers are able to classify particle sizes down to about 5–10 μm, the lowest particle size cut-off reached by commercial dry sieving techniques is currently only about 105 μm. By grinding or milling, similar particle sizes as with air classifiers can be reached, however, these techniques shatter the spherical particles into irregularly shaped fragments and as such eliminate ball bearing effects of the fly ash spheres, thus effectively increasing the water demand of the blended cement (Jow, 2017). In addition, milling or grinding may eliminate differences in fly ash properties (amorphous content, chemical composition,…) across particle size fractions (Durdziński et al., 2015) or lead to mechanical activation by amorphization and creation of surface defects (Kumar et al., 2007), and as such result in different reactivity and performance compared to classified fly ashes of similar particle size distribution.
The aim of this article is to determine the effect of fly ash fineness and pretreatment in terms of reactivity and compressive strength development. A comparison is made between siliceous fly ash materials of similar particle size distribution produced by either classification or by milling of the same initial fly ash. The chemical reactivity is assessed using the R3 heat release test method and consumption of portlandite in blended cements, the mechanical performance is determined by mortar strength testing. The results are instrumental in the design and development of fly ash beneficiation treatments and fly ash blended cements.
A siliceous fly ash complying to EN 450-1 specifications and a neat Portland cement of type CEM I, strength class 42.5 R (EN 197-1), were used as starting materials. The siliceous fly ash was sourced directly from a coal power plant and 200 kg was classified using a proprietary prototype producing four fractions of different particle size distribution, i.e., ultrafine (d50: 2–3 μm), fine (d50: 5–8 μm), medium (d50: 15–25 μm) and coarse (d50 > 40 μm) fractions. The fine (referred to as Fine Classified Fly Ash – FCFA) and medium (MCFA) fractions were used in this study. In addition, 2 kg of the fly ash was dry-milled in a Retsch PM 400 planetary ball mill in order to obtain a finely milled fly ash (FMFA) of similar particle size distribution as the FCFA obtained by classification. The planetary ball mill was run at 400 rpm for 10 min in batches of 200 g of fly ash and 500 g of stainless steel milling balls per 500 mL milling container. Thus, in total three test materials, originating from the same initial fly ash but having undergone different pre-treatments, were included in the experimental program.
The particle size distribution of the materials was measured by laser diffractometer using a Horiba LA350 particle size analyzer. Prior to measurement 0.5 g of the powder specimens were dispersed in 20 mL of isopropanol. The suspensions were ultrasonicated using a Sonics VC 505 ultrasonic horn operated at 150 W for 60 s to disperse particle agglomerates. The specific surface area was measured using BET analysis of N2 sorption data on 2 g powder specimens off-gassed at 40°C overnight. The density of the powders was determined by Helium pycnometry. The particle size distribution of the fly ash materials and the cement are reported in Figure 1. The particle size distributions of the fine fly ashes obtained by classification and milling were very similar as measured by laser diffraction, the medium size fraction obtained by classification was significantly coarser and similar to the initial fly ash material. The specific surface area of the fly ashes decreased with fineness, and was slightly higher for the milled fly ash compared to the classified fly ash. The specific gravity increased with fineness and milling, indicating higher amounts of larger (10–100 μm) hollow spherical particles (cenospheres) in the coarser fly ash fractions. Milling caused fragmentation of these cenospheres in consequence increasing both the specific surface area and the density of the bulk material.
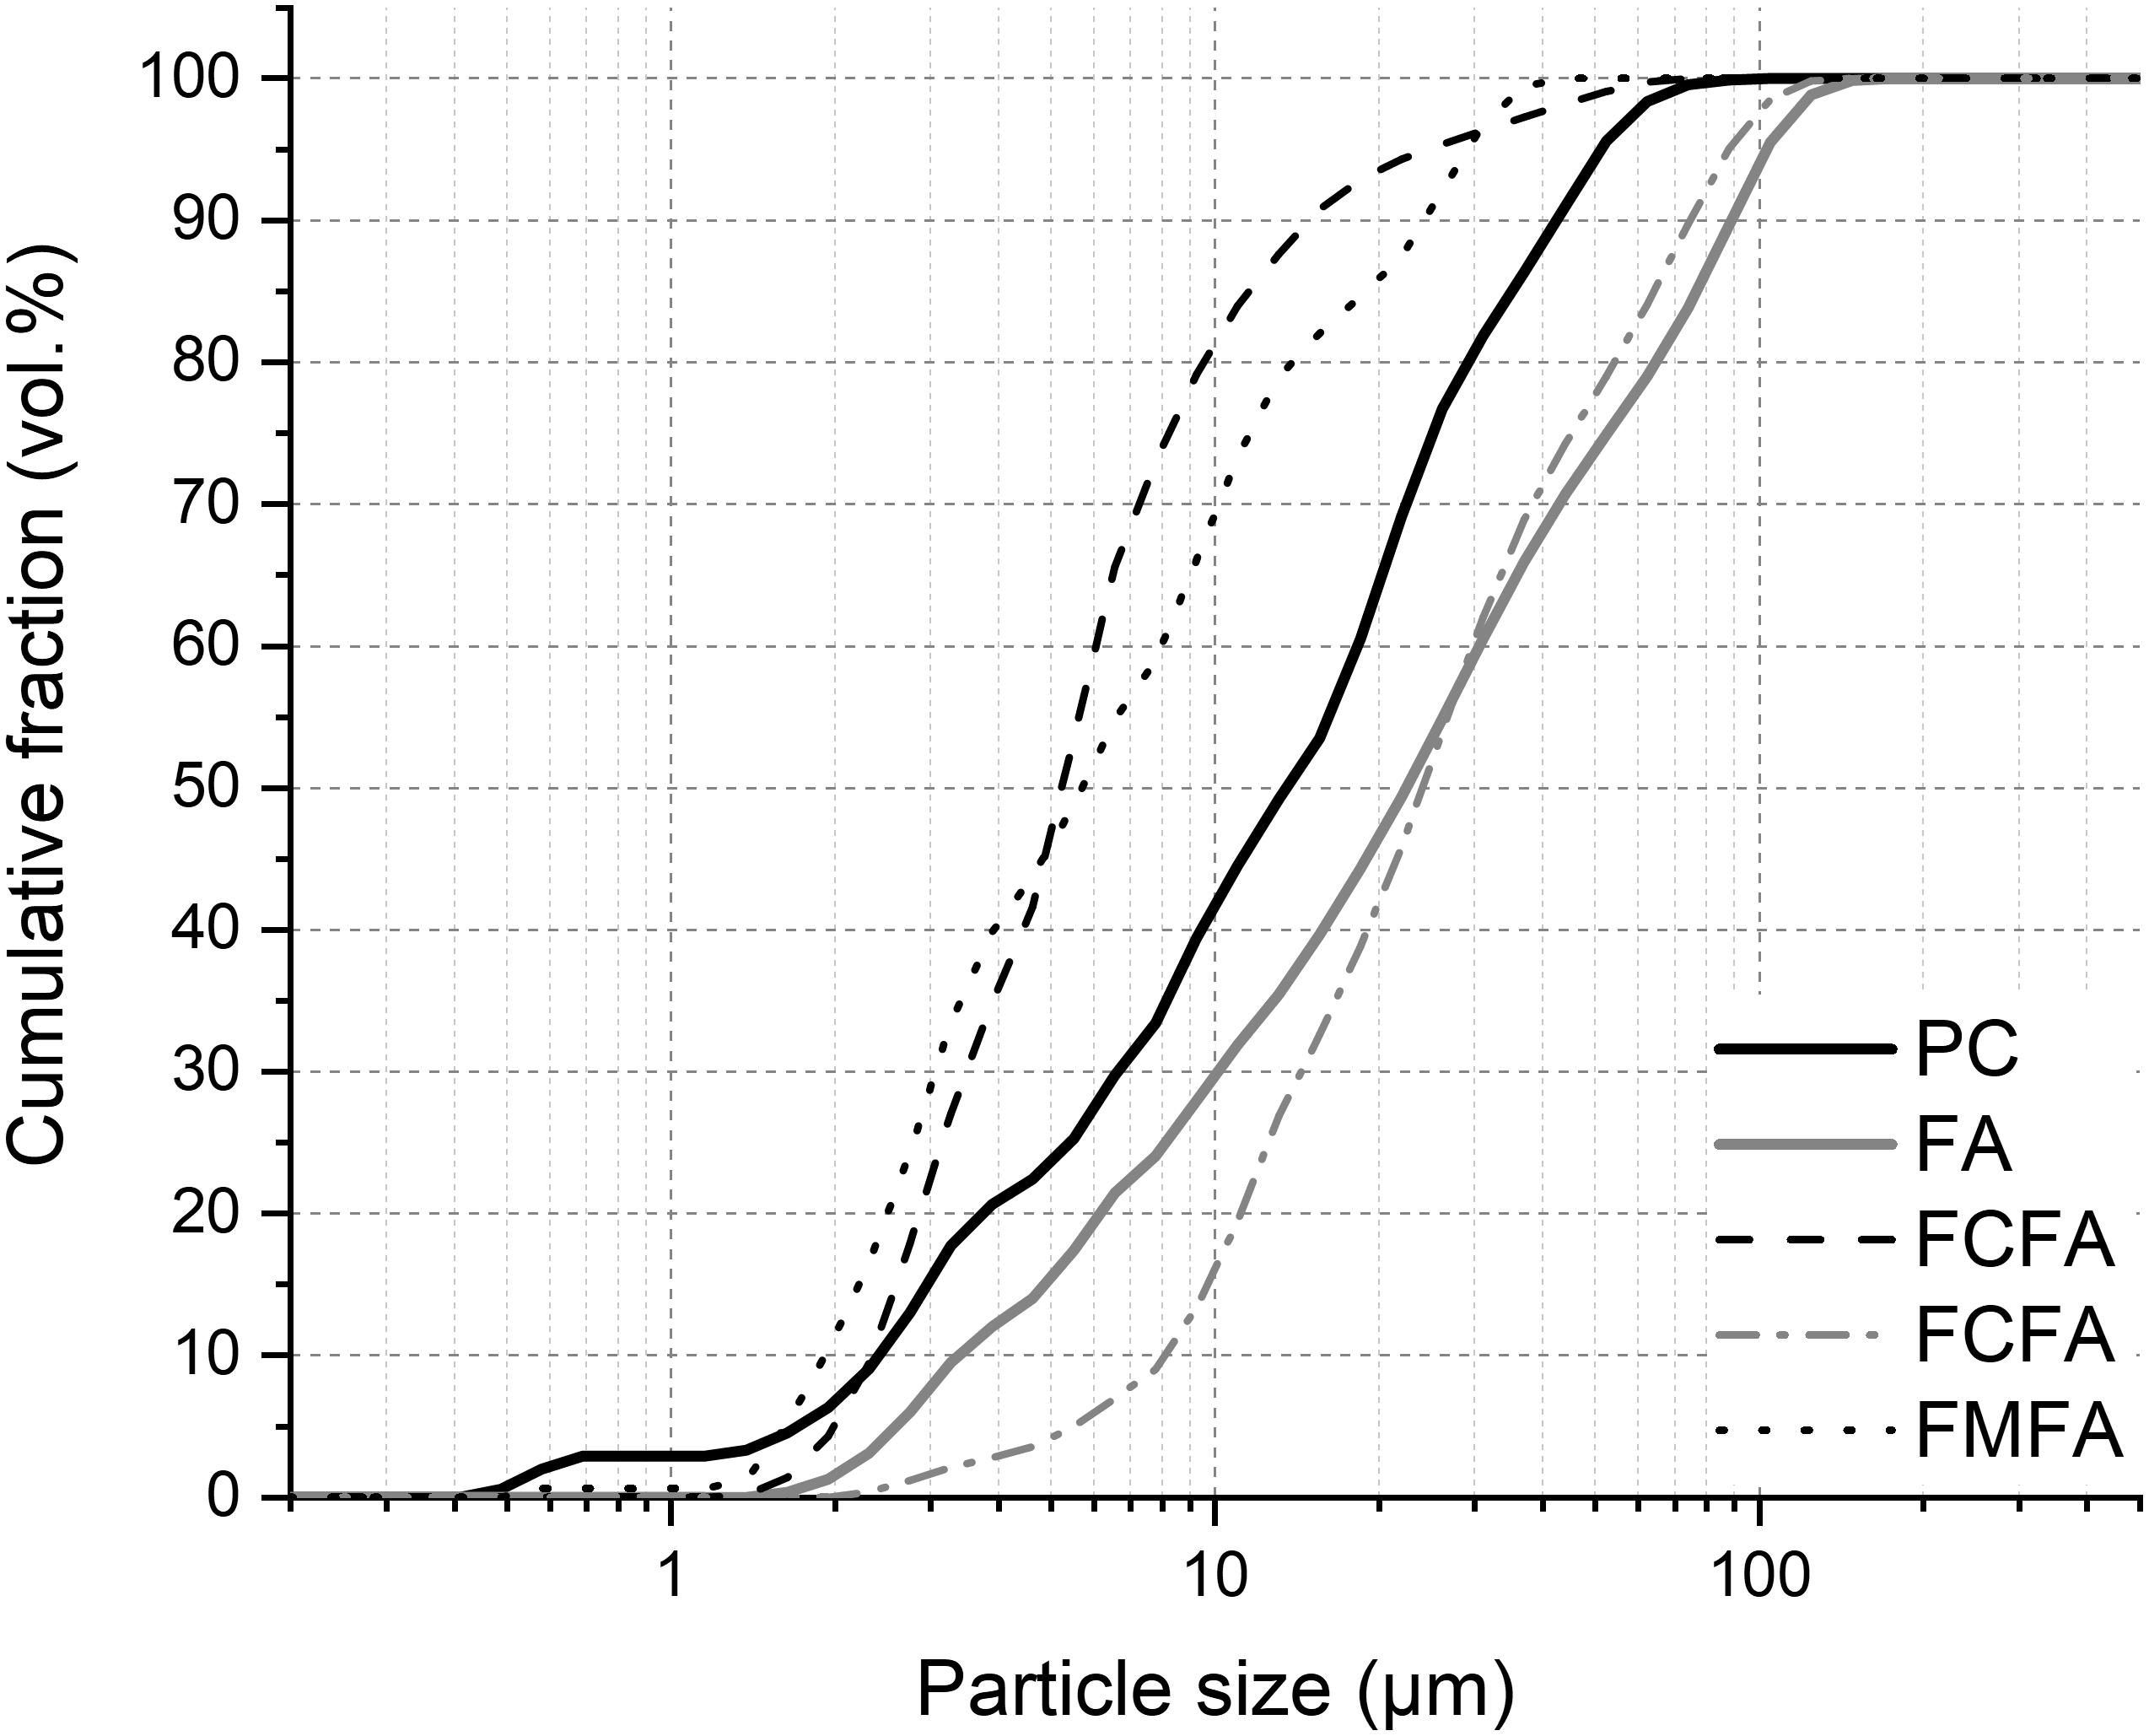
Figure 1. Particle size distribution of the fly ash (FA) materials and the Portland cement measured by laser diffractometry.
The chemical composition of the fly ashes and the Portland cement were measured by X-ray fluorescence (XRF) spectroscopy on beads. Loss on ignition (LOI) and total organic carbon (TOC) were determined according to EN 196-2 and EN 15936. Table 1 reports the chemical composition and the measured physical properties of the starting materials. Minor differences are observed between the fine and medium fly ash fractions obtained after classification. The Al2O3 and, to a lesser extent, alkali and SO3 levels of the fine fly ash were higher, while in return the medium fraction is enriched in SiO2, and to a lesser extent in Fe2O3 and CaO. Trace element compositions are given in Snellings et al. (2019). The chemical composition of the milled fly ash was situated in between, corresponding to the composition of the initial fly ash.
The phase composition of the materials was measured by Rietveld analysis of X-ray powder diffraction (XRD) scans. XRD data of the starting materials and the hydrated cement pastes were collected using an Empyrean diffractometer (Malvern Panalytical) equipped with a CoKα X-ray source and a 2D detector. The source was operated at 45 kV and 40 mA. Diffraction data were recorded in Bragg-Brentano configuration over an angular range of 5 till 70°2θ. A step size of 0.017°2θ and a cumulated measurement time per step of 30 s were employed. The duration of one measurement was approx. 15 min. Rietveld analysis was carried out using Topas Academic v4.0 software following the guidelines and crystal structure files given in Snellings (2016). The external standard method was used to determine the amorphous phase content (O’Connor and Raven, 1988), a rutile (Kronos 2300 TiO2) external standard calibrated against NIST SRM 676a α-Al2O3 was used to calculate the K-factor.
The intrinsic pozzolanic reactivity of the fly ashes was evaluated using heat release measurements of R3 test pastes. The R3 test pastes consist of the test material mixed with Ca(OH)2, CaCO3, KOH, K2SO4 and ultrapure water as reagents. Ca(OH)2 and water are present in excess and not limiting the reaction of the test material. KOH and K2SO4 are added to simulate the reaction environment of a hydrating Portland cement. CaCO3 is present since it is usually present in modern Portland cements, and to trigger formation of AFm-carbonate products in combination with reactive alumina from the test material (Avet et al., 2016). The test protocol is described in detail in ASTM C1897.
The hydration kinetics of the cements blended with the fly ash materials was followed on cement pastes for heat release and phase composition by isothermal calorimetry and XRD, respectively. The mechanical performance of the blended cements was determined on mortar specimens.
Cement pastes were prepared at a water to binder mass ratio of 0.4. The binder consisted of blends of Portland cement and fly ash, the cement replacement level by fly ash was 30 wt.%, in addition a neat Portland cement paste was included as control. The dry blends were premixed by hand and subsequently mixed with the water using an overhead propeller mixer at 1600 rpm for 2 min to prepare 120 g of cement paste. All paste components were equilibrated at 20°C before mixing.
Immediately after mixing 12 g of the pastes were loaded into glass calorimeter flasks, sealed air-tight, and lowered into the measurement positions of the isothermal calorimeter. The remainder of the pastes were cast into cylindrical HDPE containers and sealed air-tight using parafilm. The pastes were stored at 20°C until further sampling. At 1, 2, 7, 14, 28, and 90 days of age, two disks of 2–3 mm thickness were cut from the hardened paste using a laboratory diamond saw. One disk was immediately measured by XRD to collect data on the hydration product assemblage without altering it by hydration stoppage (Zhang and Scherer, 2011). The other disk was crushed and hydration stopped by isopropanol solvent exchange following the protocol in Snellings et al. (2018). After hydration stoppage the samples were stored in a desiccator over silica gel until further analysis by TGA.
Mortar samples were prepared and cast according to EN 196-1. Blended cements with 30 wt.% replacement of cement by fly ash were used as binder, as well as neat Portland cement (CEM I 42.5 R) as reference. Siliceous sand, size graded according to EN 196-1 was used. Mortars were mixed at a water to binder mass ratio of 0.5 and a sand to binder ratio of 3:1. The mortar bars were demolded after 1 day and further cured under water at room temperature (20 ± 2°C) until the age of testing. Compressive strength testing of the mortar bars was carried out following EN 196-1.
A TAM Air calorimeter pre-equilibrated and calibrated was used for the heat release measurements. The heat release of the R3 pastes was measured at a curing temperature of 40°C until 7 days of reaction. The heat release measurements of the blended cement pastes were made at 20°C curing temperature and continued until 28 days after mixing. Direct heat flow and cumulative heat results were obtained, the initial time for integration of the heat flow results was taken at the minimum heat flow in the induction period, i.e., the minimum between the initial dissolution heat flow peak, and the main hydration peak.
X-ray powder diffraction data of “fresh” disks were collected according to the description in the section “Materials.” Fresh disks were hand-polished on sandpaper to remove surface irregularities and saw traces, residual polishing powders were removed using a clean wet tissue. The disk was mounted in a XRD sample holder for front loading and fixed with modeling clay. Rietveld analysis of the XRD data was carried out according to section “Materials.” All results were back-calculated to the initial, dry binder content. This is necessary to take into account the dilution effect of the gradually increasing amount of bound water, and to enable calculation of the degree of reaction of the individual cement or clinker phases.
To cross-check and validate the XRD results, TGA measurements were made on a selected set of hydration stopped paste specimens. TGA measurements were made using a Netzsch STA 449C instrument from room temperature up to 1,000°C. Mass changes of a 50 mg sample were recorded while heating the specimen at 10°C/min under a 50 mL/min N2 flow.
The intrinsic reactivity of the fly ash test materials was measured in the clinker-free R3 model system. In this system the pozzolanic reaction of the fly ash can be measured without influence or interactions of the clinker hydration reactions (Snellings and Scrivener, 2016). The exothermal reaction of the fly ashes with the R3 reagents produces cement hydrates equivalent to those formed in combination with clinker phases (Avet et al., 2016). The reactivity of the fly ashes in this system can be evaluated by measuring properties such as portlandite consumption, chemical shrinkage, bound water formation and heat release. Bound water and heat release measurements were found to be the most reliable and robust properties for assessment of the reactivity of a wide range of SCMs (Li et al., 2018). Here heat release is measured by isothermal calorimetry as this provides a continuous view of the reaction.
The results are presented in Figure 2 and show a clear differentiation in heat release response by the test materials. The effect of fly ash fineness on reactivity is predominant over compositional differences or amorphous content. Both fine fly ashes, be it obtained through classification or milling showed a higher reactivity than the coarser medium fraction obtained after classification. Compared to the raw fly ash the fine milled and fine classified fly ashes showed, respectively, 40 and 57% higher heat release by 7 days. The differences between both fine fly ashes were initially small, yet increased by 7 days in favor of a higher heat release for the fine classified fly ash. This could be related to the more narrow particle size distribution for the fine classified fly ash, and to a lesser extent to its higher amorphous content. The finely milled fly ash contributed more heat initially which is presumably related to the higher quantity of fines in the material, but may also result from mild mechanical activation by milling. Part of the impact energy of the milling balls on the particle surface may create disorder or amorphisize surface layers and create reactive defect sites (Kumar et al., 2007). Comparing the amorphous content of the milled and the raw fly ash Table 2 shows only minor differences and as such is inconclusive. A previous study including kinetic modeling of the reactivity of a wider range of classified fly ashes made abstraction of surface effect and confirmed the predominant effect of material particle size distribution, yet indicated that secondary effects related to particle morphology would need to be taken into account to accurately predict R3 test reactivity based on material characteristics (Snellings et al., 2019). The R3 test aims to test the intrinsic reactivity of the test materials and in consequence provides the test materials with excess amounts of reagents or conditions that can otherwise be reaction limiting in actual blended cements, such as portlandite levels, water, space, etc (Skibsted and Snellings, 2019). These, and the interactions with clinker phase hydration are subsequently assessed in hydration studies on blended cement pastes.
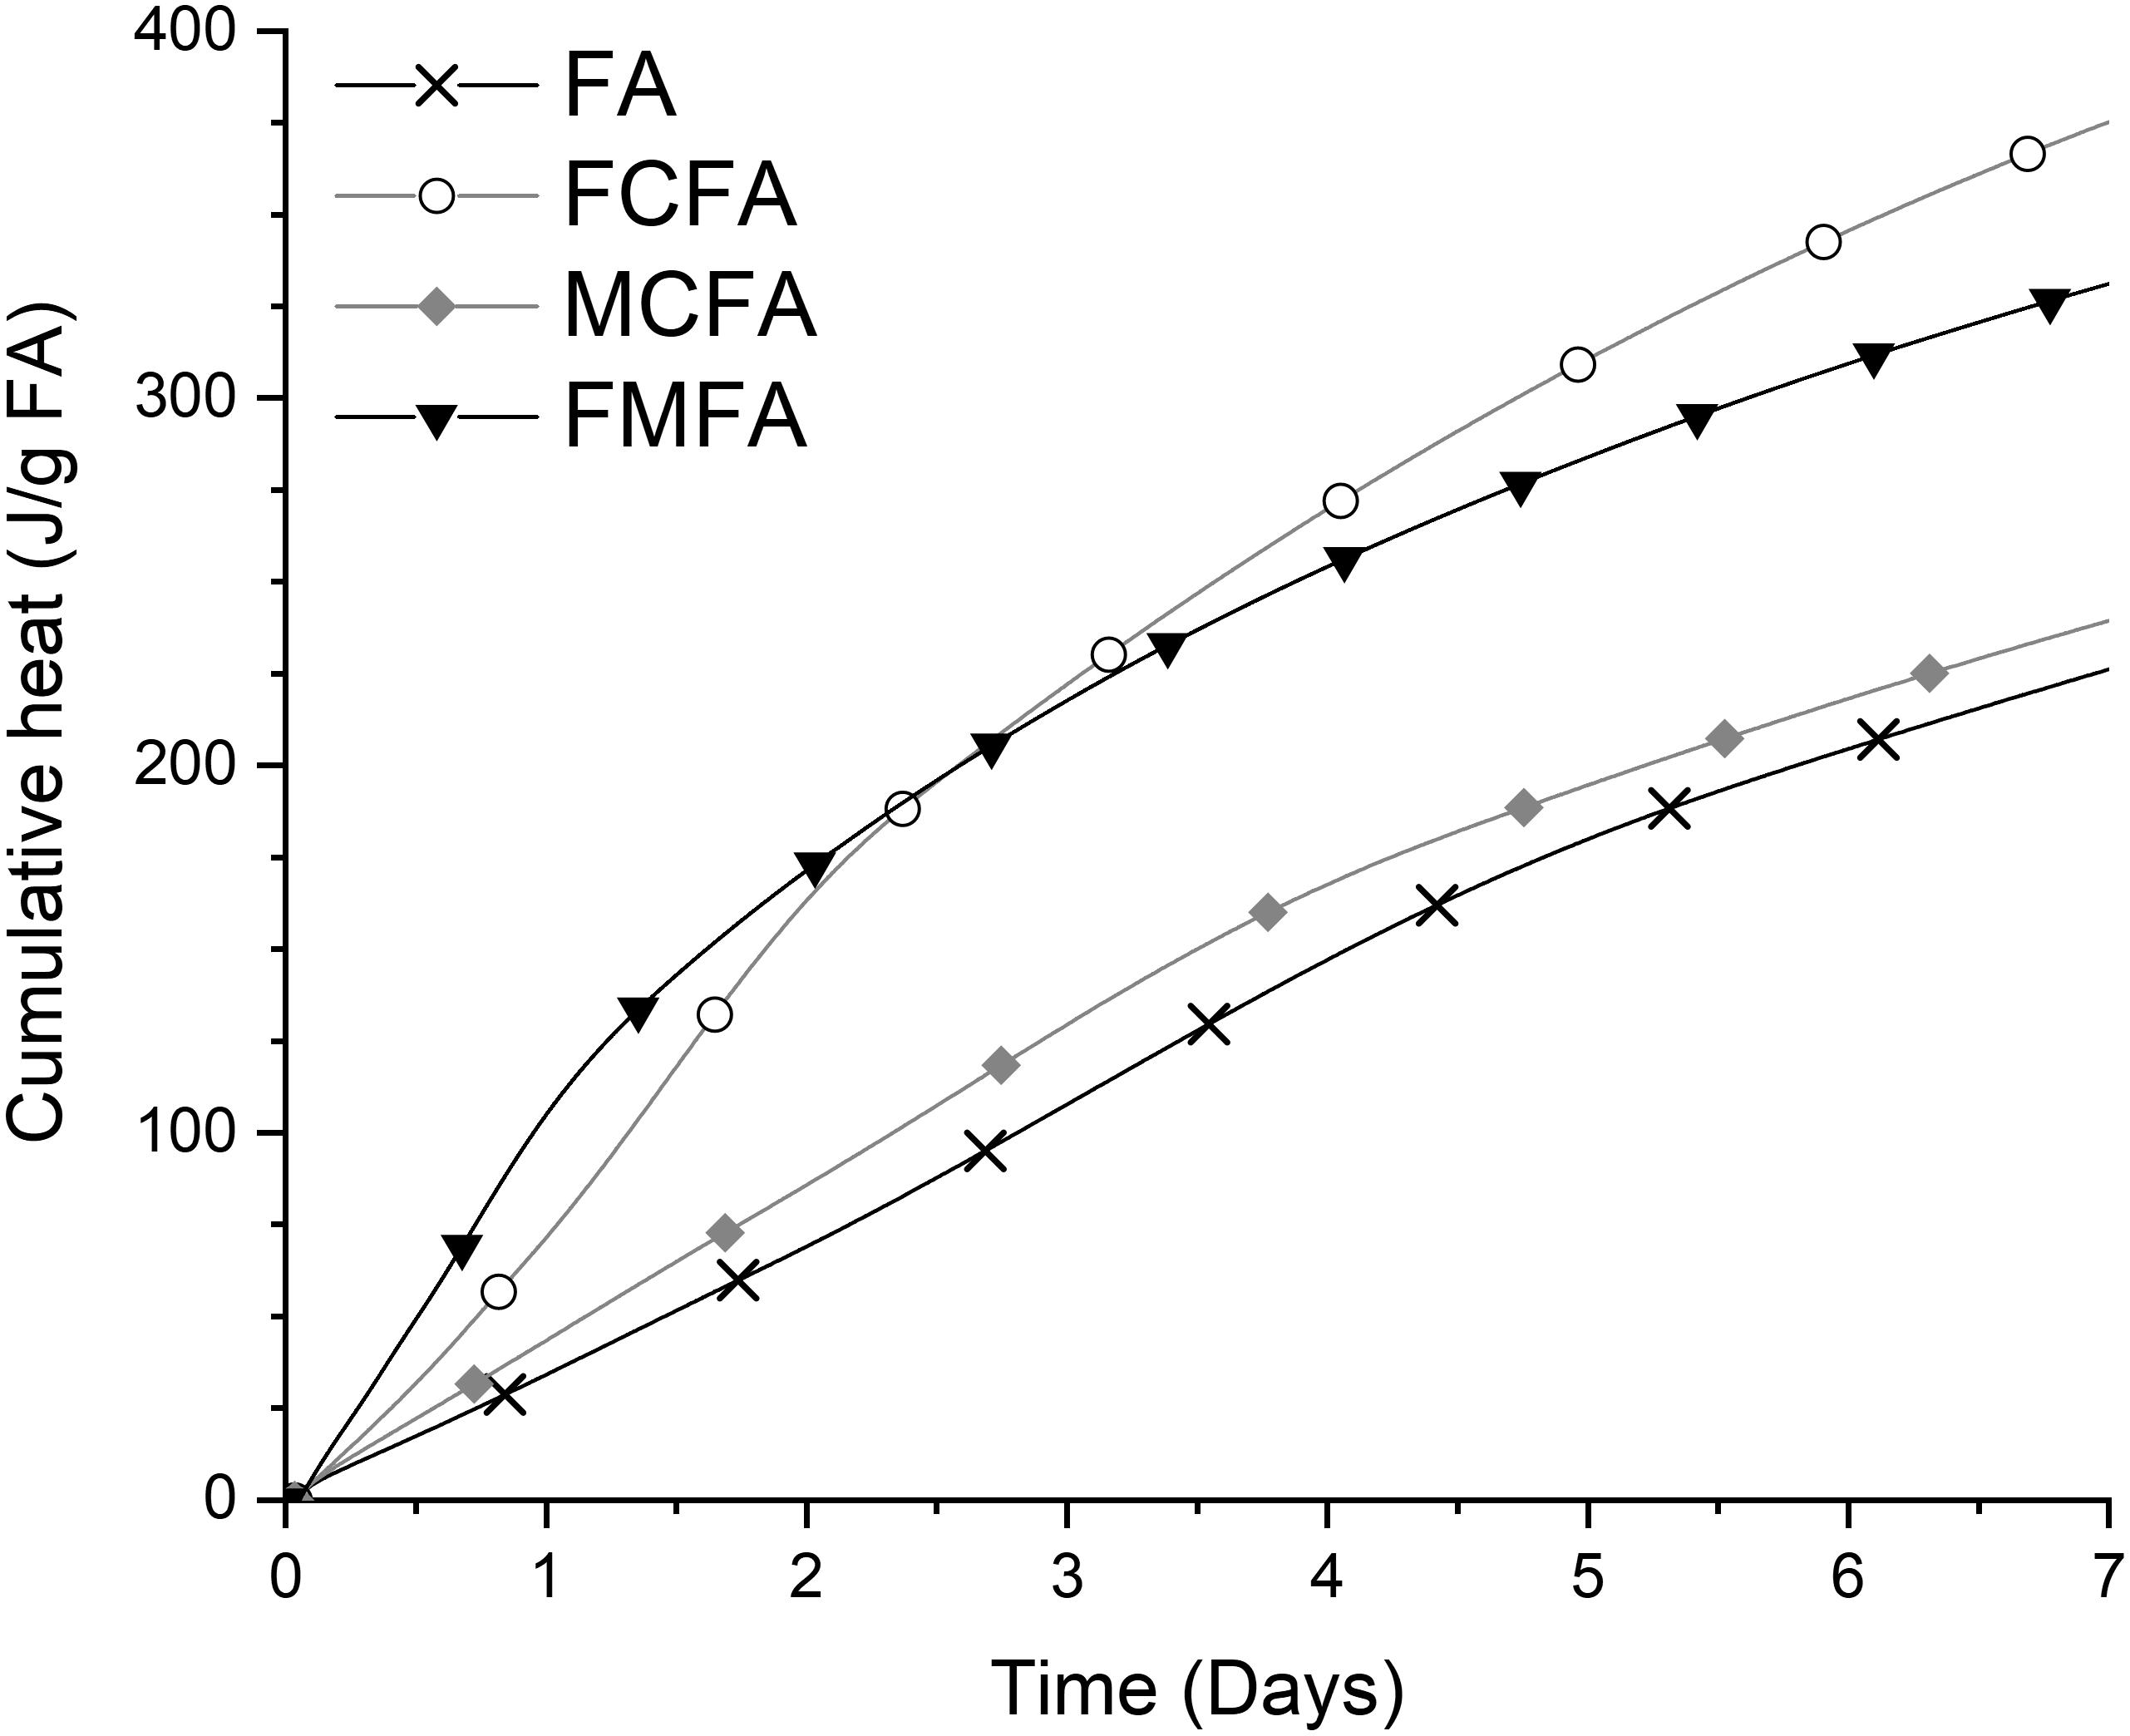
Figure 2. R3 test heat release results for the fly ash (FA) materials, the results are expressed as J/g of fly ash.
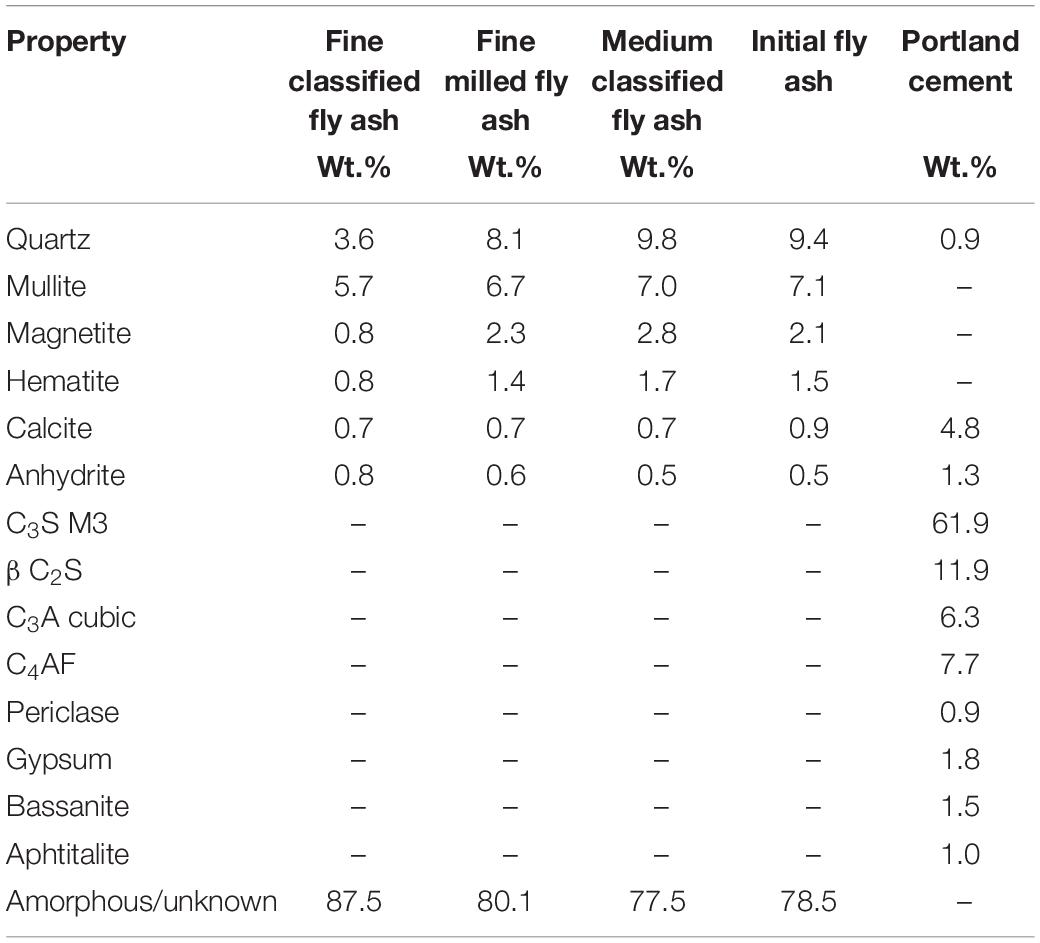
Table 2. Phase composition determined by XRD-Rietveld analysis of the fly ashes and the Portland cement.
Changes in the hydration kinetics can be conveniently investigated by hydration heat flow measurements. For blended cement comprising 30% of the fly ash test materials the heat flow curves are given in Figure 3. The hydration of fly ash blended cements is initially dominated by the hydration of the clinker phases. Conventional siliceous fly ashes react at early age (before 3–7 days) only to a very limited extent (Haha et al., 2010; Deschner et al., 2012). However, the presence of a fine material such as fly ash impacts the hydration rate of the clinker phases through the filler effect (Gutteridge and Dalziel, 1990; Berodier and Scrivener, 2014). Inclusion of a filler material, be it reactive or non-reactive, increases the effective water to Portland cement ratio, and provides additional surface for hydrates to nucleate and grow upon. As such the filler effect usually boosts the early hydration of the Portland cement constituent. This effect is strongest for materials finer than Portland cement with high specific surface area (for instance silica fume) or with a high affinity to cement hydrates (for instance limestone). The filler effect is most easily seen when normalizing the heat release curves by the amount of Portland cement in the paste.
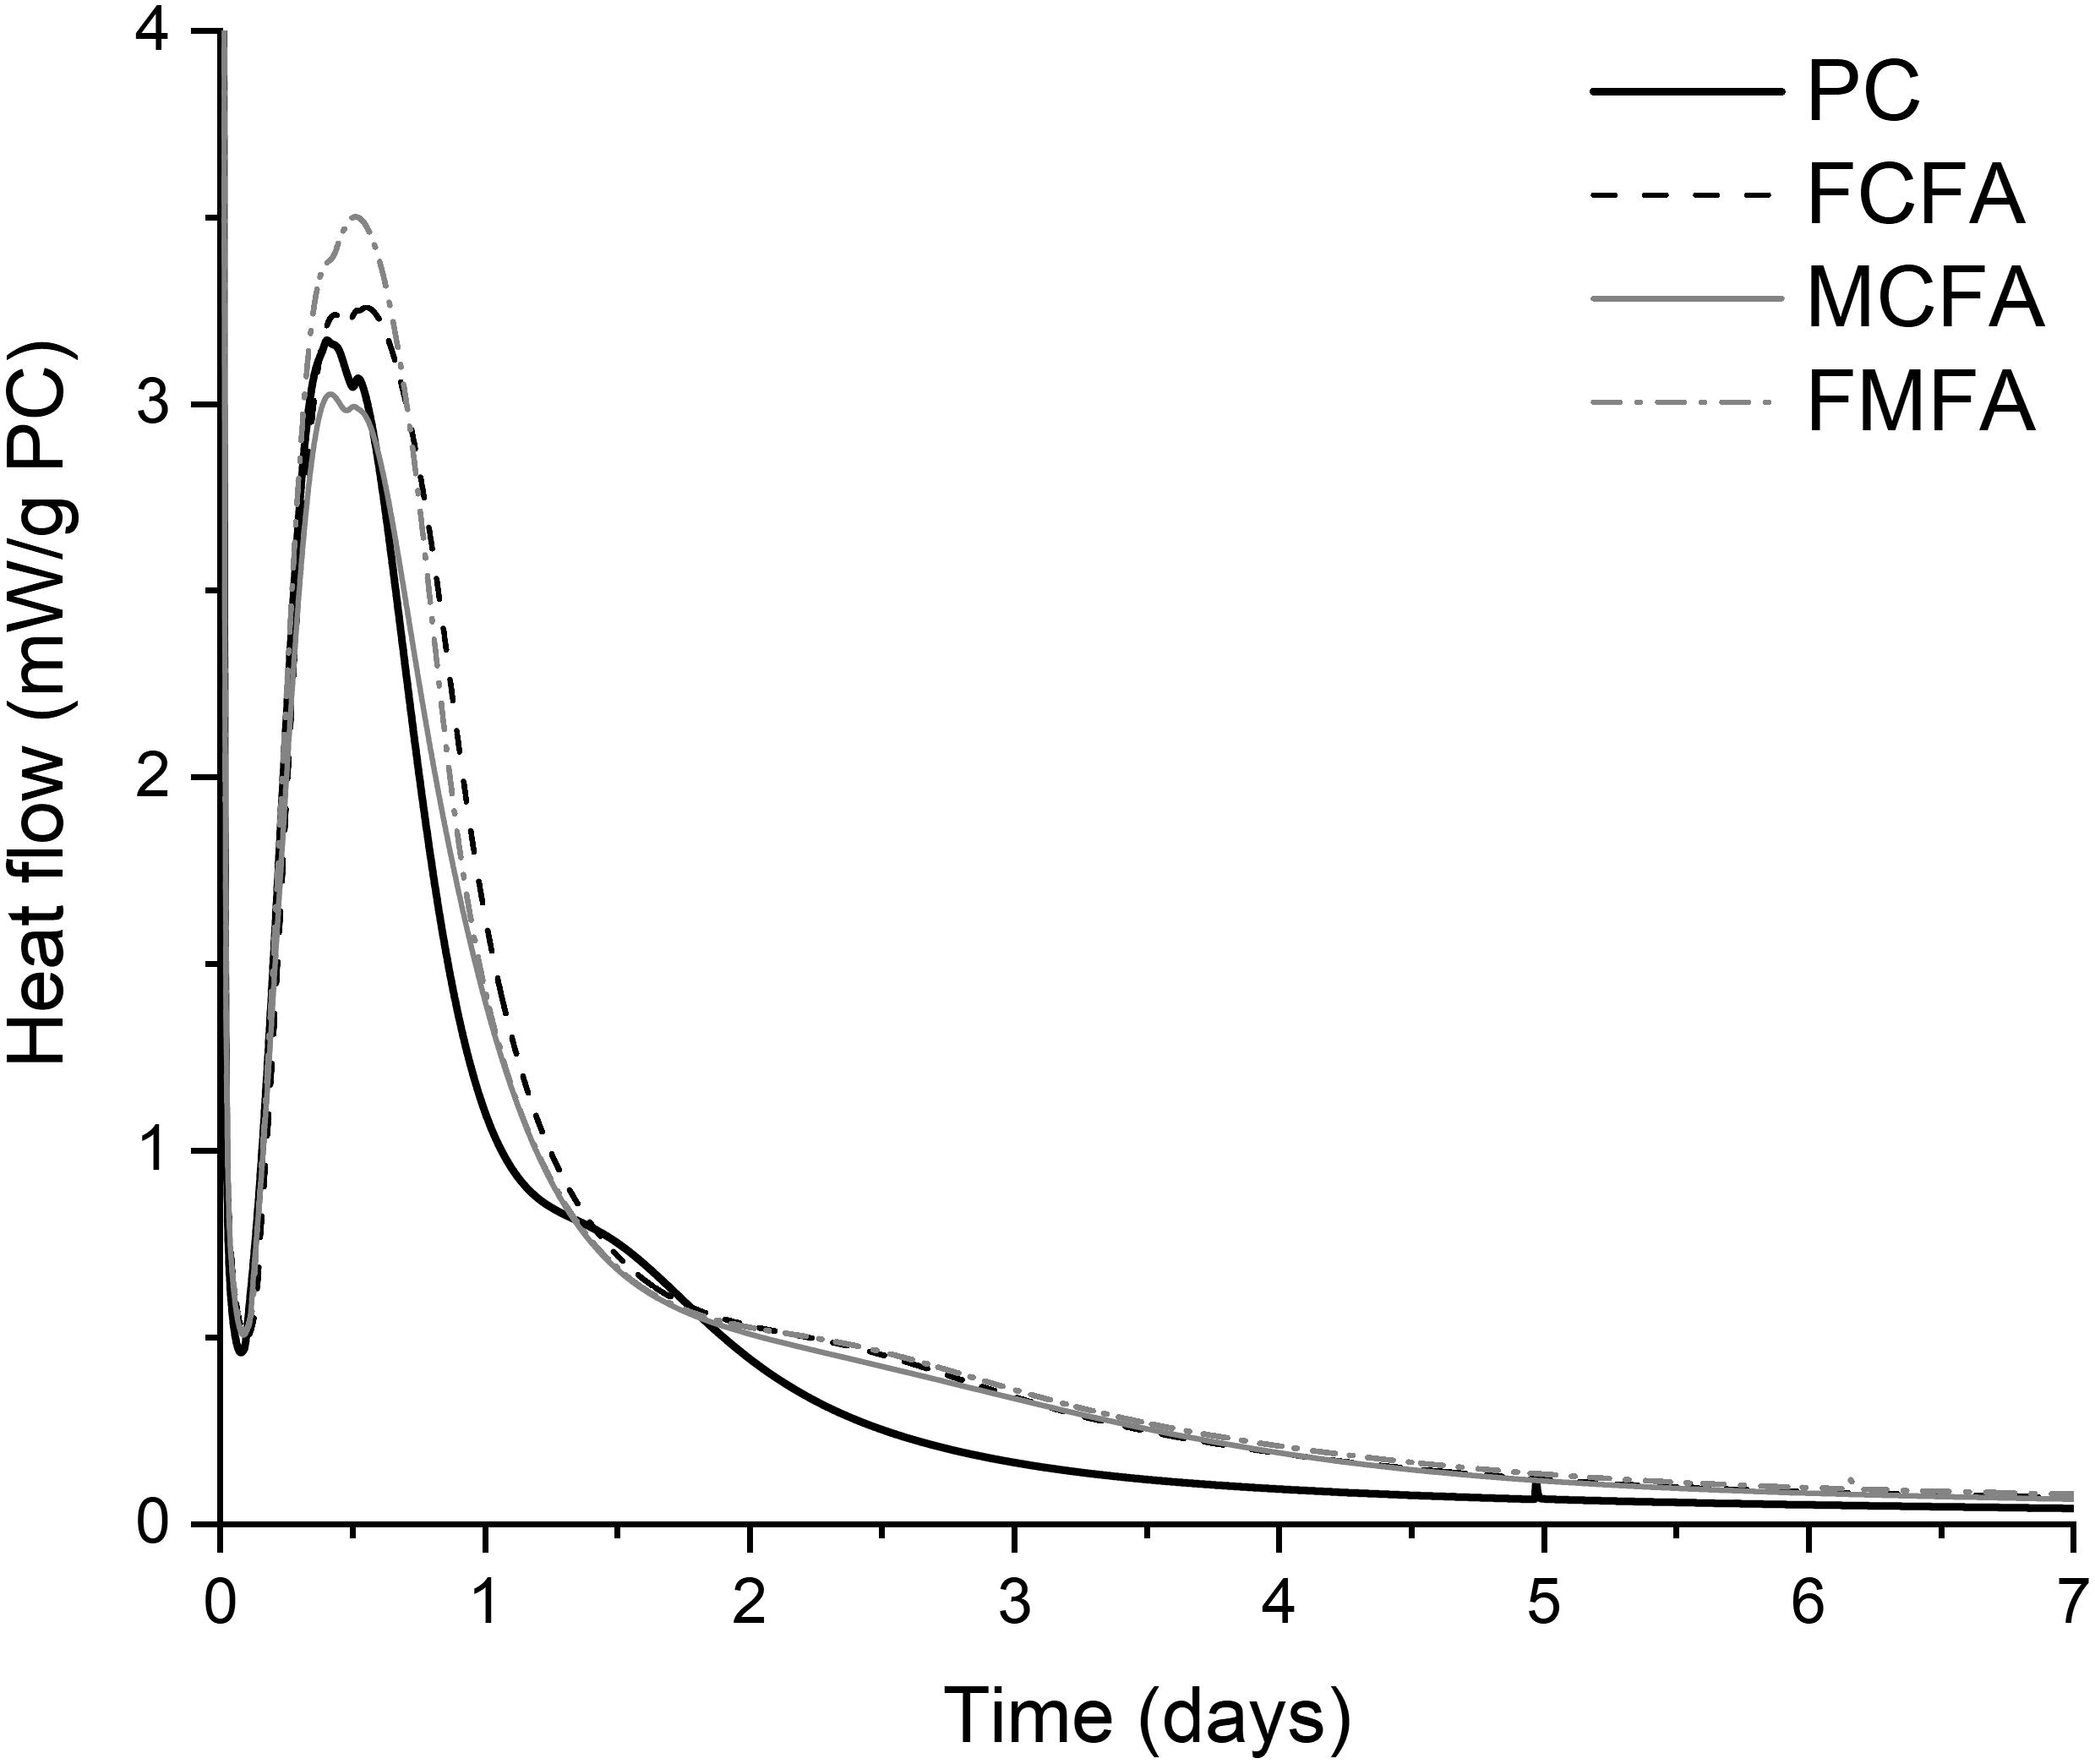
Figure 3. Hydration heat flow results of the fly ash blended cements and the control Portland cement, values are expressed as J/g of Portland cement.
The heat flow results in Figure 3 indeed show that the fine fly ashes increase the maximum heat flow of the main alite hydration peak situated around 12–16 h. The fine milled fly ash was most effective in increasing the heat flow, which may be related to its higher specific surface area. On the other hand, the medium classified fly ash slightly lowered the heat flow maximum compared to the control which would be explained by the coarser particle size distribution of this material. All fly ashes prolonged the duration of the main alite hydration peak and delayed the occurrence of the aluminate peak (also called sulfate depletion peak). While the former observation can be explained by the filler effect prolonging the regime of rapid hydration, the latter indicates a change in the sulfate over solid surface area in the system (Zunino and Scrivener, 2019). At the occurrence of the aluminate peak, the solid surface area is mainly representing the C-S-H hydration products as the specific surface area of C-S-H is situated in the range 50–1,000 m2/g and therefore two to three orders of magnitude higher than that of the binder (Jennings, 2000). Given that all fly ashes shift the aluminate peak to a similar extent, yet had variable effects on the alite peak and thus the amount of C-S-H in the system, it is likely the presence of minor amounts of sulfate in the fly ash that caused the delay of the aluminate hydration peak. As previously indicated, adjustment of the sulfation level of fly ash blended cements is instrumental in optimization of the cement performance (Niemuth et al., 2012).
The cumulated effects of the heat flow events are shown by plotting the cumulative heat of hydration in Figure 4. Again the cumulated heat is normalized by the mass of Portland cement in the pastes, this to provide a clear view on the effect of the fly ashes. The cumulative heat is recorded up to 28 days of hydration, as such also covering part of the pozzolanic reaction of the fly ashes. The results in Figure 4 align with the R3 heat release results and show a higher cumulative heat for the blended cements with fine fly ashes than for cements with the medium fly ash. Normalized by the Portland cement mass all blended cements released more heat than the control. This heat difference is partially caused by the filler effect increasing the overall degree of hydration of cement, and additionally by the pozzolanic reaction of the fly ashes (Berodier and Scrivener, 2015). Decoupling both processes can be done by independently determining the degree of clinker hydration and quantifying other properties such as portlandite content and the hydrate assemblage of the hydrating cements (Avet et al., 2018).
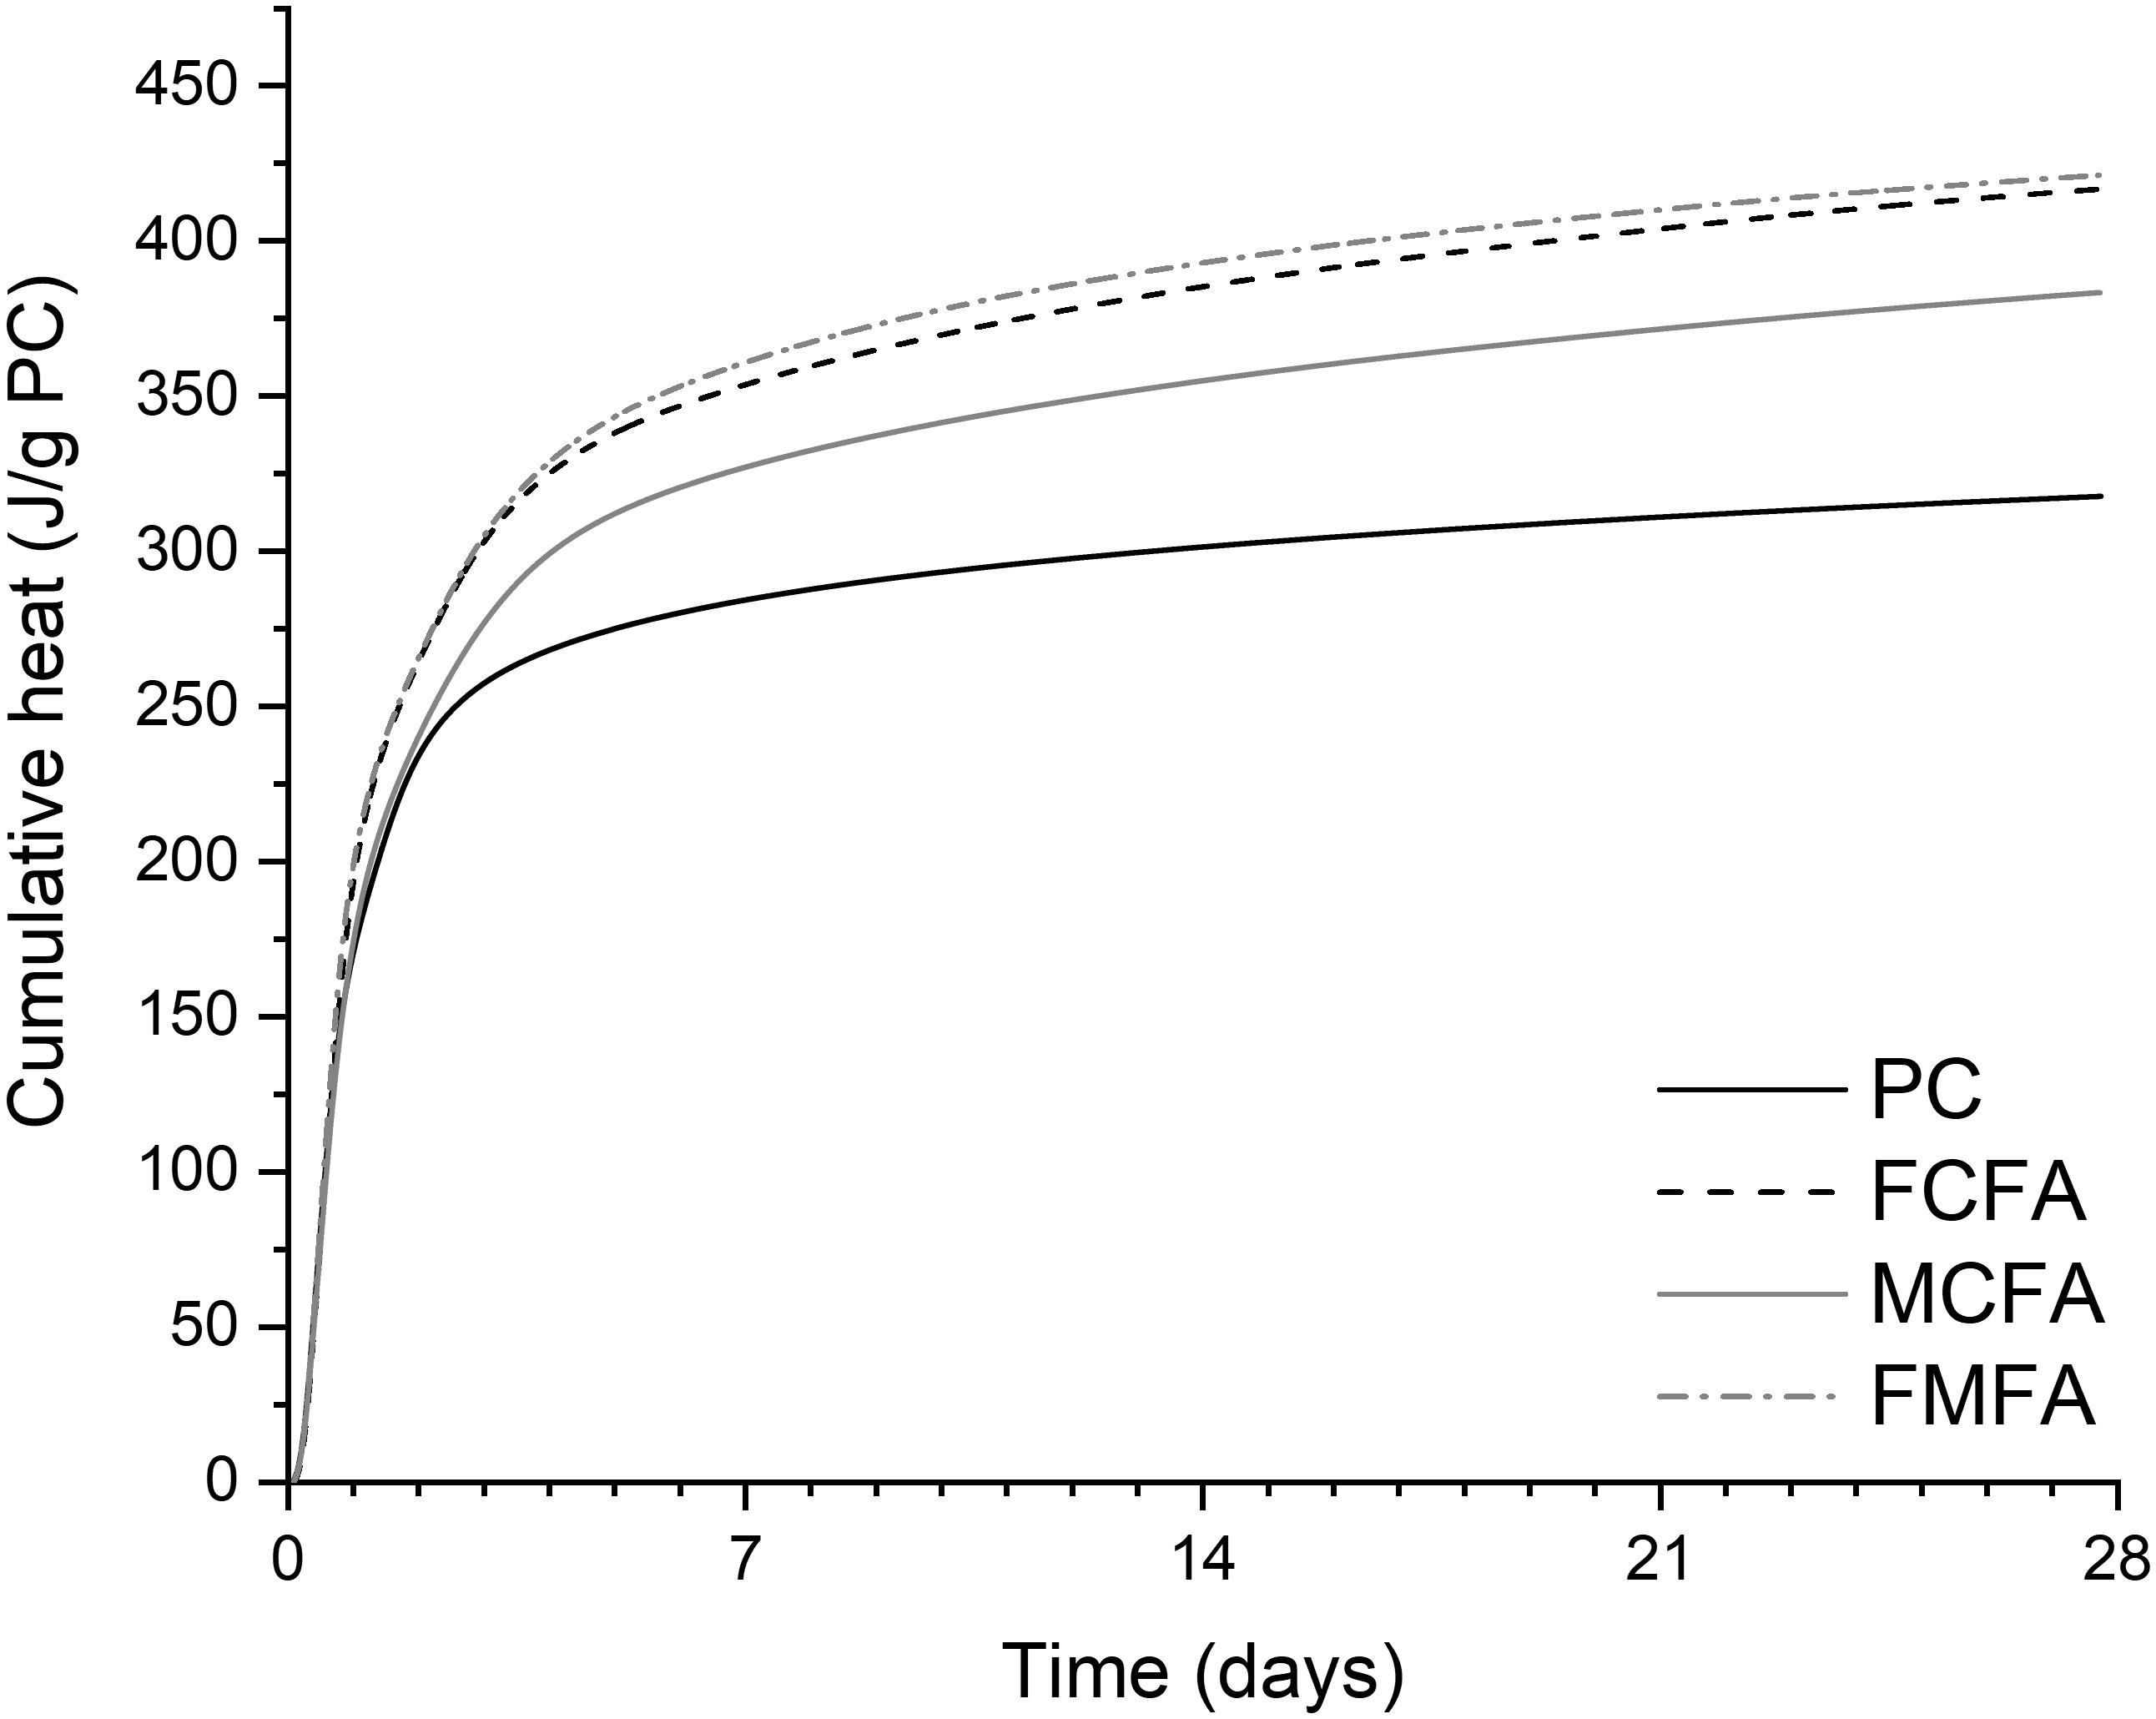
Figure 4. Cumulative heat of hydration of the fly ash blended cements and the control Portland cement, values are expressed as J/g of Portland cement.
The degree of reaction of the individual clinker phases was determined by Rietveld analysis of XRD scans at specific ages. As an example, Figure 5 shows the XRD scans of the time series of the blended cement with the fine classified fly ash. It can be observed that the XRD peaks of the main clinker phases gradually decline in intensity over time, instead the hydration product peaks steadily grow. Rietveld analysis was then applied to extract the clinker phase quantities for each point in time. The quantification results for the main clinker phases are presented in Figure 6. C3S and C3A reacted first, reaching high degrees of reaction by 7 days of hydration. As expected C4AF and C2S reacted more slowly and mainly at later ages. The lower amounts of clinker phases in the blended cements are primarily related to the dilution of the clinker by the 30 wt.% replacement by the fly ashes. However, when comparing the blended cements to the control a more rapid consumption of C3S in the two fine fly ash blended cements was revealed at early ages (1–7 days), confirming the heat flow observation of an enhanced filler effect for these blended cements. The medium size fly ash showed this effect only to a lesser extent. In contrast, at late ages the degree of reaction of the clinker phases was slightly higher (88%) in combination with the medium fly ash cement than in the fine fly ash cements (83–84%). This can be explained by a more intense competition for space between hydration products of the clinker and the more reactive fine fly ashes. Similar observations were made for other reactive SCMs such as blast furnace slag and calcined clay (Berodier and Scrivener, 2015; Avet and Scrivener, 2018). However, compared to slag and calcined clay the effect of fly ash on clinker hydration is more limited, reflecting the generally lower reactivity of fly ashes.
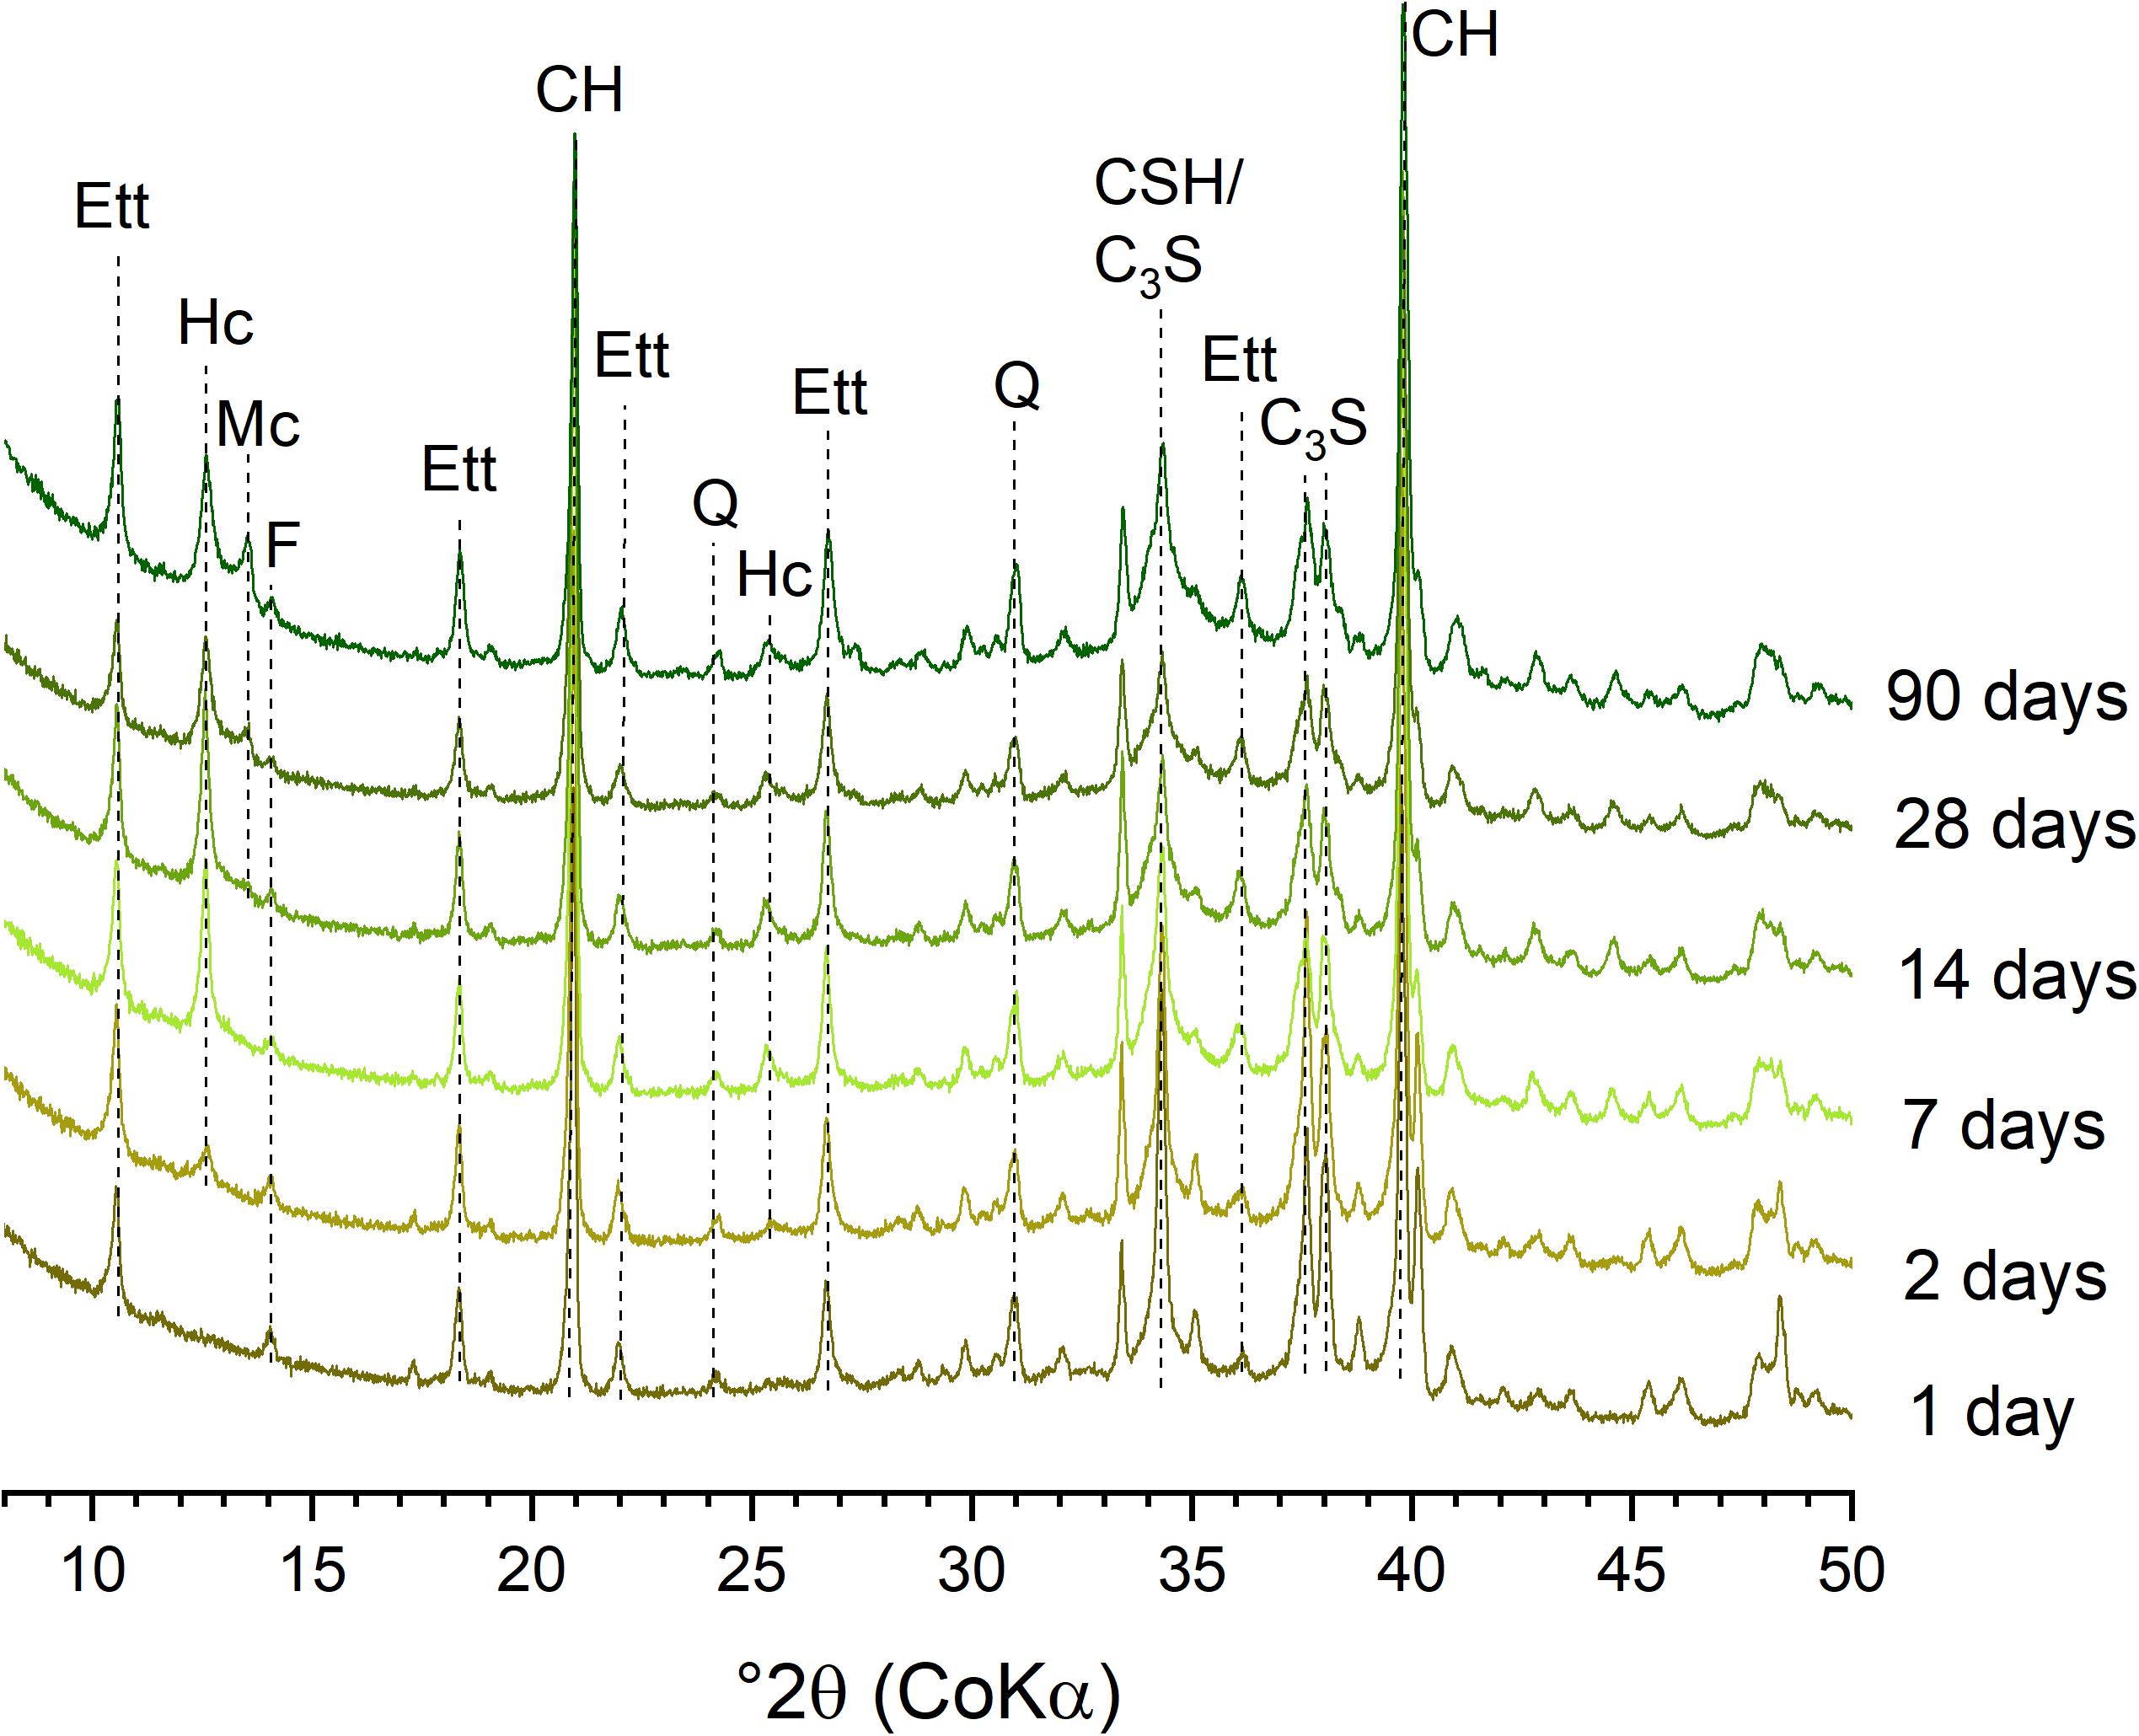
Figure 5. XRD scan time series (1–90 days) of the hydration of cement blended with fine classified fly ash. The main XRD reflections are assigned to the corresponding phases: Ett, ettringite; Hc, hemicarboaluminate; Mc, monocarboaluminate; F, ferrite (C4AF); CH, portlandite; Q, quartz; CSH, C-S-H; and C3S, alite.
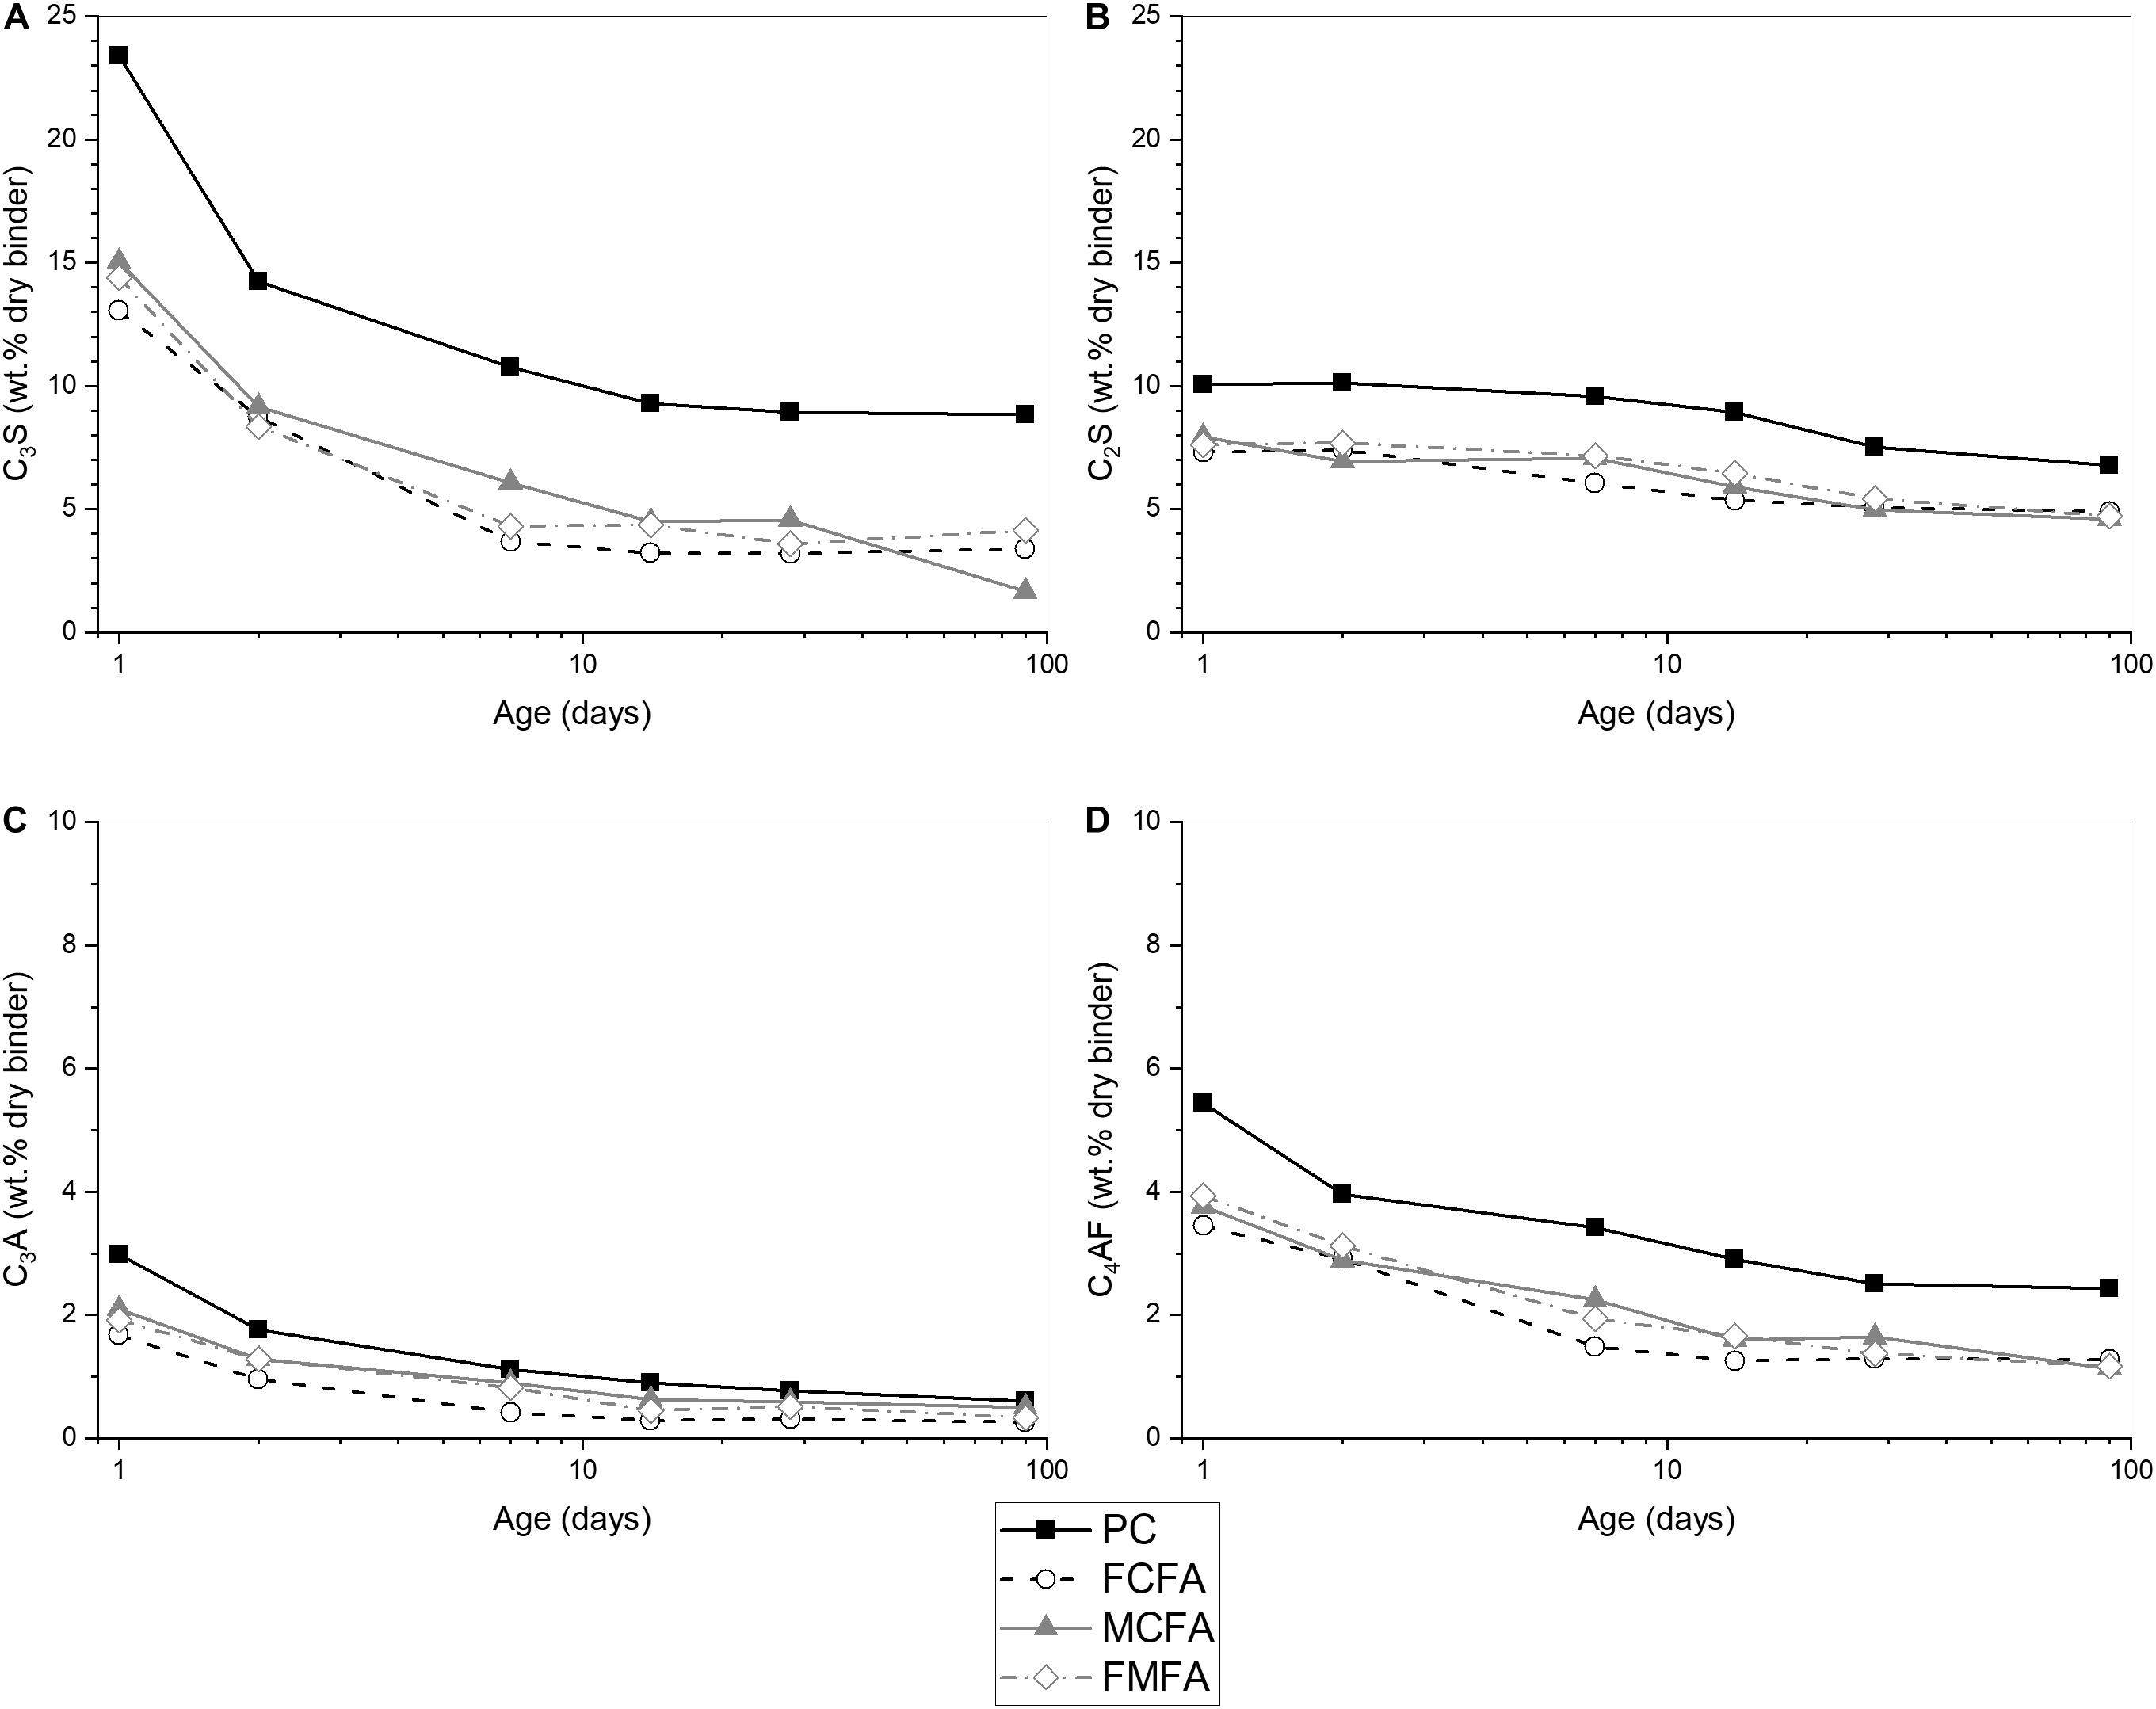
Figure 6. XRD-Rietveld analysis results showing the consumption of the main clinker phases from 1 to 90 days of hydration for the fly ash blended cements and the reference Portland cement. (A): C3S, (B): β-C2S, (C): C3A, (D): C4AF.
The hydration product assemblage of the cements at 90 days of hydration is compared in Figure 7. All cements presented the same hydration products, i.e., C-S-H, portlandite, ettringite, and carbonate AFm-phases. While the hydrate assemblage remained similar, Rietveld quantitative phase analysis showed that individual hydrate phase contents were impacted by the replacement of Portland cement by the fly ashes. The results in Figure 8 show that portlandite and ettringite contents of the blended cements were lower than in the control, while hemi- and monocarboaluminate contents were similar to slightly higher than in the control.
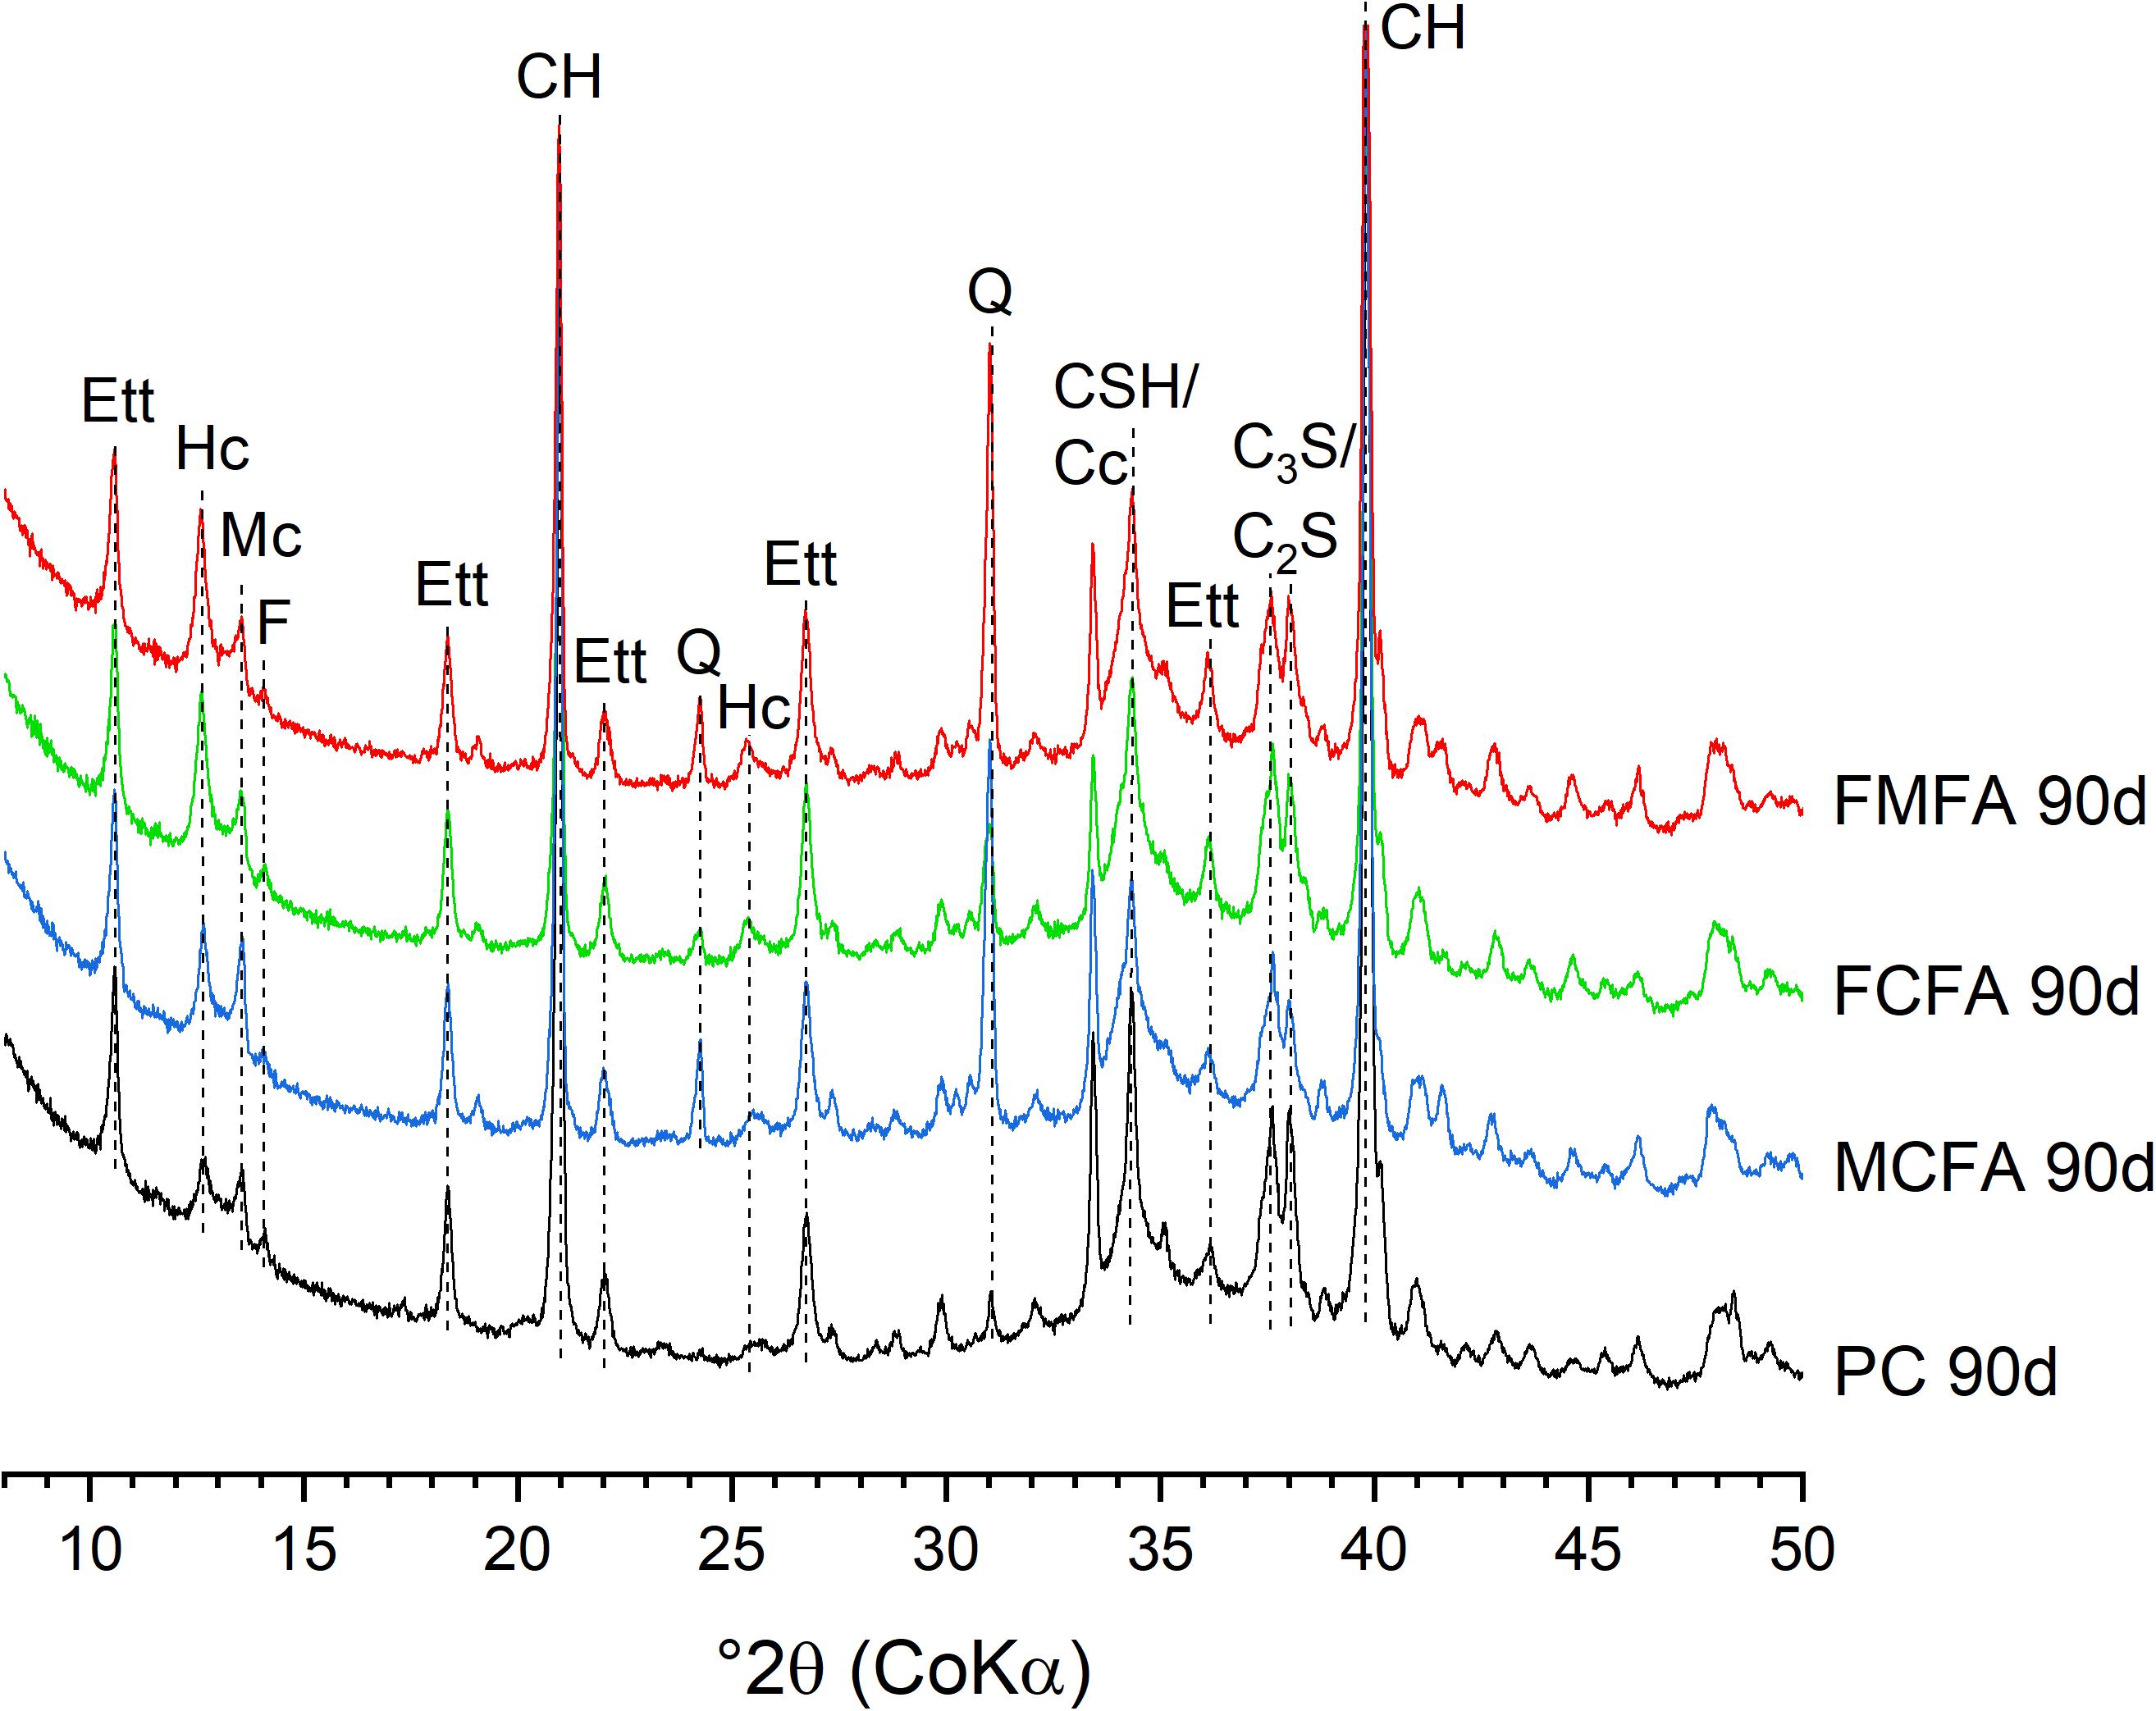
Figure 7. XRD scans of 90 days hydrated fly ash blended cements and reference Portland cement. The main XRD reflections are assigned to the corresponding phases: Ett, ettringite; Hc, hemicarboaluminate; Mc, monocarboaluminate; F, ferrite (C4AF); CH, portlandite; Q, quartz; CSH, C-S-H; Cc, calcite; C3S, alite; and C2S, belite.
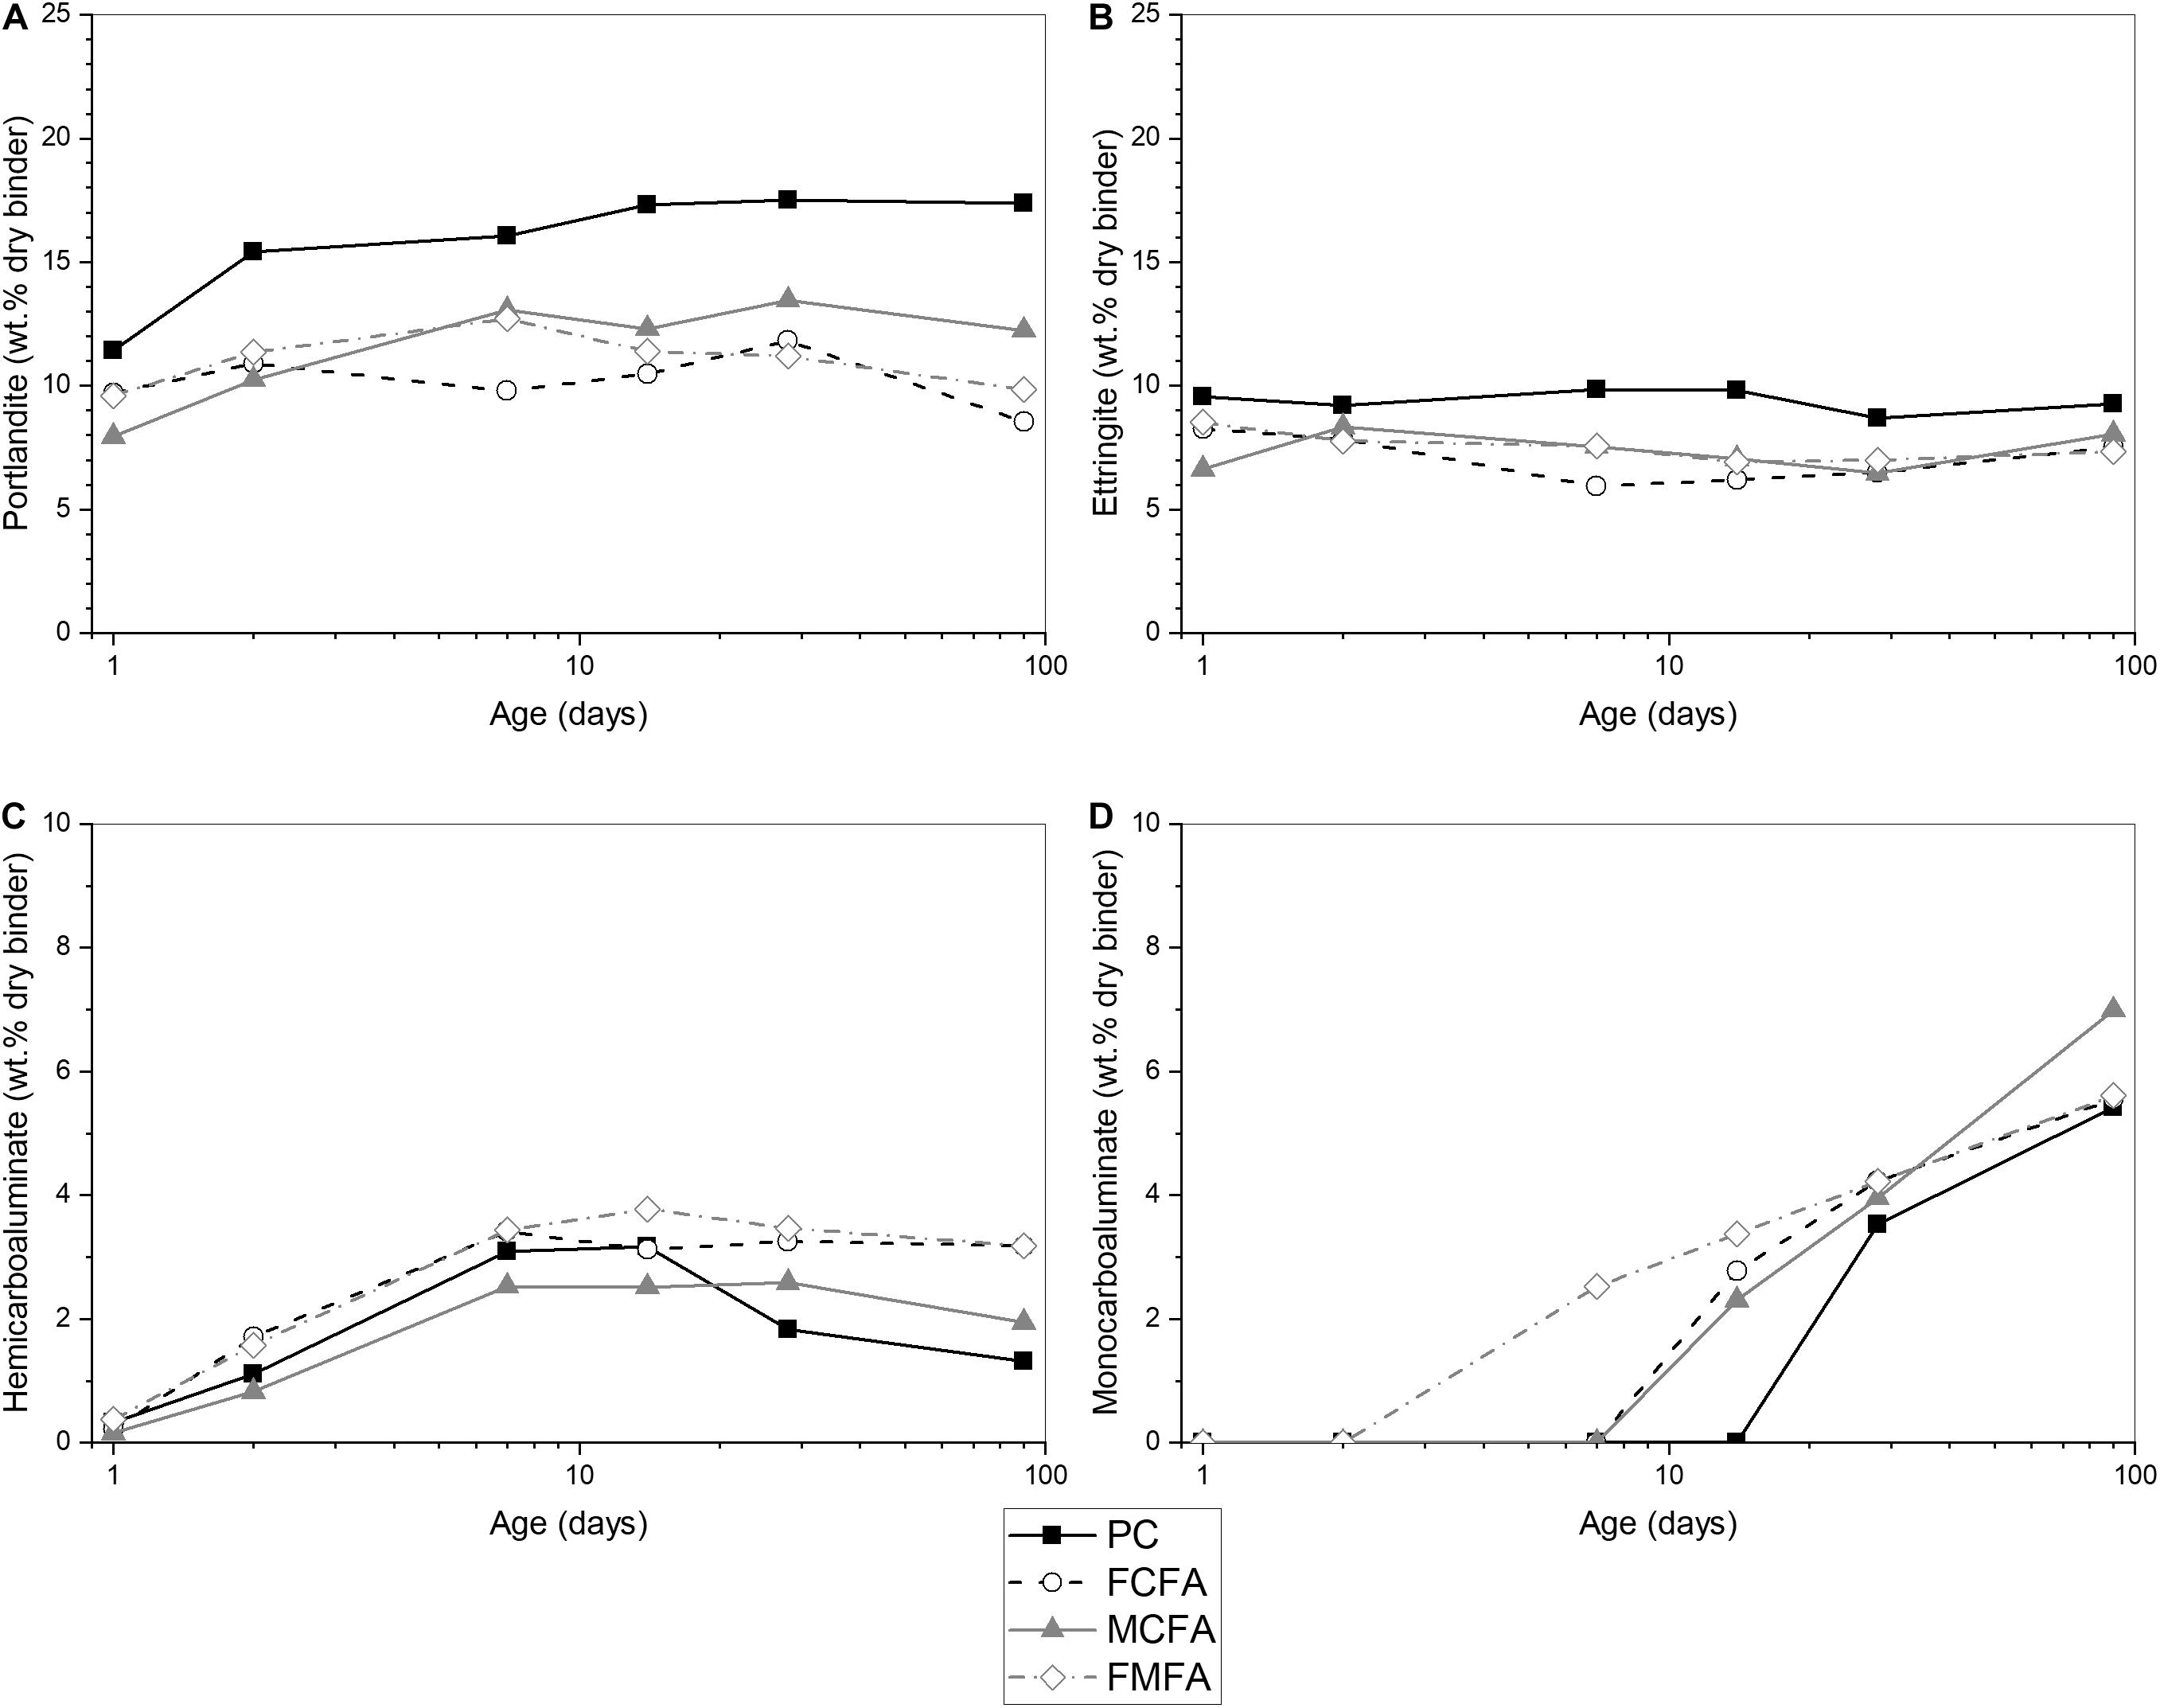
Figure 8. XRD-Rietveld analysis results showing the formation of cement hydration products from 1 to 90 days of hydration for the fly ash blended cements and the reference Portland cement. (A): portlandite, (B): ettringite, (C): hemicarboaluminate, (D): monocarboaluminate.
Taking into account the dilution of the clinker in the blended cements, portlandite levels at 1 day were higher than the control, and then decreased relatively to below the dilution level. This agrees with the enhanced hydration of C3S through the filler effect at early age, while at later ages the pozzolanic reaction of the fly ashes partially consumed the portlandite. In addition, both processes are more pronounced in case of cement replacement by the fine fly ashes. The Rietveld quantification of the portlandite levels was verified by TGA on a selected set of samples spanning the observed range of portlandite levels. A cross-plot of the XRD and the TGA results in Figure 9 provide confirmation within typical error margins of ±2 wt.% (Lothenbach et al., 2016). Assuming a normal distribution of error, linear regression analysis on the data gives a standard error of 1.15 wt.%.
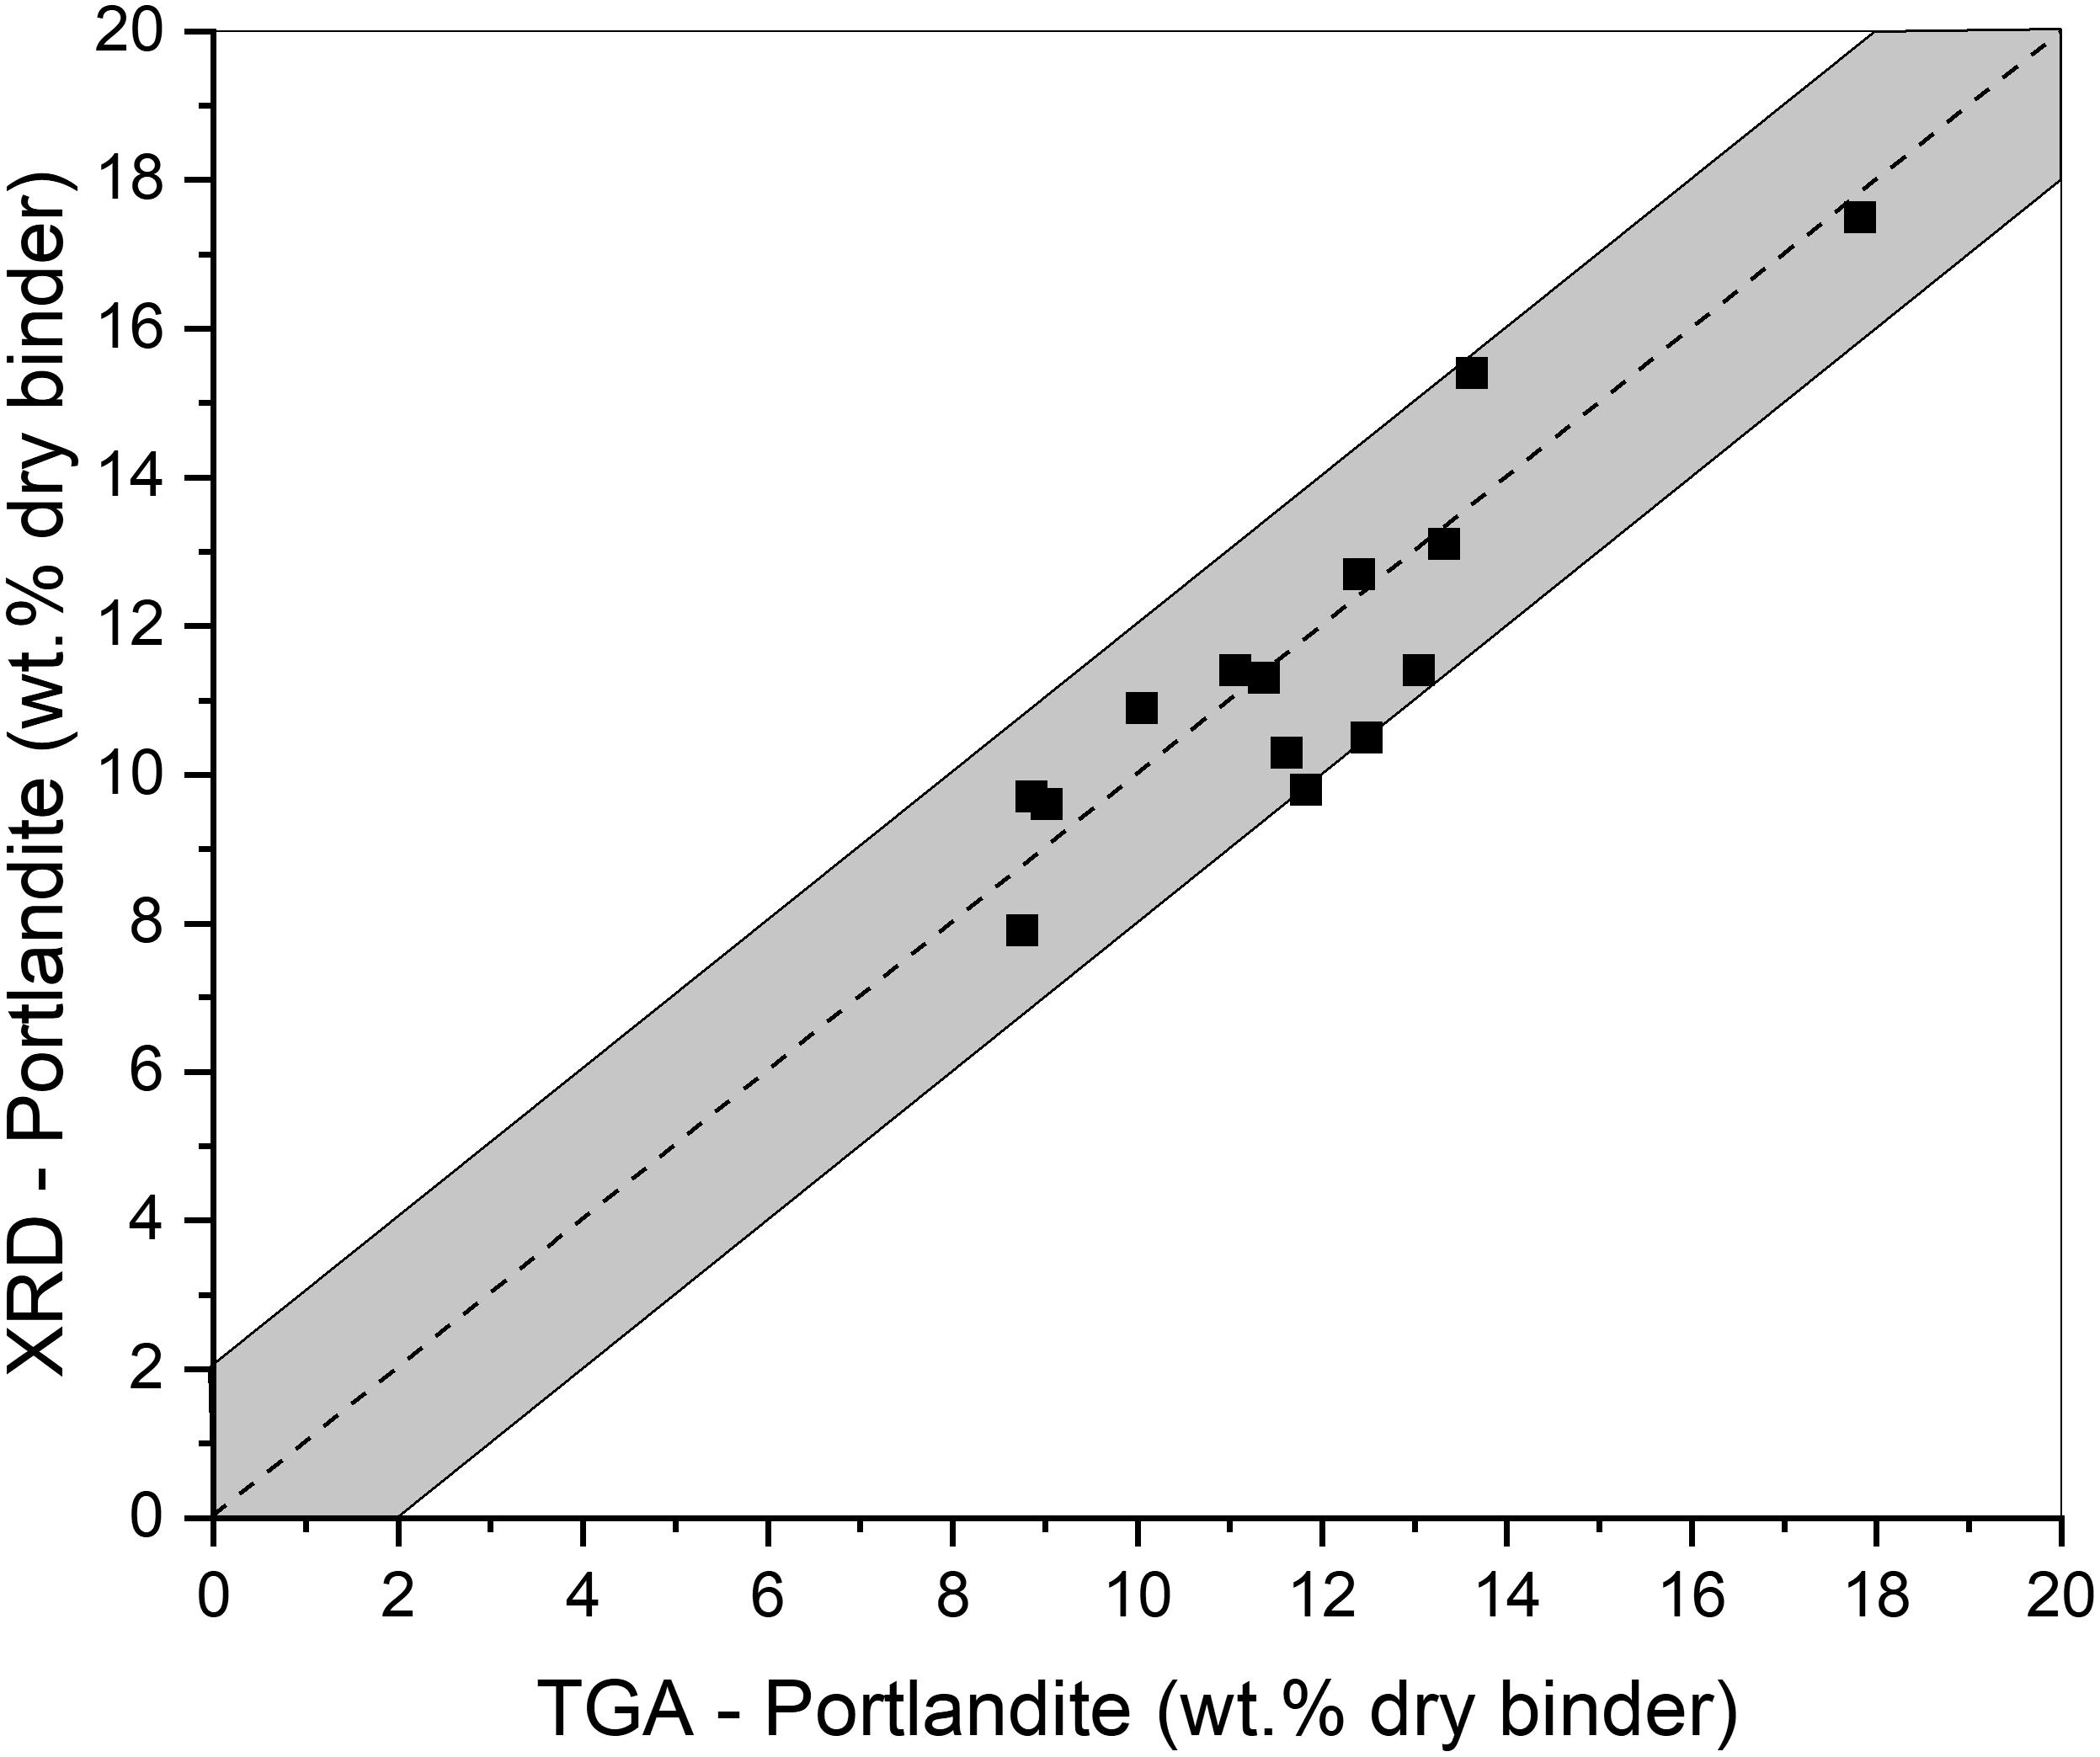
Figure 9. Correlation plot of XRD-Rietveld vs. TGA results for portlandite content. The dashed line represents the 1:1 correlation, the gray area indicates a 2% error margin.
The ettringite levels of the blended cements were similar for all fly ashes and at or slightly above the dilution level. Slightly increased ettringite levels correlate with the introduction of small amounts of sulfate by the fly ashes. The carbo-aluminate contents of the fly ash blended cements were consistently above the Portland cement dilution level and as such testify of the impact of the pozzolanic reaction of the fly ashes. In general, the blended cement hydrate assemblages showed subtle changes caused by the pozzolanic reaction of the fly ashes. These changes can be used to estimate the reaction degree of the fly ashes in the blended cement environment (Scrivener et al., 2015).
The estimation of the reaction degree of SCMs from changes in the hydrate assemblage is not straightforward and characterized by large error margins of at least 10%. This is caused by error propagation from the quantification of the hydration products combined with reaction stoichiometry assumptions and dilution scaling factors to account for the SCM fraction in the cement (Durdziński et al., 2017). In this article, portlandite consumption and heat release by fly ash reaction were taken as proxies for fly ash reactivity. Both were obtained by taking the difference of the measured values and the calculated values for the corresponding degree of reaction of the clinker phases, as measured by XRD.
Portlandite consumption by the fly ash reactions was calculated assuming a stoichiometry of C-S-H Ca/Si ratio of 1.7, a commonly used average value for Portland cement hydration (Jennings, 2008). The results are shown in Figure 10A, the values are expressed as portlandite consumption, i.e., the deficit in portlandite levels measured compared to the theoretically calculated levels. In all fly ash blended cements, portlandite consumption increased over time. The consumption rate, indicated by the trendlines, was higher and similar for both fine fly ash blended cements. Medium fly ash blended cement showed a lower consumption rate of portlandite. In addition, it can be observed that there is significant scatter on the plotted data, in this case originating from random errors in the measurement of the concentrations of five individual phases (four clinker phases and portlandite). Also of note is the 1 day estimates of portlandite consumption that appear rather high. This may indicate a bias in the measurements or calculations such as the assumed C-S-H Ca/Si ratio, which may be higher at early age.
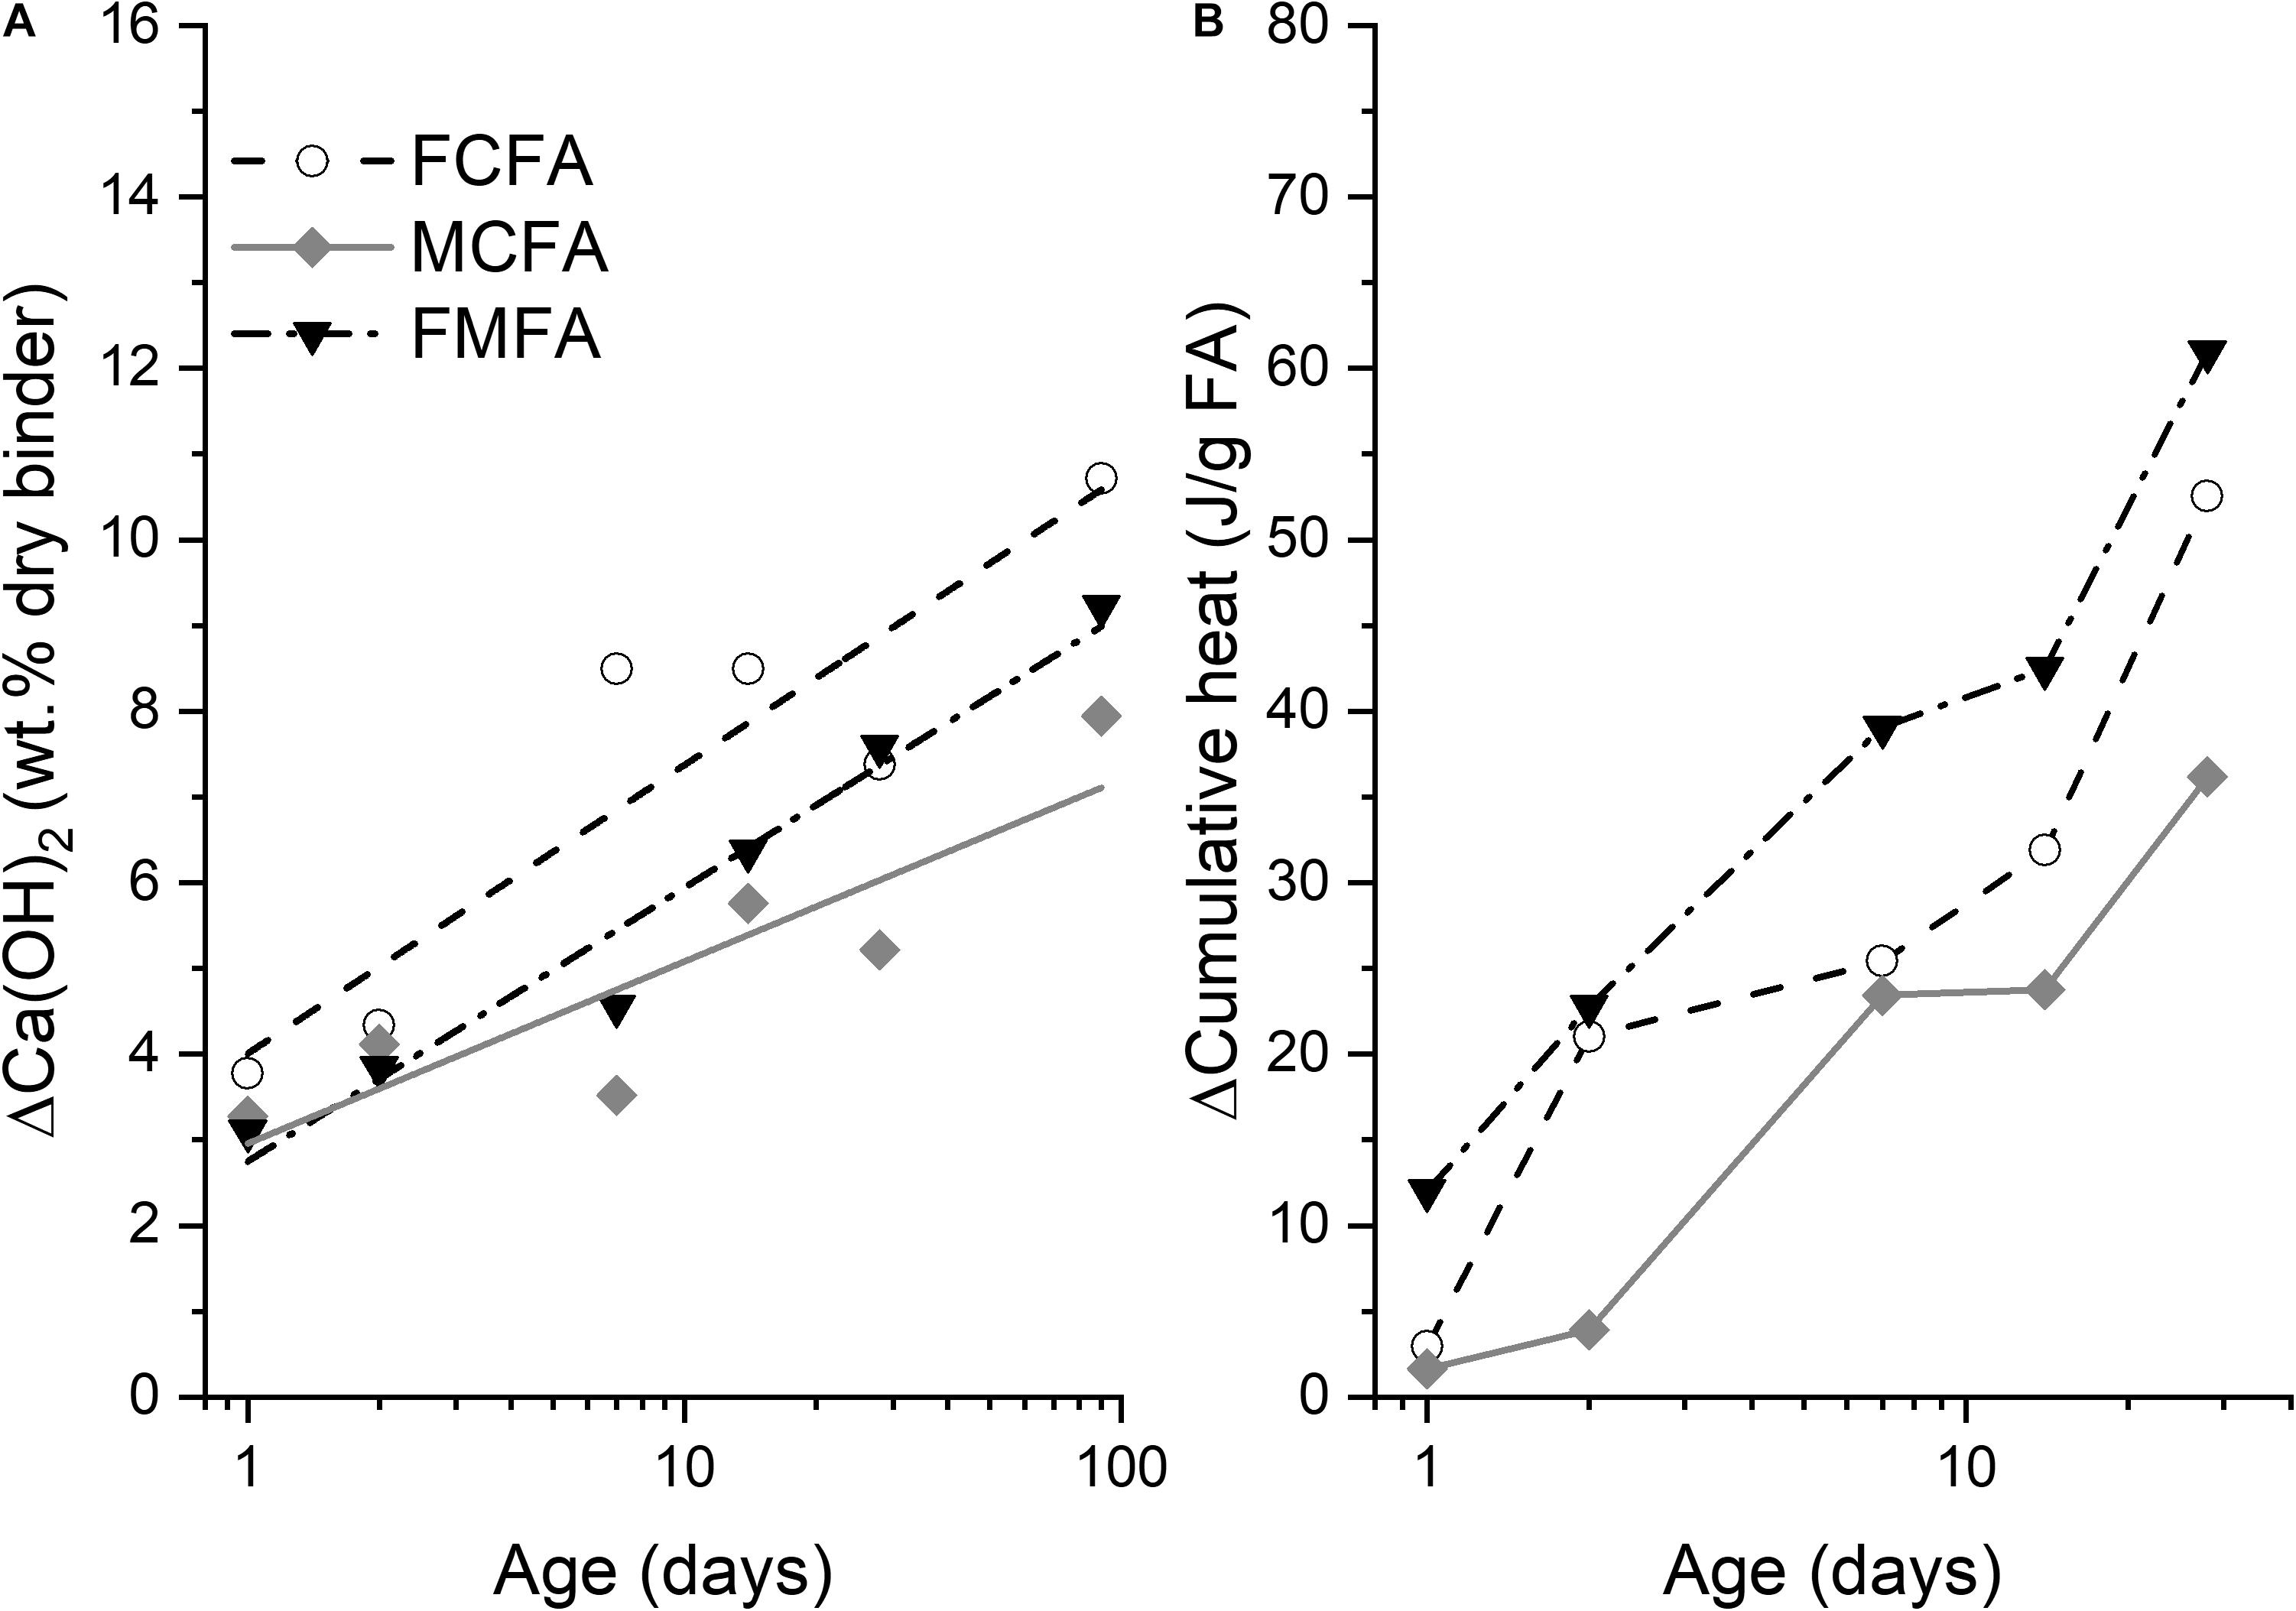
Figure 10. Indirect indicators of fly ash reactivity in blended cements. (A) Consumption of portlandite with indicative linear trendlines, (B) additional heat release for the fly ashes.
The heat release attributed to the fly ash reaction was calculated by subtracting the clinker heat release from the blended cement heat release curves. The specific Portland cement heat release (J/g) was calculated by combining the Portland cement heat release data with the degree of reaction data measured by XRD at each selected age. The resulting heat release attributed to the reaction of the fly ash is presented in Figure 10B. The fly ash reaction heat increased over time, and was by 28 days significantly higher for the fine fly ashes. The data scatter was less than for portlandite consumption, but still significant. In this case it mainly originated from the scatter on the degree of clinker reaction results measured by XRD-Rietveld.
In a next step, the fly ash portlandite consumption and heat release results are recalculated to degree of fly ash reaction estimates. The calculation results are plotted in Figure 11. For calculations based on portlandite consumption the following pozzolanic reaction of the fly ash (C0.06A0.25S) was assumed (Eq. 1):
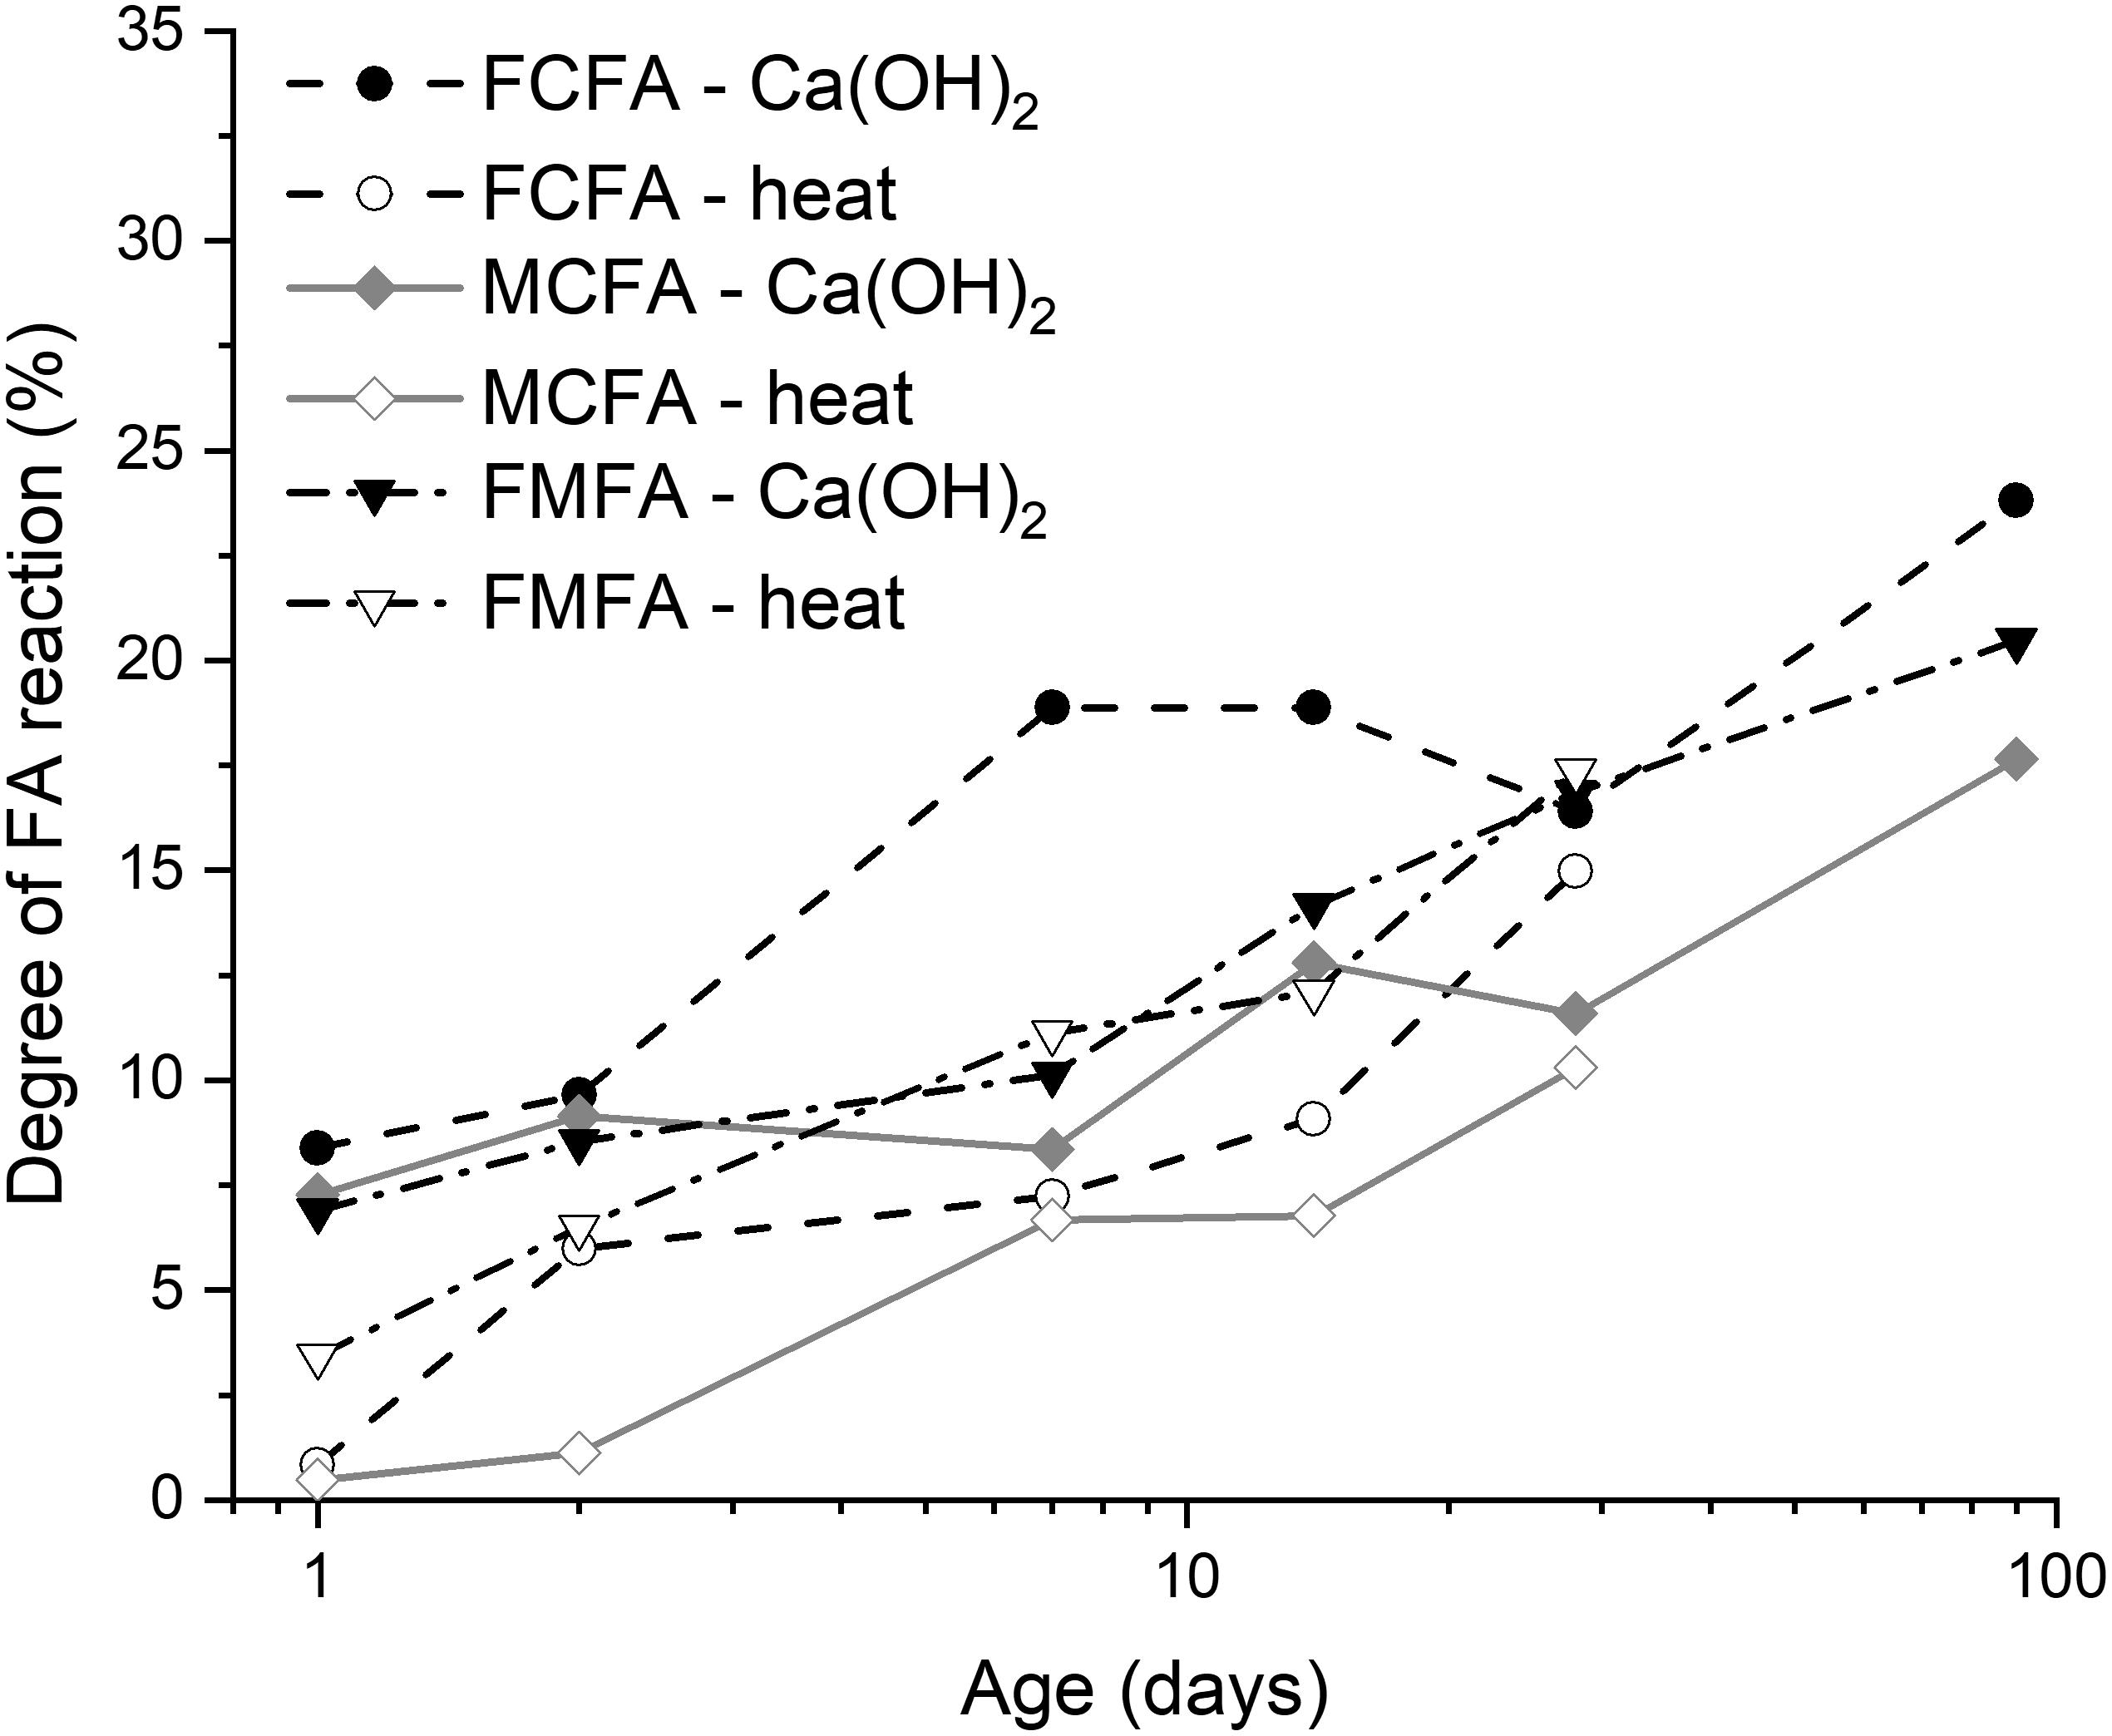
Figure 11. Estimated degree of reaction of the fly ashes (FCFA, fine classified fly ash; MCFA, medium classified fly ash; FMFA, fine milled fly ash) derived from portlandite consumption [Ca(OH)2] and heat release (heat).
In this reaction, the main unknown is the C-S-H composition. In this study the C-S-H composition for fly ash blended cements was adopted from Berodier and Scrivener (2015) where x is 1.56 and y is 0.13. The degree of reaction estimates include the inert, crystalline phases as integral part of the fly ash and are plotted in Figure 11.
For calculations based on heat release the R3 test results over time (Ht) were fitted and extrapolated by the exponential function in Eq. 2 to obtain the ultimate heat of reaction (Hult) of the fly ash:
where t represents time and β and τ are fitting constants. This expression is commonly used to fit the heat release over time of Portland cements (Poole et al., 2007). The fly ash heat release data in Figure 10B are subsequently divided by Hult to obtain the degree of reaction estimates. To enable comparison between the fly ashes and evaluate the effect of the fly ash pretreatment, one single reference Hult value of 1170 J/g was adopted in the calculations, this value was obtained from the R3 test of the fine milled fly ash. The fine milled fly ash represents the unfractionated, initial composition of the fly ash. The extrapolated results for fine classified fly ash and medium classified fly ash were 1,260 J/g and 850 J/g, respectively. These values are significantly higher than previously proposed heat of reactions for fly ash between 520 and 620 J/g from experimental measurements (Waller, 1999) or thermodynamic calculations (Snellings et al., 2019). Here, the estimation of Hult from the fitting of the R3 test results up to 7 days involves considerable uncertainty as the curve fitting is not well constrained for high degrees of reaction, and Eq. 2 may not be the optimal expression to model reaction progress at higher degrees of reaction. Subsequent work should verify the Hult values by separately measuring the fly ash degree of reaction in the R3 mixes and prolonging the time duration of the R3 measurements to reach higher degrees of reaction. In addition the validity of Eq. 2 would need to be verified for a broader set of SCMs. In the scenario considered here, the Hult value proposed by the exponential fit is withheld and the results are added to Figure 11. It should be noted that this approach ignores the impact of variations in the reaction product assemblage and stoichiometry on Hult.
The degree of reaction estimates in Figure 11 show broad correspondence, given the assumptions, between portlandite consumption and heat release derived data. There is a noted discrepancy at early ages where degree of reaction by portlandite consumption is consistently higher and appears to be biased by the assumed reaction stoichiometry. Several previous studies similarly indicated considerable uncertainty for portlandite consumption based reaction degree estimates (Scrivener et al., 2015; Durdziński et al., 2017). The data scatter on portlandite consumption was reported to the degree of reaction estimates as well. General observations, however, enable to confirm that the fine fly ashes consistently had a higher degree of reaction from 2 days of reaction onward than the medium classified fly ash.
Blended cements are often characterized by a slower build-up of compressive strength than neat Portland cement (Lothenbach et al., 2011). To a certain extent this drawback can be mitigated by a combination of reducing water to binder ratios, optimizing binder particle packing or using highly reactive SCMs (Bentz et al., 1999; Antoni et al., 2012). The use of selectively extracted or milled fine fly ashes would similarly enable to accelerate and augment the mechanical performance of low-clinker blended cements. In Figure 12 the mortar bar compressive strength results are given for the classified fly ash blended cements and two control cements. The neat Portland cement (CEM I 42.5 R) showed the highest compressive strengths at 2 and 7 days. The fly ash blended cements reached the Portland cement strength by 28 days in case of the fine classified fly ash, and by 90 days for the medium classified fly ash blended cement. The blended cement containing medium classified fly ash developed strength more slowly than the fine classified fly ash cement. The fine classified fly ash showed a continued strength development reaching 137% of the control Portland cement by 90 days, for a 30% reduction in Portland cement content. This remarkable result is partially explained by an extension of the particle packing curve to finer particle sizes, but too an even larger extent by the enhanced chemical reactivity as clearly apparent from the gradual contribution in strength development. The remarkable increase in strength at late ages is in line with the general view of the pozzolanic reaction more effectively contributing to strength development than clinker hydration by reducing the capillary porosity, rather than by lowering total binder porosity (Zajac et al., 2018). Overall the compressive strength results demonstrate a clear beneficial effect of using fine reactive fly ashes, as such even high-strength concrete may be attainable for low-clinker cements containing a well-balanced blend of high-quality SCMs.
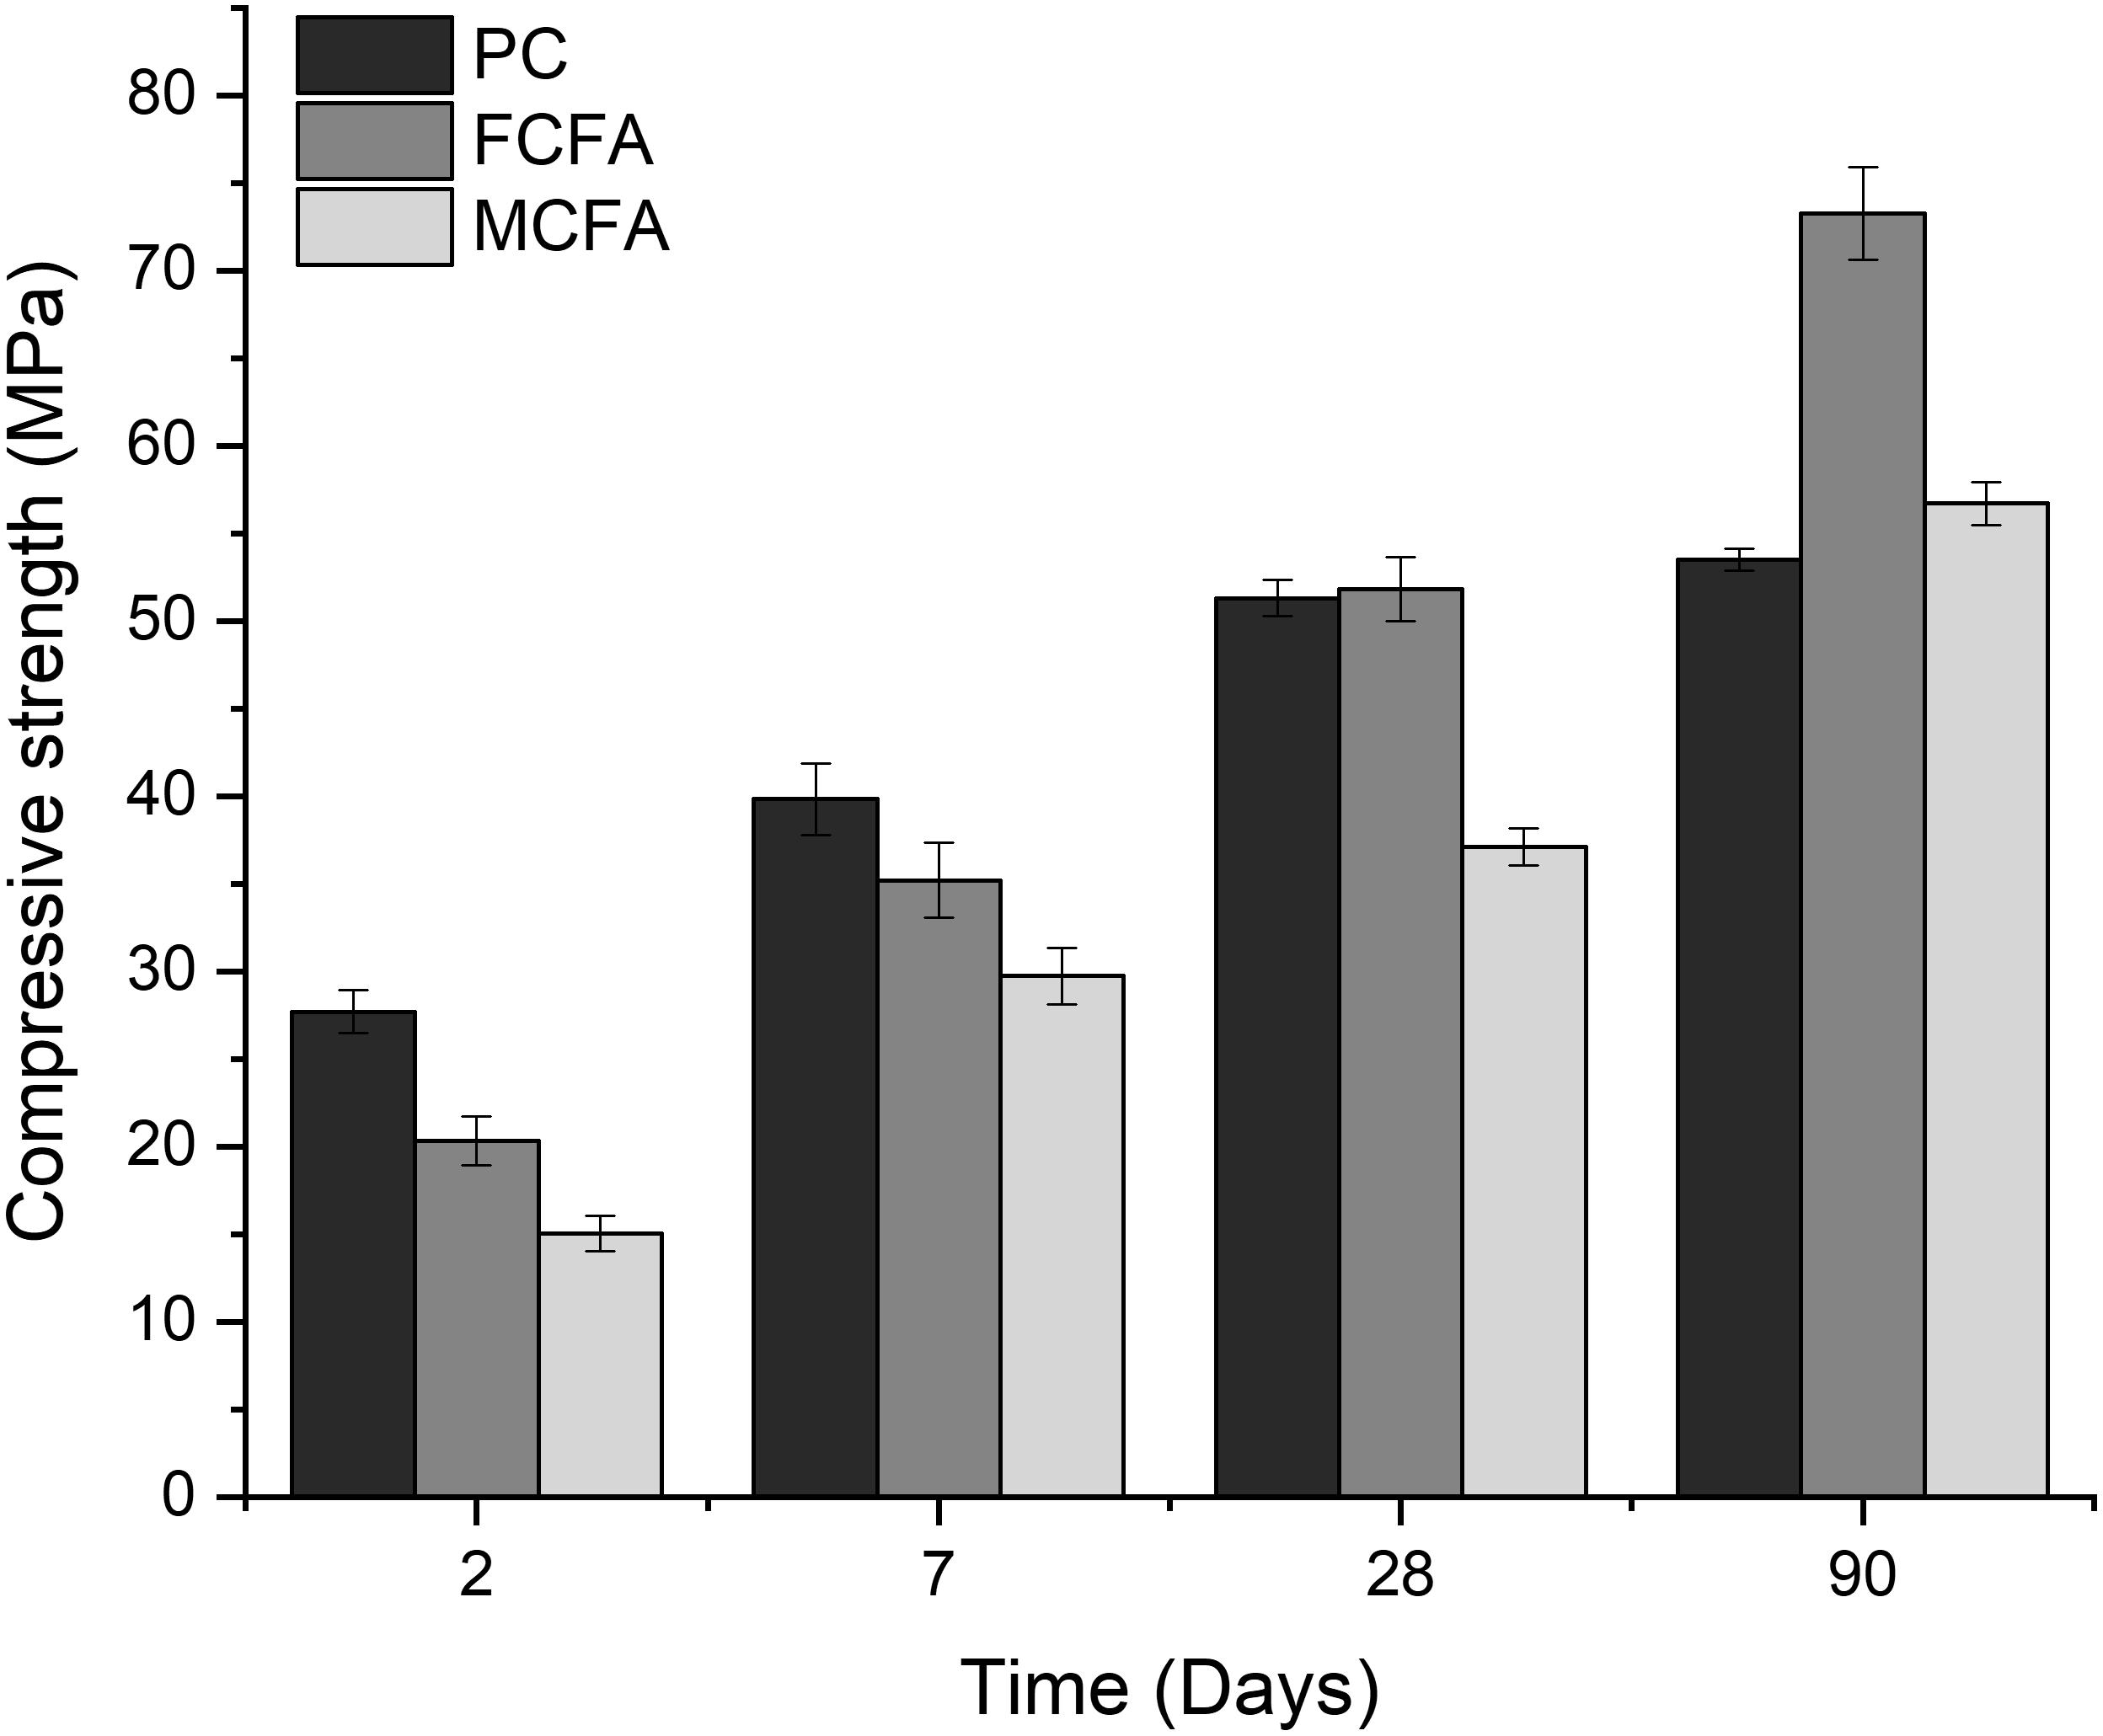
Figure 12. Compressive strength of mortar bars made with classified fly ash blended cements, and Portland cement (CEM I 42.5 R) as control.
This article investigated size classification and milling treatments as means to increase the reactivity of siliceous fly ash. The chemical reactivity of the fly ashes measured by the R3 heat release test demonstrated a predominant effect of particle size. Fine classified and milled fly ashes showed 40 to 57% higher reactivity by R3 heat release than the initial fly ash. Particle morphology and fly ash phase composition exerted secondary effects on the intrinsic reactivity. For similar particle size distributions, classified or milled fly ashes from the same parent fly ash gave similar reactivity response. Milled fly ash was slightly more reactive at short term than the classified fly ash, which can be related to the slightly broader particle size distribution and, tentatively, creation of surface defects by mechanical activation. The enhanced reactivity of the fine fly ashes resulted in modifications of the hydration kinetics and hydration product proportions in hardened blended cement pastes. Fine fly ashes had a stronger filler effect and resulted in more rapid hydration of C3S by increasing and prolonging the main hydration peak. Beyond 2 days of hydration, silica and alumina dissolved from the fly ashes reacted with portlandite forming additional C-S-H and carbo-aluminate hydrates. Portlandite consumption as well as cement hydration heat were confirmed to be higher for the fine fly ashes, however, also the medium classified fly ash demonstrated significant, albeit lower, reactivity.
Estimates of the degree of reaction of the fly ashes in the blended cements were made based on portlandite consumption and hydration heat data. The extent of the pozzolanic reaction of the fly ashes was calculated by subtracting the contribution of the clinker hydration reactions from the measured properties of the hydrated cements. Degree of reaction estimates based on portlandite consumption showed larger data scatter than those based on heat release. This is related to a propagation of random measurement errors from the individual phase quantifications. Both sets of estimates demonstrated higher reaction degrees for the fine fly ashes of 15–18% at 28 days, compared to 10–12% for medium fly ash. It is shown how the R3 test method could be used to estimate specific hydration heats for SCM, however, further verification involving degree of reaction determinations on the R3 specimens is required.
Finally, it is shown that the increased inherent reactivity of fine fly ashes is reflected in a more rapid compressive strength gain and enhanced late age strength, with a strength activity index of 137% at 90 days for blended cements where fine classified fly ash substituted 30% of the neat Portland cement.
The raw data supporting the conclusions of this article will be made available by the authors, without undue reservation.
RS: manuscript writing, data analysis, conceptualization, and funding acquisition. HK-K: manuscript review, data analysis and acquisition, and conceptualization. PN: manuscript review and funding acquisition. LV: manuscript review and project supervision. All authors contributed to the article and approved the submitted version.
The authors acknowledge funding support by the European Institute of Innovation and Technology (EIT) Raw Materials received under PA 16390 FLAME – Fly Ash to valuable MinErals.
The authors declare that the research was conducted in the absence of any commercial or financial relationships that could be construed as a potential conflict of interest.
The authors thank Willem Stuyck, Bo Peeraer, Myrjam Mertens, and Anne-Marie De Wilde for the technical assistance. Michel Loots is gratefully acknowledged for the provision of the classification equipment and the materials.
Al-Shmaisani, S., Kalina, R. D., Ferron, R. D., and Juenger, M. C. (2019). Evaluation of Beneficiated and Reclaimed Fly Ashes in Concrete. ACI Mater. J. 116, 79–87.
Antoni, M., Rossen, J., Martirena, F., and Scrivener, K. (2012). Cement substitution by a combination of metakaolin and limestone. Cement Concrete Res. 42, 1579–1589. doi: 10.1016/j.cemconres.2012.09.006
Avet, F., Li, X., and Scrivener, K. (2018). Determination of the amount of reacted metakaolin in calcined clay blends. Cement Concrete Res. 106, 40–48. doi: 10.1016/j.cemconres.2018.01.009
Avet, F., and Scrivener, K. (2018). Investigation of the calcined kaolinite content on the hydration of Limestone Calcined Clay Cement (LC3). Cement Concrete Res. 107, 124–135. doi: 10.1016/j.cemconres.2018.02.016
Avet, F., Snellings, R., Alujas Diaz, A., Ben Haha, M., and Scrivener, K. (2016). Development of a new rapid, relevant and reliable (R3) test method to evaluate the pozzolanic reactivity of calcined kaolinitic clays. Cement Concrete Res. 85, 1–11. doi: 10.1016/j.cemconres.2016.02.015
Bentz, D. P., Garboczi, E. J., Haecker, C. J., and Jensen, O. M. (1999). Effects of cement particle size distribution on performance properties of Portland cement-based materials. Cement Concrete Res. 29, 1663–1671. doi: 10.1016/s0008-8846(99)00163-5
Berodier, E., and Scrivener, K. (2014). Understanding the Filler Effect on the Nucleation and Growth of C−S−H. J. Am. Ceramic Soc. 97, 3764–3773. doi: 10.1111/jace.13177
Berodier, E., and Scrivener, K. (2015). Evolution of pore structure in blended systems. Cement Concrete Res. 73, 25–35. doi: 10.1016/j.cemconres.2015.02.025
CEMBUREAU (2016). The role of cement in the 2050 low carbon economy. Brussels: The European Cement Association.
Chindaprasirt, P., Jaturapitakkul, C., and Sinsiri, T. (2007). Effect of fly ash fineness on microstructure of blended cement paste. Construct. Build. Material. 21, 1534–1541. doi: 10.1016/j.conbuildmat.2005.12.024
Deschner, F., Winnefeld, F., Lothenbach, B., Seufert, S., Schwesig, P., Dittrich, S., et al. (2012). Hydration of Portland cement with high replacement by siliceous fly ash. Cement Concrete Res. 42, 1389–1400. doi: 10.1016/j.cemconres.2012.06.009
Diaz-Loya, I., Juenger, M., Seraj, S., and Minkara, R. (2019). Extending supplementary cementitious material resources: Reclaimed and remediated fly ash and natural pozzolans. Cement Concrete Composit. 101, 44–51. doi: 10.1016/j.cemconcomp.2017.06.011
Dong, Y., Jow, J., Su, J., and Lai, S.-Y. (2013). “Fly ash separation technology and its potential applications,” in Proceedings of the World of Coal Ash Conference. Kentucky: Ash Library.
Durdziński, P. T., Haha, M. B., Bernal, S. A., De Belie, N., Gruyaert, E., Lothenbach, B., et al. (2017). Outcomes of the RILEM round robin on degree of reaction of slag and fly ash in blended cements. Mater. Struct. 50:135.
Durdziński, P. T., Snellings, R., Dunant, C. F., Haha, M. B., and Scrivener, K. L. (2015). Fly ash as an assemblage of model Ca–Mg–Na-aluminosilicate glasses. Cement Concrete Res. 78, 263–272. doi: 10.1016/j.cemconres.2015.08.005
Favier, A., De Wolf, C., Scrivener, K., and Habert, G. (2018). A sustainable future for the European Cement and Concrete Industry: Technology assessment for full decarbonisation of the industry by 2050. Zurich: ETH Zurich.
Gutteridge, W. A., and Dalziel, J. A. (1990). Filler cement: the effect of the secondary component on the hydration of Portland cement. Part I. A fine non-hydraulic filler. Cement Concrete Res. 20, 778–782. doi: 10.1016/0008-8846(90)90011-l
Haha, M. B., De Weerdt, K., and Lothenbach, B. (2010). Quantification of the degree of reaction of fly ash. Cement Concrete Res. 40, 1620–1629. doi: 10.1016/j.cemconres.2010.07.004
Harris, D., Heidrich, C., and Feuerborn, J. (2019). “Global aspects on coal combustion products,” in altransConferences. Available online at: https://www.coaltrans.com/insights/article/global-aspects-on-coal-combustion-products.
Hemalatha, T., and Ramaswamy, A. (2017). A review on fly ash characteristics – Towards promoting high volume utilization in developing sustainable concrete. Journal of Cleaner Production 147, 546–559. doi: 10.1016/j.jclepro.2017.01.114
IEA (2018). International Energy Agency, Cement Sustainability Initiative & World Business Council for Sustainable Development: Technology Roadmap: Low-carbon Transition in the Cement Industry. Paris: IEA.
Jennings, H. M. (2000). A model for the microstructure of calcium silicate hydrate in cement paste. Cement Concrete Res. 30, 101–116. doi: 10.1016/s0008-8846(99)00209-4
Jennings, H. M. (2008). Refinements to colloid model of C-S-H in cement: CM-II. Cement Concrete Res. 38, 275–289. doi: 10.1016/j.cemconres.2007.10.006
Jones, M., McCarthy, A., and Booth, A. (2006). Characteristics of the ultrafine component of fly ash. Fuel 85, 2250–2259. doi: 10.1016/j.fuel.2006.01.028
Jow, J. (2017). “10 - Air classification,” in Coal Combustion Products (CCP’s), eds T. Robl, A. Oberlink, and R. Jones (Cambridge, CA: Woodhead Publishing), 255–275.
Juenger, M. C., Snellings, R., and Bernal, S. A. (2019). Supplementary cementitious materials: New sources, characterization, and performance insights. Cement Concrete Res. 122, 257–273. doi: 10.1016/j.cemconres.2019.05.008
Kruger, R. A. (2017). “4 - Introduction to the utilization of coal combustion products,” in Coal Combustion Products (CCP’s), eds T. Robl, A. Oberlink, and R. Jones (Cambridge, CA: Woodhead Publishing), 99–119. doi: 10.1016/b978-0-08-100945-1.00004-6
Kumar, S., Kumar, R., Alex, T., Bandopadhyay, A., and Mehrotra, S. (2007). Influence of reactivity of fly ash on geopolymerisation. Adv. Appl. Ceramics 106, 120–127. doi: 10.1179/174367607x159293
Lehne, J., and Preston, F. (2018). Making concrete change: Innovation in low-carbon cement and concrete. London, UK: Chatham House Report, Energy Enivronment and Resources Department, 1–66.
Li, X., Snellings, R., Antoni, M., Alderete, N. M., Haha, M. B., Bishnoi, S., et al. (2018). Reactivity tests for supplementary cementitious materials: RILEM TC 267-TRM phase 1. Mater. Struct. 51, 1–14.
Lothenbach, B., Durdzinski, P., and De Weerdt, K. (2016). “Thermogravimetric analysis,” in A Practical Guide to Microstructural Analysis of Cementitious Materials, eds K. L. Scrivener, R. Snellings, and B. Lothenbach (Boca Raton: CRC Press), 179–213.
Lothenbach, B., Scrivener, K., and Hooton, R. (2011). Supplementary cementitious materials. Cement Concrete Res. 41, 1244–1256.
McCarthy, M., Robl, T., and Csetenyi, L. (2017). ”Recovery, processing, and usage of wet-stored fly ash,” in Coal Combustion Products (CCP’s).Cambridge, CA: Elsevier. 343–367.
Miller, B. G. (2005). “CHAPTER 3 - The Effect of Coal Usage on Human Health and the Environment,” in Coal Energy Systems, ed. B. G. Miller (Burlington: Academic Press), 77–122. doi: 10.1016/b978-012497451-7/50003-6
Niemuth, M. D., Barcelo, L., and Weiss, J. (2012). Effect of fly ash on optimum sulfate levels measured using heat and strength at early ages. Adv. Civil Eng. Mater. 1, 1–18.
O’Connor, B. H., and Raven, M. D. (1988). Application of the Rietveld Refinement Procedure in Assaying Powdered Mixtures. Powder Diff. 3, 2–6. doi: 10.1017/s0885715600013026
Obla, K. H., Hill, R. L., Thomas, M. D. A., Shashiprakash, S. G., and Perebatova, O. (1999). Properties of concrete containing ultra-fine fly ash. ACI Mater. J. 100:8.
Poole, J. L., Riding, K. A., Folliard, K. J., Juenger, M. C., and Schindler, A. K. (2007). Methods for calculating activation energy for Portland cement. ACI Mater. J. 104, 303–311.
Scrivener, K. L., John, V. M., and Gartner, E. M. (2016). Eco-efficient cements: potential, economically viable solutions for a low-CO2, cement-based materials industry UNEP Report. Paris: United Nations Environment Programme.
Scrivener, K. L., Lothenbach, B., De Belie, N., Gruyaert, E., Skibsted, J., Snellings, R., et al. (2015). TC 238-SCM: hydration and microstructure of concrete with SCMs. Mater. Struct. 48, 835–862. doi: 10.1617/s11527-015-0527-4
Sevim, Ö, and Demir, Ý (2019). Optimization of fly ash particle size distribution for cementitious systems with high compactness. Construct. Build. Mater. 195, 104–114. doi: 10.1016/j.conbuildmat.2018.11.080
Skibsted, J., and Snellings, R. (2019). Reactivity of supplementary cementitious materials (SCMs) in cement blends. Cement Concrete Res. 124:105799. doi: 10.1016/j.cemconres.2019.105799
Snellings, R. (2016). “X-ray powder diffraction applied to cement,” in A Practical Guide to Microstructural Analysis of Cementitious Materials, eds K. L. Scrivener, R. Snellings, and B. Lothenbach (Boca Raton: CRC Press), 107–176. doi: 10.1201/b19074-5
Snellings, R., Chwast, J., Cizer, Ö, De Belie, N., Dhandapani, Y., Durdzinski, P., et al. (2018). RILEM TC-238 SCM recommendation on hydration stoppage by solvent exchange for the study of hydrate assemblages. Mater. Struct. 51:172.
Snellings, R., Kamyab, H., Joseph, S., Nielsen, P., Loots, M., and Van den Abeele, L. (2019). “Pozzolanic reactivity of size-classified siliceous fly ashes,” in Proceeding of the 2nd International Conference of Sustainable Building Materials, (The Netherlands: Eindhoven).
Snellings, R., Mertens, G., and Elsen, J. (2012). Supplementary Cementitious Materials. Rev. Mineral. Geochem. 74, 211–278. doi: 10.2138/rmg.2012.74.6
Snellings, R., and Scrivener, K. L. (2016). Rapid screening tests for supplementary cementitious materials: past and future. Mater. Struct. 49, 3265–3279. doi: 10.1617/s11527-015-0718-z
Waller, V. (1999). Relations entre composition des betons, exothermie en cours de prise et resistance en compression. France: École nationale des ponts et chaussées.
Yao, Z. T., Ji, X. S., Sarker, P. K., Tang, J. H., Ge, L. Q., Xia, M. S., et al. (2015). A comprehensive review on the applications of coal fly ash. Earth-Science Reviews 141, 105–121. doi: 10.1016/j.earscirev.2014.11.016
Zajac, M., Skocek, J., Adu-Amankwah, S., Black, L., and Haha, M. B. (2018). Impact of microstructure on the performance of composite cements: Why higher total porosity can result in higher strength. Cement Concrete Composites 90, 178–192. doi: 10.1016/j.cemconcomp.2018.03.023
Zhang, J., and Scherer, G. W. (2011). Comparison of methods for arresting hydration of cement. Cement Concrete Res. 41, 1024–1036. doi: 10.1016/j.cemconres.2011.06.003
Keywords: fly ash, cement, reactivity, supplementary cementitious material, classification, milling, upcycling, reclaimed
Citation: Snellings R, Kazemi-Kamyab H, Nielsen P and Van den Abeele L (2021) Classification and Milling Increase Fly Ash Pozzolanic Reactivity. Front. Built Environ. 7:670996. doi: 10.3389/fbuil.2021.670996
Received: 22 February 2021; Accepted: 19 March 2021;
Published: 12 April 2021.
Edited by:
Brant Walkley, The University of Sheffield, United KingdomReviewed by:
Prannoy Suraneni, University of Miami, United StatesCopyright © 2021 Snellings, Kazemi-Kamyab, Nielsen and Van den Abeele. This is an open-access article distributed under the terms of the Creative Commons Attribution License (CC BY). The use, distribution or reproduction in other forums is permitted, provided the original author(s) and the copyright owner(s) are credited and that the original publication in this journal is cited, in accordance with accepted academic practice. No use, distribution or reproduction is permitted which does not comply with these terms.
*Correspondence: Ruben Snellings, cnViZW4uc25lbGxpbmdzQHZpdG8uYmU=
Disclaimer: All claims expressed in this article are solely those of the authors and do not necessarily represent those of their affiliated organizations, or those of the publisher, the editors and the reviewers. Any product that may be evaluated in this article or claim that may be made by its manufacturer is not guaranteed or endorsed by the publisher.
Research integrity at Frontiers

Learn more about the work of our research integrity team to safeguard the quality of each article we publish.