 Tomás Sierra-Polanco1
 Lady Catherine Cantor-Cutiva
 Pasquale Bottalico
- 1Department of Speech and Hearing Science, University of Illinois Urbana-Champaign, Champaign, IL, United States
- 2Department of Collective Health, Universidad Nacional de Colombia, Bogota, Colombia
- 3Program of Speech-Language Pathology, Universidad Manuela Beltrán, Bogota, Colombia
- 4Department of Communicative Sciences and Disorders, Michigan State University, East Lansing, MI, United States
The physical production of speech level dynamic range is directly affected by the physiological features of the speaker such as vocal tract size and lung capacity; however, the regulation of these production systems is affected by the perception of the communication environment and auditory feedback. The current study examined the effects of room acoustics in an artificial setting on voice production in terms of sound pressure level and the relationship with the perceived vocal comfort and vocal control. Three independent room acoustic parameters were considered: gain (alteration of the sidetone or playback of one’s own voice), reverberation time, and background noise. An increase in the sidetone led to a decrease in vocal sound pressure levels, thus increasing vocal comfort and vocal control. This effect was consistent in the different reverberation times considered. Mid-range reverberation times (T30 ≈ 1.3 s) led to a decrease in vocal sound pressure level along with an increase in vocal comfort and vocal control, however, the effect of the reverberation time was smaller than the effect of the gain. The presence of noise amplified the aforementioned effects for the variables analyzed.
Introduction
Vocal communication involves multiple physiologic (oral and aural) and cognitive systems. From the perspective of production, the regulation of speech level is primarily affected by physiological features of the speaker such as vocal tract size, vocal fold length, and lung capacity (Riede and Brown, 2013). This production regulation is affected by perceived communication demands, such as communication partners or communication environment, sense of vocal comfort, and applied vocal effort. For example, speech level and speech style can be partner-specific such as speaking to a child (Rowe, 2008) or to someone with a perceived hearing loss (Krause and Braida, 2004). Another example was presented by Lane and Tranel (1971) where aspects of auditory feedback such as background noise, altered sidetone (amplified playback of one’s own voice), hearing loss, and room acoustics were described. The alteration in auditory feedback can modify vocal parameters, such as Sound Pressure Level (SPL), and can modify the talker’s perception of vocal comfort and vocal control (Pelegrín-García and Burnskog, 2012; Bottalico et al., 2015). These parameters may be modified by the implementation of artificial settings delivered by headphones with the goal of increasing vocal comfort and control while decreasing vocal effort in occupational voice users such as teachers and call center operators. All of these are affected by the relationship between voice production and hearing sensitivity (Hunter et al., 2006) and how the auditory system and auditory feedback play a fundamental role in voice production including the perception of effort and comfort.
Vocal effort has been defined as the perceived exertion of a vocalist to a perceived communication scenario (Hunter et al., 2020). Changes in vocal effort have been shown to be correlated with other vocal adaptations such as vowel modifications, along with changes in vocal fundamental frequency, dB SPL, spectral tilt, and speech rate (Berardi, 2015; McKenna and Stepp, 2018; Berardi, 2020). Even though vocal effort changes associate with a range of vocal production parameters, radiated speech level seems to be the primary production parameter related to vocal effort (ISO 9921, 2003) even when speech level is being controlled for (McKenna and Stepp, 2018).
Changes in vocal effort (as measured using vocal production metrics) or communication environment can affect vocal comfort. Vocal comfort can be defined as a subjective attribute that is directly correlated to the positive evaluation of the room for speech production and to the perceived support. Vocal comfort has been shown to be negatively correlated to the feeling of having to raise the voice and to the tiredness after speaking for a long time period in the room (Pelegrín-García et al., 2014; Cipriano et al., 2017). A questionnaire investigation showed that voice comfort is more closely related to the perceived noise annoyance than to the perceived room reverberance. Vocal comfort is related to all aspects that reduce vocal effort (Titze, 1999; Titze, 2000). It appears to decrease with the speaker’s perceived fatigue and the sensation of needing to increase the voice level (Pelegrín-García and Brunskog, 2012). Previous research in classroom settings showed that the vocal comfort increases with the perception of the classroom as being good to speak in and with the perceived support and enhancement, while it decreases with the perceived exhaustiveness of speaking in a classroom during a lesson and with the sensation of having to increase the voice level (Pelegrín-García and Brunskog, 2012).
The alteration in auditory feedback can also modify the perception of a communication scenario, thus affecting voice production, vocal comfort, and the perception of vocal control. Vocal control can be defined as the capacity to self-regulate vocal production, e.g., SPL, fundamental frequency, and resonance. The sensation of control relates to the ability to adjust the voice consciously. In a communication environment, in general, speakers try to control their voice production in order to increase speech intelligibility. For example, while considering a communication partner with hearing limitations, a talker (deliberately or inadvertently) uses “clear speech” (Krause and Braida, 2004; Ferguson and Kewley-Port, 2007). This type of speech has been characterized by a slower speech rate, a wider range of fundamental frequency, and a higher temporal modulation index than conversational speech (Bottalico et al., 2016a). Likewise, when talking in a noisy environment, people tend to raise the level of their voice in order to maintain understandable communication (Lombard, 1911). The maximization of intelligibility, clarity, vocal comfort and control, and the minimization of vocal effort and fatigue, should be the priority of any professional talker (Bottalico et al., 2016a).
Growing evidence suggests that there is an association between vocal production level and external auditory feedback. External auditory feedback consists of the external path between mouth and ears and is strongly influenced by the acoustics of the environment where the speaker is speaking. Such environmental effects are room noise, vocal amplification of one’s own voice, and, room reverberation.
A commonly experienced external auditory effect that directly impacts vocal production level is that of elevated room noise, or the Lombard Reflex or Effect (Lombard, 1911; Junqua, 1993). For example, Yiu and Yip (2016) recorded a monologue passage for twenty-four vocally healthy young adults (12 men and 12 women, aged 19–22 years) using an Ambulatory Phonation Monitor (APM model 3,200) under three natural environment conditions in a randomized order. These conditions were: a quiet room (clinic room, mean 35.5 dBA, ranged from 34 to 37 dBA), a room with moderate noise level (clinic corridor, mean 54.5 dBA, ranged from 53 to 56 dBA), and a room with high noise (a pantry room with a noisy exhaust fan, mean 67.5 dBA, ranged from 66 to 69 dBA). The results showed significant increases in mean voice level and self-reported vocal effort in the high-noize environment than in the other two conditions.
Vocal level was shown to be affected by the reverberation time of the room (Black, 1950), and by the level at which a speaker perceived his/her own voice, as well as the level of the background noise (Siegel and Pick, 1974). More recently, studies have added further details to these and other factors such as speaker-listener distance and acoustic characteristics of the room and/or of the communication channel (Black, 1950; Pelegrín-García et al., 2011; Bottalico et al., 2015; Bottalico et al., 2016a; Bottalico et al., 2017a; Bottalico et al., 2017b; Bottalico, 2017). Pelegrín-García et al. (2011) found that voice level decreased as reverberation time increased, while Black (1950) reported that greater vocal intensity was found in less reverberant rooms than in more reverberant rooms. This is common even in extreme reverberation conditions (Rollins et al., 2019).
Furthermore, external auditory feedback can be artificially altered by modifying the playback of one's own voice (i.e., sidetone alteration). In a study of the effect of sidetone alteration on voice levels by increasing the sidetone gain of 20 dB, Siegel and Pick (1974) found a ratio of change in the voice level of 0.15 dB/dB. This ratio increased to 0.21, 0.30, and 0.34 dB/dB when speech-spectrum noise was added during the experiment at 60, 70, and 80 dB, respectively.
Recent investigations on speech adjustments were related to an increase of external auditory feedback (Bottalico et al., 2015) and to reverberation times (Bottalico et al., 2016b). The above mentioned showed that the effect of reflective panels, placed close to the speaker, had a decrease of about 1 dB in voice level, which was observable in rooms with different reverberation times and in different speech styles.
In summary, previous research suggests that voice level, vocal comfort, and vocal control vary 1) when the gain level of external auditory feedback increases and 2) under different reverberant conditions. These variations could be also affected by the presence of noise. The perceived vocal comfort was lower in rooms with very low or very high reverberation time. Nevertheless, to better understand how speech adjusts to room acoustics, it is necessary to have control of the acoustical parameters. This can be facilitated by creating virtual acoustics scenarios.
To explore this topic, the current study examined the effects of room acoustics in a virtual setting on vocal SPL, and self-reported vocal comfort and control. Three independent room acoustic parameters were considered: gain (alteration of the sidetone), reverberation time (T30), and background noise. This relationship was stated to better understand how these independent and dependent variables relate to each other in simulated scenarios. As we have mentioned, previous studies have been performed in real scenarios, which are not malleable nor changeable, but fixed. By having simulated scenarios, this study proposes a wide range of possibilities that could be infinitely modified, in a simple way, on its initial parameters for independent variables. The main research questions of this study were based on the following statements regarding relationships between:
(1) Voice level variations and participant’s gain level of external auditory feedback (sidetone or self-amplification).
(2) Vocal comfort (and control) responses and participant’s gain level of external auditory feedback (sidetone or self-amplification).
(3) Voice level variations and different simulated T30 of rooms where participants are speaking.
(4) Vocal comfort (and control) response and different simulated T30 of rooms where participants are speaking.
(5) Finally, if there are such effects:
(5a) Voice level variations and the presence or absence of noise.
(5b) Vocal comfort (and control) and the presence or absence of noise.
Hence, the present work is aimed to provide contributions on how acoustical environments affect voice production in terms of objective measurements such as SPL, but also in terms of perceptual measurements such as self-reported vocal comfort and vocal control.
Materials and Methods
The speech of 30 talkers was recorded in fourteen different virtual acoustical scenarios of external auditory feedback, including three gain levels and three T30, each of them with and without the presence of speech-shaped noise. The participants' speech was recorded with a microphone placed at a fixed distance of 15 cm from the mouth. A preliminary calibration procedure of the microphone was performed at the beginning of the recording session per participant. The calibration level was set to 94 dB at 1 kHz. The recordings were performed in a soundproof double-walled Whisper Room (interior dimensions: 226 × 287 cm and h = 203 cm). T30 was measured for mid-frequencies to be 0.07 s in the soundproof room and background noise equal to 25 dB(A). The speech signals were processed to calculate SPL.
Participants
This study was conducted with approval from and in accordance with the policies of the Office of Protection of Research Subject at the University of Illinois at Urbana Champaign (IRB 18179). Thirty participants (17 females and 13 males) participated in this experiment. All the participants were Native American English-speaking young adults (age 19–32 years old; mean age 23 years), with self-reported normal speech and hearing, and no reported or observable upper respiratory infection on the day of the recording. In general, none of them reported hearing conditions. 26 participants reported that their primary ethnicity was “Caucasian,” two were “Asian,” and two “Hispanic-Latino.” Four of them reported being eventual smokers. Five reported voice training in the past, such as singing lessons, and four reported a history of speech or language therapy in their childhood.
Instructions and Conditions
The participants were instructed to read aloud the first 6 sentences of “The Rainbow Passage,” a standardized text in English (Fairbanks, 1960), under fourteen different virtually simulated acoustic conditions. Each task had a duration of about 27 s of reading. Before the measurements, each participant was presented with the printed passage to familiarize themselves with it.
The fourteen virtually simulated acoustic conditions were: a reference condition (no gain, no reverberation) and the result of all possible combinations of two gain levels of the external auditory feedback (+5 and +10 dB) and three different T30. The six aforementioned conditions were presented with and without speech-shaped noise added. The order of administration of the fourteen scenarios was randomized to provide an equal distribution of any (short-term) vocal discomfort across all the tasks, as well as to control for any unknown confounding variables relating to the task order.
Participants answered two questions after each task of the experiment: 1) How comfortable was it to speak in this condition? And 2) How well were you able to control your voice in this condition? These questions were worded in a manner consistent with the relevant ISO standard (ISO 28802, 2012) and administered immediately after exposure to the noise conditions in each task. Participants responded by making a vertical tick on a continuous horizontal line of 100 mm in length on a visual analog scale; this scale was provided on paper. The score was measured as the distance of the tick from the left end of the line. The extremes of the lines were ‘not at all’ (left) and ‘extremely’ (right).
Equipment
The speech material was recorded by a frequency response Class 1 microphone placed at a fixed distance of 15 cm from the mouth (M2211, NTi Audio, Tigard, OR, United States). The microphone was calibrated at the beginning of the recording session per participant using a Class 1 Sound Calibrator NTi Audio (Tigard, OR, United States) with automatic atmospheric pressure compensation (ref 94 dB ± 0.2 dB at 1 kHz ±1%). The microphone output was split into two lines: the first for direct recording and the second for creating the virtual acoustic environment. The direct digital recording sampled at 44.1 kHz was recorded using an external soundboard (UH-7000 TASCAM, Teac Corporation, Montebello, CA, United States) connected to a personal computer (PC) running Audacity 2.0.5 (SourceForge, La Jolla, CA). For the virtual environment, the direct microphone output was combined, in half of the conditions, with speech-shaped noise using a digital mixer (MultiMix 8 USB FX 8, Alesis, Cumberland, RI, United States). The voice signal was digitally processed to add reverberation using a real-time effect processor of the digital mixer and played back to the participant using open headphones (HD600, Sennheiser, Wedemark, Germany). The delay between the uttered voice and its transmission through the processing loop (i.e., Alesis digital mixer) and back to the participant’s headphones was measured to be lower than 5 ms. This value is below the range between 16 and 26 ms threshold which is considered a noticeable echo (Lezzoum et al., 2016). The disposition of the equipment is depicted in Figure 1.
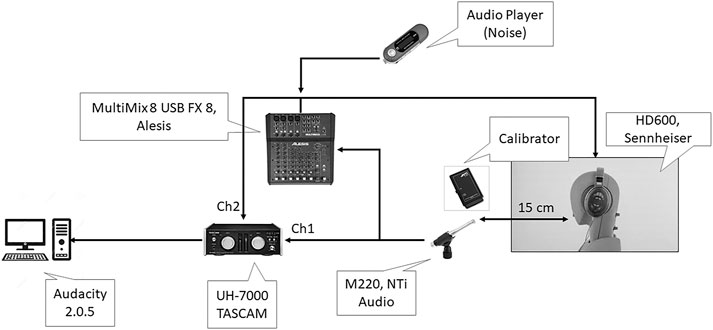
FIGURE 1. Equipment set-up for experimental measurements.
Room Acoustic Parameters
Room acoustic T30 conditions (ISO 3382-2, 2008) of the virtual scenarios were obtained from impulse responses (IRs) calculated with the convolution method. An exponential sweep signal was emitted by the mouth of a Head and Torso Simulator (HATS, GRAS 45BB KEMAR). The sweep was captured by the microphone, real-time processed, played back with open headphones, and finally recorded by the ears of the HATS. The recorded sweep was deconvolved with the emitted sweep inverted on the time axes, obtaining the IR, as exposed in the appendix by Pelegrín-García and Brunskog (2012).
The average T30 for combined 500 Hz and 1 kHz octave bands, were determined for the Whisper Room and each of the 3 simulated environments (ISO 3382-2, 2008). It was 0.07 s in Whisper Room T30 condition, 1.13 s in Low T30 condition, 1.39 s in Medium T30 condition, and 1.90 s in High T30 condition. The measured values of T30 for the Whisper Room and the three simulated conditions between 125 and 8 kHz are given in Table 1. To manipulate the level of external auditory feedback, three different gain factors were introduced in the real-time processor. These gain factors were chosen with the goal of obtaining a difference between the voice level measured at the ears in the air (with no sidetone modification) and the voice level measured at the ears position after the real-time processor, equal to 0, 5, and 10 dB.
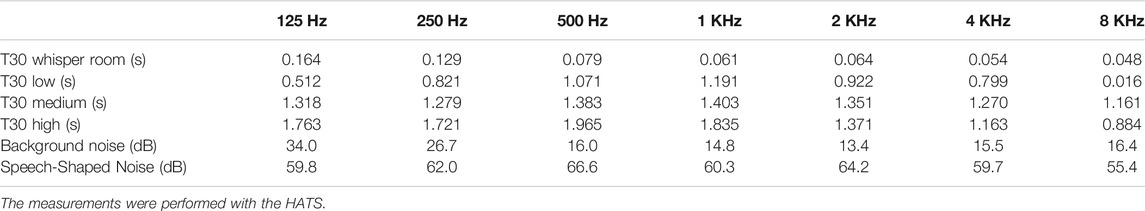
TABLE 1. T30 measured in Whisper Room conditions and 3 simulated environments (Low, Medium, and High) per octave band. Background noise conditions with and without speech-shaped noise spectrum per octave band.
In 7 out of the 14 tasks performed by each participant, speech-shaped noise was added to the real-time processor with the same power. The power level was set to obtain an A-weighted equivalent level averaging both ears of about LAeq = 70 dB(A) at the ears of the talker (measured with the HATS). This level was chosen among the one used by Siegel and Pick (1974) to stimulate the variation in the voice level with the sidetone alteration without excessive noise exposure for the participants. The values per octave band for background noise conditions, with and without speech-shaped noise, are reported in Table 1.
Voice Processing and Statistical Analysis
Analysis of the speech parameters was performed with Matlab R2017a (MathWorks, Natick, MA, United States). For each of the 14 tasks, a time history of A-weighted SPL was obtained from recorded speech. The time information associated with time histories (which typically ranged from 0 to 30 seconds within a task) was be retained for inclusion in the statistical analysis.
Statistical analysis was conducted using R Studio (version 1.2.5033). Linear Mixed-Effects (LME) models were fitted by restricted maximum likelihood (REML). Random effects terms were chosen based on variance explained. A random effect is referred to as a factor that may affect the outcome but does not have main relevance. The selection of random effects is based on taking out the variance associated with a specific factor, due to low interest in its effect. Thus, it is used as a random factor to remove variance. Models were selected based on the Akaike information criterion (Akaike, 1998; the model with the lowest value being preferred) and the results of likelihood ratio tests (a significant result indicating that the more complex of the two nested models in the comparison is preferred) and were built using lme4, lmerTest, and multcomp packages. Tukey's post-hoc pair-wize comparisons (Multiple Comparisons of Means: Tukey Contrasts) were performed to examine the differences between all levels of the fixed factors of interest. These are pair-wize z tests, where the z statistic represents the difference between an observed statistic and its hypothesized population parameter in units of the standard deviation. The p-values for these tests were adjusted using the default single-step method (Hothorn et al., 2008). The LME output includes the estimates of the fixed effects coefficients, the standard error associated with the estimate, the degrees of freedom (df), the test statistic (t), and the p-value. The Satterthwaite method is used to approximate degrees of freedom and calculate p-values.
Results
Six Linear Mixed Effects (LME) models were run, two LME for each of the three different response variables: SPL, vocal comfort, and vocal control. The first of the two sets of LME models focused on gain as a fixed effect, while the second on T30. Both of them considered the effect of noise and gender as a fixed factor. The results section is divided into two subsections: 1) effects of gain and noise on SPL, vocal comfort, and vocal control, and 2) effects of T30 and noise on SPL, vocal comfort, and vocal control. Table 2 summarizes the outcomes for the 14 conditions.
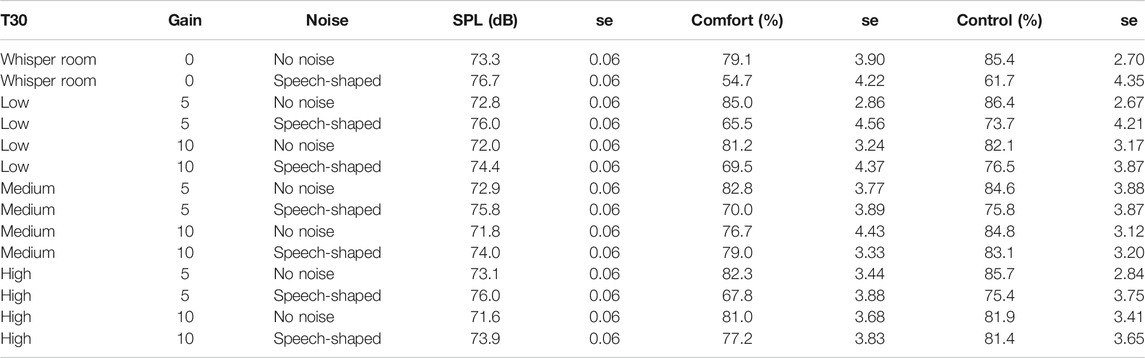
TABLE 2. Mean values and standard error (se) for the variable SPL in dB(A), perceived vocal comfort, and control in %, for the 14 conditions.
Effects of Gain
Effects of Gain and Noise on SPL
A Linear Mixed Effects (LME) model was run with the response variable SPL [in dB(A)]. This model, reported in Table 3, has the following fixed factors 1) gain, 2) noise, 3) gender, and 4) the interaction of gain and noise. The random effects were 1) T30, 2) chronological task order, 3) time (where time was measured in ms for each participant overall assessment), and 4) identification number of each participant. The reference levels used in the models were: 0 dB for gain, background without speech-shaped noise (No Noise) for noise condition, and female for gender.
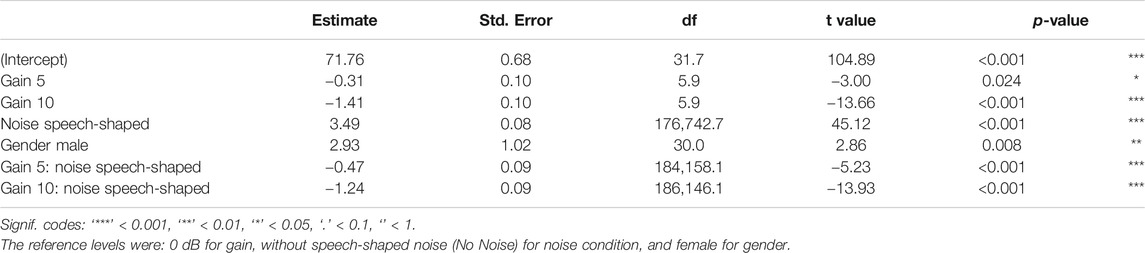
TABLE 3. LME models fit by REML for the response variable SPL and the fixed factors 1) gain, 2) noise, 3) gender, and the interaction between gain and noise.
The estimates of standard deviation for time as a random effect was 1.26 dB(A), for participant identification number was 2.78 dB(A), for order was 0.20 dB(A), and for T30 was 0.07, whereas the residual standard deviation was 6.49 dB(A). The mean variation in SPL from 0dB to 5 dB of gain for no noise added condition, was −0.31 dB(A), while it was −1.41 dB(A) from 0dB to 10 dB. As shown in Figure 2, when the speech-shaped noise is added, overall, the voice SPL increases 3.49 dB(A). When noise was added, the differences from 5 to 10 dB to the reference level (0 dB), were −0.78 and −2.65 dB(A), respectively. Since the gender was statistically significant, Figure 2 differentiate among females and males where, generically, males were louder than females by 2.93 dB(A).
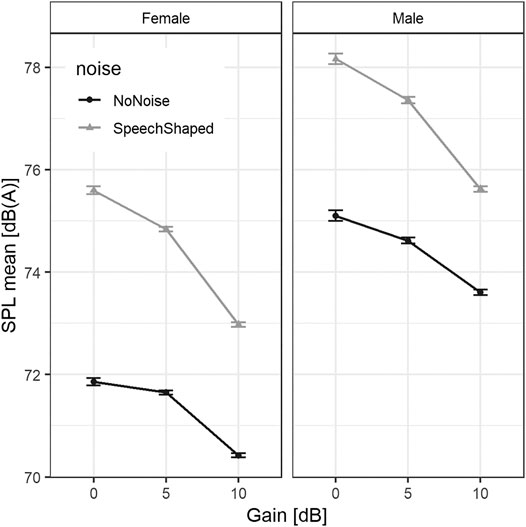
FIGURE 2. Mean SPL in dB(A) vs. room gain regarding noise conditions and gender. The error bars indicate standard error.
Post-hoc comparisons were made considering the effect of gain and its interaction with noise. These comparisons confirmed that, overall, SPL measured in 0 dB of gain condition was higher than both, that in the condition with 5 dB of gain (−0.54 dB(A), SE = 0.09, z = −5.87, p< 0.001) and in 10 dB of gain condition (−2.03 dB(A), SE = 0.09, z = −21.95, p < 0.001), whereas the difference between 5 and 10 dB gain conditions was −1.49 dB(A) (SE = 0.03, z = −46.98, p < 0.001).
Effects of Gain and Noise on Vocal Comfort
One LME model was run with the response variable self-reported vocal comfort in % (0 = ‘not at all comfortable,’ 100 = ‘extremely comfortable’) and the fixed factors 1) gain, 2) noise, 3) gender, and 4) the interaction between gain and noise. The random effects were 1) T30, 2) chronological task order, and 3) participant. The output of this model is reported in Table 4. The estimate of standard deviation for participant as a random effect was 14.58%, for order was 2.56% and for T30 was 0.00%, whereas the residual standard deviation was 14.74%. The mean increase in self-reported vocal comfort from 0 to 5 dB of gain was 3.55%, while it was 0.27% from 0 to 10 dB; in the conditions without noise added. As shown in Figure 3, the vocal comfort decreased by −25.31% when the speech-shaped noise was added. For these conditions, when the noise was added, the mean increase in self-reported vocal comfort from 0dB to 5 dB of gain was 13.43%, while it was 20.77% from 0dB to 10 dB.
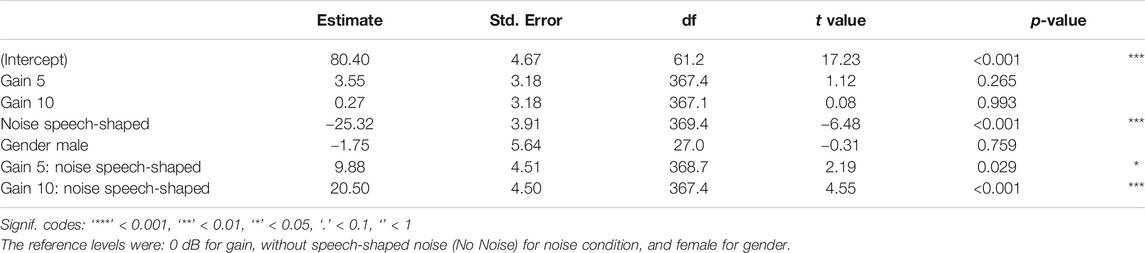
TABLE 4. LME models fit by REML for the response variable self-reported comfort and the fixed factors 1) gain, 2) noise, 3) gender, and 4) the interaction between gain and noise.
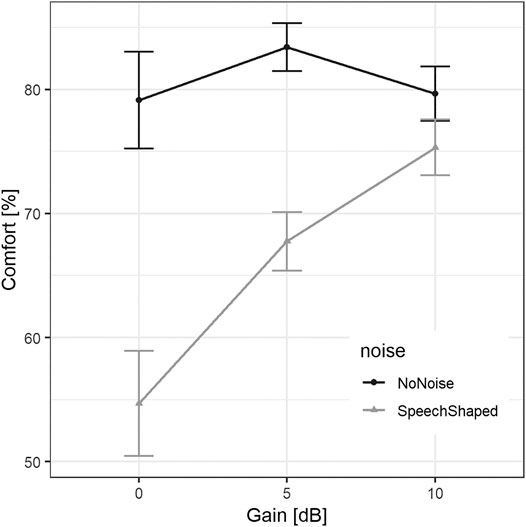
FIGURE 3. Mean self-reported vocal comfort in % (0 = ‘not at all comfortable’, 100 = ‘extremely comfortable’) across participants per gain level. The error bars indicate ± standard error.
Post-hoc comparisons confirmed that, overall, the vocal comfort measured in the condition with 0 dB of gain was lower than that in both the condition with 5 dB of gain (8.50%, SE = 2.26, z = 3.76, p < 0.001), and the condition with 10 dB of gain (10.52%, SE = 2.26, z = 4.66, p < 0.001). Furthermore, the vocal comfort reported in the condition with 10 dB of gain was 2.02% higher than that in the condition with 5 dB of gain (SE = 1.59, z = 1.27, p = 0.406).
Effects of Gain and Noise on Vocal Control
The analysis of vocal control was similar to vocal comfort. One LME model was run with the response variable self-reported vocal control in % (0 = ‘not at all controlled,’ 100 = ‘extremely controlled’) and the fixed factors 1) gain, 2) noise, 3) gender, and 4) the interaction between gain and noise. The random effects were 1) T30, 2) chronological task order, and 3) participant. The output of the model is reported in Table 5. The estimate of standard deviation for participants as a random effect was 13.47%, for order was 2.71 and 0.00% for T30, whereas the residual standard deviation was 13.20%. The mean decrease in self-reported vocal control from 0 to 5 dB of gain was 0.45%, while it was 3.01%, from 0 to 10 dB; in the conditions without noise added. As shown in Figure 4, the vocal control decreased by 24.19% when the speech-shaped noise was added. For these conditions, when the noise was added, the mean increase in self-reported vocal control from 0 to 5 dB of gain was 13.28%, while it was 18.87% from 0 to 10 dB.
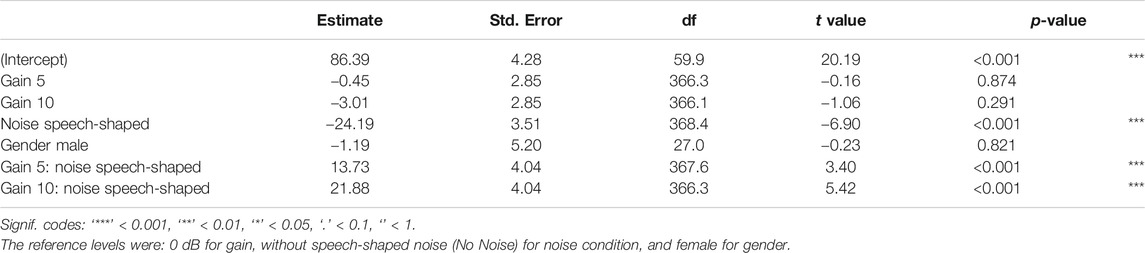
TABLE 5. LME models fit by REML for the response variable Control and the fixed factors 1) gain, 2) noise, 3) gender, 4) the interaction between gain and noise.
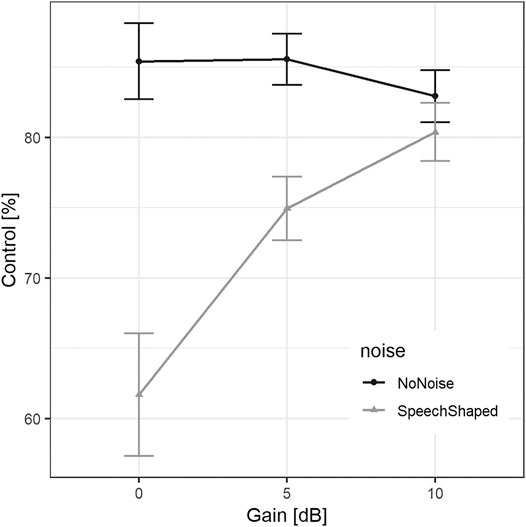
FIGURE 4. Mean self-reported vocal control in % across participants per gain level. The error bars indicate ±standard error.
Post-hoc comparisons regarding the interactions between gain and noise confirmed that, overall, the vocal control measured in the condition with 0 dB of gain was lower than that in both the conditions with 5 dB of gain (6.42%, SE = 2.03, z = 3.17, p = 0.004) and the condition with 10 dB of gain (7.93%, SE = 2.02, z = 3.92, p < 0.001). Furthermore, the vocal control reported in the condition with 10 dB of gain was 1.51% higher than that in the condition with 5 dB of gain (SE = 1.43, z = 1.06, p = 0.533).
Effects of Reverberation Time (T30)
Effects of Reverberation Time and Noise on SPL
One LME model was run with the response variable SPL (in dB(A)). This model has 1) T30, 2) noise, 3) gender, and 4) the interaction between T30 and noise as fixed factors, as reported in Table 6. The random effects were 1) gain, 2) chronological task order, 3) time (where time was measured in ms for each participant overall assessment), and 4) identification number of each participant. The reference levels used in this model were: Low T30, background without speech-shaped noise (No Noise) for noise conditions, and female for gender.
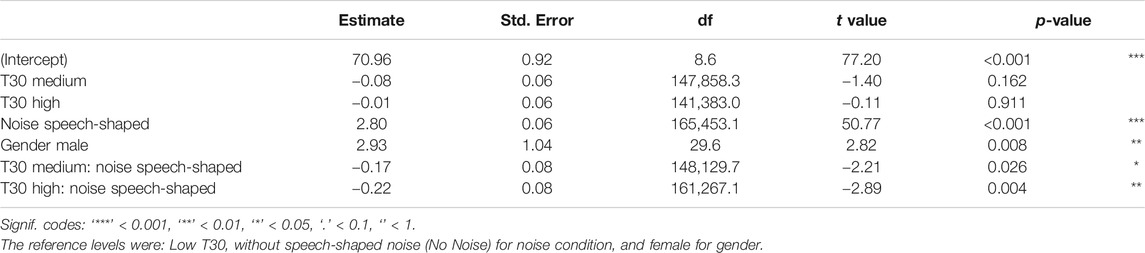
TABLE 6. LME models fit by REML for the response variable SPL and the fixed factors 1) T30, 2) noise, 3) gender, and 4) the interaction between T30 and noise.
The differences among T30 conditions were more pronounced in the noise added conditions. The estimates of standard deviation for time as a random effect was 1.25 dB(A), for participant was 2.82 dB(A), for order was 0.26 dB(A), and for gain was 0.85 dB(A), whereas the residual standard deviation was 6.43 dB(A). As shown in Figure 5, the mean variation in SPL from the Low T30 to Medium T30 was −0.08 dB(A), and a variation of −0.01 dB(A) from Low T30 to High T30, without noise added. When artificial speech-shaped noise was present, voice SPL increases 2.80 dB(A). For noise added conditions, the differences were −0.25 and −0.23 dB(A) for Low T30 vs. Medium T30 and Low T30 versus High T30, respectively. Generically, males were louder than females by 2.93 dB(A).
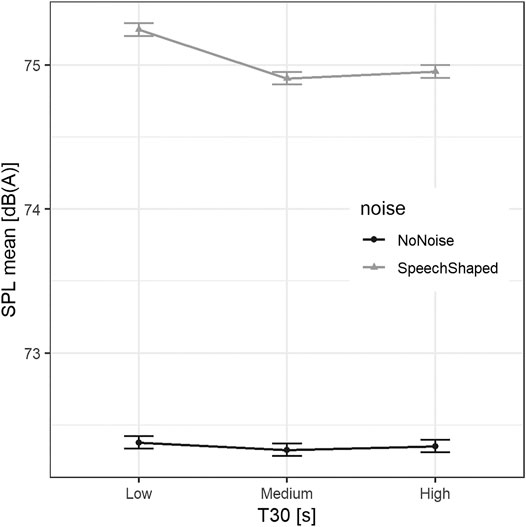
FIGURE 5. Mean SPL in dB(A) vs. T30 regarding noise conditions. The error bars indicate ± standard error.
Post-hoc comparisons including interaction between T30 and noise confirmed that, overall, SPL measured in Low T30 condition was higher than that in the condition with Medium T30 (−0.17 dB(A), SE = 0.04, z = −4.28, p < 0.001) and in the condition with High T30 (−0.12 dB(A), SE = 0.04, z = −3.01, p = 0.007), whereas the difference between the condition with Medium T30 and High T30 was 0.05 dB(A) (SE = 0.04, z = 1.22, p = 0.443).
Effect of Reverberation Time and Noise on Vocal Comfort
To analyze the effects of T30 on vocal comfort, another LME model was run with the response variable self-reported vocal comfort (in %) and the fixed factors 1) T30, 2) noise, 3) gender, and 4) the interaction between T30 and noise. The random effects were 1) gain, 2) chronological task order, and 3) participant. The output of this model is reported in Table 7. The estimate of standard deviation for participant as a random effect was 15.08%, for order was 2.66%, and for gain was 0.85%, whereas the residual standard deviation was 14.05%. The mean decrease in self-reported vocal comfort, without noise added, from Low T30 to Medium T30 was 3.47%, while it was 1.15% from Low T30 to High T30. As shown in Figure 6, when the artificial speech-shaped noise was present, the vocal comfort decreased by 16.01%. For noise added conditions, there was an increase of comfort when T30 factors were higher than Low T30, 7.67% for Medium T30, and 5.48% for High T30. Generically, males’ comfort was lower than females by 2.78%, with no statistical significance.
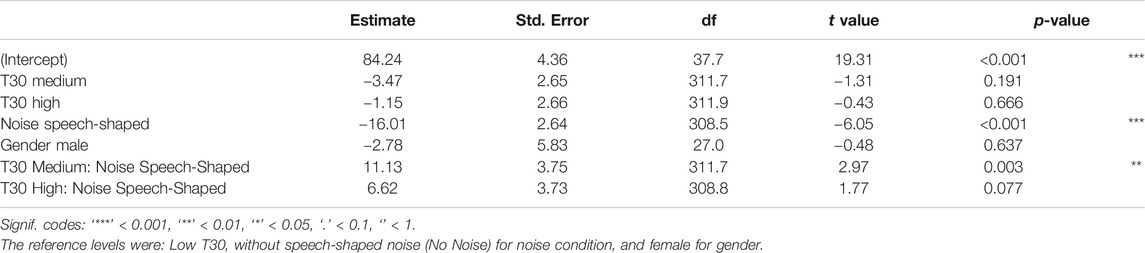
TABLE 7. LME models fit by REML for the response variable self-reported vocal comfort and the fixed factors 1) T30, 2) noise, 3) gender, and 4) the interaction between T30 and noise.
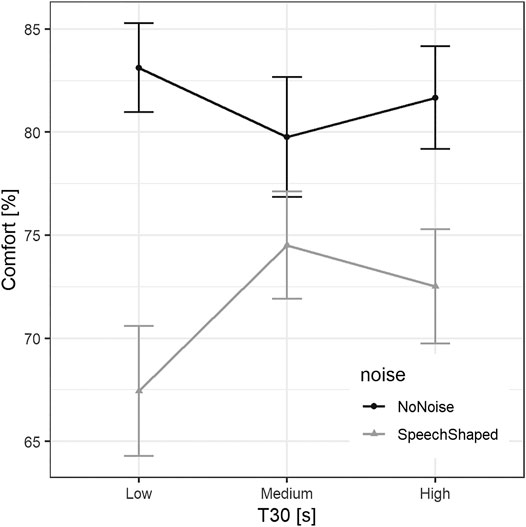
FIGURE 6. Mean self-reported vocal comfort in % (0 = ‘not at all comfortable’, 100 = ‘extremely comfortable’) across participants per T30. The error bars indicate ± standard error.
Post-hoc comparisons regarding interaction between T30 and noise confirmed that, overall, the vocal comfort measured in Low T30 condition was lower than that in Medium T30 condition (2.10%, SE = 1.86, z = 1.13, p = 0.498) and High T30 condition (2.16%, SE = 1.88, z = 1.15, p = 0.483), whereas the difference between Medium T30 and High T30 was 0.06% (SE = 1.86, z = 0.03, p = 0.999). None of these comparisons were statically significant.
Effect of Reverberation Time and Noise on Vocal Control
To analyze the effects of T30 on vocal control, a final LME model was run with the response variable self-reported vocal control in % (0 = ‘not at all controlled,’ 100 = ‘extremely controlled’) and the fixed factors 1) T30, 2) noise, 3) gender and 4) the interaction between T30 and noise. The random effects were 1) gain, 2) chronological task order, and 3) participant. The output of this model is reported in Table 8. The estimate of standard deviation for participant as a random effect was 13.83%, for order was 2.54%, and for gain was 0.00%, whereas the residual standard deviation was 12.79%. The mean decrease in self-reported vocal control, without noise added, was 0.16% from Low T30 to Medium T30, while it was 0.56% from Low T30 to High T30. As shown in Figure 7, when the artificial speech-shaped noise was present, the vocal comfort decreased by 9.17%. For noise added conditions, there was an increase of control when T30 factors were higher than Low T30, 4.37% for Medium T30, and 3.07% for High T30. Generically, males’ control was lower than females by 2.06%, with no statistical significance.
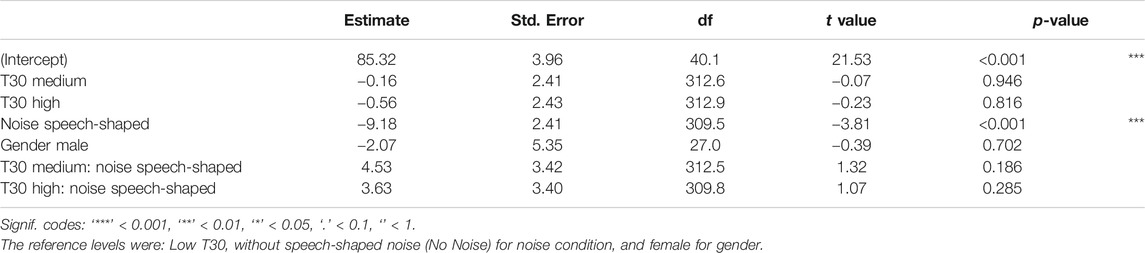
TABLE 8. LME models fit by REML for the response variable self-reported vocal control and the fixed factors 1) T30, 2) noise, 3) gender, and 4) the interaction between T30 and noise.
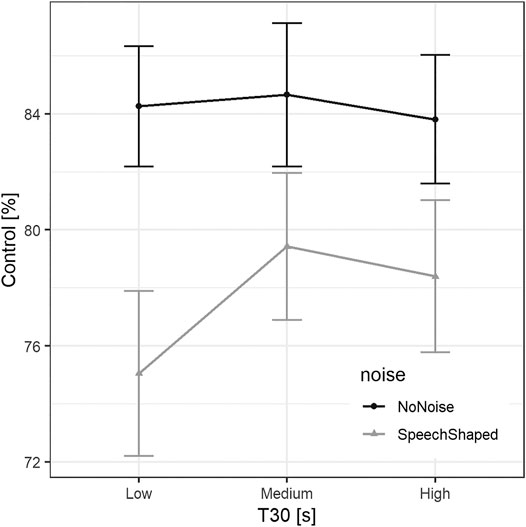
FIGURE 7. Mean self-reported vocal control in % across participants per T30. The error bars indicate ± standard error.
Post-hoc comparisons regarding interaction between T30 and noise confirmed that, overall, the vocal control measured in the condition Low T30 was lower than that in Medium T30 condition (2.10%, SE = 1.70, z = 1.24, p = 0.430) and High T30 condition (1.25%, SE = 1.71, z = 0.73, p = 0.745), whereas the control was 0.85% lower in High T30 than Medium T30 (SE = 1.69, z = −0.50, p = 0.871). None of these comparisons were statically significant.
Discussion
In this study, several acoustics scenarios have been virtually created by modifying the external gain, as well as reverberation time, and by adding speech-shaped noise on the overall external auditory feedback. The speech adjustments in terms of SPL, and self-reported vocal comfort and control were measured in the aforementioned virtual scenarios.
Effect of Noise and Gender
Overall, the mean SPL at 15 cm from the mouth was measured as 75.26 and 72.48 dB(A) for conditions with and without speech-shaped noise, respectively. The equivalent level of the speech-shaped noise was 70 dB(A), while the background noise in the whisper room was 25 dB(A) when no noise was added. The increase in SPL when artificial noise was added is consistent with the Lombard effect (Lombard, 1911), which refers to the tendency of speakers to raise their voice in order to be understood in noisy environments. As a result of adding background noise, the perceived vocal comfort and control decreased by 12.06 and 9.05%, respectively. This decrease in self-reported vocal comfort and control, when noise was added, confirmed the tendency showed by Bottalico et al. (2015) in real rooms. Bottalico et al. (2015) showed that the differences for comfort and control on normal voice production were estimated to be 11.1 and 9.4% lower when noise was added. Even if gender was a statistically significant factor in the regulation of voice SPL [i.e., males were louder than females by 2.93 dB(A)], vocal comfort and control were not statistically different between gender in the two sets of conditions with and without noise.
Effect of Gain
Regarding the effect of sidetone alteration (an alteration of the level at which a person is perceiving his/her own voice), when the gain factor was increased, participants decreased their voice SPL while reporting a higher level of vocal comfort and control. When the sidetone was increased, by 5 and 10 dB, participants showed a statistically significant decrease in their vocal SPL of 0.54 and 2.03 dB(A), respectively, confirming the results of Siegel and Pick (1974). Siegel and Pick (1974) conducted four different experiments which concluded that when the sidetone is increased by 10 dB there was a decrease of voice SPL within the range of 1.0–5.8 dB, with a mean estimate of 3.5 dB. Regarding vocal comfort and control, differences were statistically significant only in the conditions in which speech-shaped noise was added. In the different sidetone conditions related to this study, the results showed that the lowest levels of vocal comfort and control were reported in the condition without alteration of the sidetone (i.e., 0 dB of gain). Vocal comfort increased by 8.50 and 10.52%, for gain 5 and 10 dB, while control increased by 6.42 and 7.93%, for gain 5 dB and 10 dB, respectively, setting 0 dB as gain reference. This could have important implications for professional voice users. Specifically, many of these professionals who use electroacoustic systems for the playback of their own voice (like singers, broadcasters, or call center operators) may benefit from increasing the level of their monitors/headphones for an increase in the perceived vocal comfort and control and a decrease in the vocal effort. However, it is necessary to be careful not to increase the feedback level over the limit that may induce hearing loss.
Effect of Reverberation Time
According to the results presented in this study and comparing them with other studies cited in this discussion, we hypothesized that there is a trend for individuals to react differently while speaking in “middle-range” reverberation times, considering “middle-range” within the values that are explicitly cited on each study conditions. This does not pretend to concretely assess specific quantitative values or ranges of values (high or low), but a relationship within three or more different reverberation times (ordered by levels) when compared in the same experiment. Our opinion pertains to how “middle-range” reverberation times guide participants to improve their own comfort and control (along with the decrease of SPL). Nonetheless, it is important to remind that the reverberation times for this study were measured from the oral-binaural impulse response recorded by the HATS, rather than using the standardized method following the ISO 3382-2.
Following the former, these differences were 0.17 and 0.12 dB(A) lower for Medium T30 and High T30, as compared to Low T30, respectively. These results are similar to trends shown in previous studies (Bottalico and Astolfi, 2012; Puglisi et al., 2014; Durup et al., 2015; Puglisi et al., 2017), where voice SPL was presented to lower down in medium ranges of reverberation times. The medium-range conditions for reverberation times on those experiments were within 0.7 and 0.9 s, which indicate that there is a trend for higher comfort and control when reverberation conditions are in-between a range of values, i.e., by comparing higher and/or lower values of reverberation times with medium-range conditions. Whether for gain conditions the variations in SPL were substantial, the effect of variations of T30 were rather small.
The effect of reverberation time in self-reported vocal comfort had a similar trend, regarding Medium T30. Comfort was 2.10 and 2.16% higher for Medium T30 and High T30 than that from Low T30. Also, there was an increase in control for Medium T30 and High T30 of 2.10 and 1.25% higher with respect to Low T30. This might indicate a greater comfort and control for middle-range reverberation times, as opposed to Bottalico et al. (2016a) study, where an increase of comfort is shown in an anechoic and a reverberant room, as opposed to a semi-reverberant room. Bottalico et al. (2016a) reported 3.4% higher comfort for anechoic and 0.8% higher comfort for a reverberant room, both compared with the semi-reverberant room. Similar behavior was shown in that same study for control, where it was 4.5% higher for anechoic and 3.9% for reverberant than that from the semi-reverberant. It is important to point out that in Bottalico et al. (2016a), the authors presented two voice styles (normal and loud) and calculate averages among those two voice styles to give estimates on ∆SPL magnitudes. These findings could lead to a misunderstanding on self-reported vocal parameters because in the loud style, the voice intensity was higher and, consequently, the reflected sound was more intense.
More investigation is expected on this topic to build up a better understanding of how T30 is affecting (or even if it is affecting at all) voice production in a meaningful way. However, the variations in SPL suggest that lower vocal demands were experienced by talkers in Medium T30 conditions (T30 = 1.39 s).
Limitations and Future Directions
Some limitations of this study were the lack of ecological validity, i.e., the fact that laboratory conditions were virtually simulated, not realistic. Moreover, the use of standardized reading material instead of spontaneous speech avoids variations in phonation time, which may represent a limitation on evaluating self-reported vocal comfort and control. Furthermore, due to participants being American English native speakers, hinders the generalization of these results to speakers in other languages and/or in other forms of spoken English.
In the future, studies on simulated environments could have an increase in the levels of reverberation time, gain, and background noise. By broadening the range of reverberation times, gain levels, and noise conditions might show up further recommendations about acoustical conditions that would maximize voice comfort and control while minimizing SPL and voice effort. Finally, it is important to point out that adding other acoustical objective measurements would be useful for better understanding the variations on voice comfort and control, such as speed rate of speech and frequency of utterances, which are directly related to the movement of the vocal folds, thus with voice effort and fatigue.
Conclusion
The aim of this study was to evaluate the effect of external auditory feedback, such as reverberation time, altered sidetone (i.e., gain level), and background noise. The external auditory feedback was modified by changing the sidetone with three levels of gain (0, 5, and 10 dB), these changes showed that an increase in the sidetone led to a decrease of SPL and an increase in self-perception of voice comfort and control. This information is important because it can guide vocal health promotion actions helping to decrease the occurrence of voice disorders and improve speakers´ voice-related quality of life. For instance, among occupational voice users, such as teachers and call center operators, considering their high risk of developing voice disorders associated with their working conditions (Pelegrín-García and Brunskog, 2012; Cantor-Cutiva et al., 2013; Bottalico et al., 2015; Bottalico et al., 2016a; Cantor-Cutiva and Burdorf, 2016; Bottalico et al., 2017a; Banks et al., 2017; Cipriano et al., 2017; Cantor-Cutiva et al., 2019; Carrillo-Gonzalez et al., 2019), it is determinant to identify specific elements that can help to improve “healthy” occupational voice use. Therefore, knowing that sidetone may help to decrease SPL and increase self-perceived voice comfort and control, speech and language pathologists at the workplaces may train occupational voice users using sidetone to strengthen voice comfort and control and reduce occupational voice misuse.
In addition, results on Medium T30 being associated with the highest voice comfort and control (along with lowest SPL), when speech-shaped noise was added are also interesting. At the workplaces, professionals from Safe and Health at Work may consider these results for designing “safe” workplaces (classrooms, call center rooms, schools) for “healthy” occupational voice use. In this way, the intervention actions would start in the environment and not in the workers, which is suggested in the hierarchy of controls (Castro, 2003).
Finally, all the experiments conducted in this study were based on simulated acoustical environments, which represents a great step forward in the development of alternative techniques to performs research on voice production and sound propagation.
Data Availability Statement
The datasets presented in this article are not readily available because the database consists of speech recordings, which are considered identifiable data. Requests to access the datasets should be directed to Pasquale Bottalico, cGI4MUBpbGxpbm9pcy5lZHU=.
Ethics Statement
The studies involving human participants were reviewed and approved by Office of Protection of Research Subject at the University of Illinois at Urbana Champaign (IRB 18179). The patients/participants provided their written informed consent to participate in this study.
Author Contributions
PB conceived and designed the study. TS and PB performed the experiments and analyze the data. TS and PB wrote the paper. EH and LC-C participate in revising the paper.
Conflict of Interest
The authors declare that the research was conducted in the absence of any commercial or financial relationships that could be construed as a potential conflict of interest.
References
Akaike, H. (1998). “Information Theory and an Extension of the Maximum Likelihood Principle,” in Selected Papers of Hirotugu Akaike (New York, NY: Springer), 199–213. doi:10.1007/978-1-4612-1694-0_15
Banks, R. E., Bottalico, P., and Hunter, E. J. (2017). The Effect of Classroom Capacity on Vocal Fatigue as Quantified by the Vocal Fatigue Index. Folia Phoniatr Logop 69 (3), 85–93. doi:10.1159/000484558
Berardi, M. L. (2015). Quantification of Vocal Effort in Varying Acoustical Environments [Honors]. Provo, UT: Brigham Young University.
Berardi, M. L. (2020). Validation and Application of Experimental Framework for the Study of Vocal Fatigue. [Doctoral dissertation]. [East Lansing, MI]: Michigan State University. doi:10.25335/epf5-c186
Black, J. W. (1950). The Effect of Room Characteristics upon Vocal Intensity and Rate. The J. Acoust. Soc. Am. 22 (2), 174–176. doi:10.1121/1.1906585
Bottalico, P., Astolfi, A., and Hunter, E. J. (2017a). Teachers' Voicing and Silence Periods during Continuous Speech in Classrooms with Different Reverberation Times. J. Acoust. Soc. Am. 141 (1), EL26–EL31. doi:10.1121/1.4973312
Bottalico, P., and Astolfi, A. (2012). Investigations into Vocal Doses and Parameters Pertaining to Primary School Teachers in Classrooms. J. Acoust. Soc. America 131 (4), 2817–2827. doi:10.1121/1.3689549
Bottalico, P., Graetzer, S., and Hunter, E. (2016b). Effect of Reverberation Time on Vocal Fatigue. Proc. Int. Conf. Speech Prosody 2016, 494–497. doi:10.21437/SpeechProsody.2016-101
Bottalico, P., Graetzer, S., and Hunter, E. J. (2016a). Effects of Speech Style, Room Acoustics, and Vocal Fatigue on Vocal Effort. J. Acoust. Soc. America 139 (5), 2870–2879. doi:10.1121/1.4950812
Bottalico, P., Graetzer, S., and Hunter, E. J. (2015). Effects of Voice Style, Noise Level, and Acoustic Feedback on Objective and Subjective Voice Evaluations. J. Acoust. Soc. Am. 138 (6), EL498–EL503. doi:10.1121/1.4936643
Bottalico, P., Passione, I. I., Graetzer, S., and Hunter, E. (2017b). Evaluation of the Starting Point of the Lombard Effect. Acta Acustica United Acustica 103 (1), 169–172. doi:10.3813/AAA.919043
Bottalico, P. (2017). Speech Adjustments for Room Acoustics and Their Effects on Vocal Effort. J. Voice 31 (3), e1–392. doi:10.1016/j.jvoice.2016.10.001
Cantor Cutiva, L. C., Vogel, I., and Burdorf, A. (2013). Voice Disorders in Teachers and Their Associations with Work-Related Factors: a Systematic Review. J. Commun. Disord. 46 (2), 143–155. doi:10.1016/j.jcomdis.2013.01.001
Cantor-Cutiva, L. C., Bottalico, P., and Hunter, E. (2019). Work-related Communicative Profile of Radio Broadcasters: a Case Study. Logopedics Phoniatrics Vocol. 44 (4), 178–191. doi:10.1080/14015439.2018.1504983
Carrillo-Gonzalez, A., Camargo-Mendoza, M., and Cantor-Cutiva, L. C. (2019). Relationship between Sleep Quality and Stress with Voice Functioning Among College Professors: a Systematic Review and Meta-Analysis. J. Voice 13, 141. doi:10.1016/j.jvoice.2019.11.001
Castro, A. B. (2003). ‘Hierarchy of Controls’: Providing a Framework for Addressing Workplace Hazards. AJN Am. J. Nurs. 103 (12), 104. doi:10.1097/00000446-200312000-00030
Cipriano, M., Astolfi, A., and Pelegrín-García, D. (2017). Combined Effect of Noise and Room Acoustics on Vocal Effort in Simulated Classrooms. J. Acoust. Soc. America 141 (1), EL51–EL56. doi:10.1121/1.4973849
Cutiva, L. C. C., and Burdorf, A. (2016). Work-related Determinants of Voice Complaints Among School Workers: An Eleven-Month Follow-Up Study. Am. J. Speech Lang. Pathol. 25 (4), 590–597. doi:10.1044/2016_AJSLP-14-0191
Durup, N., Shield, B., Dance, S., and Sullivan, R. (2015). An Investigation into Relationships between Classroom Acoustic Measurements and Voice Parameters of Teachers. Building Acoust. 22 (3-4), 225–241. doi:10.1260/1351-010X.22.3-4.225
Fairbanks, G. (1960). “The Rainbow Passage,” in Voice and Articulation Drillbook. 2nd Edition. New York: Harper & Row, 124–139.
Ferguson, S. H., and Kewley-Port, D. (2007). Talker Differences in Clear and Conversational Speech: Acoustic Characteristics of Vowels. J. Speech Lang. Hear. Res. 50 (5), 1241–1255. doi:10.1044/1092-4388(2007/087
Hothorn, T., Bretz, F., and Westfall, P. (2008). Simultaneous Inference in General Parametric Models. Biom. J. 50 (3), 346–363. doi:10.1002/bimj.200810425
Hunter, E. J., Cantor-Cutiva, L. C., Van Leer, E., Van Mersbergen, M., Nanjundeswaran, C. D., Bottalico, P., et al. (2020). Toward a Consensus Description of Vocal Effort, Vocal Load, Vocal Loading, and Vocal Fatigue. J. Speech Lang. Hear. Res. 63 (2), 509–532. doi:10.1044/2019_JSLHR-19-00057
Hunter, E. J., Švec, J. G., and Titze, I. R. (2006). Comparison of the Produced and Perceived Voice Range Profiles in Untrained and Trained Classical Singers. J. Voice 20 (4), 513–526. doi:10.1016/j.jvoice.2005.08.009
ISO 28802 (2012). Ergonomics of the Physical Environment—Assessment of Environments by Means of an Environmental Survey Involving Physical Measurements of the Environment and Subjective Responses of People. Geneva: International Organization for Standardization.
ISO 3382-2 (2008). Acoustics - Measurement of Room Acoustic Parameters—Part 2: Reverberation Time in Ordinary Rooms. Geneva: International Organization for Standardization.
ISO 9921 (2003). Ergonomics - Assessment of Speech Communication. Geneva: International Organization for Standardization.
Junqua, J. C. (1993). The Lombard Reflex and its Role on Human Listeners and Automatic Speech Recognizers. J. Acoust. Soc. Am. 93 (1), 510–524. doi:10.1121/1.405631
Krause, J. C., and Braida, L. D. (2004). Acoustic Properties of Naturally Produced Clear Speech at Normal Speaking Rates. J. Acoust. Soc. America 115 (1), 362–378. doi:10.1121/1.1635842
Lane, H., and Tranel, B. (1971). The Lombard Sign and the Role of Hearing in Speech. J. Speech Hearing Res. 14 (4), 677–709. doi:10.1044/jshr.1404.677
Lezzoum, N., Gagnon, G., and Voix, J. (2016). Echo Threshold between Passive and Electro-Acoustic Transmission Paths in Digital Hearing Protection Devices. Int. J. Ind. Ergon. 53, 372–379. doi:10.1016/j.ergon.2016.04.004
Lombard, E. (1911). “Le signe de l'elevation de la voix,” [The sign of voice rise] in. Ann. des Maladies de L'Oreille du Larynx 37 (2), 101–119.
McKenna, V. S., and Stepp, C. E. (2018). The Relationship between Acoustical and Perceptual Measures of Vocal Effort. J. Acoust. Soc. America 144 (3), 1643–1658. doi:10.1121/1.5055234
Pelegrín-García, D., Brunskog, J., and Rasmussen, B. (2014). Speaker-oriented Classroom Acoustics Design Guidelines in the Context of Current Regulations in European Countries. Acta Acustica united with Acustica 100 (6), 1073–1089. doi:10.3813/AAA.918787
Pelegrín-García, D., and Brunskog, J. (2012). Speakers' Comfort and Voice Level Variation in Classrooms: Laboratory Research. J. Acoust. Soc. America 132 (1), 249–260. doi:10.1121/1.4728212
Pelegrín-García, D., Smits, B., Brunskog, J., and Jeong, C.-H. (2011). Vocal Effort with Changing Talker-To-Listener Distance in Different Acoustic Environments. J. Acoust. Soc. America 129 (4), 1981–1990. doi:10.1121/1.3552881
Puglisi, G. E., Astolfi, A., Cantor Cutiva, L. C., and Carullo, A. (2017). Four-day-follow-up Study on the Voice Monitoring of Primary School Teachers: Relationships with Conversational Task and Classroom Acoustics. J. Acoust. Soc. Am. 141 (1), 441–452. doi:10.1121/1.4973805
Puglisi, G. E., Astolfi, A., Pavese, L., and Carullo, A. (2014). Long-term Vocal Parameters in Semi-anechoic and Reverberant Rooms. Forum Acusticum 14, 7–12. doi:10.3403/30218742
Riede, T., and Brown, C. (2013). Body Size, Vocal Fold Length, and Fundamental Frequency–Implications for Mammal Vocal Communication. Nova Acta Leopoldina NF 111 (380), 1–20. doi:10.1007/3-540-32504-2_10
Rollins, M. K., Leishman, T. W., Whiting, J. K., Hunter, E. J., and Eggett, D. L. (2019). Effects of Added Absorption on the Vocal Exertions of Talkers in a Reverberant Room. J. Acoust. Soc. Am. 145 (2), 775–783. doi:10.1121/1.5089891
Rowe, M. L. (2008). Child-directed Speech: Relation to Socioeconomic Status, Knowledge of Child Development and Child Vocabulary Skill. J. Child. Lang. 35 (1), 185–205. doi:10.1017/S0305000907008343
Siegel, G. M., and Pick, H. L. (1974). Auditory Feedback in the Regulation of Voice. J. Acoust. Soc. Am. 56 (5), 1618–1624. doi:10.1121/1.1903486
Titze, I. R. (2000). Principles of Voice Production (Second Printing). Iowa City, IA: National Center for Voice and Speech, 361–366.
Titze, I. R. (1999). Toward Occupational Safety Criteria for Vocalization. Logopedics Phoniatrics Vocol. 24, 49–54. doi:10.1080/140154399435110
Keywords: room acoustics, gain, background noise, reverberation time, speech level, vocal comfort, vocal control
Citation: Sierra-Polanco T, Cantor-Cutiva LC, Hunter EJ and Bottalico P (2021) Changes of Voice Production in Artificial Acoustic Environments. Front. Built Environ. 7:666152. doi: 10.3389/fbuil.2021.666152
Received: 09 February 2021; Accepted: 20 April 2021;
Published: 18 May 2021.
Edited by:
Nicola Prodi, University of Ferrara, ItalyReviewed by:
Davide Borelli, University of Genoa, ItalyCostantino Carlo Mastino, University of Cagliari, Italy
Copyright © 2021 Sierra-Polanco, Cantor-Cutiva, Hunter and Bottalico. This is an open-access article distributed under the terms of the Creative Commons Attribution License (CC BY). The use, distribution or reproduction in other forums is permitted, provided the original author(s) and the copyright owner(s) are credited and that the original publication in this journal is cited, in accordance with accepted academic practice. No use, distribution or reproduction is permitted which does not comply with these terms.
*Correspondence: Pasquale Bottalico, cGI4MUBpbGxpbm9pcy5lZHU=