- Department of Structures for Engineering and Architecture, University of Naples Federico II, Naples, Italy
The lessons learned after recent earthquakes have highlighted the key role played by infills and services in damage and loss of Reinforced Concrete (RC) buildings. Their influence in seismic performance and loss estimation of selected RC building case studies is thoroughly analyzed here. The case study selection aims to be representative of existing buildings built in Italy before 1970, and covers a different number of stories and design typologies. The seismic responses of the case-study buildings are numerically analyzed by means of non-linear static pushover analysis (PO) considering a lumped plasticity approach with a quadri-linear flexural response for beam/column elements (properly calibrated for RC elements reinforced with plain bars) and a tri-linear compressive-only axial response with diagonal concentric struts for infill panels (empirically derived from experimental data on hollow clay masonry walls). Economic loss estimation is carried out via a component-based methodology that relies on the main repairing activities and resultant costs required for the refurbishment of infills and services for different damage levels. Accordingly, a damage analysis is performed herein, given the intensity measure, based on a comparison between Interstory drift demand from PO analysis and drift-based fragility functions specific for masonry infills. Loss curves, relating the total building repair cost to peak ground acceleration (PGA), are presented and compared for the analyzed case study buildings to show their trends and quantify the incidence of infills and services with respect to the reconstruction cost. A comparison between these outcomes and those recently found in the literature emphasizes the robustness of the considered approach and the reliability of the hypotheses about damage and loss assessment.
Introduction
Residential reinforced concrete (RC) buildings in Italy and in the Mediterranean area are often characterized by masonry infill panels used as enclosure or partition elements. It is widely recognized in the literature that infill panels strictly interact with the surrounding RC frame, affecting its lateral strength and stiffness and energy dissipation capacity (e.g., Ricci et al., 2013; Asteris et al., 2015; Morandi et al., 2018; among many others).
Infills should therefore be properly considered in numerical analyses of RC buildings for a reliable assessment of their seismic performance for both low and medium/high seismic intensity. As a matter of fact, even at low seismic intensity measures, damage to infills and partitions can be severe, thus significantly affecting seismic losses, as highlighted in recent earthquakes (e.g., L’Aquila earthquake in 2009; see Dolce and Goretti, 2015). Such an aspect has only recently been investigated by the research community (Del Vecchio et al., 2019; De Risi et al., 2019). Nonetheless, most of the scientific works focusing on seismic loss estimation do not account for the contribution of infills (despite their widespread use in typical residential RC buildings) and services (like plumbing or electrical system), the latter generally enclosed within infill panels (or strictly interacting with them) for this building typology. In fact, the main approaches for loss estimation developed in Italy since the end of the 80s (Guagenti et al., 1988; Yang et al., 1989; Colonna et al., 1994; Bramerini et al., 1995; Di Pasquale and Orsini, 1998; Di Pasquale et al., 2005) make use of the empirical Damage Probability Matrix (DPMs), discarding the contribution of infills on damage estimation of RC buildings, to account for expected annual loss through the use of suitable damage factor (DF) coefficients. Only recently, Dolce et al. (2019) develop seismic risk maps for Italy, taking advantage of the use of fragility curves for RC buildings (Rosti et al., 2020) and also explicitly accounting for infill contribution in damage evaluation.
Certainly, the topic deserves further analysis that is aimed at including repair costs due to infills and services within a reliable loss estimation. Indeed, a new generation of methods has been developed recently by analytically estimating seismic losses from the explicit modeling of the behavior and resultant damage of structural and non-structural sub-assemblages in RC buildings (Applied Technology Council [ATC], 2012a, b; O’Reilly and Sullivan, 2018; Del Vecchio et al., 2018; Rossi et al., 2019; Cardone et al., 2020; Landi et al., 2020; Di Trapani et al., 2020).
In this research work, four RC building case studies have been selected and analyzed. They were designed according to obsolete technical codes, as is typical in the existing Mediterranean building stock, for gravity loads only (GLD) or according to the obsolete seismic codes (OSLD) in force in Italy until the beginning of 1970. Infills are explicitly modeled to numerically reproduce the displacement demand of each panel by means of an empirical non-linear model based on collected experimental data (De Risi et al., 2018). Interstory drift ratios (IDRs) are predicted for each panel by means of non-linear static analyses. Drift-based fragility functions, specific for masonry infills (Del Gaudio et al., 2019), are then used to obtain the damage state of each panel and, consequently, the economic losses due to their repairing. Such hypotheses about infill modeling and damage assessment have been used herein since these proposals from the literature have been calibrated/validated based on a wide dataset of experimental data related to the tests performed on the most common infill typologies, including the typology dealt with in this work, i.e., hollow clay bricks and mortar, as is in widespread use in the Italian and Mediterranean region (Bal et al., 2007). Note that damage to infills due to in-plane actions only has been considered in this study, neglecting any possible out-of-plane collapse of the panels. Such an aspect could be considered thanks to recent modeling proposals (e.g., Hashemi and Mosalam, 2007; Ricci et al., 2019a; Pradhan and Cavaleri, 2020), but this is beyond the scope of the present work.
Then, a detailed and careful analysis of all the repair actions, required for the refurbishment of infills and services and relevant costs for different damage levels, allows clearly determining the total repair cost as a function of the ground shaking. This aspect represents one of the main novelties of this research work. In fact, this direct and explicit approach, by means of a component-based methodology, allows us to de-aggregate the contribution of each story to the global repair cost, leading to the definition of straightforward pre-derived story relationships between the structural response and loss, as those reported in Aslani and Miranda (2005), which can be used within losses estimation to strongly reduce the computational burden required for its derivation. Finally, the relationship between the total building repair cost and the demand intensity measure, i.e., Peak Ground Acceleration (PGA), herein derived are compared among the analyzed case study buildings to exhibit their trends and quantify the incidence of infills and services with respect to the reconstruction cost. Very promising results are highlighted by the comparison between the ratio of repair and reconstruction costs evaluated for the considered case studies and the values reported in recent studies (Cosenza et al., 2018; Dolce et al., 2019), emphasizing the robustness of the considered approach and the reliability of the hypotheses about infill modeling and damage assessment.
The Contributions of Infills to the Seismic Performance of RC Buildings: Numerical Response and In-Plane Damage
Several research studies can be found in the literature about the numerical modeling of infills in RC buildings. Different approaches have been proposed, and these have been basically classified into macro- modeling and micro- modeling approaches.
Micro-models can reproduce the infill response in a very refined way, modeling separately bricks, mortar layers, and infill-to-frame interfaces (Stavridis and Shing, 2010; Asteris et al., 2013; Filippou et al., 2019). Macro-models are less refined and computationally less demanding, but they are generally able to catch the main influence of the infill on the lateral response of the frame. Among macro-models, different models have been developed based on the use of single or multiple struts, acting only in compression, due to the negligible tensile strength of masonry infills (e.g., Polyakov, 1960; Bertoldi et al., 1993; Panagiotakos and Fardis, 1996; Crisafulli, 1997; El-Dakhakhni et al., 2003; Furtado et al., 2016; Di Trapani et al., 2018; De Risi et al., 2019, among many others). If the global response of the infilled frame has to be detected, the use of a single diagonal (compressive) strut resulted in a faithful modeling approach (Ricci et al., 2013) if the strut’s lateral force–displacement response is carefully defined. The proposal by De Risi et al. (2018) is briefly described herein (among all the research studies on the present topic) since it will be adopted in the case study introduced in the following sections.
In De Risi et al. (2018), an extensive homogenous database of experimental tests on RC frames infilled with hollow clay-masonry bricks—such as those investigated in this study—was collected and analyzed. The experimental response of masonry infills under lateral loads was thereby obtained by subtracting the experimental response of the bare frame from the experimental response of the corresponding infilled frame and properly multi-linearizing such a response (see Figure 1A). Based on these experimental data, a modification of the well-known model by Panagiotakos and Fardis (1996) was proposed in De Risi et al. (2018) to obtain a simple practice-oriented force–displacement envelope to significantly reduce the mean percentage errors in the prediction of the infill in-plane behavior under lateral loads (see Figure 1B). According to this modeling proposal, the lateral force (F)–displacement (D) relationship of the infill panel can thus be defined depending on its horizontal resisting area (Aw), its diagonal compressive strength (τcr), and the Mainstone’s stiffness (KMS) (Mainstone, 1971), the latter basically depending on the Young modulus of infill, flexural stiffness of the surrounding RC columns, and infill geometry.
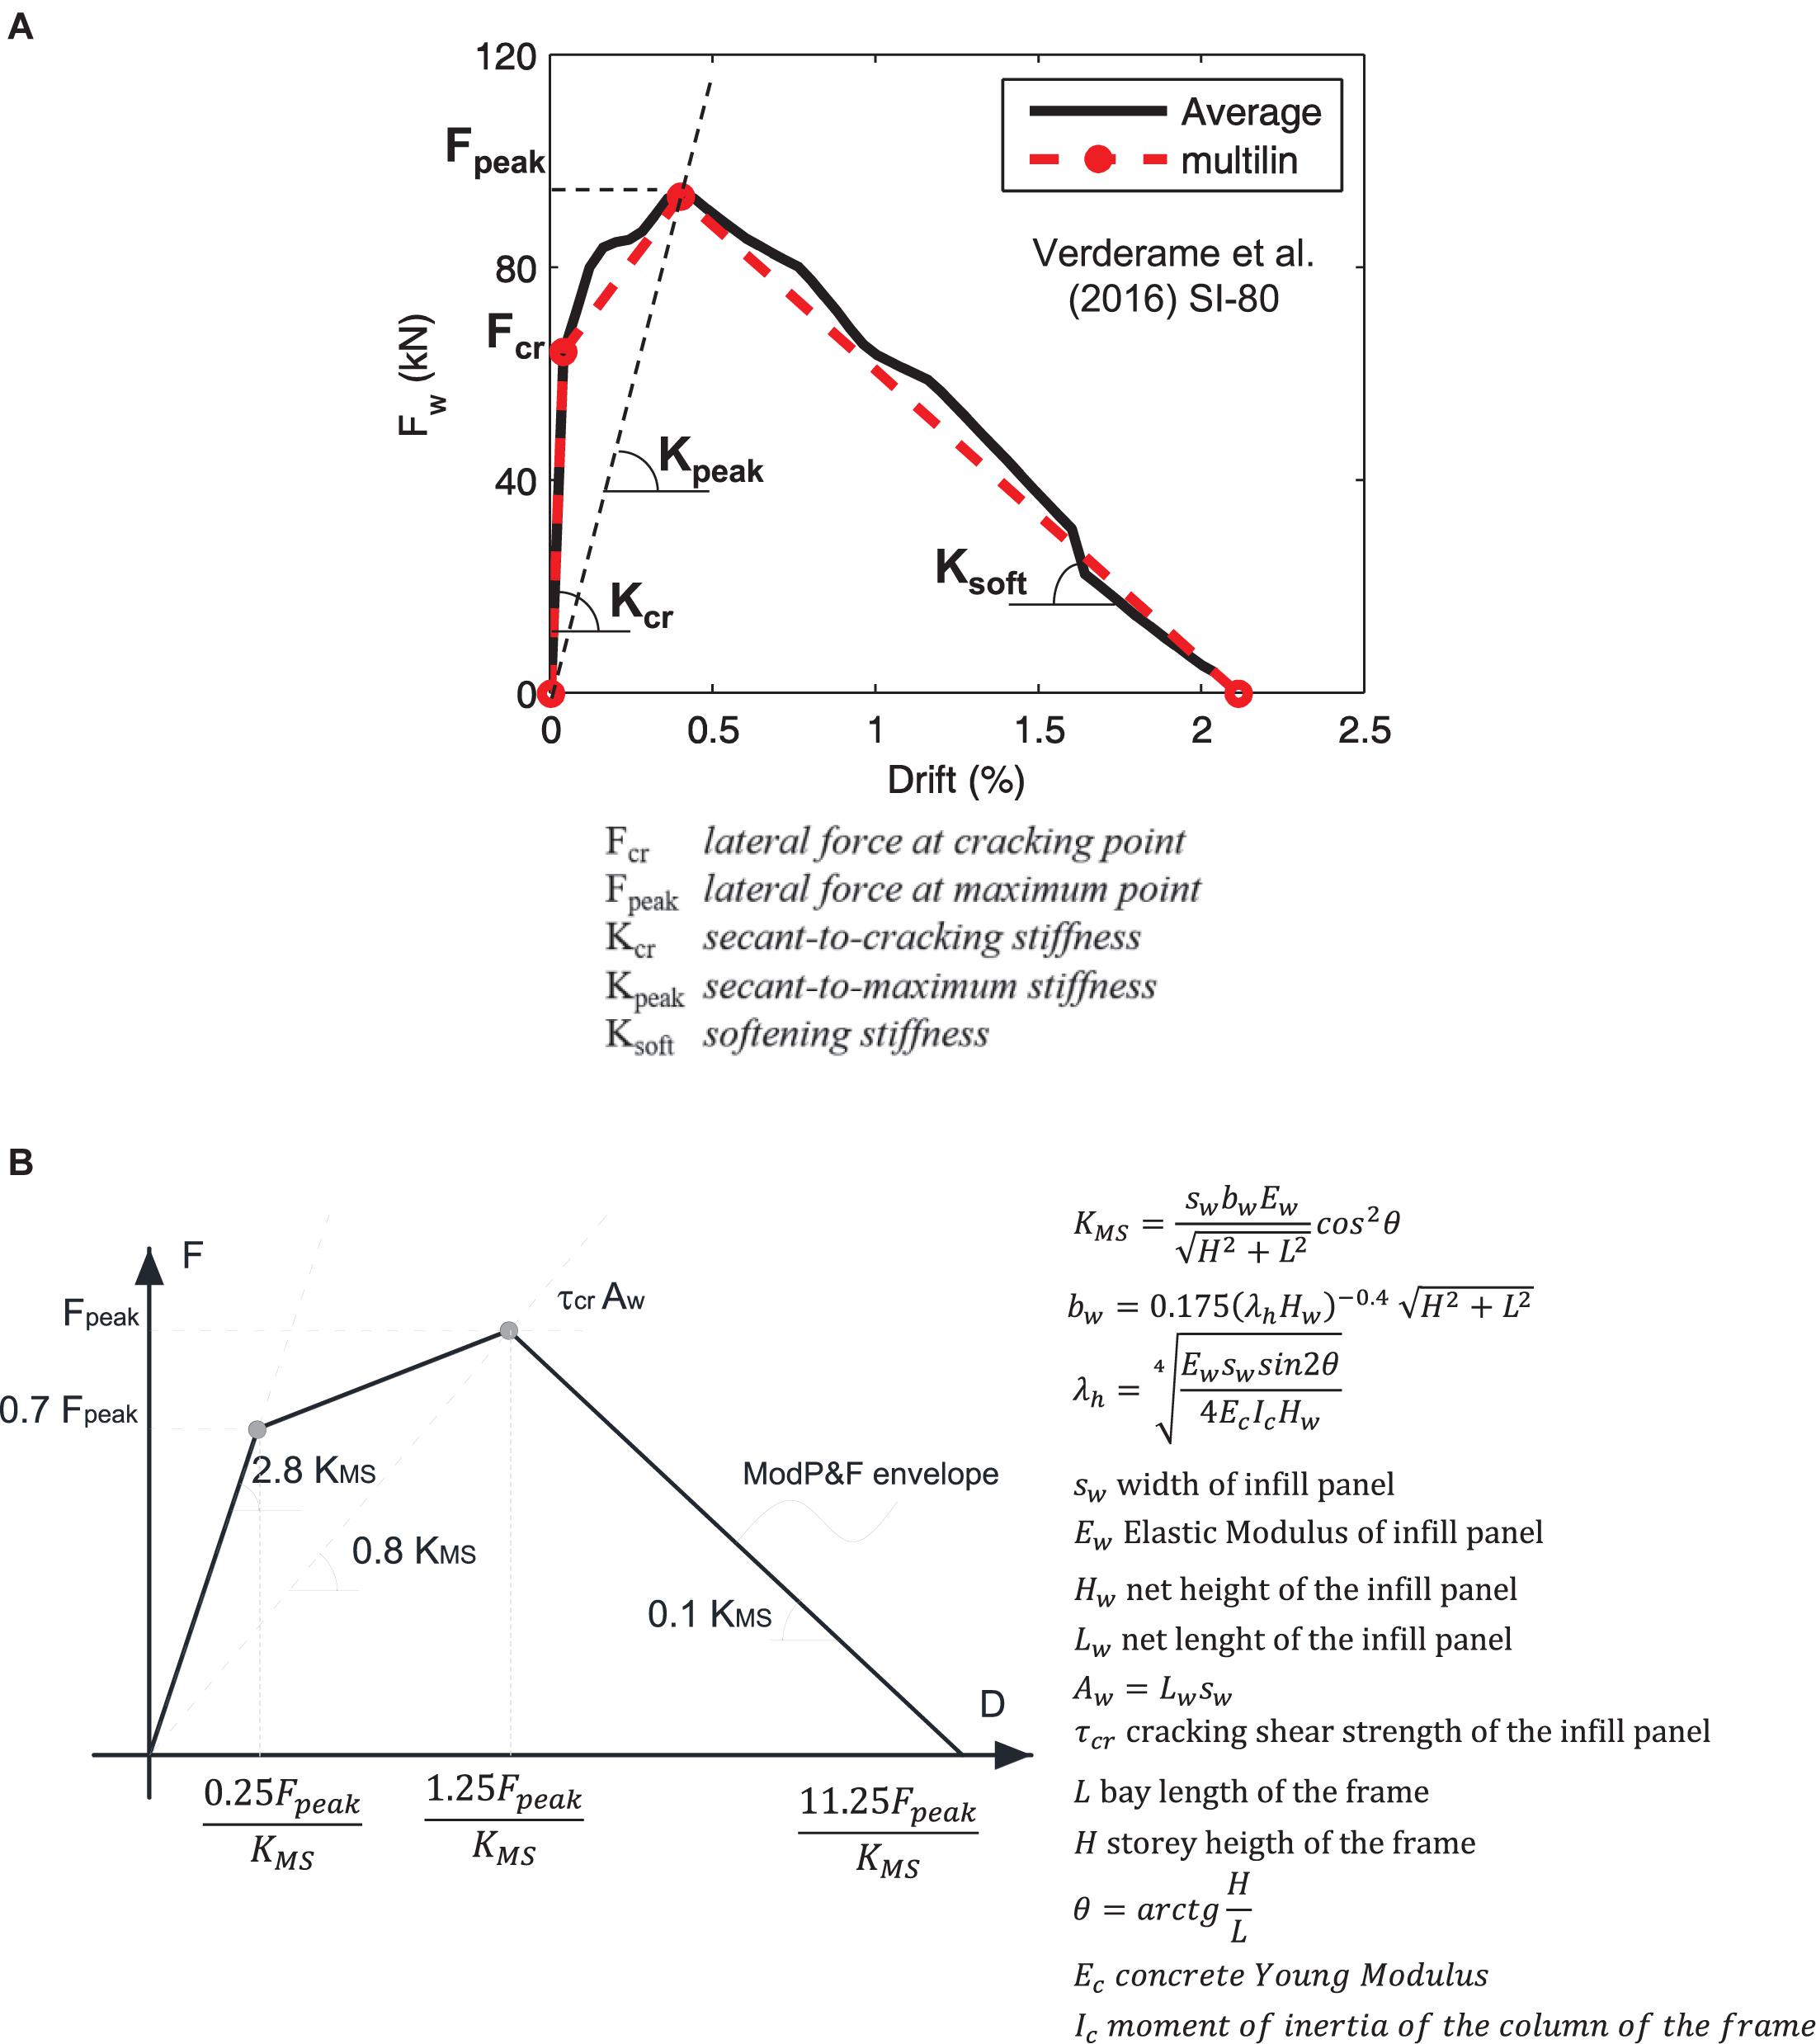
Figure 1. Infill lateral response: multi-linearization of experimental data (A) and Modified Panagiotakos and Fardis (ModP&F) model by De Risi et al. (2018) (B) (adapted from De Risi et al., 2018).
The analysis of the evolution of damage under increasing displacement demand for a large collection of experimental data in Del Gaudio et al. (2019) enabled the definition of the displacement capacity thresholds at given performance levels. Such an aspect represents another key ingredient for the discussion reported in the following sections.
In the literature, several research works analyzed the definition of Damage States (DSs) for RC buildings, describing the severity and the extent of cracking patterns involving structural and non-structural components for each DS. Very important contributions on this topic were provided by: (i) Grunthal (1998), the basis of the European Macroseismic Scale EMS-98, and (ii) Baggio et al. (2007), adopted in Italy as a guide for the post-earthquake damage reconnaissance forms (“AeDES” forms). These works represented the main reference for more recent studies on the definition of DSs, properly addressing non-structural elements like infills and partitions, a key issue for this work. Several proposals have been carried out in the last 5 years (e.g., Cardone and Perrone, 2015; Sassun et al., 2016; Chiozzi and Miranda, 2017; Šipoš et al., 2018). Some of these were calibrated for strong masonry infills (e.g., Morandi et al., 2018), typically characterizing more recent RC buildings; others are specific proposals for weak infills (e.g., Del Gaudio et al., 2019), typically characterizing “existing” buildings.
Del Gaudio et al.’s (2019) proposal is adopted herein both for DSs definition (consistently with Grunthal, 1998; Cardone and Perrone, 2015) and drift-based fragility curves for infills/partitions. Related Interstory Drift Ratio (IDR) thresholds for masonry infills at each DS are shown in Figure 2. It is worth noting that four DSs were originally defined in Del Gaudio et al. (2019). In such a study, DS3 is characterized by a “partial” collapse of the panel; it can thus be assumed to be corresponding to DS3 according to EMS-98 (Grunthal, 1998). On the contrary, DS4, according to Del Gaudio et al. (2019), represents an upper bound for the DS3 according to EMS-98, the former being characterized by a total collapse of the panel. In line with the EMS-98 scale, three DSs have thus been used in the present study, as summarized in Table 1.
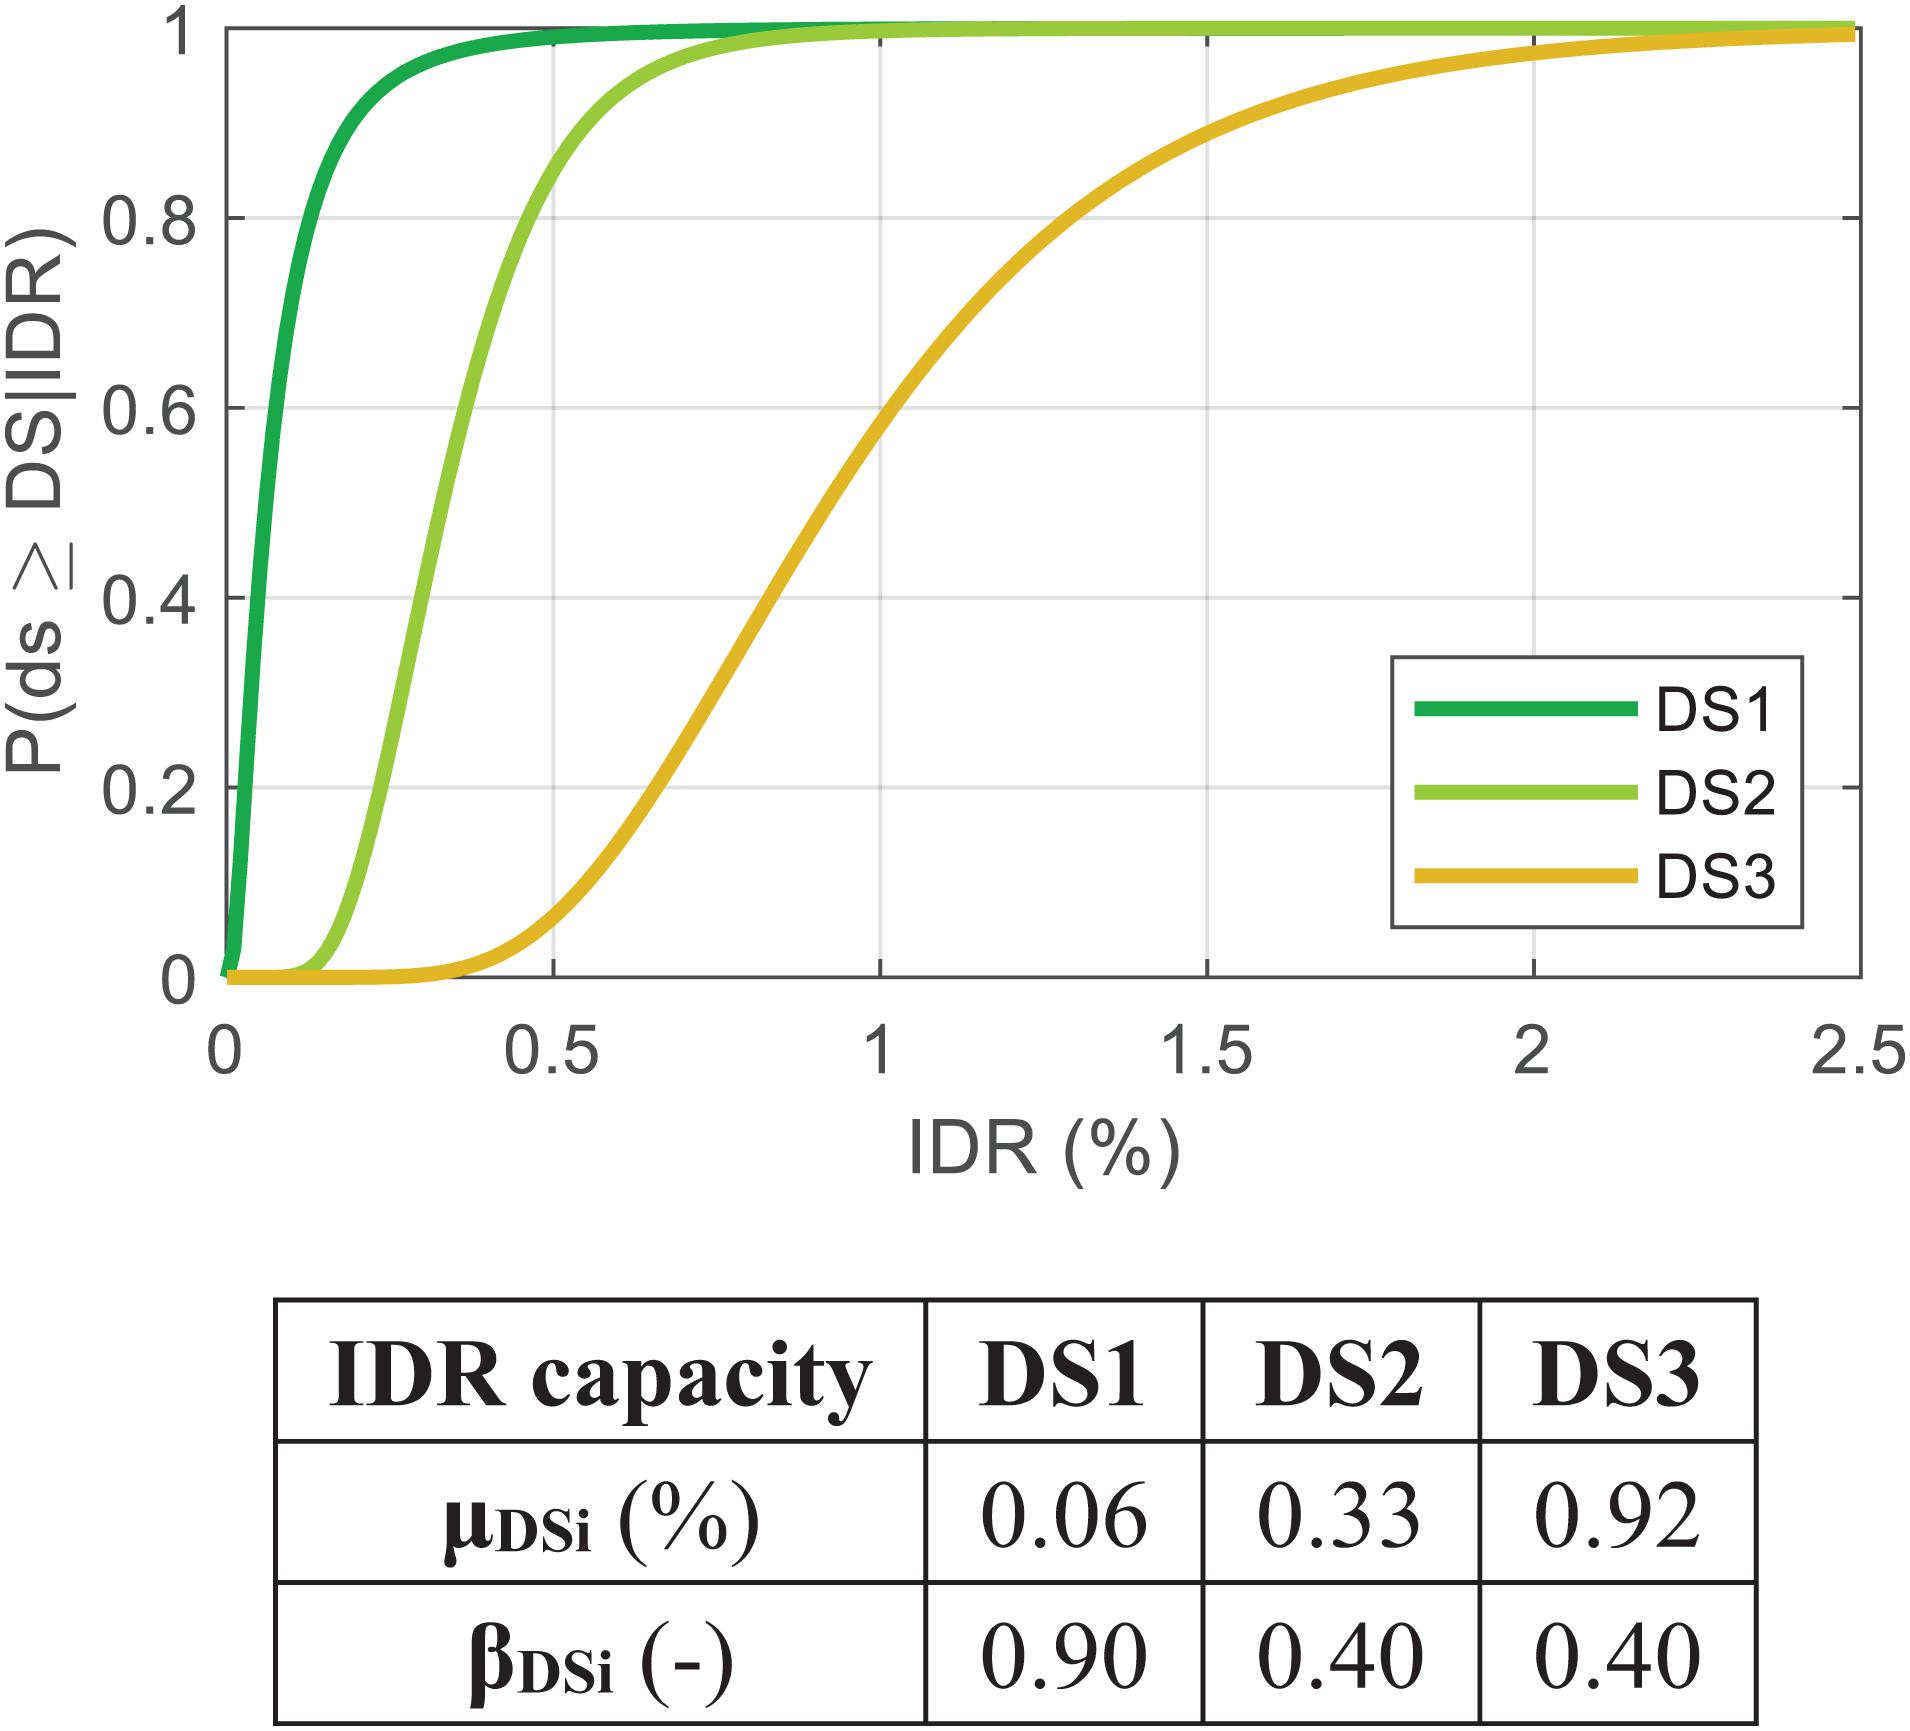
Figure 2. Drift-based fragility curves; mean (μDSi) and logarithmic standard deviation (βDSi) of IDR capacity at each DS for weak hollow clay masonry infill.

Table 1. Relationship between DSs definition adopted in this study and Grunthal et al.’s and Del Gaudio et al.’s proposals.
Figure 2 shows the fragility curves adopted in the following sections at DS1, DS2, and DS3, related to infills, and their defining parameters—mean (μDSi) and logarithmic standard deviation (βDSi) values—characterizing IDR capacities for hollow clay masonry infills. Note that this work focuses on weak masonry infills made up of clay bricks with (generally) horizontal holes since they are the most common infill typology in the Mediterranean area and in Italian building stock (Bal et al., 2007).
Lastly, it is worth noting that DSs related to RC members are neglected in this work since the main object is the quantification of losses due to damage to infills (and services) only.
Repair Costs Due to Infills and Services
The seismic loss estimation for infilled RC buildings in a component-based methodology requires knowledge of the damage suffered by infills and services (as explained in section “The Contribution of Infills to the Seismic Performance of RC Buildings: Numerical Response and In-Plane Damage”) and of the main repairing activities necessary for their refurbishment.
First, it is worth mentioning that, in residential RC buildings infilled with hollow clay bricks, such as those under study here, services typically strictly interact with them. Repairing activities necessary for services can therefore be directly related to repairing activities and damage level of infill panels. This assumption allows for (i) the avoidance of the definition of DSs and relevant fragility functions for services and (ii) relating repair activities necessary for services directly to DS suffered by infills, which is explained in detail later.
Repairing costs for infills and services are necessary, and therefore they are described in this section. The repair costs used in this work have been derived from Del Gaudio et al. (2019). This study defined a list of elementary repairing actions to be performed at each DSi (with i = 1, 2, 3) for damaged infills and their unit costs (based on the Price List of Public Works in Abruzzi Regio, BURA, 2017). The cost items necessary for the repair activities considered in this study are the following ones: preliminary operations, construction, and demolition activities, finishing, windows/doors frame installation, landfill, and technical costs. For each repair activity, the relevant unit repair cost (cj) has been computed based on BURA (2017). Lastly, the repair cost for the jth repairing activity at DSi (with i = 1, 2, 3), () has been obtained as the product of the unit cost of such activity and the relevant area of intervention (Aj,DSi). The latter was defined depending on the considered DS and, consequently, depending on the expected damaged portion of the infill panel. The sum of for all the required repair activities at each DS defines the repair cost for infills/partition (IP) at that DS (), as shown in the following equation:
The results of these calculations were performed for several infill geometry configurations and openings typology/geometry hypotheses in a Montecarlo simulation approach. Mean values of cost per infill panel surface unit IPDSi obtained in such a way are reported in Table 2 for:
1. a double leaf cavity masonry exterior infill (first three rows in Table 2), constituted of (12 × 25 × 25) cm + (8 × 25 × 25) cm hollow clay bricks (void percentage > 55%), assumed herein as representative of typical existing RC infilled buildings in the Mediterranean area (Bal et al., 2007), and
2. interior partitions made up of (8 × 25 × 25) cm hollow clay brick (void percentage > 55%).

Table 2. Repair costs for double leaf hollow clay bricks for infills/partitions (IP) at each DS per infill panel surface unit.
This work considers different services categories: plumbing systems, electrical systems, radiators, and wall or roof tiles. As for infills, the BURA (2017) Price List is also adopted for services. Each services category strictly interacts with the infill panels where they are enclosed or somehow linked, and the repair activities required for these categories thus depend on the maximum DS suffered by the infills. It is assumed that when infills are characterized by DS1-damage level, their damage is very light, and no repair activities are thus required for these services. Limited repair activities for services are required for moderate–severe damage (DS2) to infills; and the complete demolition and re-installation of all services is necessary for very heavy damage (DS3) to infills. A detailed list of repairing activities for services and their costs is reported in both Del Gaudio et al. (2020) and De Risi et al. (2020) for each damage level DSi (with i = 1, 2, 3), where costs are derived by summing up the products of unit cost multiplied by the relevant area of intervention for each repairing activity. The resulting mean values of repair costs for services (per plan surface unit), depending on the DS affecting infills, are reported in Table 3.
Analyzed Case Study Buildings
In this work, four infilled residential RC buildings are used as case study for quantifying the role of infills and services on the overall economical seismic loss. The main structural details of these buildings are provided in this section.
The case studies have the same floorplan (Figure 3A), symmetrical in both longitudinal (X) and transverse (Z) directions: 4 m bays are present in both directions, except for the central bay, which has a length equal to 3 m. The interstory height is equal to 3 m. The buildings differ to each other for number of stories (two or four) (Figures 3B,C) or design typology (Table 4). In terms of the design typology, two buildings have been designed to sustain gravity loads only, as was typical in most of Italy before the 1970s. They will be referred to herein as Gravity Loads Designed (GLD) buildings. The remaining two buildings have been designed according to obsolete seismic codes (OSLD) in force in Italy until the beginning of the 1970s that were adopted for the (few) sites classified as seismic zones in that time period. The investigated buildings are therefore representative of the Italian building stock related to the same time period (between the 1950s and the very beginning of 1970s) but located in different sites (with different seismic hazard at the age of construction).
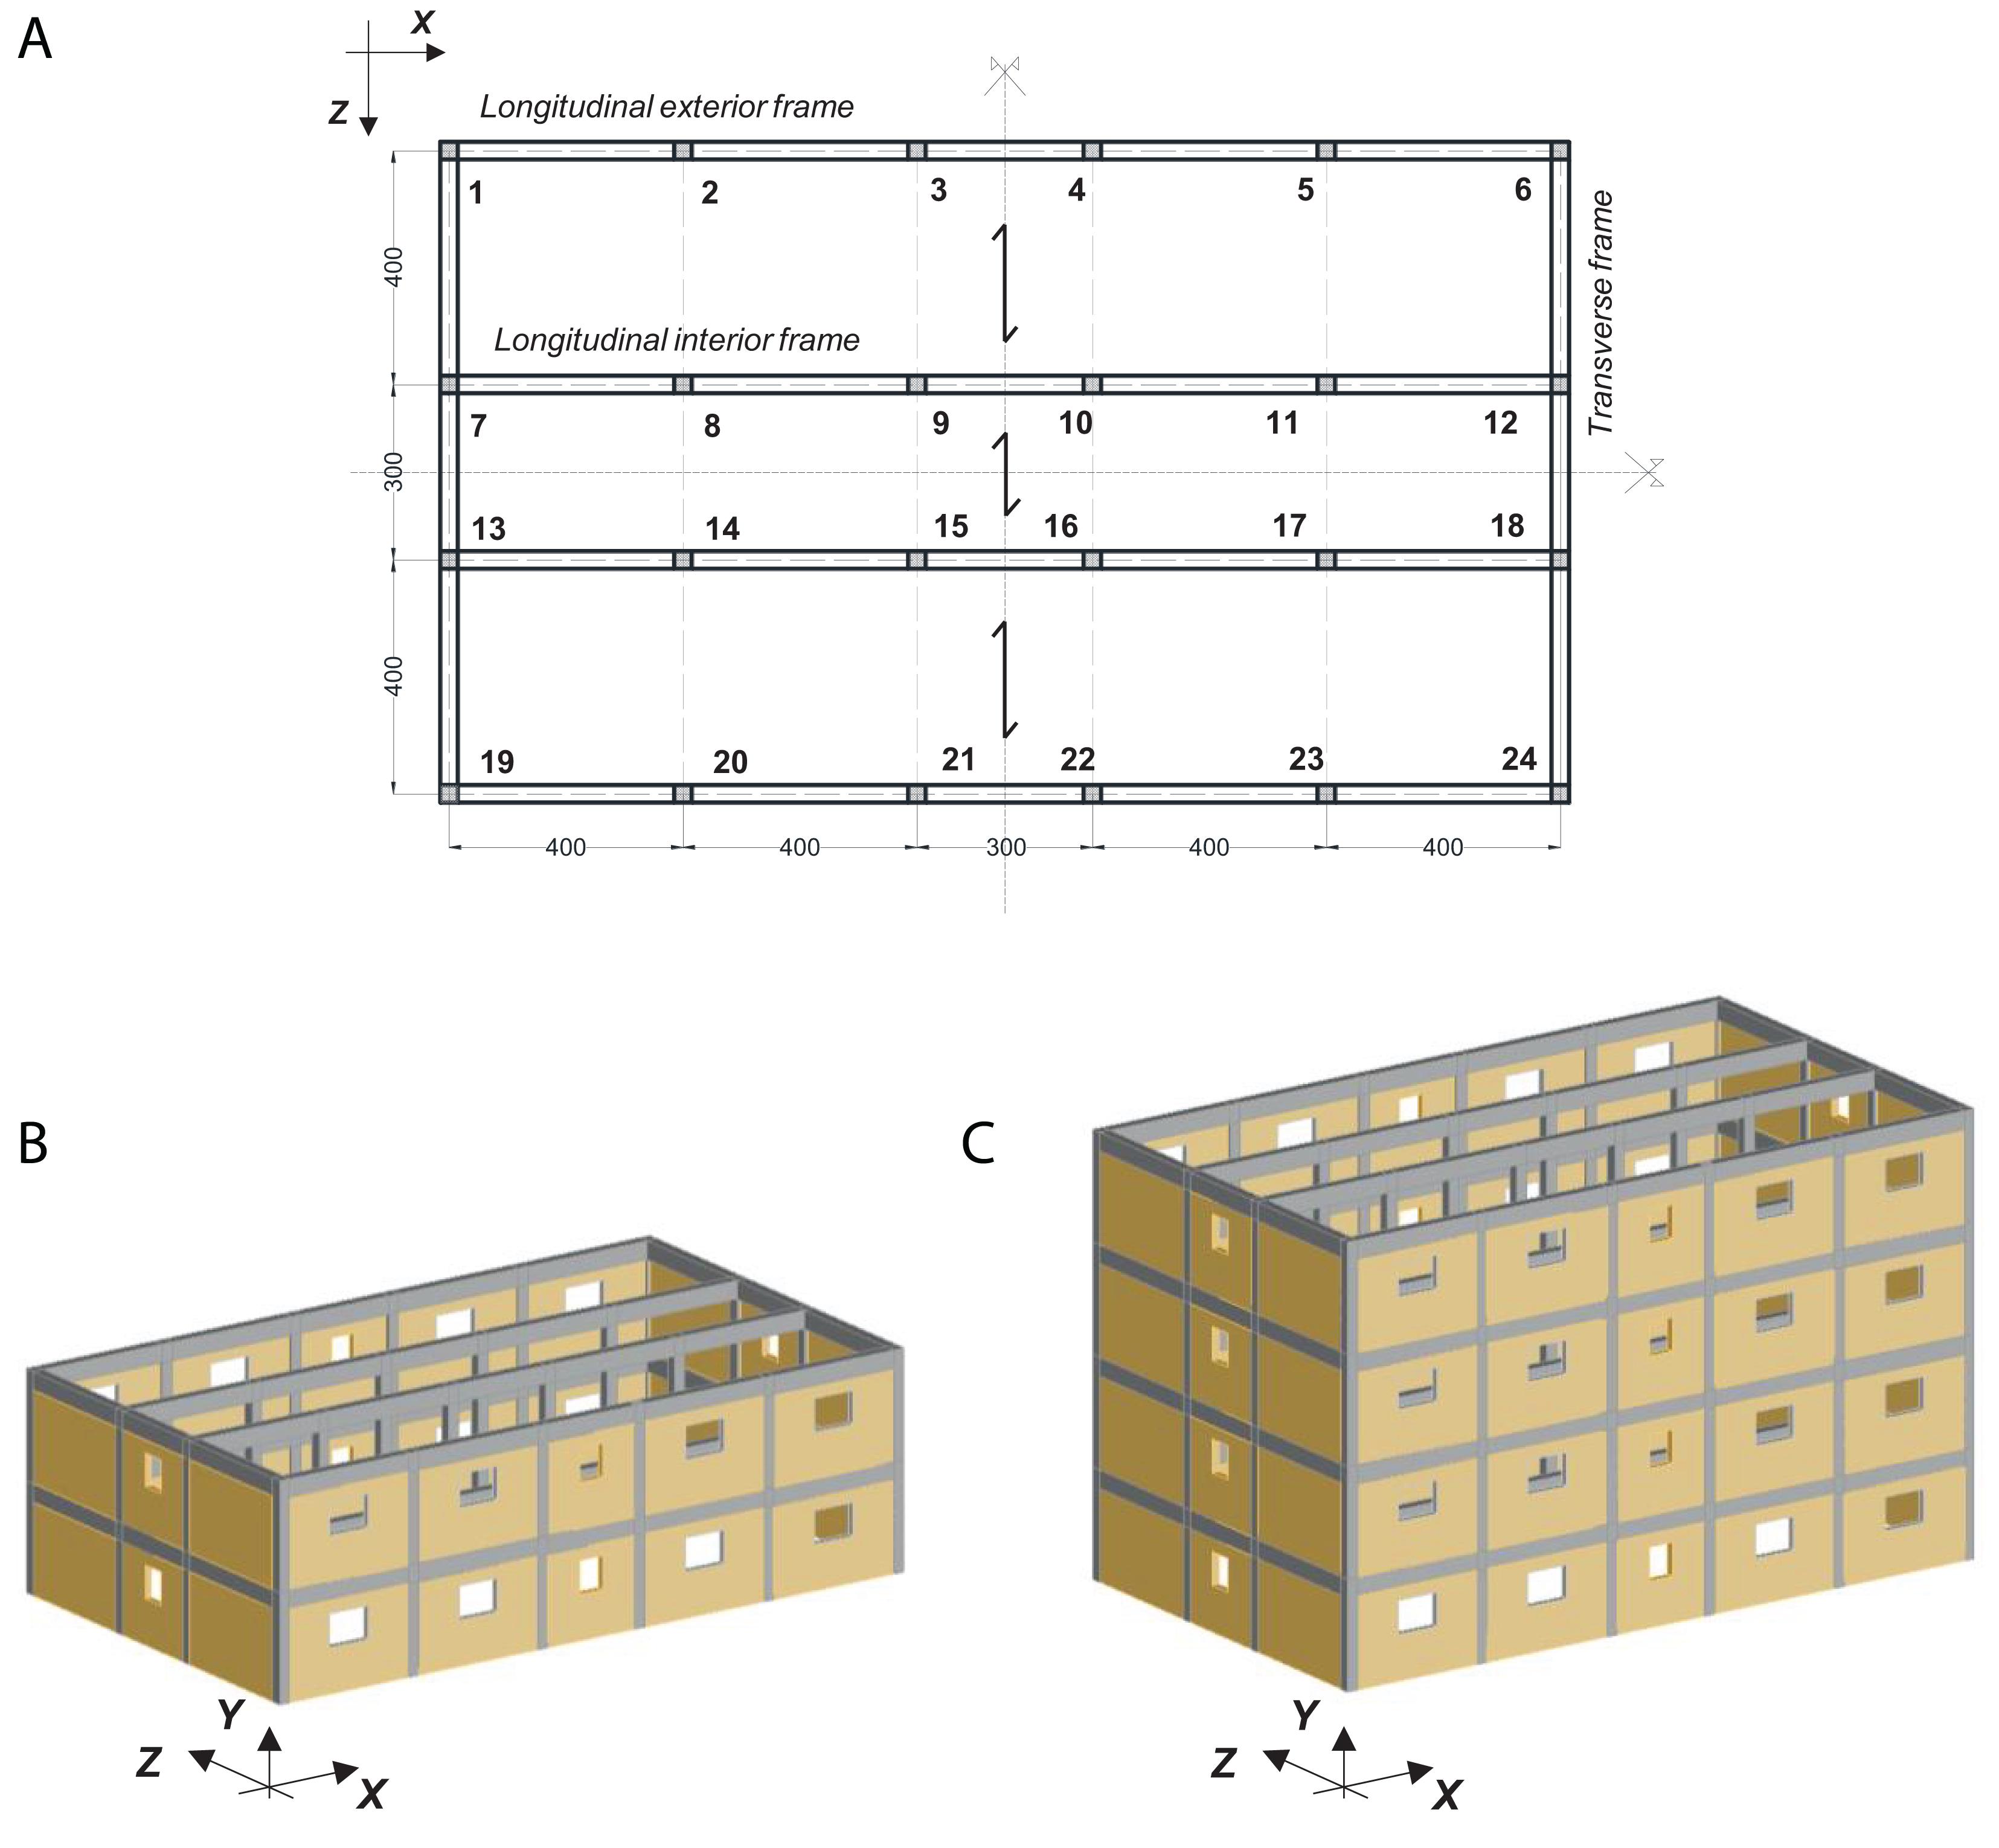
Figure 3. Plan disposal of the case study buildings and column labels (A), 3D view of two-story (B), and four-story (C) buildings (measures are in centimeters).
The moment resisting frames (MRFs) system for all the buildings is characterized by 2D resisting frames in the longitudinal (X) direction; whereas, in the transverse (Z) direction, MRFs are present only along the exterior perimeter. There are thus no beams connecting interior columns in the transverse direction (dotted gray lines in Figure 3A).
Floors are 20 cm thick, with 4 cm RC slabs. The design dead loads are equal to 6 and 4.5 kN/m2 for central stories and for the last story, respectively, 2 kN/m2 is adopted as the accidental load (typical of residential buildings). The weight of snow actions at the last story is also considered (about 1.5 kN/m2, according to CNR, 1967). As shown in Figure 3A, the floor weight is sustained by the longitudinal frames only. An infill weight (per panel unit surface) equal to 2.00 and 2.36 kN/m2 for longitudinal and transverse direction, respectively, is assumed for exterior frames. Infills differ between the two directions for the openings presence: the opening percentage ranges from 0 to 15% of the infill total area, as qualitative shown in Figures 3B,C.
The “maximum allowable stress method” is adopted for the “simulated design” of these buildings (Verderame et al., 2010). Since all the buildings originate from the same time period, the design of the mechanical properties of the reinforced steel and concrete are identical for all the buildings. Maximum allowable concrete strength was assumed to be equal to 5 or 6 MPa, respectively, for purely compressive loads or bending actions, respectively (according to R. D. Regio Decreto Legge n. 2105. del 22/11/1937, 1937). A maximum allowable strength equal to 140 MPa has been adopted for reinforcing bars (R. D. Regio Decreto Legge n. 2229 del 16/11/1939, 1939) based on the hypothesis that steel typology “AQ40” was used, as was typical at the time in Italy (Verderame et al., 2010). A steel-to-concrete homogenization coefficient equal to 10 was used (R. D. Regio Decreto Legge n. 2229 del 16/11/1939, 1939). Plain bars were used, as was typical in pre-1970 RC buildings in Italy (Verderame et al., 2010; Verderame and Ricci, 2018).
Additionally, infill panels are supposed to be identical for all the analyzed buildings and, in particular, made up of hollow clay bricks assembled with mortar: the presence of two coupled leaves, with 120 and 80 mm thickness, respectively, is assumed, as was typical of the Italian and Mediterranean area at the time (Bal et al., 2007). Interior partitions are supposed to consist of an 80 mm thick single-layer of hollow clay bricks. It is assumed that the total horizontal infill partition area in each direction was equal to 50% of the total horizontal area of exterior infills in that direction (Bal et al., 2007). This assumption is mainly necessary for the evaluation of repair costs due to interior partitions, as discussed in section “Seismic Loss Analysis Procedure.” Infills and partitions typology clearly reflect the main features described in section “Repair Costs Due to Infills and Services” for repair costs definition.
GLD buildings have been designed to sustain gravity loads only and to comply with code prescriptions regarding the minimum amount of longitudinal and transverse reinforcement as defined by the Italian R. D. Regio Decreto Legge n. 2229 del 16/11/1939, 1939. On the other hand, OSLD buildings are designed to sustain horizontal loads, too, the latter defined according to obsolete seismic codes in force in the reference time period (Gazzetta Ufficiale, 1684/1962; R. D. Regio Decreto Legge n. 2105. del 22/11/1937, 1937), which allowed for modeling of the seismic actions as horizontal equivalent forces constant along the building height. The design of the horizontal acceleration is equal to 0.07 times the gravity acceleration (Gazzetta Ufficiale, 1684/1962; R. D. Regio Decreto Legge n. 2105. del 22/11/1937, 1937). Additionally, the total design base shear is divided among resisting frames proportionally to the vertical loads supported by each of them, as was typical for the time period. This means that the transverse frames should support very low lateral action, whereas longitudinal interior frames should sustain the highest horizontal loads. As a result, the transverse frames are almost identical between GLD and OSLD buildings (being the same the number of stories), whereas longitudinal frames generally result in a higher amount of reinforcement, especially at the lowest stories of a four-story OSLD building (where columns have the highest longitudinal reinforcement percentage: see Table 5). In this case, the simulated design was carried out avoiding a significant increment of column cross-section dimensions (to avoid a further increase in shear demand) and mainly acting on the longitudinal reinforcement amount. Additionally, the reinforcement percentage values of the first-floor columns significantly decrease at the upper stories (around 0.7%). In a two-story GLD building, the minimum amount prescribed by codes of longitudinal and transverse reinforcement is generally required. On the other hand, for a two-story OSLD building, the sole difference of the relative GLD building consists of the amount of reinforcement from the longitudinal beams (which is obviously higher than the GLD case). Additionally, stirrups with 250 mm spacing and 8 mm diameter have been used in the beams; stirrups with 140 mm spacing and 6 mm diameter have been used in the columns (in agreement with prescriptions by R. D. Regio Decreto Legge n. 2229 del 16/11/1939, 1939). All the beams resulted in a 30 × 50 cm2 cross-section, whereas, column sections vary from a minimum of 30 × 30 cm2 (for most of the columns) to a maximum of 30 × 40 cm2 (for central columns of the four-story buildings). Rectangular columns are always oriented in the longitudinal direction.

Table 5. Geometric percentage of longitudinal reinforcement in first-floor columns (cross-section dimensions in brackets).
In summary, the main information about the longitudinal reinforcement percentage of the first-floor columns are reported in Table 5.
Non-Linear Modeling and Analyses Outcomes
The seismic response of the investigated case study buildings has been numerically reproduced in OpenSees platform (McKenna, 2011) and analyzed by means of non-linear static pushover (SPO) analyses. Section “Non-linear Modeling Strategy and Material Properties” describes the adopted modeling approach and section “SPO Results” resulting outcomes of the SPO analyses, which are necessary for the following seismic loss analysis.
Non-linear Modeling Strategy and Material Properties
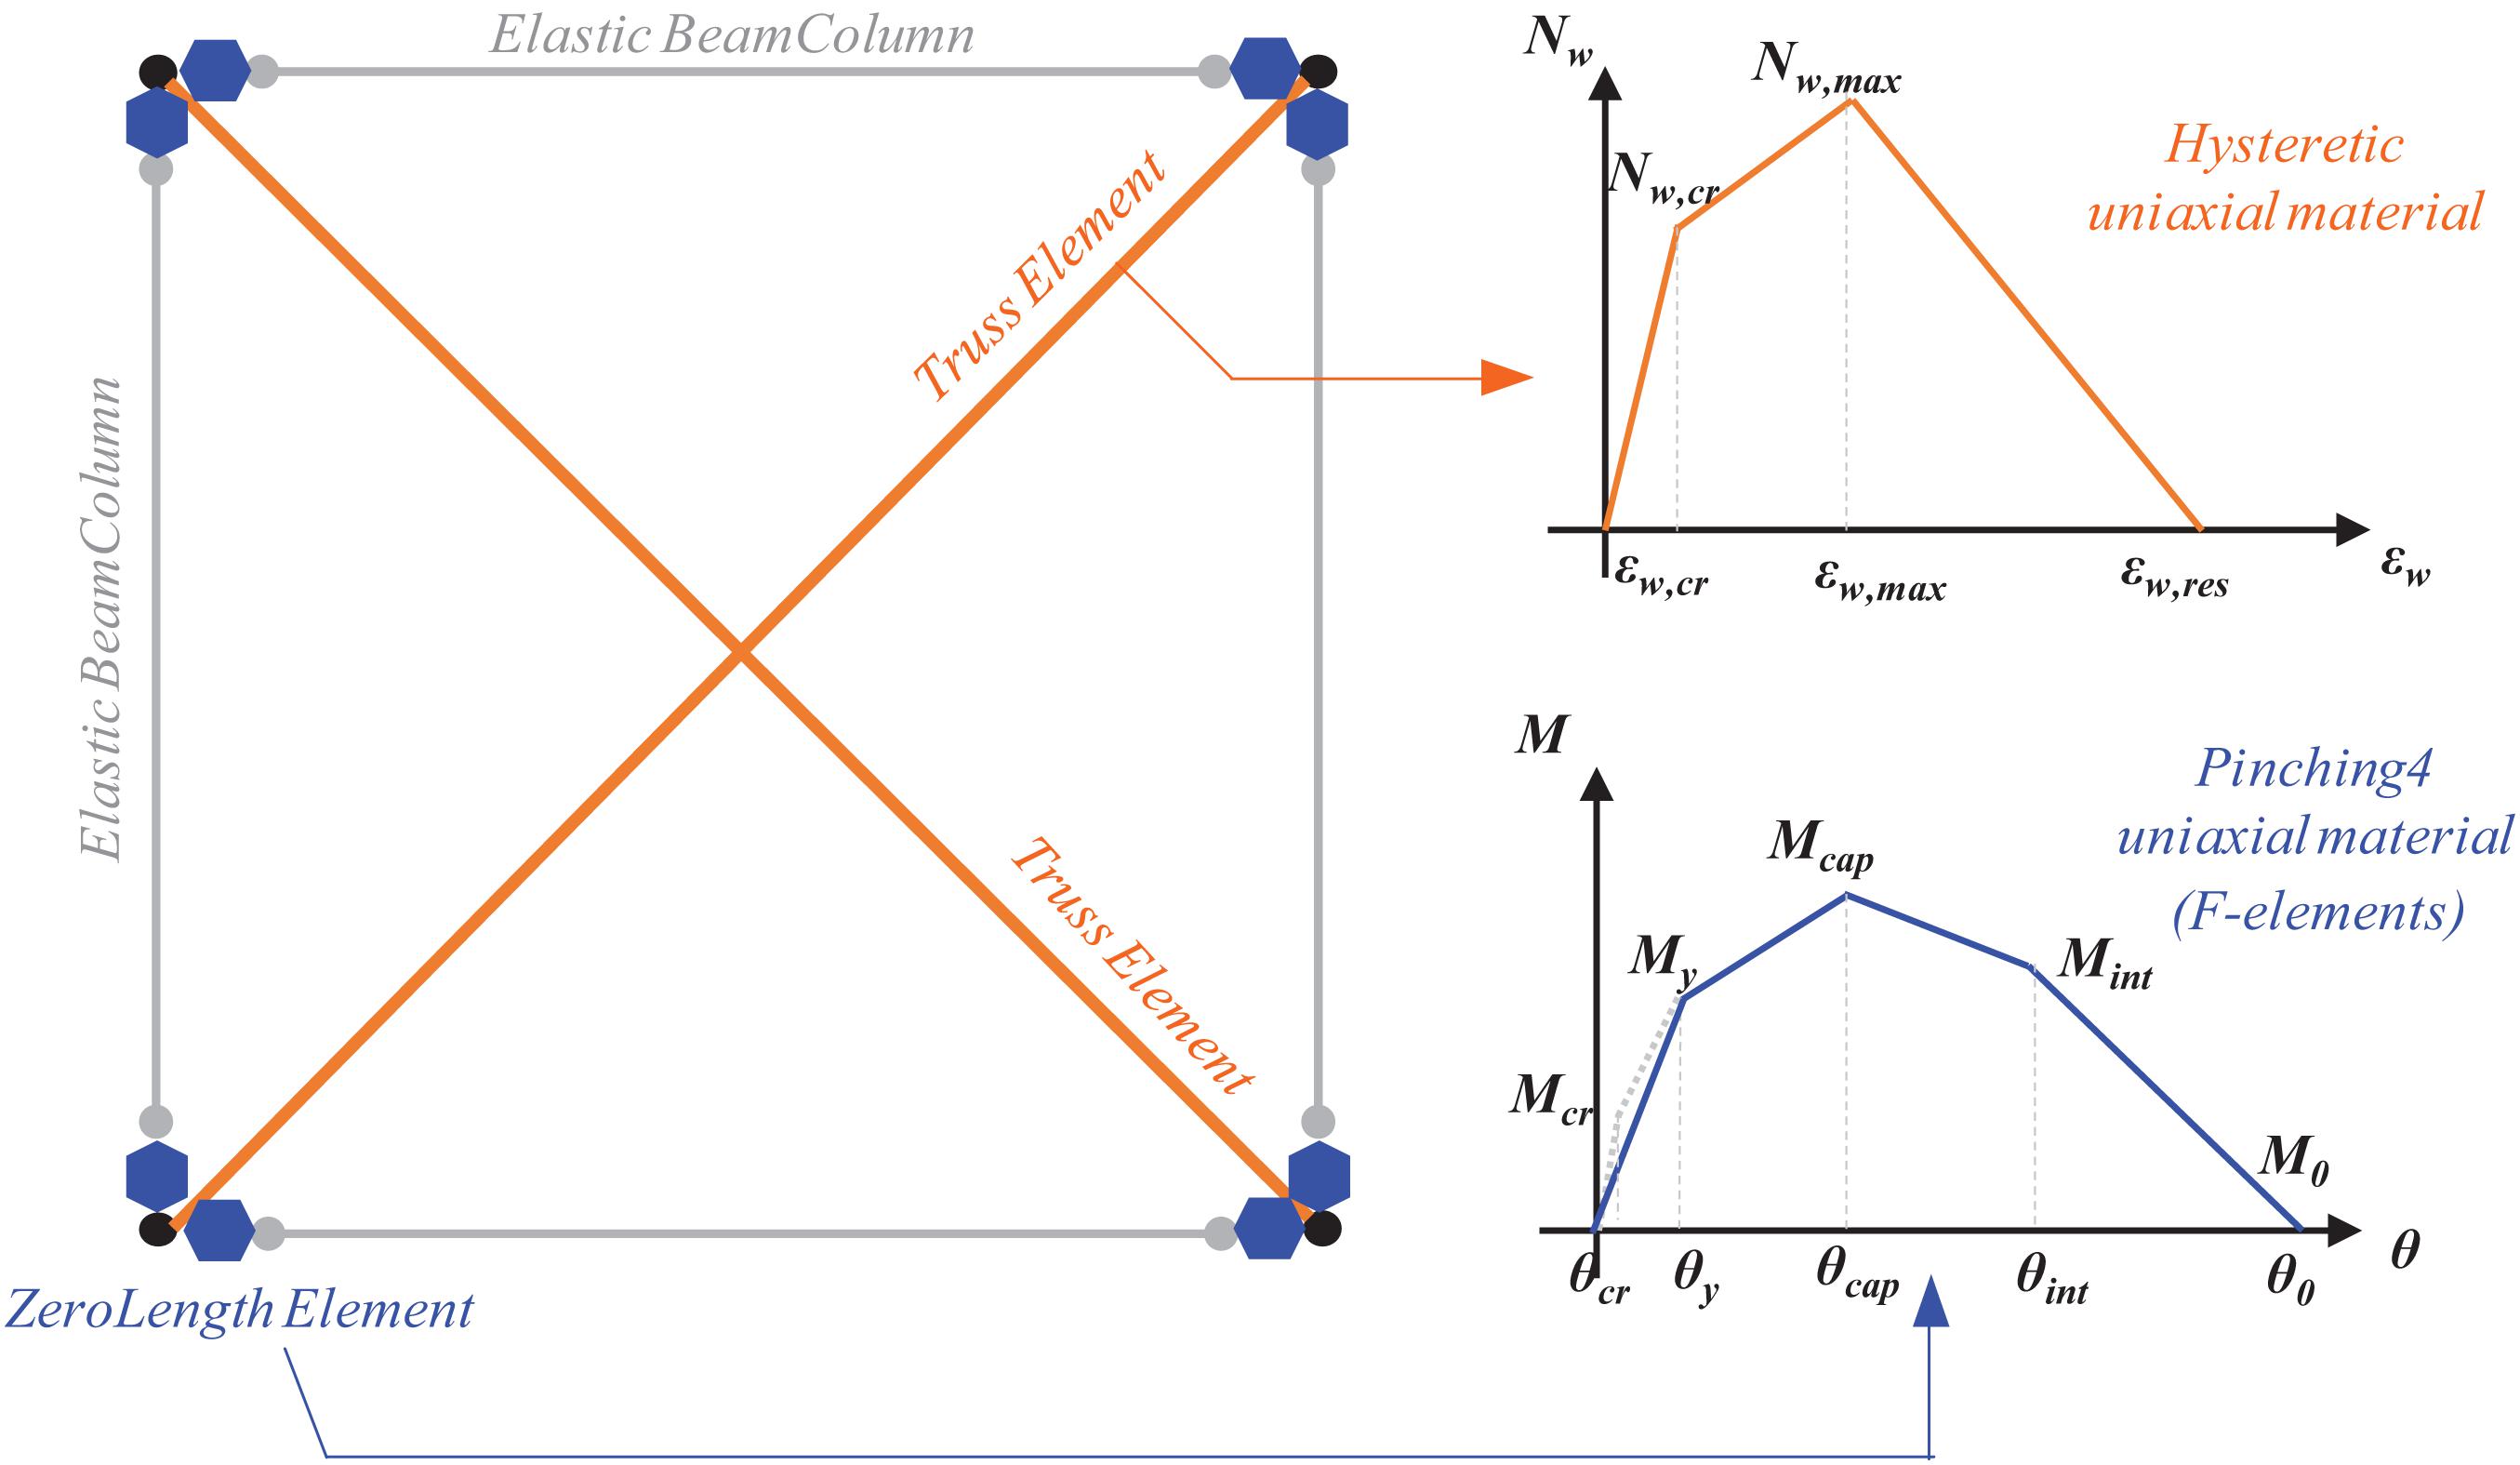
A lumped plasticity approach has been used in this work for RC members by means of zero-length elements in OpenSees located at the ends of each beam/column element in the series with elastic beam/column elements (see Figure 4). The flexural (bending moment, M vs. chord rotation, θ) response of beams and columns has been modeled by means of the (quadri-linear) proposal by Verderame and Ricci (2018), calibrated for RC elements reinforced with plain bars and implemented in the adopted software with a Pinching4 uniaxial material. The four-point envelope represents: (i) the yielding point (“y”), (ii) the capping point (“cap”), (iii) the softening branches’ intersection (“int”), and (iv) the zero-strength condition (“0”). Such material has been slightly modified by adding an additional point corresponding to the first cracking (“cr”) point (Figure 4). In addition, a pre-classification of each RC member has been performed to identify a priori its failure mode (i.e., flexural element, F; flexure-shear element, FS; purely shear element, S) by comparing plastic shear and shear strength, the latter calculated according to Sezen and Moehle’s (2004) shear strength model. When FS or S elements were detected, the relevant flexural moment–chord rotation relationship shown in Figure 4 has been modified, according to Ricci et al. (2019b), by limiting the element deformation capacity according to Aslani and Miranda’s (2005) proposal for shear critical RC columns. As a result, only some interior columns at lower stories resulted to be FS-elements. Non-linear response of beam-column joints is not introduced in the numerical models herein. Floors are assumed to be infinitively stiff in their own plane.
In terms of infill panels, two diagonal (concentric) compressive-only resisting struts (one per loading direction, as shown in Figure 4) have been implemented in each bay (with truss element of OpenSees library). De Risi et al.’s (2018) (tri-linear) model, discussed in section “The Contribution of Infills to the Seismic Performance of RC Buildings: Numerical Response and In-Plane Damage,” has been adopted herein: the corresponding axial load–axial strain (Nw–εw) response have been implemented with a Hysteretic uniaxial material (see Figure 4) for each truss element. Additionally, Decanini et al.’s (2014) reduction coefficients of infill lateral strength and stiffness have been used when openings are present.
Lastly, a key issue for the complete modeling of the case study structures is the definition of the strength values used for concrete, steel, and infills. Mean values of concrete compressive strength (fc) and reinforcing yielding strength (fy) have been assumed equal to 20.0 and 322.4 MPa, respectively, according to suggestions by Verderame et al. (2012) and Masi et al. (2014) for the adopted steel typology and the time period discussed here. Infill panels are characterized by a diagonal compressive strength (τcr) equal to 0.27 MPa and a Young modulus (parallel to the holes) of 3,000 MPa. Such values are based on a subset of data collected in De Risi et al. (2018) on Italian weak infills characterized by horizontally placed hollow clay bricks with a void percentage of about 60%, as is typical of the investigated case study buildings. The resulting properties are also consistent with information about mechanical properties reported in Del Gaudio et al. (2018). It is worth noting that the proper definition of infill mechanical properties is a complex issue since they are characterized by a very high variability and they significantly depend on brick typology and strength, mortar mechanical properties, bricks void percentage, and brick compression strength. Therefore, a further extension of the present work should explicitly consider the variability of the key infill mechanical properties and their effect on structural response and, consequently, on loss assessment.
SPO Results
SPO analyses have been performed for the case study buildings separately in longitudinal (X) and transverse (Z) directions. The applied lateral load distribution is proportional to the first-mode deformed shape in the considered direction. The resulting SPO curves—in terms of top displacement (Δtop) vs. base shear—and their comparison are shown in Figure 5, grouped depending on loading direction.
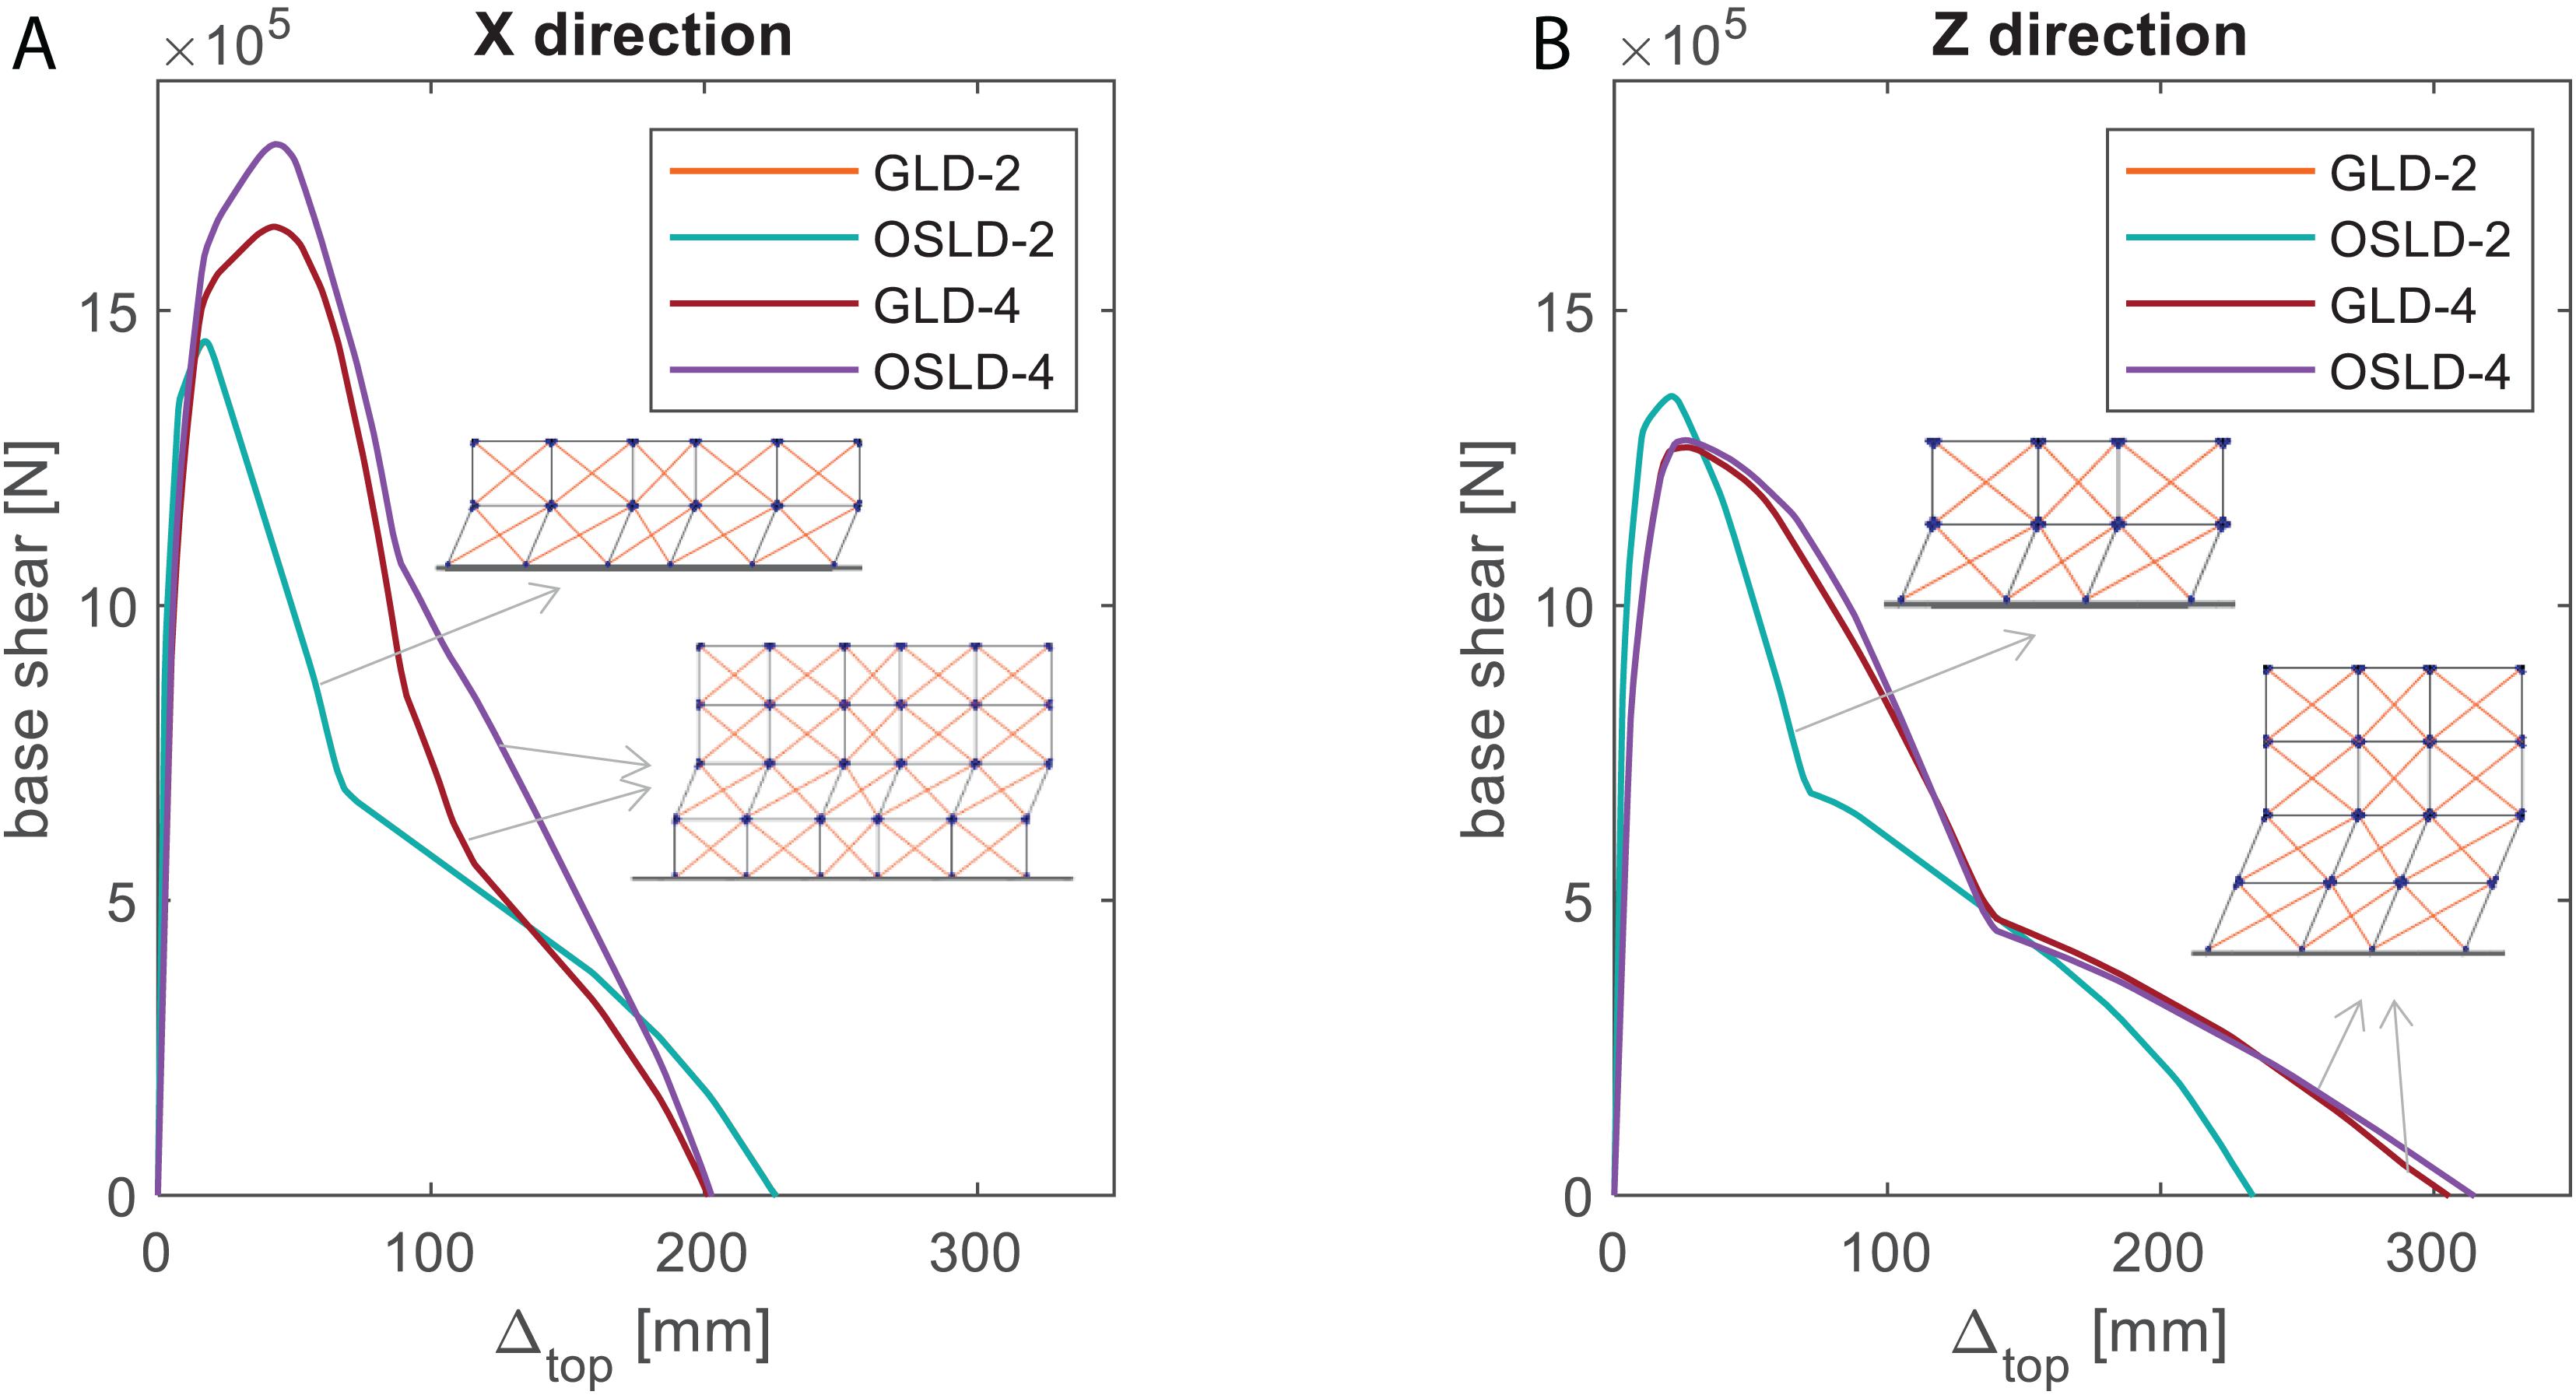
Figure 5. SPO curves and related collapse mechanisms for the case study buildings: longitudinal (X) direction (A), and transverse (Z) direction (B).
It can be noted that SPO curves related to GLD-2 and OSLD-2 are technically coincident due to their very low difference in resulting geometry and reinforcement details in the design phase, as highlighted in section “Analyzed Case Study Buildings.” Additionally, the contribution of infills on the lateral response tends to be predominant, thus flattening the differences in design typology. In both cases, and in both loading directions, the collapse mechanism involves the first story only.
SPO curves related to the four-story buildings are quite similar to each other even if, as expected, OSLD-4 presents higher base shear values and displacement capacity of GLD-4 in the longitudinal direction; SPO curves are almost identical in the transverse direction also for the four-story buildings, mainly due to the very low design lateral load in that direction for OSLD-buildings (see section “Analyzed Case Study Buildings”). A collapse mechanism that involves the first and the second floor is observed in the transverse direction for both the four-story buildings; a local second-floor mechanism is observed for both the GLD-4 and OSLD-4 in the longitudinal direction (Figure 5).
SPO curves are obviously related to a multi-degree-of-freedom (MDOF) system. SPO curve’ abscissa and ordinates can be divided by the first mode participation factor (Γ) of the building, in each considered direction, to obtain the capacity curve (CC) of the equivalent SDOF system. Then, each CC are multi-linearized to take in due account the strength and stiffness contribution of infill panels. As a result, four-branch capacity curves are obtained. Effective periods (related to the first branch of the multi-linearized capacity curves) result in the range [0.20; 0.22] s for the two-story buildings and [0.38; 0.45] s for the four-story buildings.
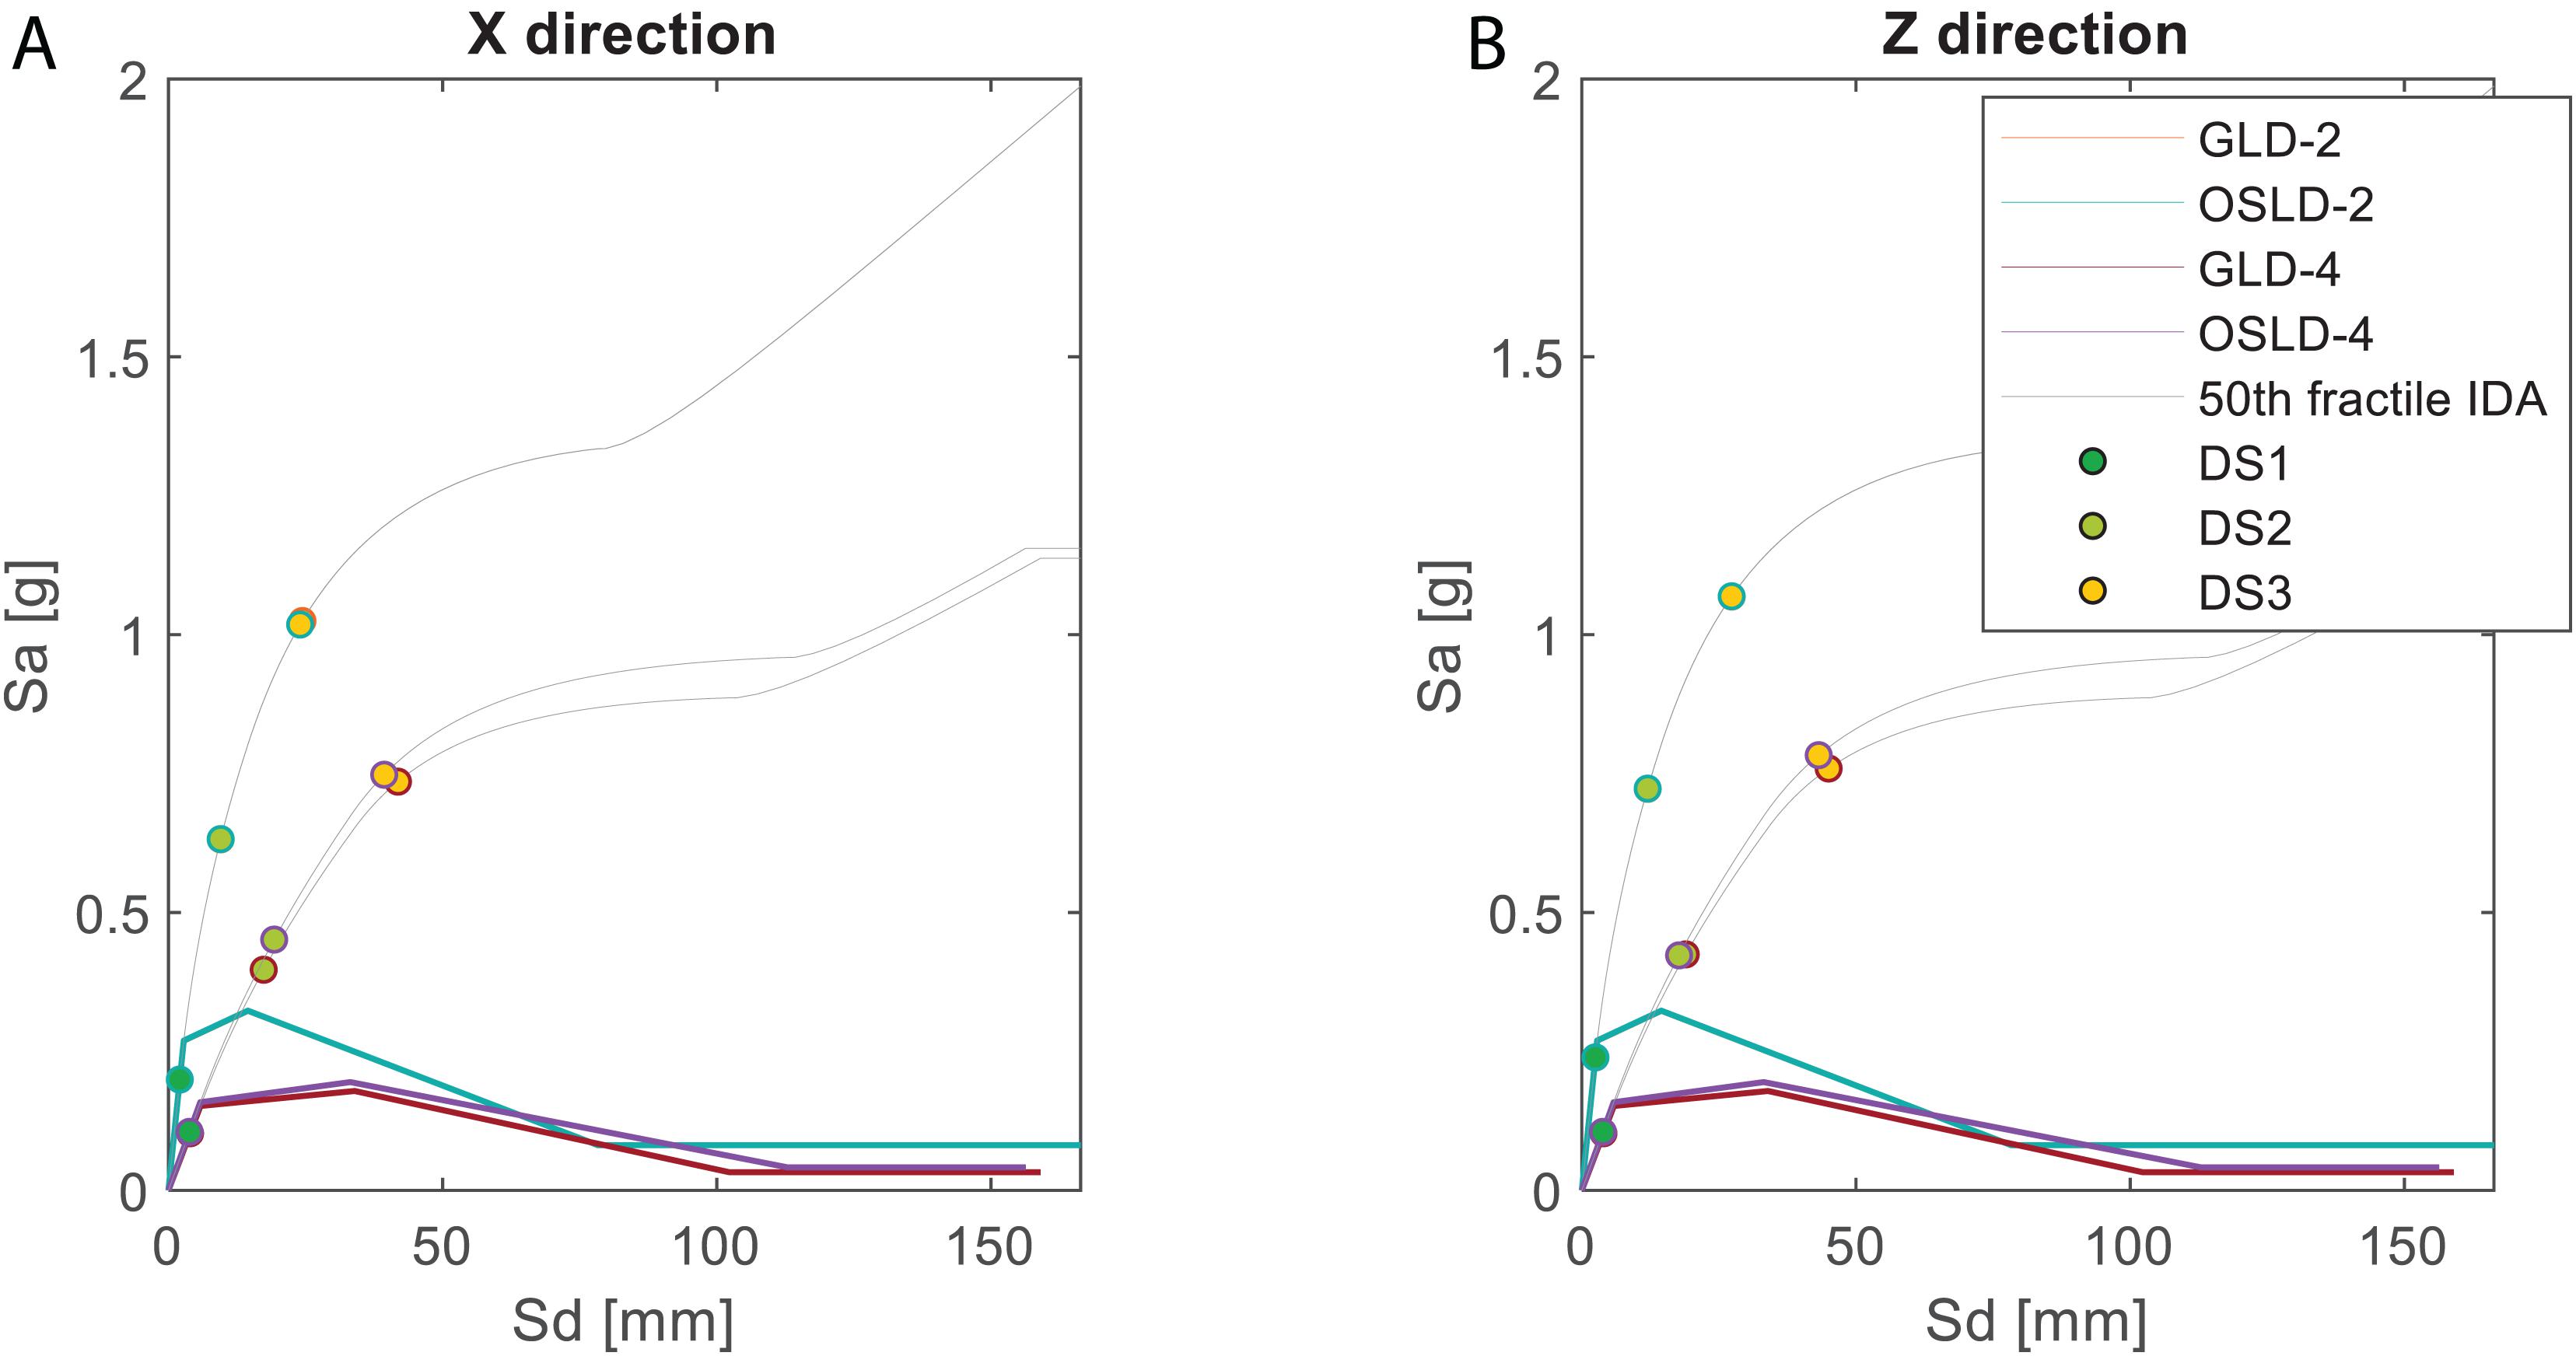
Starting from each quadri-linear CC, the related Incremental Dynamic Analysis (IDA) curve can be obtained thanks to the well-known SPO2IDA tool by Vamvatsikos and Cornell (2006), which provides the relationship between the selected engineering demand parameter (edp) and the seismic hazard intensity measure (IM). To apply the SPO2IDA tool, the CC should first be expressed in terms of ductility (μ)—strength reduction factor (R). The ductility μ is the ratio between CC abscissas and yielding displacement. The factor R is the ratio between CC ordinates and yielding acceleration. Five parameters that describe the quadri-linear μ–R curve are then necessary before applying SPO2IDA tool: the hardening slope, the softening slope, the ductility available up to the end of hardening branch, the ductility available up to a residual branch is reached, and the residual plateau. The SPO2IDA tool finally provides the IDA curve as a function of these five parameters, in terms of edp (spectral displacement) vs. IM (spectral acceleration). Given a certain capacity edp, the corresponding 16th-, 50th-, and 84th-percentiles of capacity IM can thus be obtained; alternatively, given a certain IM demand, the corresponding 16th-, 50th-, and 84th-percentiles of demand edp can be derived. The IDA curves obtained in such a way clearly represent an approximation of the “real” IDA curves properly obtained by means of incremental non-linear dynamic analyses or multi-stripe analyses; nevertheless, a simplified estimation of the record-to-record variability can be carried out too if necessary. IDA curves of the 50th percentile are only used in the following calculations, thus neglecting, for the purpose of the present study, the record-to-record variability. Such variability is certainly important for a reliable seismic performance estimation, and therefore, further efforts will be performed in future works to explicitly include it. Despite this, the procedure and the remarks reported in sections “Seismic Loss Analysis Procedure” and “Seismic Damage and Loss Analysis Results” remain valid.
Figure 6 shows the multi-linearized CCs (reported as spectral displacement, Sd, vs. spectral pseudo-acceleration, Sa, relationships) and the related (median) IDA curves for the case study buildings along with the performance points related to the achievement, for the first time, of DS1, DS2, or DS3 in the infill panels (as defined in section “The Contribution of Infills to the Seismic Performance of RC Buildings: Numerical Response and In-Plane Damage”). It is worth noting that the achievement of DSi (with i = 1, 2, 3) shown in Figure 6 is assumed to occur when the IDR demand in a panel reaches its median capacity value at that DSi (μDSi in Figure 2). Additionally, due to the structural regularity of the case study buildings and the same adopted capacity thresholds for all the panels (for sake of simplicity), the achievement of DSi “contemporary” (namely, at the same top displacement level) occurs in all the panels in a story, in a given direction. This aspect represents a key issue for the loss assessment discussed later.
Seismic Loss Analysis Procedure
In this section, the main steps of the loss assessment procedure adopted herein are described. It combines the results of the pushover analysis and drift-sensitive fragility curves for infills defined in section “The Contribution of Infills to the Seismic Performance of RC Buildings: Numerical Response and In-Plane Damage.” The probabilities of occurrence of each DS, given the engineering demand parameter due to a seismic event, will be used to evaluate the expected value of damage in infills and relevant repair cost for each element and subsequently for the whole story/building.
Damage Assessment Procedure
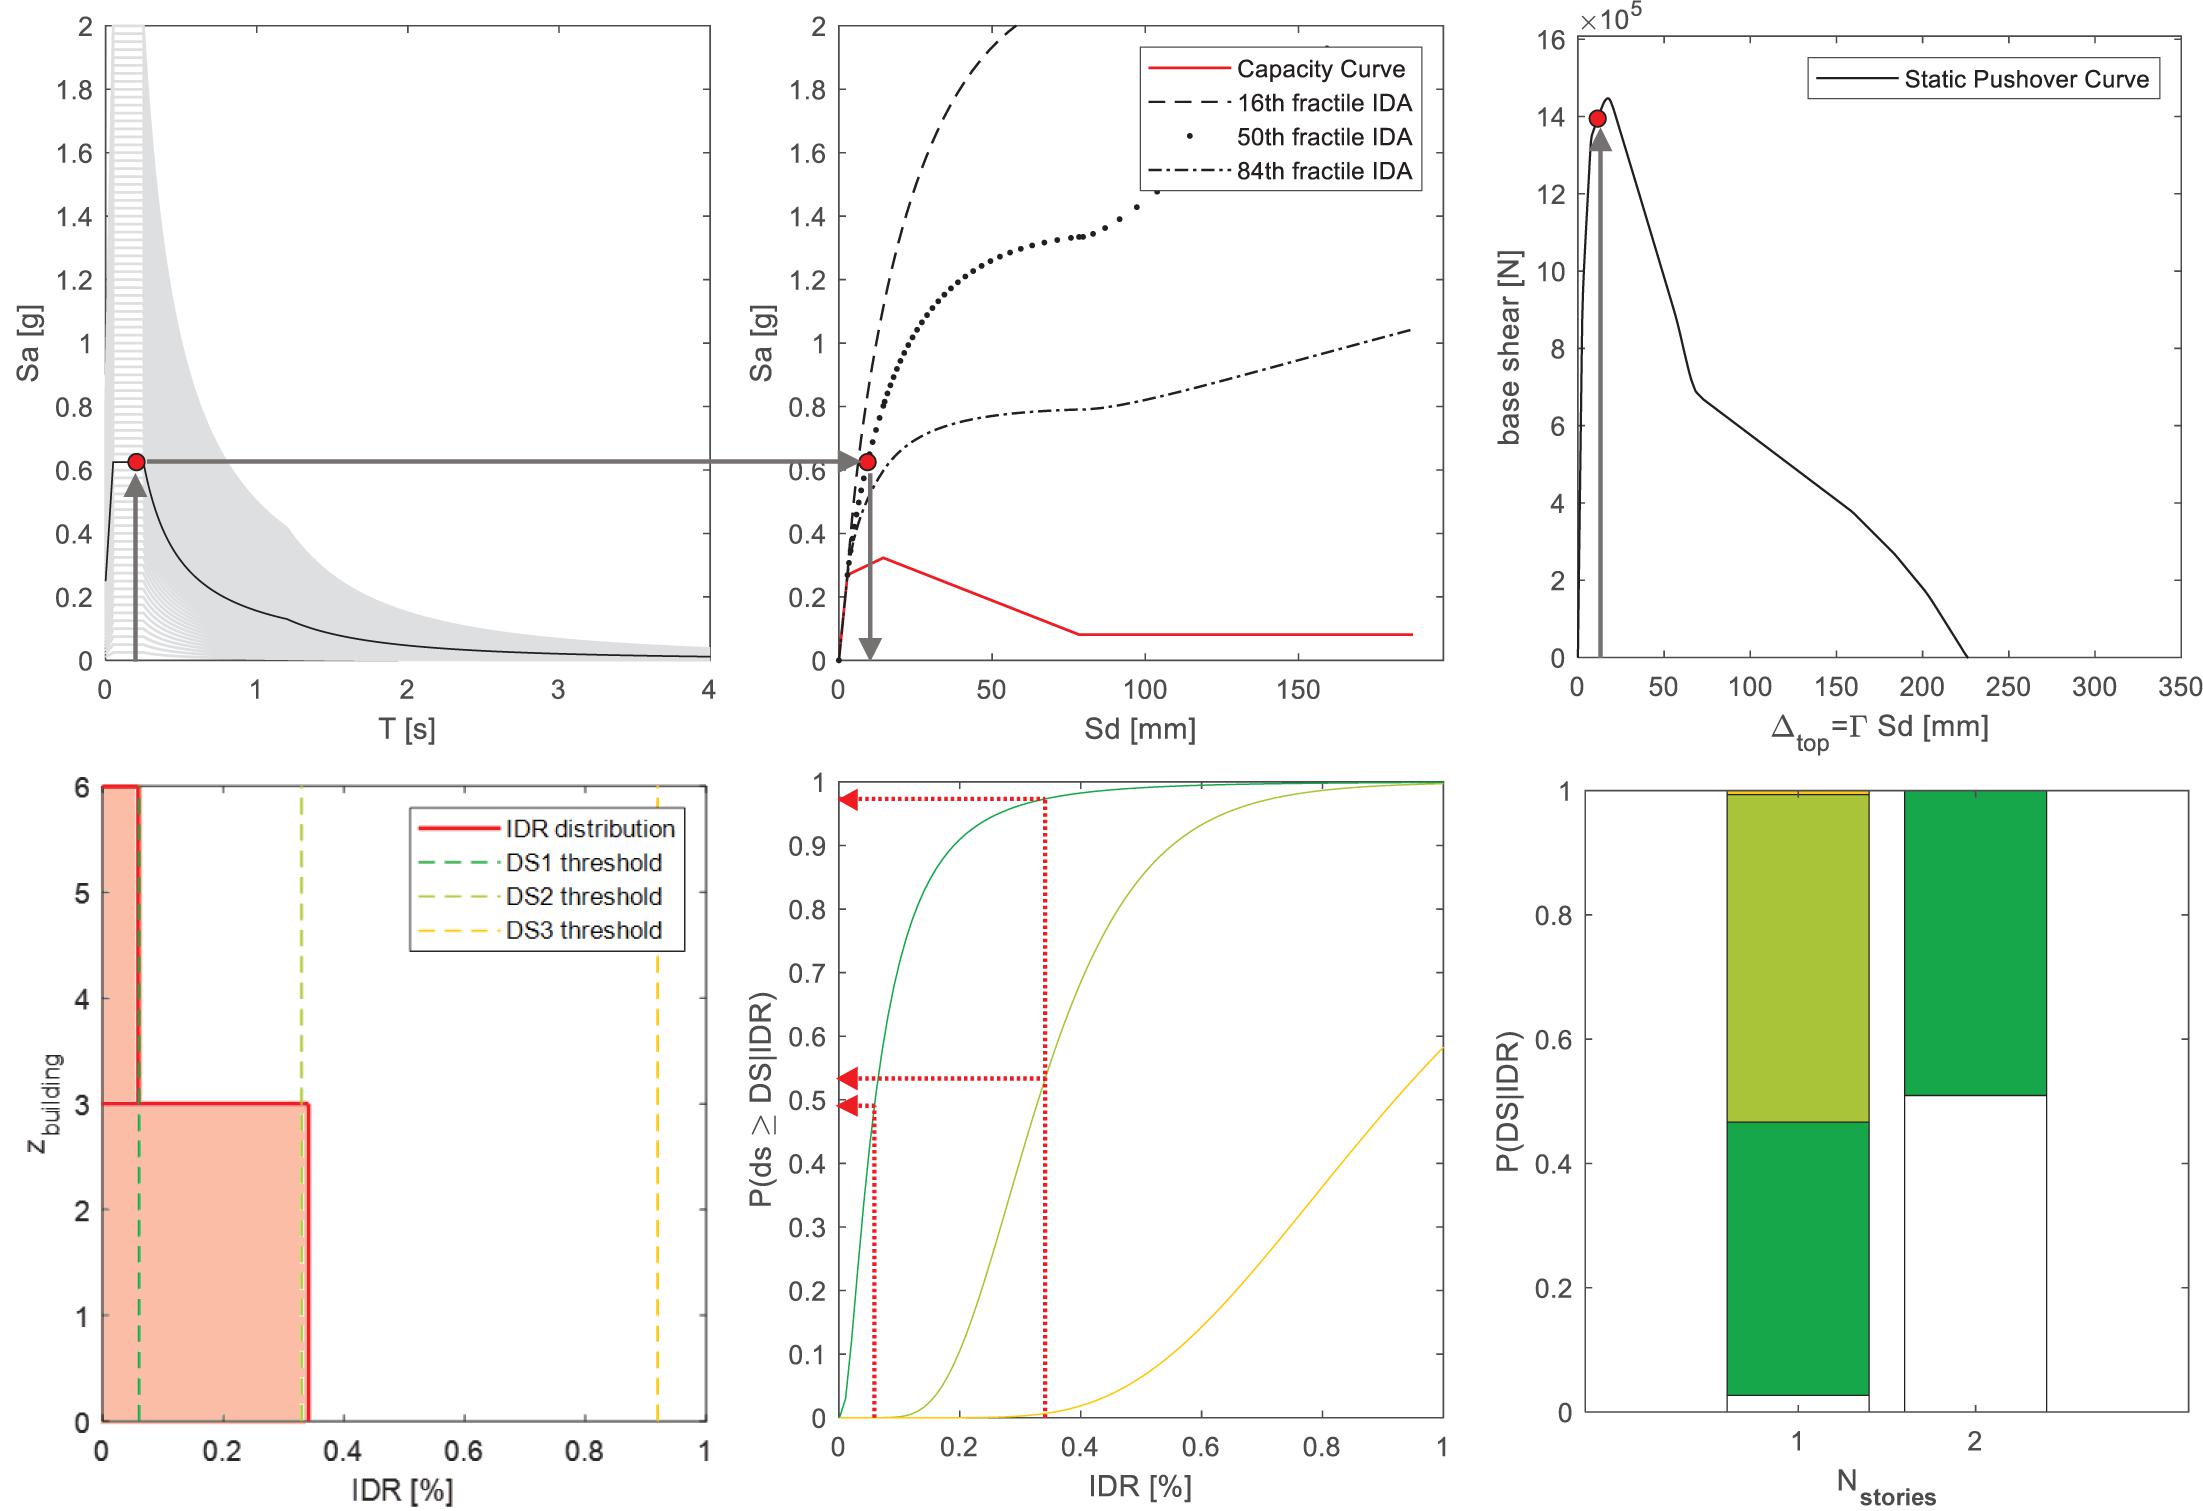
The damage assessment procedure is performed using the results of SPO analyses shown in section “Non-linear Modeling and Analyses Outcomes” by applying in contrariwise the “ordinary” approach usually used for seismic capacity assessment, as explained below.
Firstly, ground motion characterization is performed using a unique intensity measure parameter (i.e., the peak ground acceleration, PGA) for both (X and Z) directions. The PGA-value is then converted into different spectral pseudo-acceleration values as a function of dynamic properties of buildings (period of vibration) and of input motion (spectral shape). In this study, the design acceleration spectrum reported in Eurocode (EC) 8 (CEN, 2004) relative to soil type B is used. This choice aims at a higher generalization of the presented procedure, guaranteed by the fixed shape of the EC 8 spectrum, increasing the amplitude of ground motion. On the other hand, other spectrum typologies (i.e., the MPS04, Stucchi et al., 2004, 2011) have site-dependent formulations and are therefore strictly related to the site where the building is located. Moreover, soil type B (CEN, 2004) is assumed for the following applications due to its representativeness nationwide in Italy, inferred from the hypothesis that the shear-wave velocity within a 30 m depth is related to the topographic slope and geological lithology (Wald and Allen, 2007, Allen and Wald, 2009; Forte et al., 2019). The following steps are explained for a given PGA-value, but the procedure can obviously be repeated for a PGA range, as in the application reported in section “Seismic Damage and Loss Analysis Results.”
Spectral pseudo-acceleration values—obtained, as a function of the period of vibration in that direction, from the acceleration spectrum corresponding to a given PGA-value—allow us to obtain the resultant engineering demand parameters from the IDA curves, i.e., the spectral displacement on the multi-linearized CCs. Such displacement can be easily translated in roof displacements through the first-mode participation factor (Γ) in that direction. Given the SPO curve, such a roof displacement value unambiguously corresponds to a given drift profile throughout the building height (see Figure 7). For each story and direction, the resultant IDR-value can thus be compared to a given IDR threshold, reproducing the displacement capacity at different DSs due to in-plane actions (as commented in section “The Contribution of Infills to the Seismic Performance of RC Buildings: Numerical Response and In-Plane Damage”). This study reports a probabilistic estimation of such displacement capacities through the use of drift-based fragility curves characterizing not only the expected value corresponding to the attainment of a given damage pattern but also the related uncertainty (see Figure 2). The values attained by these functions in correspondence with a given IDR demand, at each story and direction, allow us to determine the probabilities of occurrence of the considered DSs (DS0, DS1, DS2, and DS3) for infill panels (Figure 7). Obviously, for each of the PGA-values, different probabilities of occurrence will be obtained for each story and each direction as a function of the IDR demand therein expected.
Predicted mean damage (DM) at that story (j = 1, …, Nstorys) and direction (k = X or Z) can thus be determined easily as follows:
where pi,j,k represents the probability of occurrence of ith DS. This equation provides the expected value of predicted damage, explicitly considering all the probabilities of occurrence of DSs weighting them by the severity of DS itself.
A synthetic measure of a damage pattern throughout the building height, in terms of both damage severity and extent, is then the mean damage, determined herein as follows:
Generally speaking, mean damage explicitly considers the contribution of each story (DMj,k⋅Ainf) to the whole damage estimation for that alignment (with Ainf equal to the total area of infill panels in both directions, and equal for all the stories). As, in regular buildings, such as those under investigation, the same distribution of probabilities of occurrence is observed for all the infill panels at that story and that direction, mean damage clearly corresponds to the mean value of DMj,k over the building height.
Theoretically speaking, this procedure should be strictly extended to the damaged areas only. Nonetheless, some generalizations have to be introduced to consider practical issues concerned with circumstances actually occurring during the repairing activity. In fact, some activities (i.e., those related to esthetical purposes) require us to extend the operation also to the adjacent components to avoid alteration of the esthetics of the entire façade and to guarantee a uniformity of appearance. This is the case, for example, for painting activities and/or the substitution of windows/doors elements. Accordingly, the area of intervention of repair activities is not strictly the damaged area but should be properly enlarged to account for all these conditions.
In addition, the recent policies for reconstruction aids following the last earthquakes that occurred in Italy advise building owners to combine refurbishment with retrofit intervention for seismic reduction and for energy-efficient actions. The resultant integrated approach (combining all issues) generally requires the substitution of all infills, enclosing the dwelling and/or a series of operation extended to all its exterior walls (Del Gaudio et al., 2020).
A reliable loss estimation should consider all these issues so that predictions are as close as possible to the real values (as demonstrated in De Risi et al., 2020). A minimum area of intervention is thus considered here, assumed to be the whole story surface (requiring the refurbishment/substitution of all the non-structural element therein present) for both the damage and loss estimation phases. Story mean damage (DMj) and building mean damage (DM) used for the following loss assessment are evaluated as the maximum damage between the two (X and Z) directions:
Loss Assessment Procedure
Given the distribution of probabilities of occurrence of each DS, resultant repair costs can be easily evaluated. The transition from damage to repair cost takes advantage of previous studies (Del Gaudio et al., 2019, 2020) that have listed all the elementary repairing actions to be performed at DSi (with i = 1, 2, 3) and their relative unit costs (based on the Price List of Public Works in Abruzzi Regio, BURA, 2017, see Tables 2, 3). As explained in section “Repair Costs Due to Infills and Services,” it is assumed that repair costs for both infills and services are obtained as a function of the damage distribution pi,j,k of infills only due to the firm infill-to-services interaction. The repair cost (C) for each story (j) and direction (k) is determined:
where pi,j,k is the probability of occurrence of the ith DS for infill panels for the jth story and the kth alignment, Apart is the total area of partitions in both (X and Z) directions, and Aj is the story-area. This intermediate operation extends the probabilities of occurrence for a given alignment to the whole infills-partitions-services area at that story. However, the maximum contribution to losses between the two directions is then used to determine the proper value of story-repair cost since the maximum damage between the two directions should be considered for practical and/or esthetical reasons (as explained before):
Lastly, the repair cost (C) for the whole building and its dimensionless value per surface unit (c) are simply obtained by summing Cj for all stories:
Seismic Damage and Loss Analysis Results
The results of the procedure explained in section “Seismic Loss Analysis Procedure” are finally shown in this section. First, all the steps required for loss estimation will be presented for one of the case study buildings (namely, the GLD-4), and the main results will then be presented and compared for all the analyzed buildings.
The first result reported in Figure 8 could be obtained independently of the structural analyses results (and, therefore, on the demand IM). Figure 8 primarily shows the trends of story-mean damage (DMj) and the story-repair cost (Cj) divided by the story surface (Aj) depending on the IDR demand. Due to the their definition, as explained in section “Seismic Loss Analysis Procedure,” both DMj and Cj are basically derived from the combination of fragility curves shown in Figure 2 and repair costs reported in section “Repair Costs Due to Infills and Services,” given the Apart/Ainf and the Ainf/Aj ratios. Being equal to the adopted fragility curves and repair costs, such relationships are thus exactly the same for all the considered buildings. As expected, DMj and Cj/Aj increase when IDR demand increases, up to a maximum constant level (when IDR is roughly equal to 2.5%), which represents the condition of 100% probability for infills of being in DS3. When DMj reaches its maximum possible value (100% probability DS3, namely DMj = 3), the maximum story-repair cost is equal to about 670 €/m2 (per story-surface unit). Additionally, Figure 8 reports the median IDR thresholds at DSi (with i = 1, 2, and 3) and, for the specific case of the GLD-4 building, the maximum IDR-values achieved at the end of SPO analyses at each story.
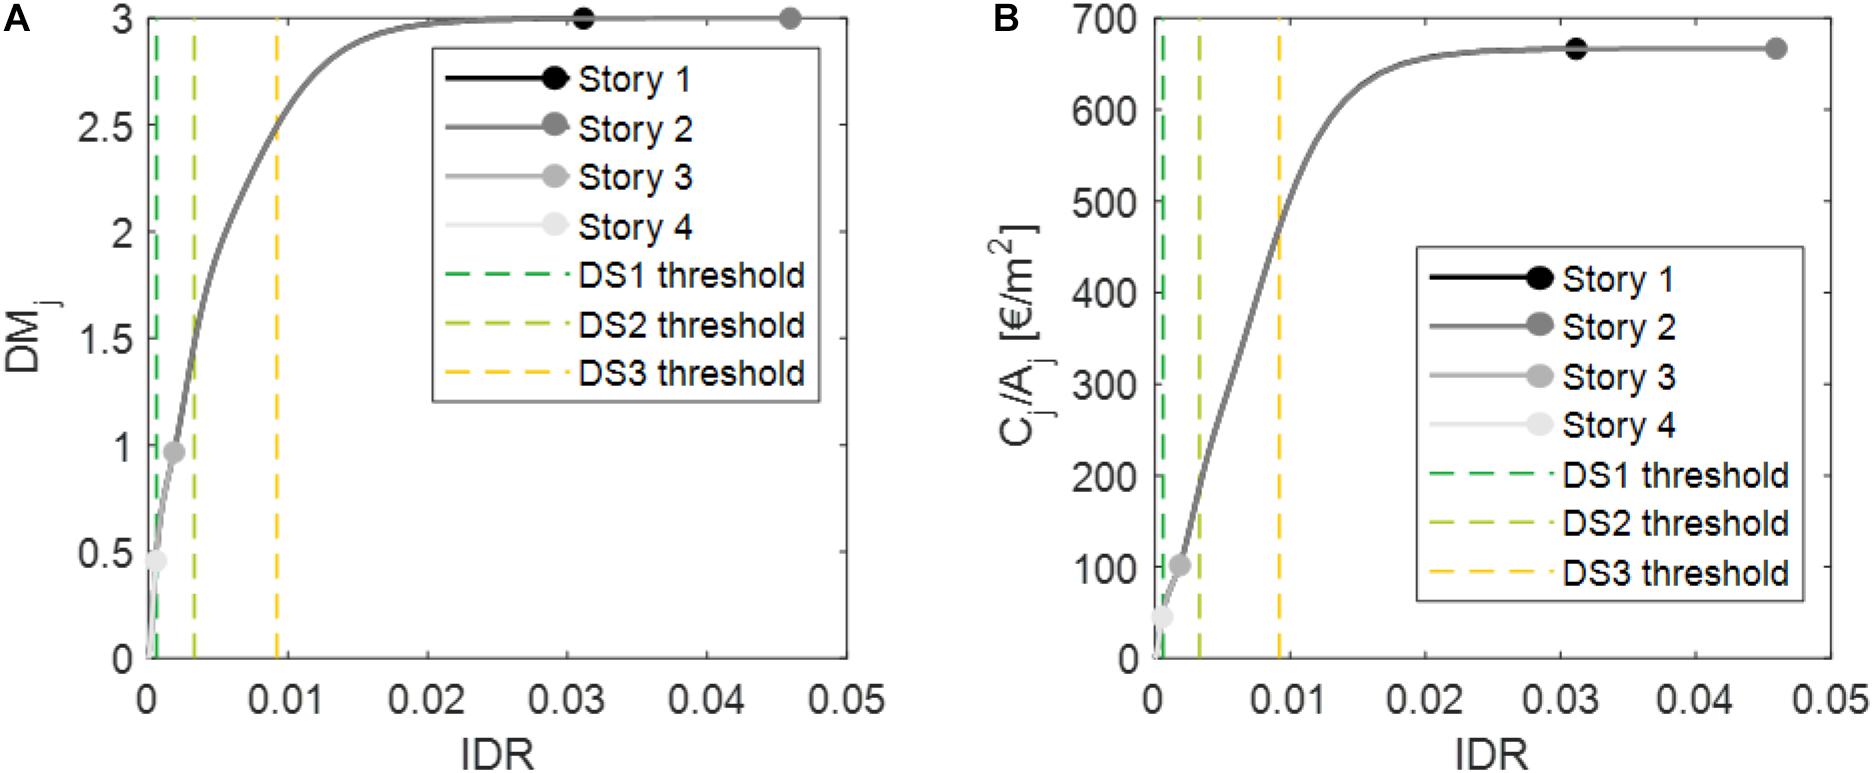
Figure 8. Story-mean damage (DMj) (A) and story-repair cost per story-surface unit (Cj/Aj) (B) depending on IDR–GLD-4 case study.
Then, starting from the SPO results, DMj and Cj/Aj can also be shown depending on the demand PGA, as reported in Figure 9 for the GLD-4 building for each story. Quite a wide range of PGA-values have been considered to obtain the DMj–PGA and Cj/Aj–PGA relationships to clearly show the achievement of a constant plateau in the contribution of infills, partitions, and services to the mean damage and repair cost. Obviously, the higher the demand PGA the higher the contribution to seismic loss due to structural elements (neglected herein); therefore, for high PGA-values, the repair costs obtained and shown in the present work are intended to be a lower bound of the actual repair cost. Anyway, recent studies from the literature demonstrated that, at least until the beginning of DS3 in infills, the total actual repair cost related to existing RC buildings (with generally weak infills) is very well approximated by the lonely cost of infills, partitions, and services (Del Vecchio et al., 2019; Del Gaudio et al., 2020; De Risi et al., 2020).
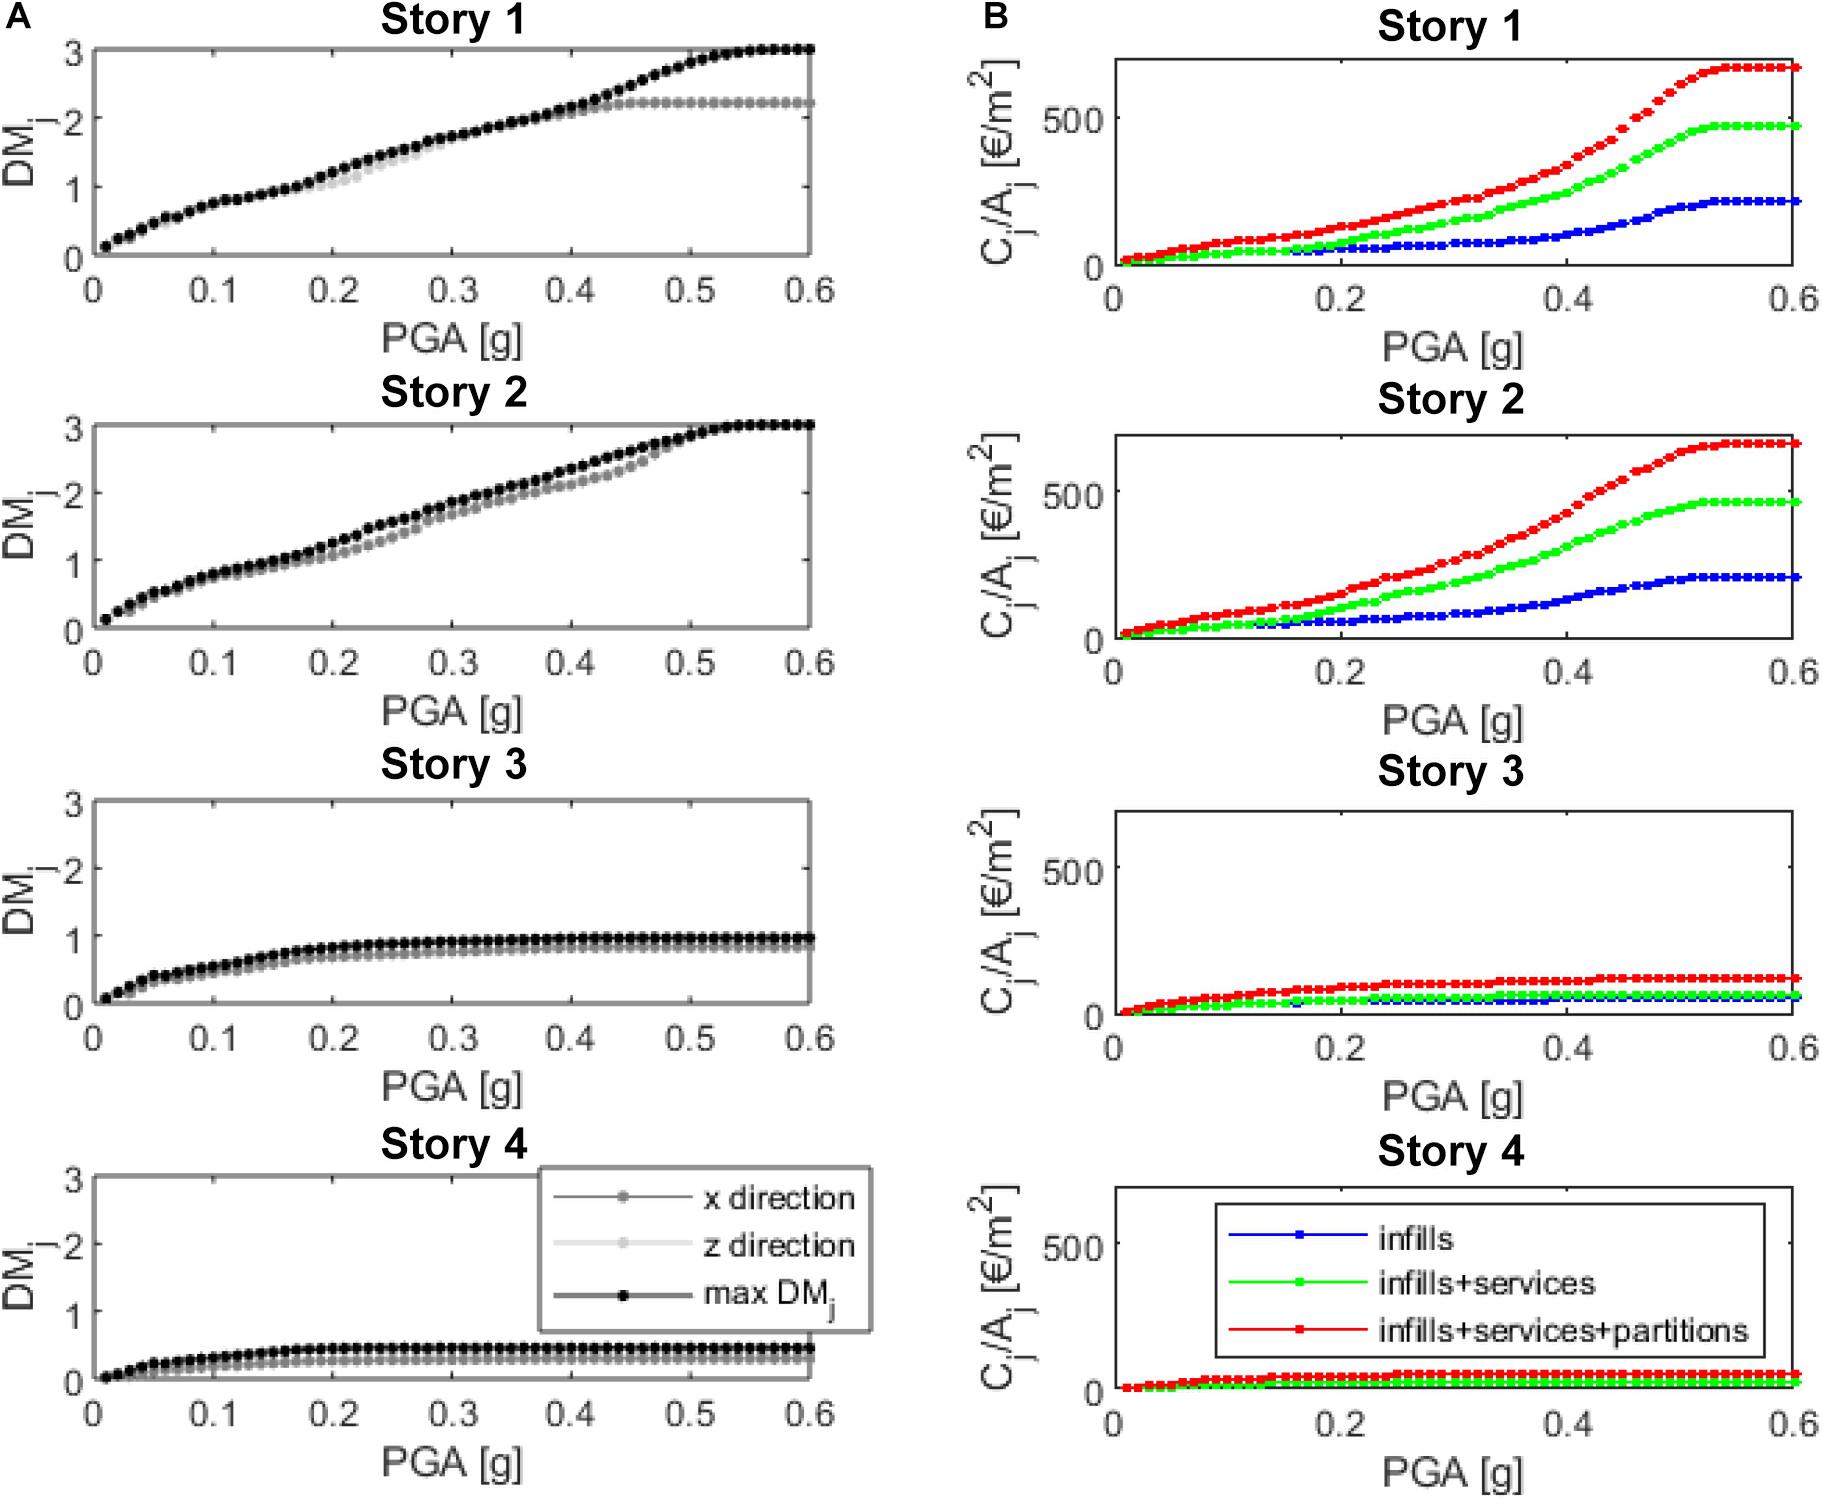
Figure 9. Story-mean damage (DMj) (A) and story-repair cost (Cj) divided by story-surface area (Aj) (B) depending on PGA–GLD-4 case study.
Figure 9 shows, for the GLD-4 building, that the first and the second story reach their maximum story-mean damage (DMj = 3) when PGA > 0.5 g, and, in line with this, their maximum story repair cost. Lower values of DMj and, therefore, costs are achieved at the upper stories, which are not involved in the collapse mechanism (see section “Non-linear Modeling and Analyses Outcomes”). Figure 9A also reports DMj evaluated depending on the direction (X or Z), and their maximum value (max DMj), which almost always coincides with DMj related to the (weaker) transverse (Z) direction. Additionally, Figure 9B shows the contributions to the total Cj/Aj due to each component: services roughly represent 37% of the total Cj/Aj, the remaining cost being infills (34%) and interior partitions (28%).
By summing up DMj and Cj/Aj for all the stories, total DM and total repair cost per building plan area unit (c) are obtained (see Figure 10) depending on the demand PGA. The maximum c values achieved for the GLD-4 building are as follows: 370.2, 254.1, and 122.3 €/m2 for red, green, and blue curves in Figure 10, respectively. This means that the percentage contributions of each component are very close to those found in Figure 9B. Figure 10 also reports the PGA-values corresponding to the first achievement of median IDR capacity thresholds at DSi (with i = 1, 2, 3). It can be noted that, as expected, when p2 begins to be higher than zero (between DS1 and DS2 thresholds reported in Figure 10B), the contribution of services starts to increase since repair cost due to services was assumed to be null at DS1 (see section “Repair Costs Due to Infills and Services”).
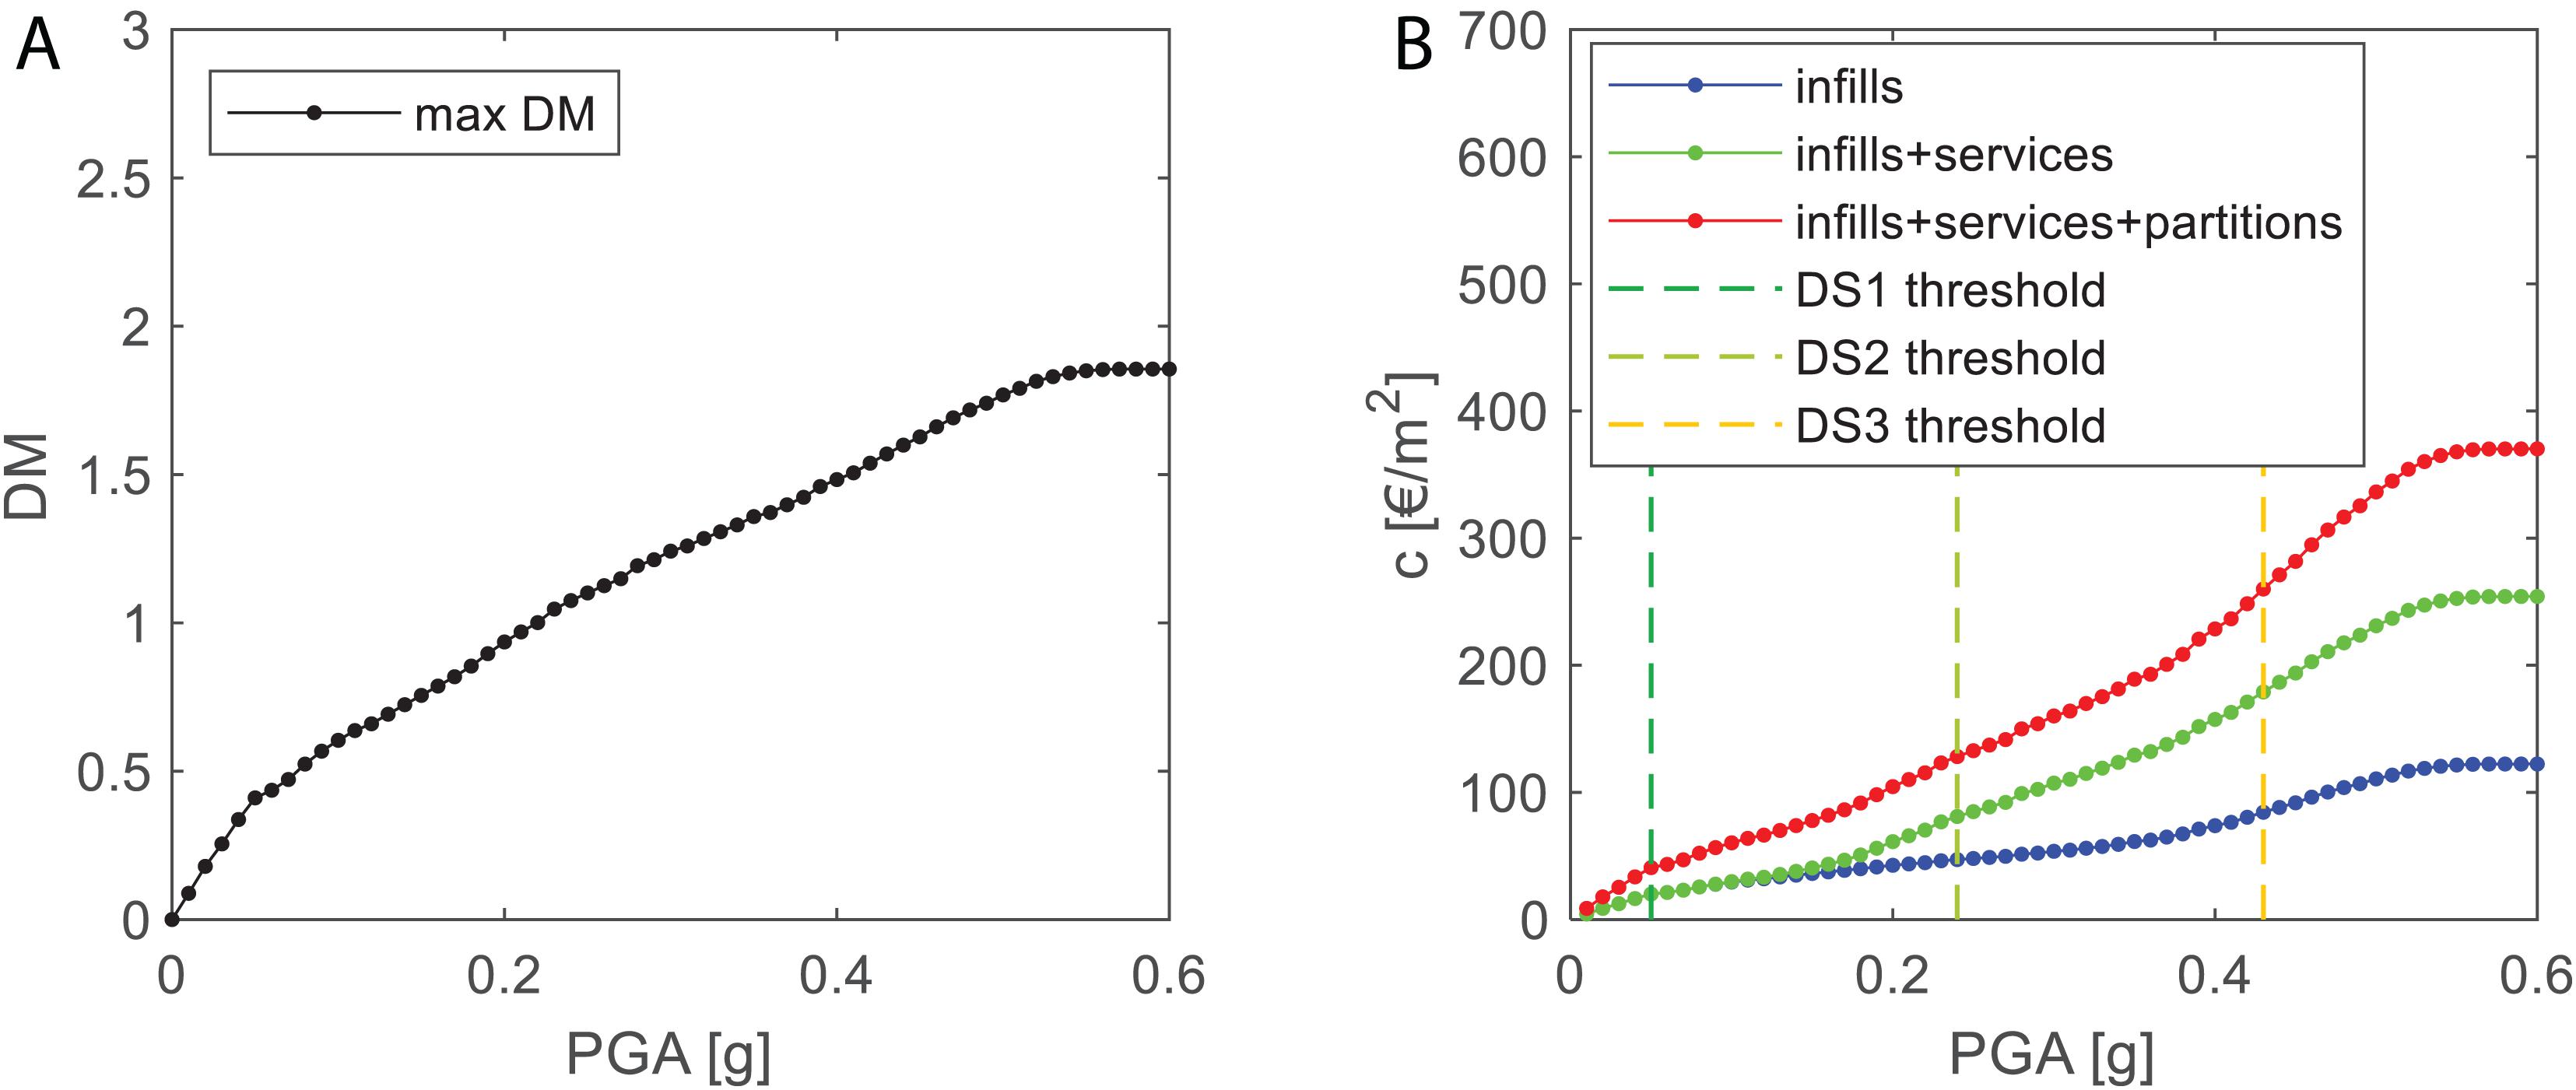
Figure 10. Total mean damage (DM) (A) and story repair cost per building surface unit (B) depending on PGA–GLD-4 case study.
By following the same approach shown in detail for the GLD-4 case study building, similar results about DM and repair cost c can be obtained and compared to each other for all the case study buildings, as described in section “Comparisons and Remarks.”
Comparisons and Remarks
Total mean damage (DM) (Figure 11A) and cost c (Figure 11B) trends depending on PGA can be compared among all the case study buildings, along with their mutual relationship (Figure 11C). It can be noted that, generally, the design typology (GLD or OSLD) does not significantly affect the resulting DM or c, being equal the number of stories. This is true for the selected case study buildings and the selected reference time period due to the specific simulated design, but it should be further checked for different age of constructions before more general conclusions are drawn. On the other hand, the higher the number of stories, the lower the mean damage and repair cost, being equal the demand PGA level, especially for PGA > 0.25g. For this PGA range, if a two-story building and a four-story building are compared (as in Figure 12 for GLD-cases), it can be noted that, being equal the PGA level, the maximum IDR-value achieved in GLD-4 is lower than the maximum IDR in GLD-2 (by considering the stories involved in the relative collapse mechanisms). As a result, as shown in Figure 8, story-repair costs are generally lower for GLD-4 than for GLD-2. It is worth noting that for the investigated cases, differences in terms of repair cost, given a PGA level, are not very pronounced, and this is basically due to the number of stories involved in the collapse mechanism for two-story and four-story buildings. In both story classes, 50% of the total number of stories are invested via the collapse mechanism, and 50% of the story thus contributes to the total repair cost in both cases. If a local (for example the first story only) mechanism occurred for the four-story buildings, the total repair cost divided by the total building area would be significantly lower than c value found for the two-story building. Figure 11A lastly shows the relationship between DM and c: it shows that the repair cost is almost the same for all the case study buildings, being equal the achieved DM level.
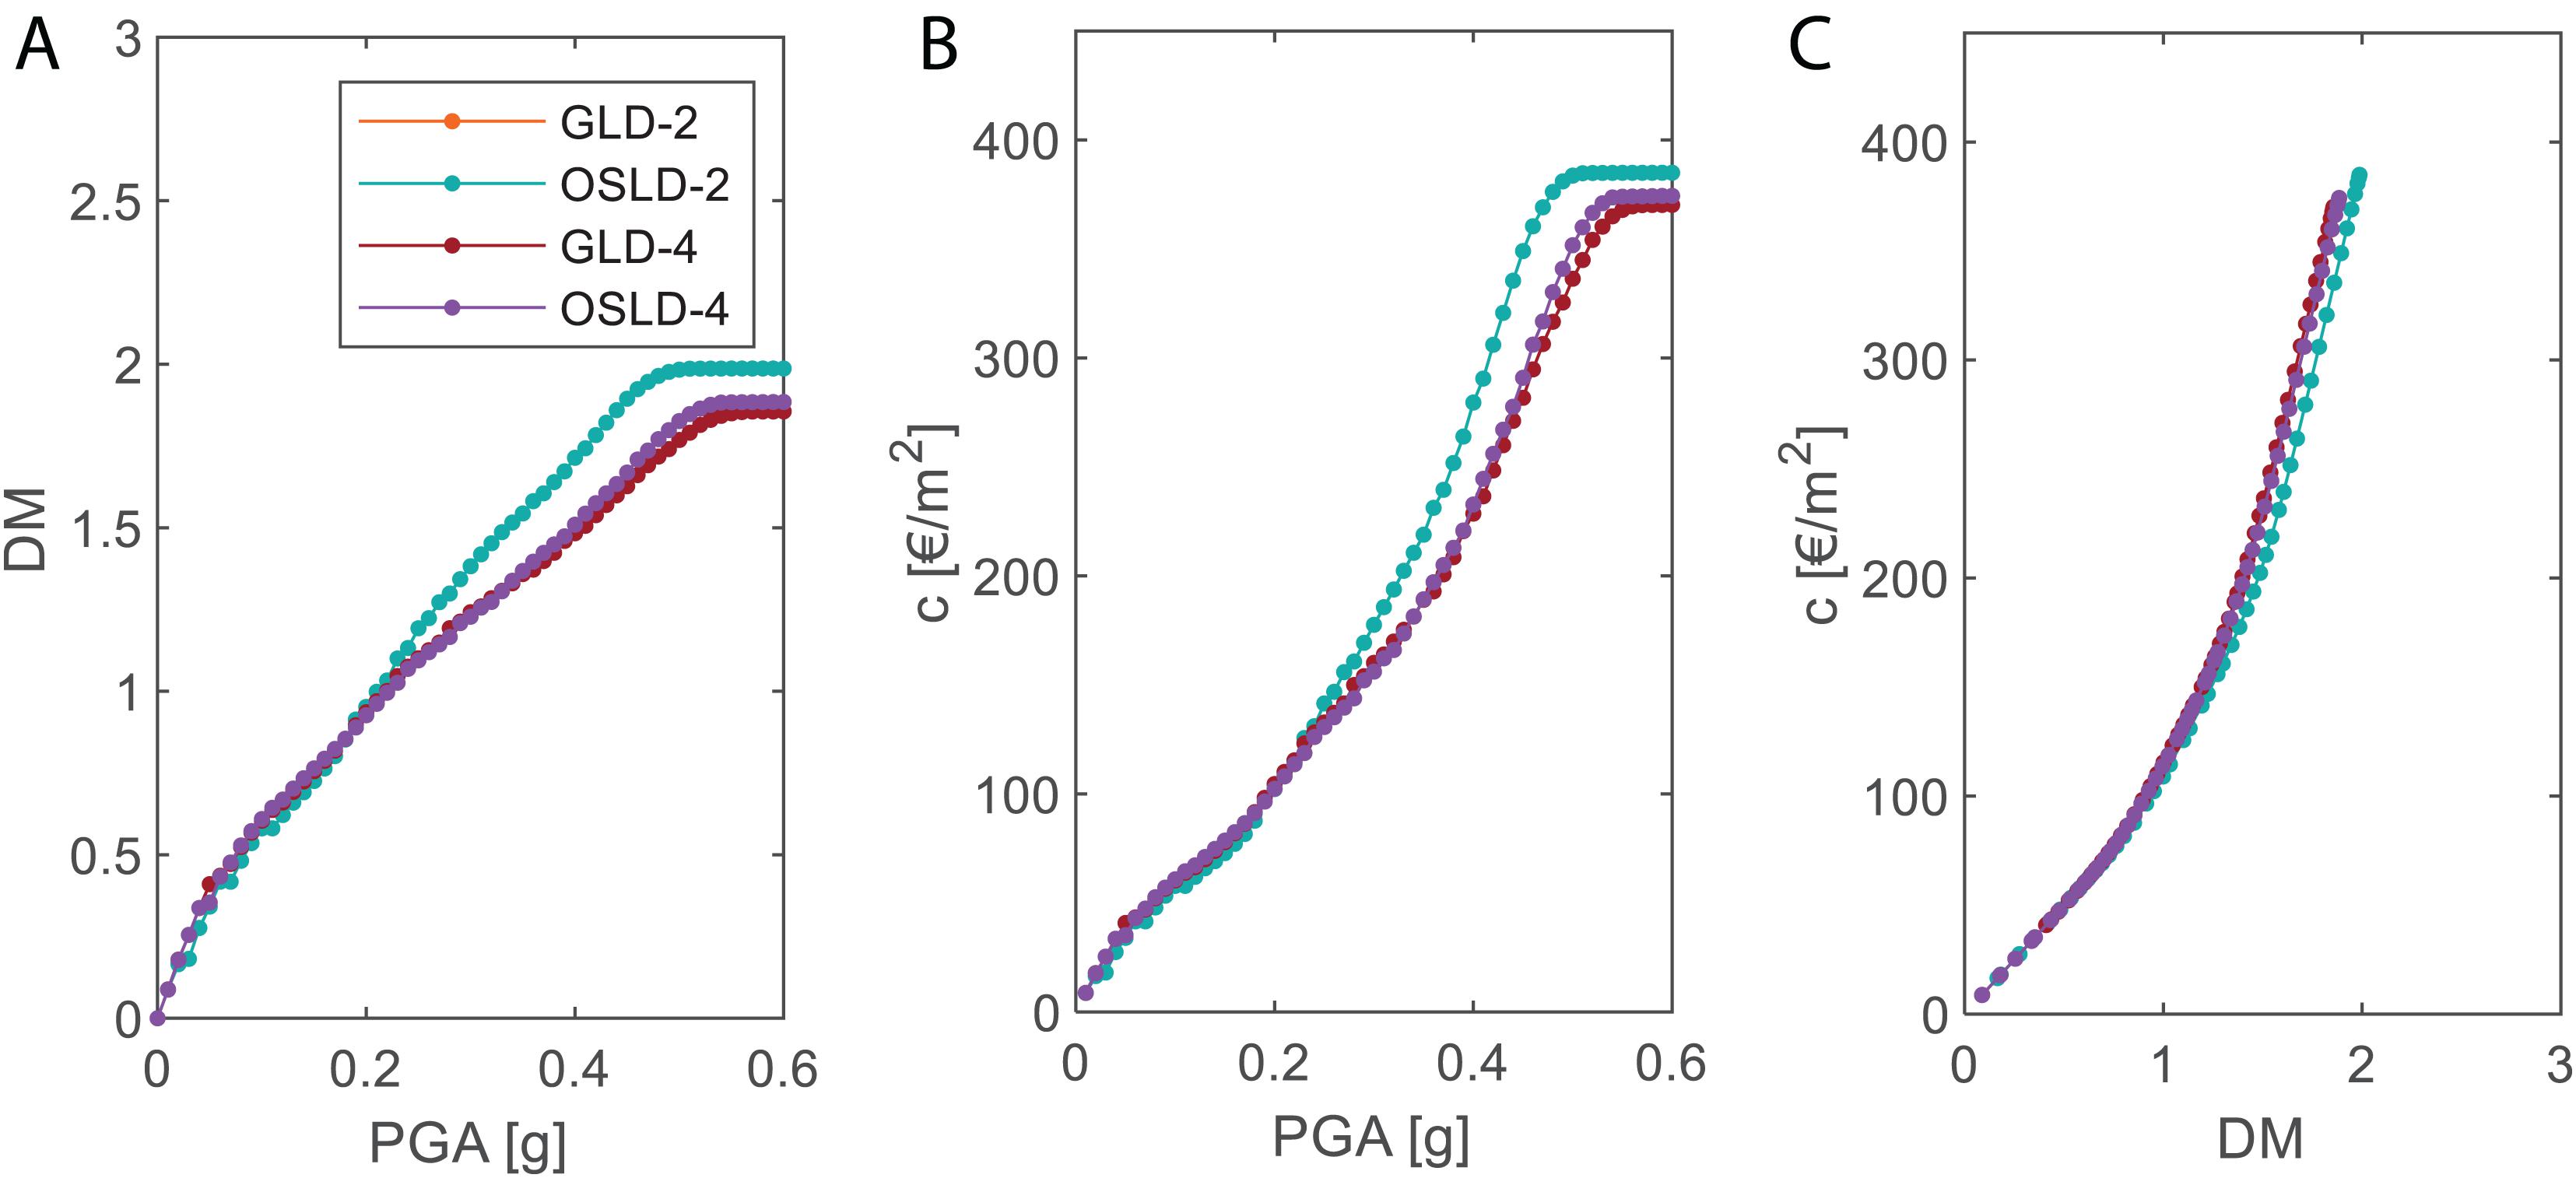
Figure 11. Comparison among case study buildings: total mean damage (DM)-PGA (A), total repair cost c per building area unit (B), DM-c relationship (C).

Figure 12. Comparison between GLD-2 (red) and GLD-4 (blue) being equal the PGA demand (PGA = 0.5 g).
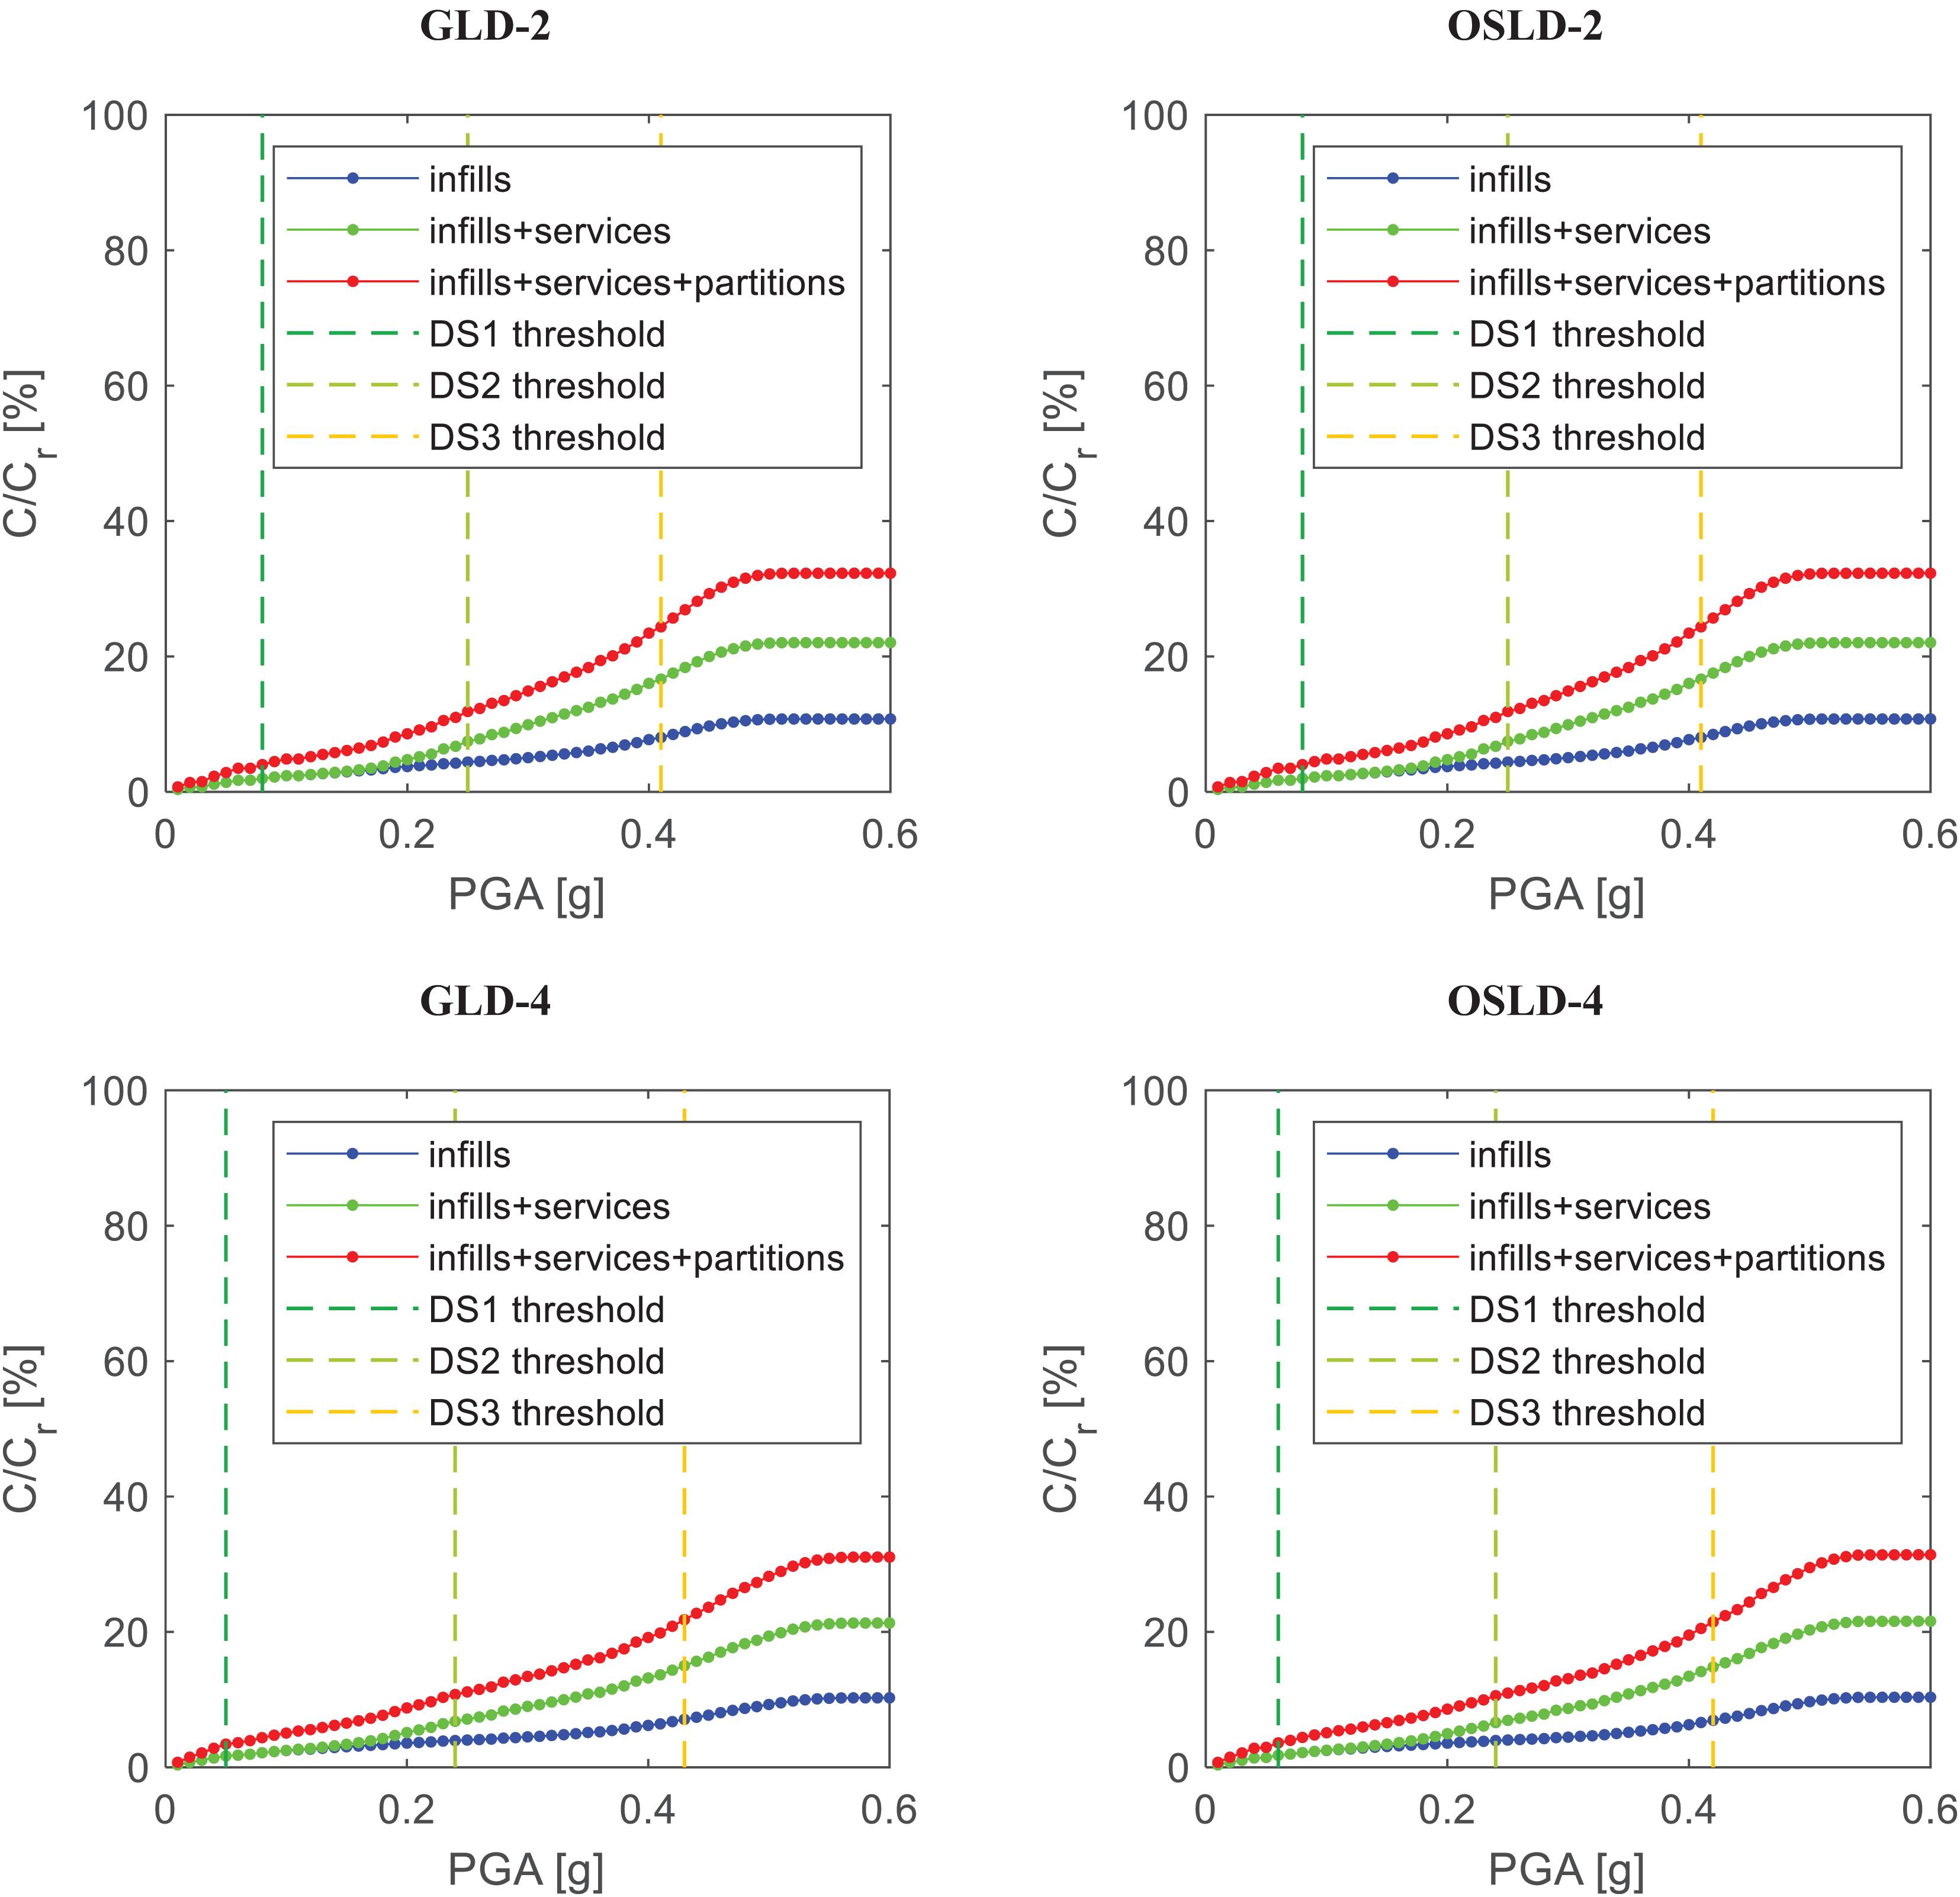
Finally, a very interesting information can be found in Figure 13, where total building repair cost C (in euro) has been divided by the reconstruction cost (Cr), the latter equal to 1,192 €/m2 as suggested by Di Ludovico et al. (2017) for L’Aquila (Italy) city and its neighbor, and it is assumed herein as being representative of the Italian context. First, C/Cr trends results are not significantly different depending on the case study building. Then, it can be noted that, by averaging among the selected buildings:
– when the PGA demand leads to the achievement of the median DS1 threshold in infill panels, the repair cost is roughly equal to the 4% of the reconstruction cost;
– when the PGA demand leads to the achievement of the median threshold of DS2 in infills, the repair cost is equal to about the 12% of Cr; and
– when median threshold of DS3 in infill panels is achieved, C/Cr is equal to the 23%.
Such results are in good agreement with the outcomes found in Cosenza et al. (2018) and Dolce et al. (2019), both based on empirical observations. In particular, Cosenza et al. (2018) and, in line with this, DM (2017) suggest that at Damage Limitation Limit State (DLLS) (CEN, 2004; DM, 2017; NTC, 2018), C/Cr is equal to 15%. By assuming that DS2 (as defined herein) corresponds to DLLS, as suggested in Sassun et al. (2016) and Del Gaudio et al. (2019), the C/Cr-values found for these case study buildings are thus very close to the 15%. This very low difference between C/Cr outcome at DS2 and 15% can also confirm that, at DS2, the repair cost is almost totally due to infills/partitions and services. Additionally, Dolce et al. (2019) found that direct cost-to-reconstruction cost ratios are equal to 2, 10, and 30%, respectively, at DS1, DS2, and DS3, the latter defined according to EMS-98 (Grunthal, 1998) (like those used in this work). The C/Cr found in this work consequently resulted in quite good agreement compared to those suggested in Dolce et al. (2019), especially at DS2.
Conclusion
This study presents damage and loss estimation analyses related to four case studies of residential RC buildings representative of the pre-1970s Italian and Mediterranean building stock. In particular, the contribution of hollow clay masonry infill panels to the lateral response has been modeled in structural analyses. The contribution of infills to the resulting seismic damage [from damage state (DS) DS1 to DS3, according to Del Gaudio et al., 2019] and loss (by means of repairing activities and unit costs analyses) has been highlighted by means of a component-based loss estimation procedure. The investigated buildings were different for number of stories (two or four) or design typology (designed for gravity load only, GLD, or according to obsolete seismic codes, OSLD).
The main findings related to the analysis case study buildings are summarized as follows:
1. SPO curves are only slightly different between GLD-and OSLD-buildings, being equal the number of stories, due to (i) the quite low lateral action (according to old seismic code prescriptions) and the minimum reinforcement amounts prescribed by codes and (ii) the significant percentage incidence of infills (equal for all the case-studies) on the lateral response of the investigated buildings;
2. trends of story-mean damage (DMj) and story-repair cost per story surface unit (Cj/Aj) depending on the Interstory Drift Ratio (IDR) demand are equal for all the case study buildings and only dependent on the infills drift-based fragility curves, unit repair costs, and building geometrical features;
3. total mean damage (DM) and total repair cost c trends depending on peak ground acceleration (PGA) are, generally, not significantly affected by the design typology (GLD or OSLD), being equal to the number of stories;
4. the higher the number of stories, the lower the total mean damage (DM) and cost c; and
5. the total repair cost-to-reconstruction cost ratio is, on average, equal to 4, 12, and 23%, when median IDR capacities of infills at DS1, DS2, and DS3, respectively, are achieved.
Further efforts are necessary to confirm these outcomes and to draw more general conclusions, by considering additional case study buildings, record-to-record and modeling uncertainties, along with damage analysis and repair costs assessment due to structural components. Future works will address these issues.
Data Availability Statement
The original contributions presented in the study are included in the article/supplementary material, further inquiries can be directed to the corresponding author.
Author Contributions
All authors contribute to the present research.
Funding
This work was funded by AXA Research Fund Post-Doctoral Grant “Advanced non-linear modeling and performance assessment of masonry infills in RC buildings under seismic loads: the way forward to design or retrofitting strategies and reduction of losses” (Grant No. E67G17000020007), ReLUIS-DPC 2019–2021 funded by the Italian Department of Civil Protection (DPC) (Grant No. E66C19000190005), and PON-AIM Ricerca e Innovazione 2014–2020—Fondo Sociale Europeo, Azione I.2, “Smart, Secure, and Inclusive Communities” (Grant No. E66C19000230005).
Conflict of Interest
The authors declare that the research was conducted in the absence of any commercial or financial relationships that could be construed as a potential conflict of interest.
Acknowledgments
This support is gratefully acknowledged.
References
Allen, T. I., and Wald, D. J. (2009). On the use of high-resolution topographic data as a proxy for seismic site conditions (Vs30). Bull. Seismol. Soc. Am. 99, 935–943. doi: 10.1785/0120080255
Applied Technology Council [ATC], (2012a). FEMA P-58 Next-Generation Seismic Performance Assessment for Buildings, Volume 1 - Implementation. Washington, DC: Federal Emergency Management Agency.
Applied Technology Council [ATC], (2012b). FEMA P-58 Next-Generation Seismic Performance Assessment for Buildings, Volume 1 - Methodology. Washington, DC: Federal Emergency Management Agency.
Aslani, H., and Miranda, E. (2005). Probabilistic Earthquake Loss Estimation and Loss Disaggregation in Buildings. Research Report no: 157. Stanford, CA: John. A. Blume Earthquake Engineering Center.
Asteris, P. G., Cotsovos, D. M., Chrysostomou, C. Z., Mohebkhah, A., and Al-Chaar, G. K. (2013). Mathematical micromodeling of infilled frames: state of the art. Eng. Struct. 56, 1905–1921. doi: 10.1016/j.engstruct.2013.08.010
Asteris, P. G., Repapis, C. C., Cavaleri, L., Sarhosis, V., and Athanasopoulou, A. (2015). On the fundamental period of infilled RC frame buildings. Struct. Eng. Mech. 54, 1175–1200. doi: 10.12989/sem.2015.54.6.1175
Baggio, C., Bernardini, A., Colozza, R., Coppari, S., Corazza, L., Della Bella, M., et al. (2007). Field manual for post-earthquake damage and safety assessment and short-term countermeasures. JRC Sci. Techn. Rep.
Bal, I. E., Crowley, H., Pinho, R., and Gulay, F. G. (2007). Structural Characteristics of Turkish RC Building Stock in Northern Marmara Region for Loss Assessment Applications. ROSE Research Report No. 2007/03. Pavia: IUSS Press.
Bertoldi, S. H., Decanini, L. D., and Gavarini, C. (1993). “Telai tamponati soggetti ad azioni sismiche, un modello semplificato: confronto sperimentale e numerico,” in Proceedings of the Atti del 6 Convegno Nazionale L’ingegneria sismica in Italia, Siena.
Bramerini, F., Di Pasquale, G., Orsini, G., Pugliese, A., Romeo, R. W., and Sabetta, F. (1995). “Rischio sismico del territorio italiano,” in Proceedings 7th National Conference on Earthquake Engineering in Italy, Siena.
BURA, (2017). BURA (Official Journal of Regione Abruzzo) (n. 10 - 08/03/2017 - ordinary), Price List of Public Works in Abruzzi Region, Italy.
Cardone, D., and Perrone, G. (2015). Developing fragility curves and loss functions for masonry infill walls. Earthq. Struct. 9, 257–279. doi: 10.12989/eas.2015.9.1.257
Cardone, D., Perrone, G., and Flora, A. (2020). Displacement-based simplified seismic loss assessment of pre-70S RC buildings. J. Earthq. Eng. 24(Suppl. 1), 82–113. doi: 10.1080/13632469.2020.1716890
CEN, (2004). Eurocode 8: Design of Structures for Earthquake Resistance - Part 1: General Rules, Seismic Actions and Rules for Buildings. Brussels: European Committee for Standardization.
Chiozzi, A., and Miranda, E. (2017). Fragility functions for masonry infill walls with in-plane loading. Earthq. Eng. Struct. Dyn. 46, 2831–2850. doi: 10.1002/eqe.2934
CNR, (1967). CNR10012/1967, Ipotesi di Carico Sulle Costruzioni. Rome: Centro Nazionale delle Ricerche.
Colonna, E., Molina, C., and Petrini, V. (1994). Criteri di valutazione della vulnerabilità sismica del patrimonio edilizio esistente sul territorio nazionale. Ingegner. Sism. 1, 15–24.
Cosenza, E., Del Vecchio, C., Di Ludovico, M., Dolce, M., Moroni, C., Prota, A., et al. (2018). The Italian guidelines for seismic risk classification of constructions: technical principles and validation. Bull. Earth. Eng. 16, 5905–5935. doi: 10.1007/s10518-018-0431-8
Crisafulli, F. J. (1997). Seismic Behaviour of Reinforced Concrete Structures with Masonry Infills. Ph. D thesis, University of Canterbury, Canterbury.
De Risi, M. T., Del Gaudio, C., Ricci, P., and Verderame, G. M. (2018). In-plane behaviour and damage assessment of masonry infills with hollow clay bricks in RC frames. Eng. Struct. 168, 257–275. doi: 10.1016/j.engstruct.2018.04.065
De Risi, M. T., Del Gaudio, C., and Verderame, G. M. (2019). Evaluation of repair costs for masonry infills in rc buildings from observed damage data: the case study of the 2009 L’Aquila Earthquake. Buildings 9:122. doi: 10.3390/buildings9050122
De Risi, M. T., Del Gaudio, C., and Verderame, G. M. (2020). A component-level methodology to evaluate the seismic repair costs of infills and services for Italian RC buildings. Bul. Earthq. Eng. doi: 10.1007/s10518-020-00944-7
Decanini, L. D., Liberatore, L., and Mollaioli, F. (2014). Strength and stiffness reduction factors for infilled frames with openings. Earthq. Eng. Eng. Vibr. 13, 437–454. doi: 10.1007/s11803-014-0254-9
Del Gaudio, C., De Risi, M. T., and Verderame, G. M. (2020). “Toward a simplified evaluation of seismic repair costs for RC buildings with masonry infills,” in Proceedings of the 17th World Conference on Earthquake Engineering, 17WCEE, Sendai.
Del Gaudio, C., Ricci, P., and Verderame, G. M. (2018). A class-oriented mechanical approach for seismic damage assessment of RC buildings subjected to the 2009 L’Aquila earthquake. Bull. Earthq. Eng. 16, 4581–4605. doi: 10.1007/s10518-018-0365-1
Del Gaudio, M. T., De Risi, C., Ricci, P., and Verderame, G. M. (2019). Empirical drift-fragility functions and loss estimation for infills in reinforced concrete frames under seismic loading. Bull. Earthq. Eng. 17, 1285–1330. doi: 10.1007/s10518-018-0501-y
Del Vecchio, C., Di Ludovico, M., Pampanin, S., and Prota, A. (2018). Repair costs of existing RC buildings damaged by the L’Aquila earthquake and comparison with FEMA P-58 predictions. Earthq. Spect. 34, 237–263. doi: 10.1193/122916eqs257m
Del Vecchio, C., Di Ludovico, M., and Prota, A. (2019). Repair costs of RC building components: from actual data analysis to calibrated consequence functions. Earthq. Spectr. 36:194.
Di Ludovico, M., Prota, A., Moroni, C., Manfredi, G., and Dolce, M. (2017). Reconstruction process of damaged residential buildings outside historical centres after the L’Aquila earthquake: part II—heavy damage reconstruction. Bull. Earthq. Eng. 15, 693–729. doi: 10.1007/s10518-016-9979-3
Di Pasquale, G., and Orsini, G. (1998). “A probabilistic model for the assessment of the earthquake economic losses in Italy,” in Proceedings of the International Conference ‘Risk Analysis 98’, Valencia.
Di Pasquale, G., Orsini, G., and Romeo, R. W. (2005). New developments in seismic risk assessment in Italy. Bull. Earthq. Eng. 3, 101–128. doi: 10.1007/s10518-005-0202-1
Di Trapani, F., Bolis, V., Basone, F., and Preti, M. (2020). Seismic reliability and loss assessment of RC frame structures with traditional and innovative masonry infills. Eng. Struct. 208:110306. doi: 10.1016/j.engstruct.2020.110306
Di Trapani, F., Shing, P. B., and Cavaleri, L. (2018). Macroelement model for in-plane and out-of-plane responses of masonry infills in frame structures. J. Struct. Eng. 144:04017198. doi: 10.1061/(asce)st.1943-541x.0001926
DM, (2017). D.M 58 28/02/2017 Allegato A: Linee Guida per la Classificazione del Rischio Sismico delle Costruzioni (in Italian). Italian Ministry of Infrastructures and Transport, Italy. Available online at: http://www.mit.gov.it/normativa/decreto-ministeriale-numero-58-del-28022017 (accessed January, 2020).
Dolce, M., Borzi, B., Da Porto, F., Faravelli, M., Lagomarsino, S., Magenes, G., et al. (2019). “Mappe di rischio per il territorio Italiano,” in Proceedings of the Atti del XVIII Convegno ANIDIS-L’Ingegneria Sismica in Italia, Ascoli Piceno.
Dolce, M., and Goretti, A. (2015). Building damage assessment after the 2009 Abruzzi earthquake. Bull. Earthq. Eng. 13, 2241–2264. doi: 10.1007/s10518-015-9723-4
El-Dakhakhni, W. W., Elgaaly, M., and Hamid, A. A. (2003). Three-strut model for concrete masonry-infilled steel frames. J. Struct. Eng. 129, 177–185. doi: 10.1061/(asce)0733-9445(2003)129:2(177)
Filippou, C. A., Chrysostomou, C. Z., and Kyriakides, N. C. (2019). “Numerical modeling of masonry-infilled RC frame strengthened with TRM,” in Proceedings of the Compdyn 2019 Conference, Crete Island.
Forte, G., Chioccarelli, E., Cito, P., De Falco, M., Santo, A., and Iervolino, I. (2019). Seismic soil classification of Italy based on surface geology and shear-wave velocity measurements. Soil Dyn. Earthq. Eng. 122, 79–93. doi: 10.1016/j.soildyn.2019.04.002
Furtado, A., Rodrigues, H., Arêde, A., and Varum, H. (2016). Simplified macro-model for infill masonry walls considering the out-of-plane behaviour. Earthq. Eng. Struct. Dyn. 45, 507–524. doi: 10.1002/eqe.2663
Gazzetta Ufficiale, (1684/1962). D.M. L.1684/1962 Legge 25 Novembre 1962, n. 1684, Gazzetta Ufficiale 22 Dicembre 1684, n. 326, Provvedimenti per l’edilizia, con Particolari Prescrizioni per le zone Sismiche. Italian Law dealing with prescription in seismic zones for construction.
Grunthal, G. (1998). Cahiers du Centre Europeen de Geodynamique et de Seismologie: volume 15—European Macroseismic Scale 1998. Luxembourg: European Center for Geodynamics and Seismology.
Guagenti, E., Molina, C., and Mulas, G. (1988). Seismic risk analysis with predictable models. Earthq. Eng. Struct. Dyn. 16, 343–359. doi: 10.1002/eqe.4290160305
Hashemi, S. A., and Mosalam, K. M. (2007). Seismic Evaluation of Reinforced Concrete Buildings Including Effects of Infill Masonry Walls. Berkeley: University of California.
Landi, L., Saborio-Romano, D., Welch, D. P., and Sullivan, T. J. (2020). Displacement-based simplified seismic loss assessment of post-70s RC buildings. J. Earthq. Eng. 24(Suppl. 1), 114–145. doi: 10.1080/13632469.2020.1735577
Mainstone, R. J. (1971). “On the stiffnesses and strengths of infilled frames,” in Proceedings Inst. Civil Eng. (Suppl. 4), (Garston: Building Research Station), 57–90.
Masi, A., Digrisolo, A., and Santarsiero, G. (2014). Concrete strength variability in Italian RC buildings: analysis of a large database of core tests. Appl. Mech. Mater. 597, 283–290. doi: 10.4028/www.scientific.net/amm.597.283
McKenna, F. (2011). OpenSees: a framework for earthquake engineering simulation. Comput. Sci. Eng. 13, 58–66. doi: 10.1109/MCSE.2011.66
Morandi, P., Hak, S., and Magenes, G. (2018). Performance-based interpretation of in-plane cyclic tests on RC frames with strong masonry infills. Eng. Struct. 156, 503–521. doi: 10.1016/j.engstruct.2017.11.058
NTC (2018). Decreto Ministeriale 17 Gennaio 2018 – Norme Tecniche per le Costruzioni NTC2018. Supplemento Ordinario n. 8 Gazzetta Ufficiale 20 Febbraio 2018, 42.
O’Reilly, G. J., and Sullivan, T. J. (2018). Probabilistic seismic assessment and retrofit considerations for Italian RC frame buildings. Bull. Earthq. Eng. 16, 1447–1485. doi: 10.1007/s10518-017-0257-9
Panagiotakos, T. B., and Fardis, M. N. (1996). “Seismic response of infilled RC frames structures,” in Proceedings of the 11th World Conference on Earthquake Engineering, Acapulco.
Polyakov, S. V. (1960). On the interaction between masonry filler walls and enclosing frame when loaded in the plane of the wall. Transl. Earthq. Eng. 2, 36–42.
Pradhan, B., and Cavaleri, L. (2020). IP-OOP interaction in URM infilled frame structures: a new macro-modelling proposal. Eng. Struct. 224:111211. doi: 10.1016/j.engstruct.2020.111211
R. D. Regio Decreto Legge n. 2105. del 22/11/1937, (1937). R.D. Regio Decreto Legge n. 2105 del 22/11/1937 - Norme Tecniche di edilizia con Speciali Prescrizioni per le Località Colpite dai Terremoti, G.U. n. 298 del 27/12/1937. Italian Laws dealing with costructions in seismic zones.
R. D. Regio Decreto Legge n. 2229 del 16/11/1939, (1939). R.D. Regio Decreto Legge n. 2229 del 16/11/1939 Norme per la Esecuzione delle opere in Conglomerate Cementizio Semplice od Armato. G.U. n. 92 del 18/04/1940. Italian Laws dealing with costructions in seismic zones.
Ricci, P., De Risi, M. T., Verderame, G. M., and Manfredi, G. (2013). Influence of infill distribution and design typology on seismic performance of low-and mid-rise RC buildings. Bull. Earthq. Eng. 11, 1585–1616. doi: 10.1007/s10518-013-9453-4
Ricci, P., Di Domenico, M., and Verderame, G. M. (2019a). Out-of-plane seismic safety assessment of URM infills accounting for the in-plane/out-of-plane interaction in a nonlinear static framework. Eng. Struct. 195, 96–112. doi: 10.1016/j.engstruct.2019.05.088
Ricci, P., Manfredi, V., Noto, F., Terrenzi, M., De Risi, M. T., Di Domenico, M., et al. (2019b). “RINTC-e: towards seismic risk assessment of existing residential reinforced concrete buildings in Italy,” in Proceedings of the 7th ECCOMAS Thematic Conference on Computational Methods in Structural Dynamics and Earthquake Engineering, Crete.
Rossi, A., Morandi, P., Milanesi, R. R., and Magenes, G. (2019). “Economic and technical advantages of an innovative infill solution in the seismic response of RC buildings,” in Proceedings of the 4th International Workshop on the Seismic Performance of NonStructural Elements, Pavia.
Rosti, A., Del Gaudio, C., Rota, M., Ricci, P., Di Ludovico, M., Penna, A., et al. (2020). Empirical fragility curves for Italian residential RC buildings. Bull. Earthq. Eng. 61, 357–374. doi: 10.1007/s10518-020-00971-4
Sassun, K., Sullivan, T. J., Morandi, P., and Cardone, D. (2016). Characterising the in-plane seismic performance of infill masonry. Bull. N. Zeal. Soc. Earthq. Eng. 49, 100–117.
Sezen, H., and Moehle, J. P. (2004). Shear strength model for lightly reinforced concrete columns. J. Struct. Eng. 130, 1692–1703. doi: 10.1061/(asce)0733-9445(2004)130:11(1692)
Šipoš, T. K., Hadzima-Nyarko, M., Miličević, I., and Grubišić, M. (2018). “Structural performance levels for masonry infilled frames,” in Proceedings of the 16th European Conference on Earthquake Engineering, Thessaloniki.
Stavridis, A., and Shing, P. B. (2010). Finite-element modeling of nonlinear behavior of masonry-infilled RC frames. J. Struct. Eng. 136, 285–296. doi: 10.1061/(asce)st.1943-541x.116
Stucchi, M., Akinci, A., Faccioli, E., Gasperini, P., Malagnini, L., Meletti, C., et al. (2004). Mappa di Pericolosità Sismica del Territorio Nazionale. Available online at: http://zonesismiche.mi.ingv.it/documenti/rapportoconclusivo.pdf (accessed January, 2020).
Stucchi, M., Meletti, C., Montaldo, V., Crowley, H., and Calvi, G. M. (2011). Seismic hazard assessment (2003- 2009) for the Italian building code. Bull. Seismol. Soc. Am. 101, 1885–1911. doi: 10.1785/0120100130
Vamvatsikos, D., and Cornell, C. A. (2006). Direct estimation of the seismic demand and capacity of oscillators with multi-linear static pushovers through IDA. Earthq. Eng. Struct. Dyn. 35, 1097–1117. doi: 10.1002/eqe.573
Verderame, G. M., Polese, M., Mariniello, C., and Manfredi, G. (2010). A simulated design procedure for the assessment of seismic capacity of existing reinforced concrete buildings. Adv. Eng. Softw. 41, 323–335. doi: 10.1016/j.advengsoft.2009.06.011
Verderame, G. M., and Ricci, P. (2018). An empirical approach for nonlinear modelling and deformation capacity assessment of RC columns with plain bars. Eng. Struct. 176, 539–554. doi: 10.1016/j.engstruct.2018.09.022
Verderame, G. M., Ricci, P., Esposito, M., and Manfredi, G. (2012). STIL v1.0 - Software per la Caratterizzazione delle Proprietà Meccaniche degli Acciai da c.a. tra il 1950 e il 2000. ReLUIS. Available online at: http://www.reluis.it/ (accessed January, 2020).
Wald, D. J., and Allen, T. I. (2007). Topographic slope as a proxy for seismic site conditions and amplification. Bull. Seismol. Soc. Am. 97, 1379–1395. doi: 10.1785/0120060267
Keywords: seismic loading, RC buildings, masonry infills, non-linear modeling, fragility curves, economic loss estimation
Citation: Del Gaudio C, De Risi MT, Scala SA and Verderame GM (2020) Seismic Loss Estimation in Pre-1970 Residential RC Buildings: The Role of Infills and Services in Low–Mid-Rise Case Studies. Front. Built Environ. 6:589230. doi: 10.3389/fbuil.2020.589230
Received: 30 July 2020; Accepted: 14 October 2020;
Published: 26 November 2020.
Edited by:
Luigi Di Sarno, University of Liverpool, United KingdomReviewed by:
Fabio Di Trapani, Politecnico di Torino, ItalyLiborio Cavaleri, University of Palermo, Italy
Paolo Morandi, EUCENTRE, Italy
Copyright © 2020 Del Gaudio, De Risi, Scala and Verderame. This is an open-access article distributed under the terms of the Creative Commons Attribution License (CC BY). The use, distribution or reproduction in other forums is permitted, provided the original author(s) and the copyright owner(s) are credited and that the original publication in this journal is cited, in accordance with accepted academic practice. No use, distribution or reproduction is permitted which does not comply with these terms.
*Correspondence: Maria Teresa De Risi, bWFyaWF0ZXJlc2EuZGVyaXNpQHVuaW5hLml0
 Carlo Del Gaudio
 Maria Teresa De Risi
 Santa Anna Scala
 Gerardo Mario Verderame

