
94% of researchers rate our articles as excellent or good
Learn more about the work of our research integrity team to safeguard the quality of each article we publish.
Find out more
ORIGINAL RESEARCH article
Front. Built Environ., 09 September 2020
Sec. Construction Management
Volume 6 - 2020 | https://doi.org/10.3389/fbuil.2020.563353
This article is part of the Research TopicSystems for Construction ManagementView all 6 articles
 Tomoyuki Gondo*
 Reiji Miura
Although several methods have been used to capture the motion of workers at construction sites to improve productivity or safety during construction projects, collecting data by image analysis and discriminating between motions are time-consuming processes. Therefore, it is difficult to use such methods to detect the motion of several workers or over a long time period. The authors applied an accelerometer to capture motion; this apparatus has been used in the health and medical fields. A small, light accelerometer and a simple discrimination program allowed the authors to determine whether a worker was active or inactive based on a threshold of the sum of the signal amplitude areas. Experimental surveys were conducted at construction sites: first, for setting plasterboards for two detached house construction projects and, second, for setting rebar at a large office building site. The findings of this experimental study are as follows. First, an accelerometer can be used in congested construction sites, and data can be obtained continuously. Second, this simple identification of active/inactive workers allows for the measurement of performance and the detection of problems at construction sites. Third, from the data, the hypothesis regarding workers’ tendencies can be tested, that is, how workers’ skill levels may affect the fluctuation of activity intensity. Therefore, in future studies, by increasing the data on workers, researchers could develop methods to improve the performance of workers.
In recent years, several new technologies have been introduced to improve productivity in building construction in response to the demands for reduced costs or the severe shortage of workers globally. For example, the number of workers in the Japanese construction industry decreased from 6.85 million in 1997 to 4.92 million in 2016 (Labour Force Survey, 2018). Generally, construction productivity reflects the relationship between an output and an input, including costs, time, and labor. To increase productivity, one effective method is to measure workers’ performance at construction sites and detect whether their time is being wasted and to identify possibilities for improving productivity, which will affect the output (quality, value among others) and the input (time, cost, labor among others). Dixit et al. (2019) listed seven main research areas in recent construction productivity studies, including measurement techniques. Moreover, to estimate whether or not new technologies have improved workers’ performance, it is necessary to compare their performance before and after the application of such tools. Therefore, visual observation or other several methods have been applied, and some of them have successfully detected workers’ motions in detail (Akhavian and Behzadan, 2016; Zhang et al., 2018). However, in some cases, it is difficult to apply such techniques widely at construction sites because they require long periods of data collection and a large number of workers (i.e., up to several hundreds or even thousands) and because there are many obstacles particularly in building construction sites for visual observation. In addition, by increasing the amount of data, it can become possible to analyze workers’ activity by deep learning or other methods (Ramasamy and Roy, 2018). Thus, one alternative consists of developing a new method to capture the activity at a lower cost and in less time despite the lower level of accuracy.
Besides improving performance and safety at construction sites, it is essential to understand the tendency of workers’ activity at construction sites quantitatively, such as the kinds of building parts that take more time to install or the differences between the movement of skilled and unskilled workers. The workers and managers at construction sites have a great deal of knowledge and experience regarding worker tendencies. However, few previous studies have focused on the tendencies of the activity of workers at construction sites quantitatively because only a few ways exist to collect large amounts of data on workers at construction sites with an acceptable level of effort. If we can identify some tendencies of construction worker activity, we can propose more acceptable improvements to the performance of construction workers.
To solve these problems, we decided to use an accelerometer to detect motion of workers. Small, lightweight accelerometers have been widely applied in the medical and health fields to measure exercise intensity and to categorize different types of movement (Godfrey et al., 2008). If we apply accelerometers to workers at construction sites, we can collect a large amount of data on workers more inexpensively in less time. Of course, the accuracy of data from accelerometers is lower than that of other previously used methods, such as image analysis, which aims to discriminate between different actions specifically (Bai et al., 2012). However, this simple method allows us to capture changes in the performance of workers before and after the application of new technology. Moreover, the tendency of movements can be identified over a long period of time, allowing us to quantify data gathered from the movements of many people.
The present study aims to develop a method to attach small accelerometers to workers at construction sites to capture the motion of workers easily, as well as to clarify the effectiveness of this method and to identify problems based on experimental trials at several construction sites. To this end, first, the authors compared and examined several accelerometers that can be used at construction sites in terms of weight, the data recording method, and accuracy. Moreover, a program for discriminating between active and inactive workers based on the obtained acceleration data was developed referring to a previous research study (Mathie et al., 2003). Finally, at three construction sites with two detached houses (section” Result 1: Two Construction Sites With Detached Houses”) and a large-scale office building (Result 2: A Large Office Building Construction Site), the authors attached accelerometers to several workers to verify the possibility of acquiring acceleration data using this technique.
To capture workers’ motions at construction sites, various methods have been used to improve safety, productivity, quality, and so forth. Instead of time-consuming recording methods based on human observation and classification, one typical method involves measuring workers’ movements by image analysis or computer vision. As a fundamental technology to track workers, a vision-tracking method was developed to distinguish construction workers from other elements in congested outdoor situations (Park and Ioannis, 2012; Lim et al., 2016), as well as a real-time location system to detect the movements and locations of multiple workers by radiofrequency identification tags with accelerometers, and the researchers verified the effectiveness of their tools at real construction sites. The wireless real-time video monitoring system (WRITE) was also developed to analyze sequences of images of workers and was applied to the construction of a bridge (Kim et al., 2009; Bai et al., 2012). Zhu et al. (2017) used data from construction site videos to detect and track multiple construction objects simultaneously. Moreover, Peddi (2008) captured the poses of workers from a sequence of images at construction sites and employed artificial intelligence to categorize them as instances of ineffective or contributory work. In a study focused on materials, Hamledari et al. (2017) developed a vision-based algorithm that automatically detects the components of an interior partition and validates the data by images captured by UAVs, smartphones, and the Internet. Yu et al. (2019) designed a vision-based three-dimensional (3D) motion capture algorithm to model the motion of various body parts using an RGB camera to monitor fatigue among construction workers. Ham and Kamari (2019) proposed a method to automatically retrieve photo-worthy frames containing construction-related contents from large-scale visual data captured via UAVs. Although these methods have advantages when detecting workers’ poses or motions specifically without attaching devices to workers’ bodies, in some cases, it is difficult to record several workers moving simultaneously in congested construction sites with many obstacles that hide workers from the vision-tracking system. In addition, as Ham and Kamari (2019) pointed out, there is a problem of visual data overload when these image analyses are applied for longer durations.
Moreover, several researchers have applied sensors at construction sites to focus on the safety of construction workers in severe conditions. Cheng et al. (2013) employed a wideband wireless position sensor and a biometric sensor to determine the location and physiological status of workers to help them avoid unsafe behaviors. Valero et al. (2017) developed inertial measurement unit (IMU) devices to detect awkward postures and decrease the risk of musculoskeletal disorders. In a similar study, a wearable IMU was created to estimate the balance of construction workers to prevent falls (Umer et al., 2018). Han and Lee (2013) developed a vision-based unsafe action detection system for behavior monitoring and tested it by video data related to ladder climbing. In another approach, Yantao et al. (2019) introduced an automatic workload assessment method to assess workers’ joints using image-based, 3D posture-capturing smart insoles.
For an example of how an accelerometer can be installed at a construction site in a way that mirrors the methodology of the present study, Joshua and Varghese (2011, 2014) investigated the feasibility of utilizing wearable accelerometers attached to masonry workers’ waists for automated activity classification. Moreover, similar methods to capture basic motion at construction sites have been developed and verified (Akhavian and Behzadan, 2016; Zhang et al., 2018), such as transporting items, connecting steel bars, and sawing, by using accelerometers and gyroscopes in smartphones. Another approach applied a wristband-type activity tracker to discriminate masonry workers’ hand movements in the laboratory (Ryu et al., 2018). The authors of these studies attempted to classify several kinds of tasks for workers with different occupations at construction sites, but developing a detailed versatile classification system for this purpose is difficult. For example, setting plasterboard and connecting steel bars entail completely different motions, and the suitable position for attaching sensors may differ, although the basic motions of walking or resting remain the same. Moreover, the motions of workers engaged in the same task may vary according to individual differences or the nature of the work. In addition, some of the previous experiments were simulated in a laboratory, where the researchers asked participants to move in a certain way. Thus, overall, researchers have not considered the problems involved at a congested building construction site.
Because of these difficulties of doing this type of research at building construction sites, attaching sensors to machines or materials is a feasible approach to detecting a specific type of work. In the civil engineering field, it is easier to detect whether machinery is moving or not. Akhavian and Behzadan (2015) used smartphones to verify the operational status of civil engineering and construction equipment. Moreover, KOMTRAX’s business model (Hirano, 2010) connects the construction equipment at a site for maintenance and consulting to collect data from a large number of machines in civil engineering work. In one example, strain sensors and accelerometers were attached to a steel structural frame to monitor the automated construction process (Harichandran et al., 2019), and an ultra-wideband system was attached to workers, materials, and equipment for location tracking in large, open-air construction environments (Cheng et al., 2011).
In fields other than construction, particularly in the medical and health fields, there have been many studies on motion analysis using accelerometers. Many of these studies do not feature direct information, such as images and videos, because they are not suitable for long-term research from the viewpoint of privacy. Moreover, as Güttler et al. (2015) pointed out, making living environments safer for elderly and disabled people in response to aging societies has already become a serious problem. In these contexts, monitoring is required 24 h a day, 365 days a year, but there is a major cost problem for collecting data continuously. Therefore, sensors can be used to collect small amounts of indirect data on acceleration and optical information. Thus, lowering the psychological hurdle for the participants to track their activity is also important even in construction sites, when the number of participants increases. According to Godfrey et al. (2008), motion analysis using accelerometers has been studied since the 1950s. Initially, researchers faced challenges regarding the cost and accuracy of the equipment. Thus, scholars then began focusing on this problem again in the 1970s with microelectromechanical systems (MEMS) technology, and now, MEMS has become a common behavior analysis method because accelerometers have advantages in quantitatively measuring human movement at a lower cost (Yang and Yeh-Liang, 2010). As an example of low-cost development, a system using an inexpensive infrared sensor to recognize falling and the related motion, was developed (Güttler et al., 2018). The advantage of the automatic recognition of such operations is that activities can be monitored 24 h a day, and the data can be connected to other systems, such as a telephone service, for further safety. In another approach, González-Villanueva et al. (2013) developed a wearable sensing system to monitor motions during physical rehabilitation, which consists of five small modules, including an accelerometer.
Moreover, several research studies on factories have harnessed data from accelerometers and microphones to identify tasks performed by workers in a woodshop (Lukowicz et al., 2004). A wrist-worn IMU was developed for workers on an assembly line to distinguish between several types of work (Koskimaki et al., 2009). Infrared-ID location sensor systems and accelerometers were also used to identify the routine tasks of nurses in hospitals (Naya et al., 2006). Shengjing Sun et al. (2020) proposed an integrated framework of human–cyber–physical systems and made a prototype for crane operators, which monitors environmental conditions, acceleration, angles, blood pressure, heart rate, and step, integrating data from different devices.
In a context more closely related to people’s daily lives, Hendelman et al. (2000) conducted a study with 25 people to determine how much data they needed to measure the intensity of real-life behaviors. In another study, Matthews et al. (2002) conducted a physical activity analysis using accelerometers for 122 subjects for 3 weeks to shed light on behaviors in real-life situations. In this research, the differences in activities, such as adjustments for different days of the week, were clarified.
Most previous studies were based on the value of an accelerometer mounted near the waist (Mathie et al., 2003). When an accelerometer is attached to other parts (e.g., a wrist, an ankle, or a thigh), most researchers also attached an accelerometer to the waist. The reason behind this modification is that the vicinity of the waist, especially the part behind the waist (the back of the lumbar spine 3), is almost the same as the center of gravity of the body and is less affected by horizontal rotation; thus, this input can be recorded as movement data based on the center of gravity. Sztyler and Stuckenschmidt (2016) collected acceleration data from seven wearable devices in different positions (i.e., the chest, the forearm, the head, the shin, the thigh, the upper arm, and the waist) in 15 subjects to observe eight different activities. Duncan et al. (2019) attached accelerometers on the non-dominant wrist, the dominant wrist, the waist, and the ankle of 30 children and pointed out the advantage of wearing an accelerometer on the ankle to replicate moderate physical activity. In addition to waists, Kang et al. (2018) attached IMU sensors to the wrists and the heads of sports participants to recognize gestures in spinning sports. Sarcevic et al. (2019) developed a new online classification algorithm, which was applied to wrist-mounted wireless sensors equipped with three triaxial sensors, an accelerometer, a gyroscope, and a magnetometer.
As illustrated above, many researchers have attempted to track motions on the basis of acceleration data or a combination of other data. However, in some cases, frequent problems occur with classifiers. Martín et al. (2013) evaluated the performance of a set of lightweight classifiers for activity recognition working on different sensor data in terms of accuracy, computational cost, and memory fingerprint. Several motion estimation studies feature machine learning and deep learning, and the data used during the learning period successfully estimated worker behavior with a high level of accuracy. Ramasamy and Roy (2018) described recent trends in deep learning for human activity recognition and classified recent studies according to what kind of activities the authors recognized. Nweke et al. (2018) described recent deep-learning studies for human activity recognition using mobile and wearable sensor networks and categorized deep-learning methods. These comprehensive studies discussed the methodology, including how many activities are recognized or how many sensors one should attach. Zheng et al. (2018) focused on data reprocessing for deep-learning methods applied to human activity recognition based on acceleration data from wearable sensors. Kwon et al. (2014) proposed unsupervised learning methods for human activity recognition, with sensor data collected from smartphones even when the number of activities is unknown, thus enabling human activity recognition without training datasets.
However, these methods are not directly applicable to on-site surveys in the construction industry. Makikawa (2016) developed a software program that estimates daily activities using acceleration data and machine learning. Even if the researchers categorized the real-life motions into predetermined actions, they could still only classify about 30% of the total motions. Of course, if we classify the motions into several specific motions in advance and ask participants to move in those ways, the classification accuracy will increase. However, the target of the present study is the long-term motions of workers at real construction sites, which include many unclear, difficult-to-classify motions. Therefore, it is not feasible to detect the types of construction workers’ movements specifically. Moreover, considering the nature of construction sites, the authors of this article sought a simple method that could be used for a large number of workers in conditions more severe than those in a laboratory. An example of a simple discrimination method based on acceleration can be found in the work of Bouten et al. (1997), who developed a portable unit to record acceleration and discriminate between active and rest states. Mathie et al. (2003) also categorized daily activities into two states (active and inactive) and developed a program to identify those states.
In previous research studies on the construction industry, to improve safety conditions or to estimate worker’s performance, workers’ conditions were detected. To achieve this goal, researchers must classify workers’ motions, postures, and so forth. However, in some cases, these methods have difficulty particularly when applied to many workers simultaneously or during long, continuous recordings from the viewpoint of collecting and analyzing data. Compared with previous studies in the literature, the present study aims to develop a simple method applicable to many workers without focusing too much on one worker or one motion. The present study places importance not on better discrimination accuracy but on increasing the amount of data by using a simple method (Matthews et al., 2002). The authors adopted this approach because, if the amount of the data will increase by using a simple method, the effect of the application of new technology can be estimated, or the tendency of workers’ movements can be analyzed. In addition, to increase the number of workers or the time of recording, the physical and mental loads of the participants attached to accelerometers should be low. Thus, we attached only one accelerometer to each worker’s waist and divided the workers’ activities into active and inactive categories, as in the work of Mathie et al. (2003). Although image analysis only involves mental loads, these image analyses have difficulty with continuous recordings or large amounts of data. We also analyzed what can be estimated from the data, as well as whether or not the method can be used for a larger number of workers or longer periods of time. Furthermore, few researchers have applied accelerometers to actual construction sites at buildings, which are congested and have workers who move in unexpected ways and make mistakes. Thus, the present study aims to examine the problems at actual construction sites.
The conditions required for the accelerometer used in the present study are as follows. (1) Acceleration data can be acquired stably for a long period of time at intervals at which it can be determined whether workers are active or not. (2) The device must be small and lightweight so as not to interfere with the work on construction sites. Moreover, wired accelerometers are difficult to use at construction sites.
Accelerometers can be broadly classified into two types: a data transmission type and a data logger type. Although the data transmission type is generally lightweight, it transmits data to another storage medium, so reception may be interrupted when the distance from the storage medium is large or when there is an obstacle between accelerometer and another storage point. In the data logger type, the accelerometer and the data storage unit are integrated, and data can be stably stored. However, the data logger type is generally larger and heavier than the data transmission type because of problems such as the battery required.
For the present study, we prioritized lightweight and compact devices and mainly used a data transmission-type accelerometer, called A (25 g; 70 × 75 × 21 mm). Moreover, an accelerometer, labeled B (180 g; 137 × 77 × 37 mm), modified from Accelerometer A to a logger type by adding a battery and a recording device, was also used for the survey at both construction sites (Figure 1). Both accelerometers can acquire triaxial acceleration data of approximately 100 Hz. The accelerometer has a range of -2 g to + 2 g. As a result of preliminary use at the laboratory, Accelerometer A was pinned to the waist but was easily detached and unstable, so it was modified to allow it to be attached to the waist belt. The data acquisition of Accelerometer B was performed through a USB port. The data were exported into a comma-separated values file.
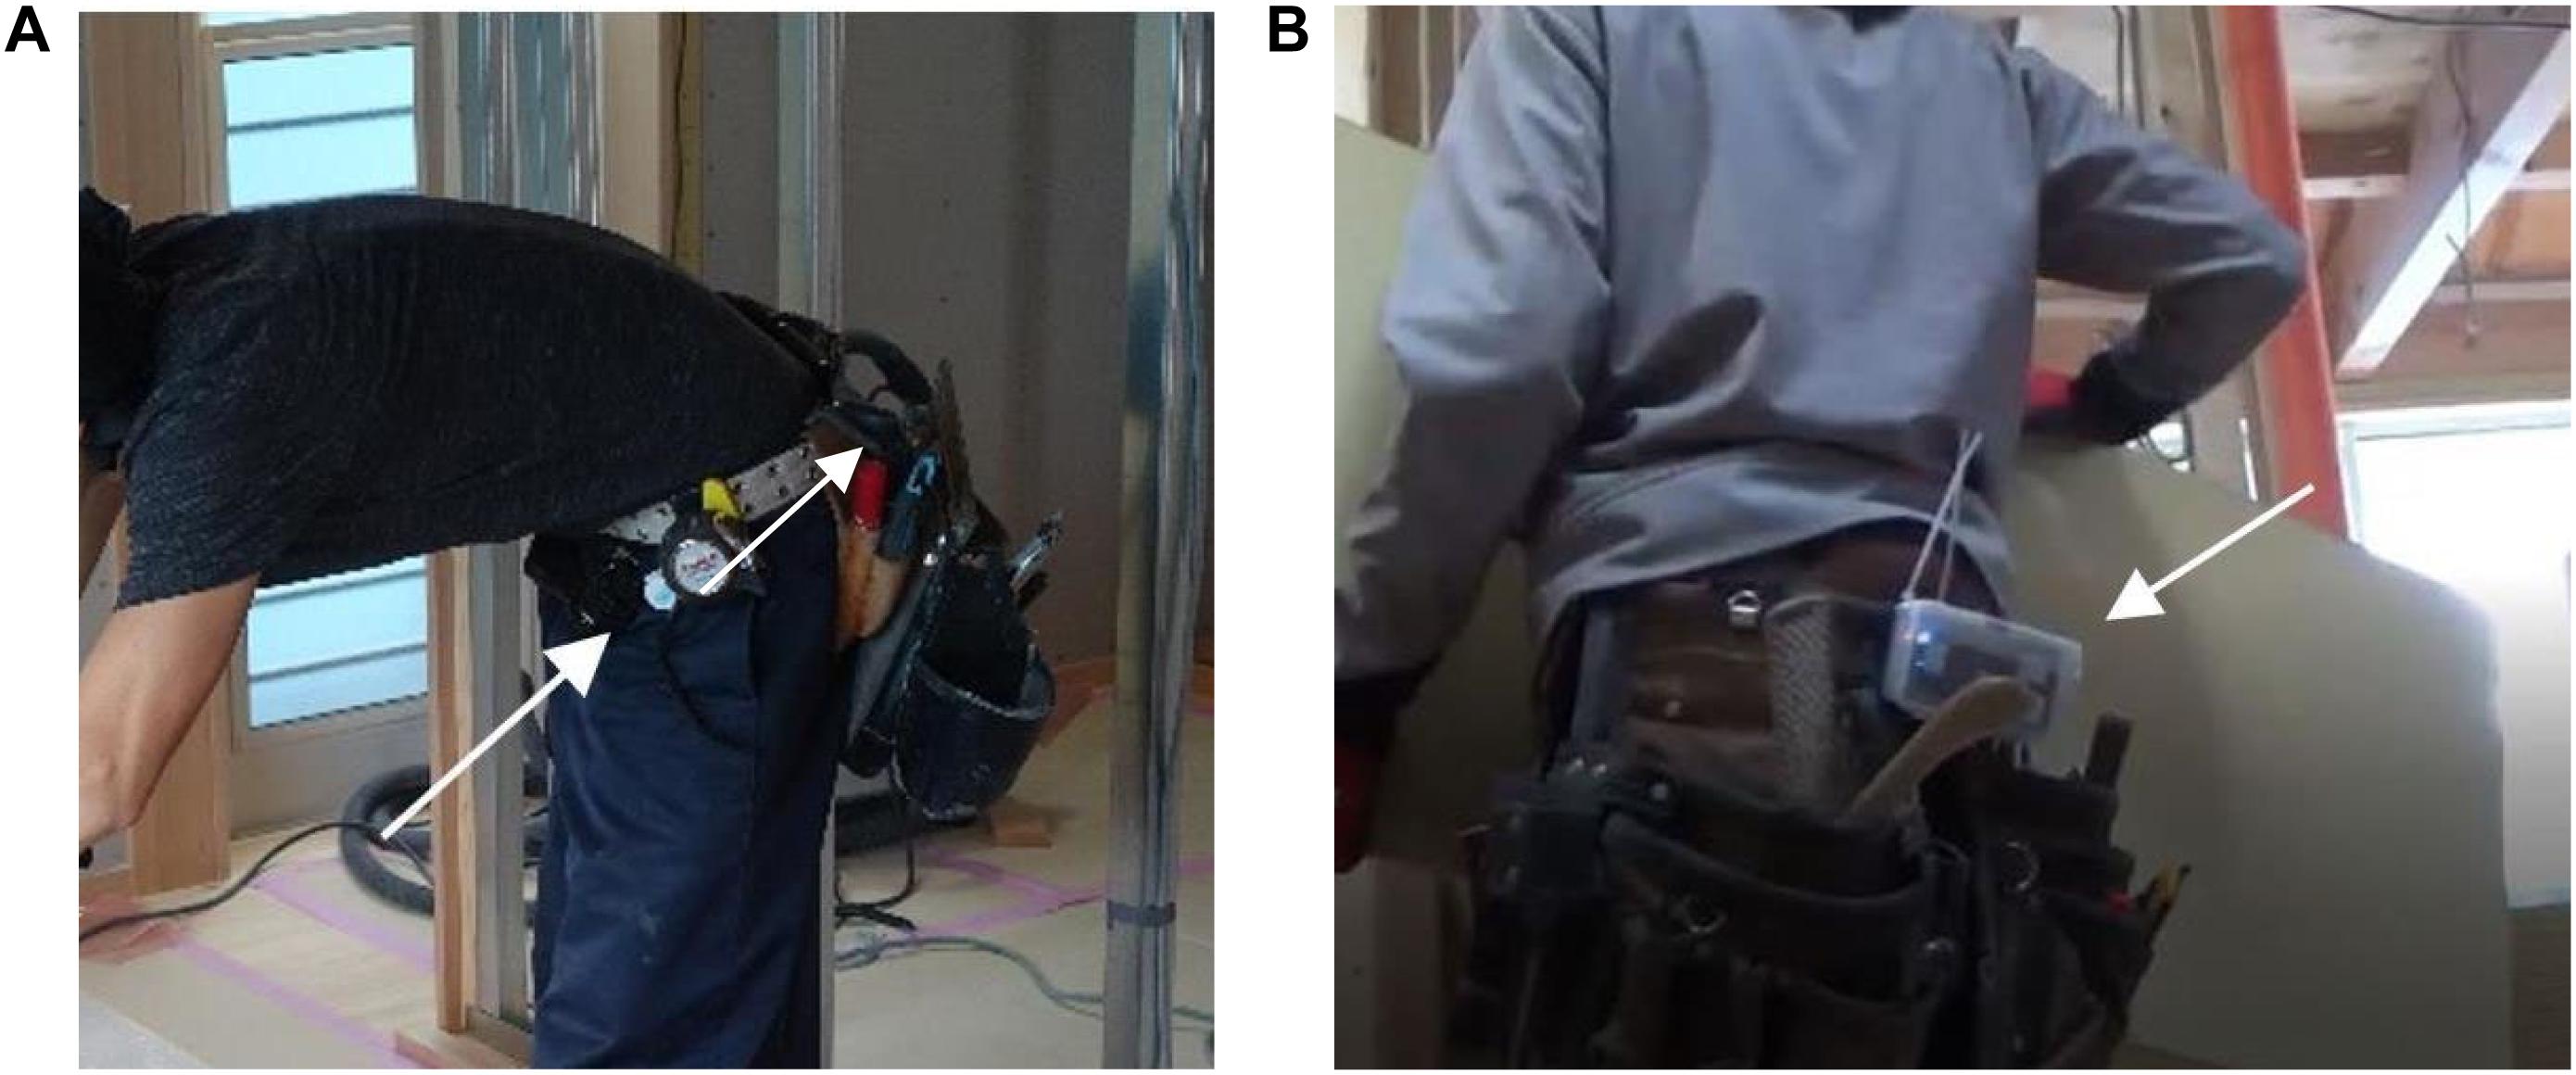
Figure 1. Accelerometers attached to workers (indicated by white arrows): (A) Accelerometer A attached to the carpenter in House A and (B) Accelerometer B attached to the carpenter in House B.
To determine a worker’s active/inactive status, triaxial acceleration data and time data were initially collected from the accelerometer and listed according to when they were recorded (normalized every second). Next, two types of filtering were applied. First, the effects of gravity were removed using a Butterworth high-pass filter. The gravitational force was assumed to have only low-frequency components; therefore, a filter with a 0.3 Hz cutoff frequency was used. Second, the data were smoothed using a 19th-order median (non-linear, low-pass) filter to remove high-frequency noise spikes (Mathie et al., 2003).
Using the equation below as a variable of the active state, the signal amplitude area A was calculated for each list. As Mathie et al. (2003) pointed out, to identify activity, both the magnitude and duration of the signal needed to be taken into account. A is the sum of the signal amplitude areas of each of the three axes (a1, a2, and a3) normalized every second. A has units of m/s2, which can be considered as the sum of the velocity per second, and 135 × 10–3 G (G: gravitational acceleration) was used as a threshold for activity/inactivity. The order of the median filter, the threshold for parameter A, and the length of the list were determined by Mathie et al. (2003).
To verify the program, two simple experiments were performed in the author’s laboratory. First, a person attached a sensor to his/her waist and walked, sat down, stood up, and stopped (inactive) randomly for 65 s. Every second, the author tested whether the discrimination from the data corresponded with the authors’ observations. For active time (45 s) and inactive time (20 s), the accuracy of the discrimination was 100 and 95%, respectively. The discrimination failed only in 1 s in inactive time. The reason for the failure was that, in that second, there was a small motion that happened at the end of the previous second. Thus, even for a clear motion, it is difficult to discriminate activity/inactivity at the beginning or end of a motion.
Second, an accelerometer was attached to a person’s waist when performing simple assembly work similar to that performed at construction sites, and the device recorded the work with a video camera. The activity/inactivity was determined by the program every second (354 s in total), and the video/camera image was also viewed by a person to determine the activity/inactivity every second, and the rate of coincidence between these three was examined (Table 1). The correspondence rate of these three combinations ranged from 66.9% (visual observations and Accelerometer B) to 78.0% (visual observations and Accelerometer A). As for the cause of the deviation between the visual observation and the accelerometer, because the unit of the time for discrimination is 1 s, when both the active time and inactive time are included in 1 s, the discrimination by the program and the visual observation tend to change. Thus, even though visual observations, it is difficult to discriminate between activity and inactivity among workers. Moreover, this article aims to develop a simple method to capture workers’ movements with moderate accuracy. Hence, the authors applied these two sensors during the survey at actual construction sites.
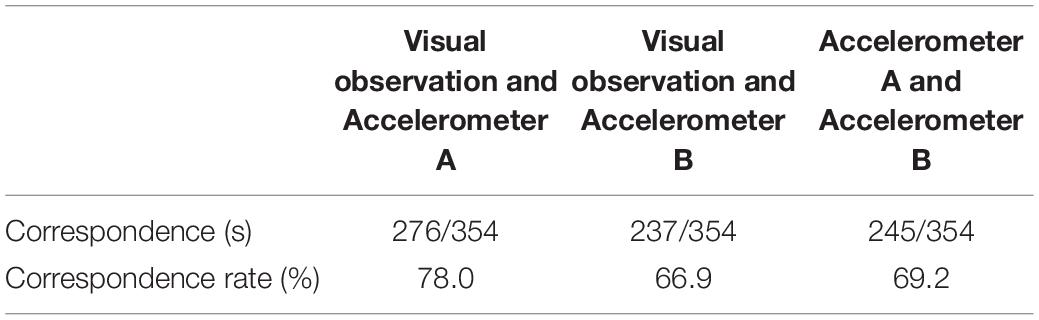
Table 1. Correspondence of visual observation and accelerometers.
At the construction site with two houses (wooden post and beam construction, House A and House B have approximately 100 m2 total area) where carpenters from the same contractor were working, the carpenter in each house set plasterboard on the wall. Accelerometer A was attached to the waist of the carpenter in House A, and Accelerometers A and B were attached to the waist of the carpenter in House B because, in cases in which there are obstacles, it becomes difficult to receive data from Accelerometer A. The active/inactive time and ratio for each plasterboard task were recorded and analyzed. In House B, both accelerometers recorded data. To match the conditions at house A, the data from Accelerometer A were used in the analysis of House B.
In section “Result 1: Two Construction Sites With Detached Houses,” the work time required to set one plasterboard was calculated by measuring the time from the end of setting an initial plasterboard to the end of setting a second plasterboard as recorded by the video camera.
In House A, the survey was conducted for 2 days (about 3 h each morning) in July 2019. In House B, the survey was carried out for 4 h for 1 day in the morning in December 2019. The carpenters in House A and House B had 15 and 13 years of carpentry experience, respectively.
Plasterboards are common materials for substrates for finishing in Japan. Plasterboard setting work mainly consists of (1) measuring the place to set, (2) processing the plasterboards to the correct size and shape, (3) transporting them to the setting point, and (4) setting them. The sizes of the plasterboards were 910 × 2,730 × 12.5 mm in House A and 910 × 2,420 × 12.5 mm in House B. At the corners of a wall, it takes more time to measure and process plasterboards because the processing of uneven portions or cuts requires adjustments to avoid leaving small parts sticking out from the walls or ceilings. Before processing, the plasterboard is placed in the room where it is to be installed or in the next room, and transportation mainly refers to transporting the processed plasterboard to the place where it will be installed. On the second day at House A, it was difficult to classify the work in parallel with the work on several kinds of door frames, among other tasks; thus, only the results for day 1 for House A and House B are described in section “Result 1: Two Construction Sites With Detached Houses.”
The work of people in multiple occupations was recorded by an accelerometer and a video camera at a large-scale office construction site (more than 100,000 m2 in total) for 5 days in November 2019. The target occupations include rebar construction, formwork construction, scaffold jumping, and construction management. Section “Result 2: A Large Office Building Construction Site” focuses on floor slab reinforcement work, and the reinforcement work of two workers was recorded: that of a skilled worker (a participant with a 32-year career) and that of an unskilled worker (a participant with a 2-year career). These two participants worked in the same area in the basement. Thus, sometimes, the acceleration data could not be recorded by Accelerometer A because many obstacles stopped the accelerometer from receiving data from the workers and the authors (from the path on the ground floor). Thus, Accelerometer B recorded these two workers’ data.
Rebar construction work is mainly divided into (1) carrying the rebar, (2) locating the rebar, and (3) tying the rebar. Moreover, the skilled worker gave orders to the unskilled worker. It is more difficult to divide rebar arrangement work into certain units of work than it is in the case of setting plasterboards (in which the work can be divided according to the number of boards). Therefore, the authors calculated the ratio of the seconds determined by active time every 2 min; the ratio was 100% when the active seconds accumulated to 120 s, hereinafter referred to as “activity intensity.”
In the research period, 16 plasterboards were set on the wall. However, the accelerometers could not record the setting of the 15th and 16th plasterboards due to a video camera malfunction. The accelerometers recorded data for 2 h, 55 min, and 11 s (9:02:57 –11:55:08 a.m.). At the same time, we also recorded a video of the work completed.
The active/inactive time and ratio for each plasterboard for repeated work are described in this section. The work time per board varied from 216 to 1,020 s (Figure 2). The average time was 508 s for each board. As described above (section Survey 1: Detached House Construction), if the boards were not processed much, the time to set them became shorter. Looking at the ratios of active and inactive time on each board, the ratio of active time accounted for 33% on average (36% at maximum and 25% at minimum). Thus, the variation of the ratio was relatively smaller than the time to set the boards (Figure 3). This finding indicates that, if the carpenter stopped working and thought about how to cut the board or how to set it, the rate of active time decreased. Thus, the stability of the ratio indicates that, whether the task was difficult or not, the carpenters worked at a certain pace.
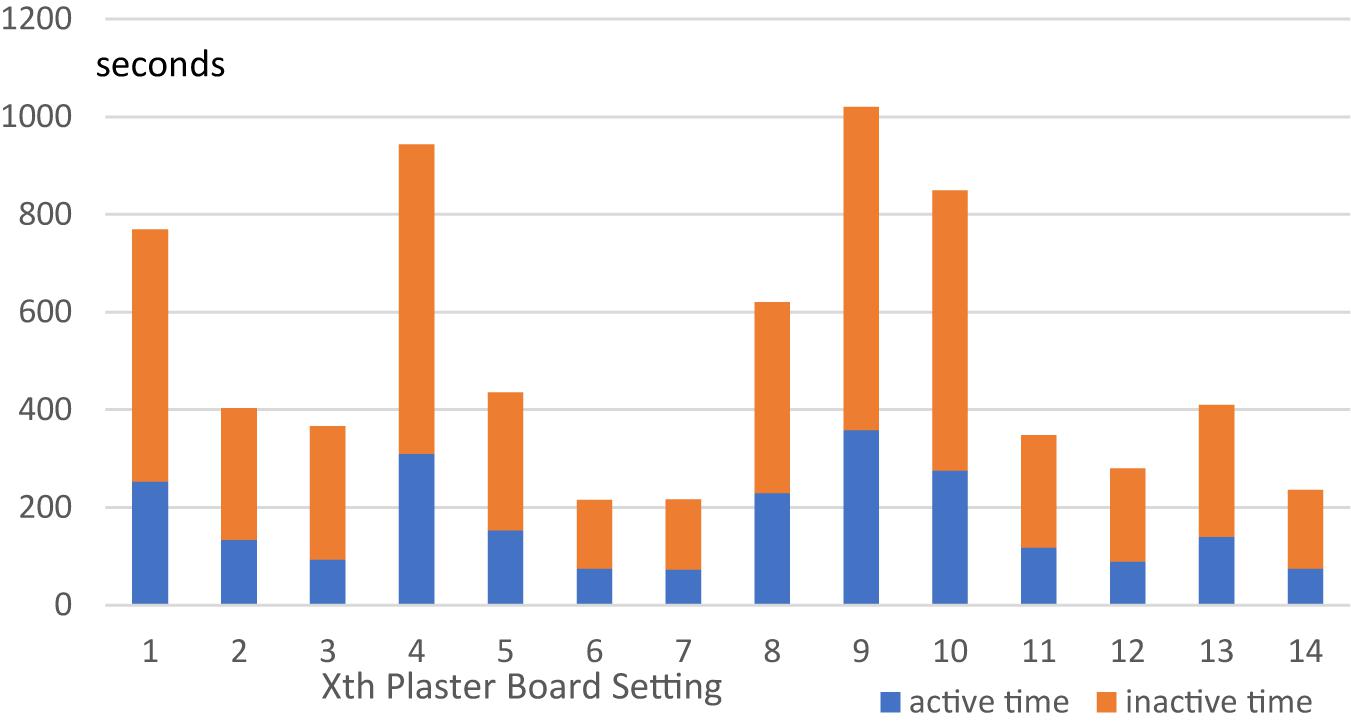
Figure 2. Active/inactive time in setting plasterboards (House A, 14 plasterboards).
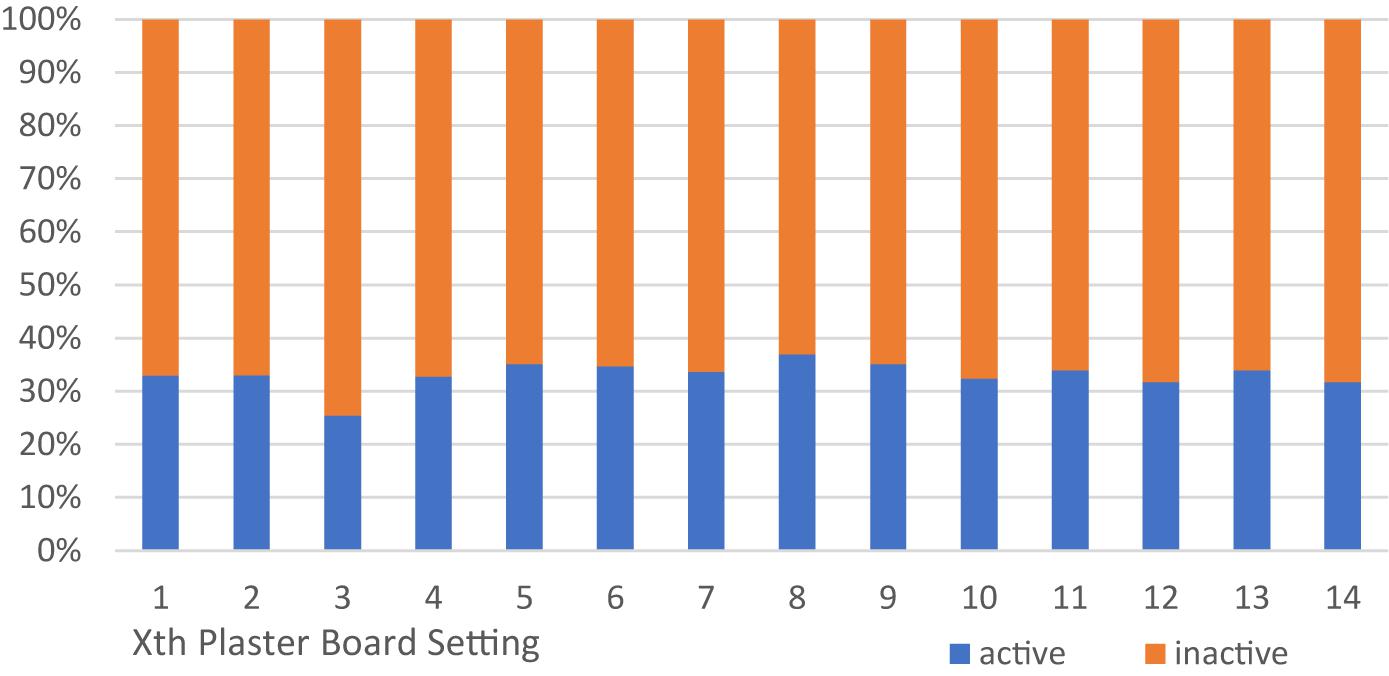
Figure 3. The ratio of active/inactive time in setting plasterboards (House A, 14 plasterboards).
The same motion tracking was performed when another carpenter performed the work of setting the plasterboards with Accelerometers A and B (data from Accelerometer A were used for analysis). At this site, 43 boards were pasted, of which 23 were large-sized boards and 20 were small boards used at the edges, where there were gaps between the board and the ceiling, among other places. Here, for comparison with the abovementioned board setting work in House A, the work of 23 large board settings was taken as an analysis target.
The work time at House B per plasterboard varied from 130 to 503 s (Figure 4). The average setting time was 331 s per board. Next, looking at the ratio of active/inactive time on each board (Figure 5), the average active time ratio was 47% (maximum 60%, minimum 35%). The activity time ratio amounted to 60% when the measurement and processing of the board did not take much effort.
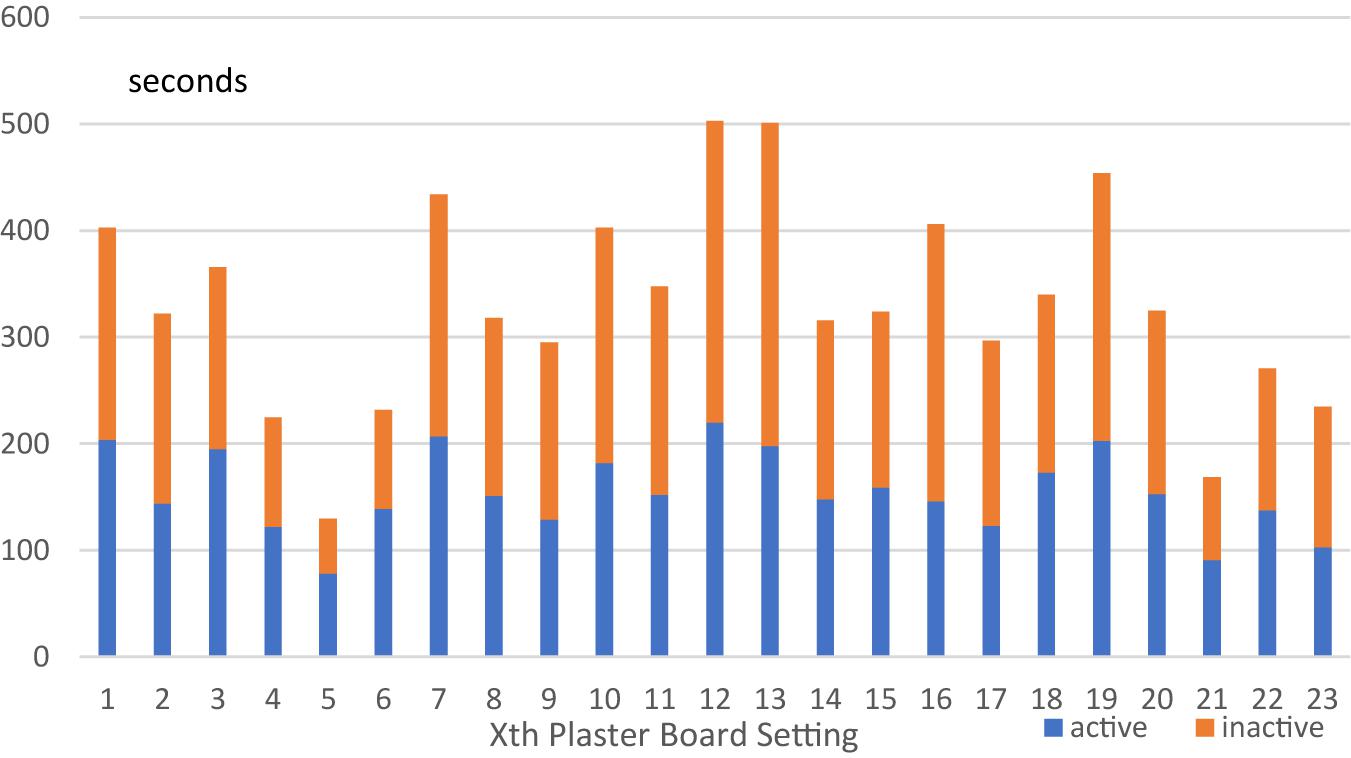
Figure 4. Active/inactive time in setting plasterboards (House B, 23 plasterboards).
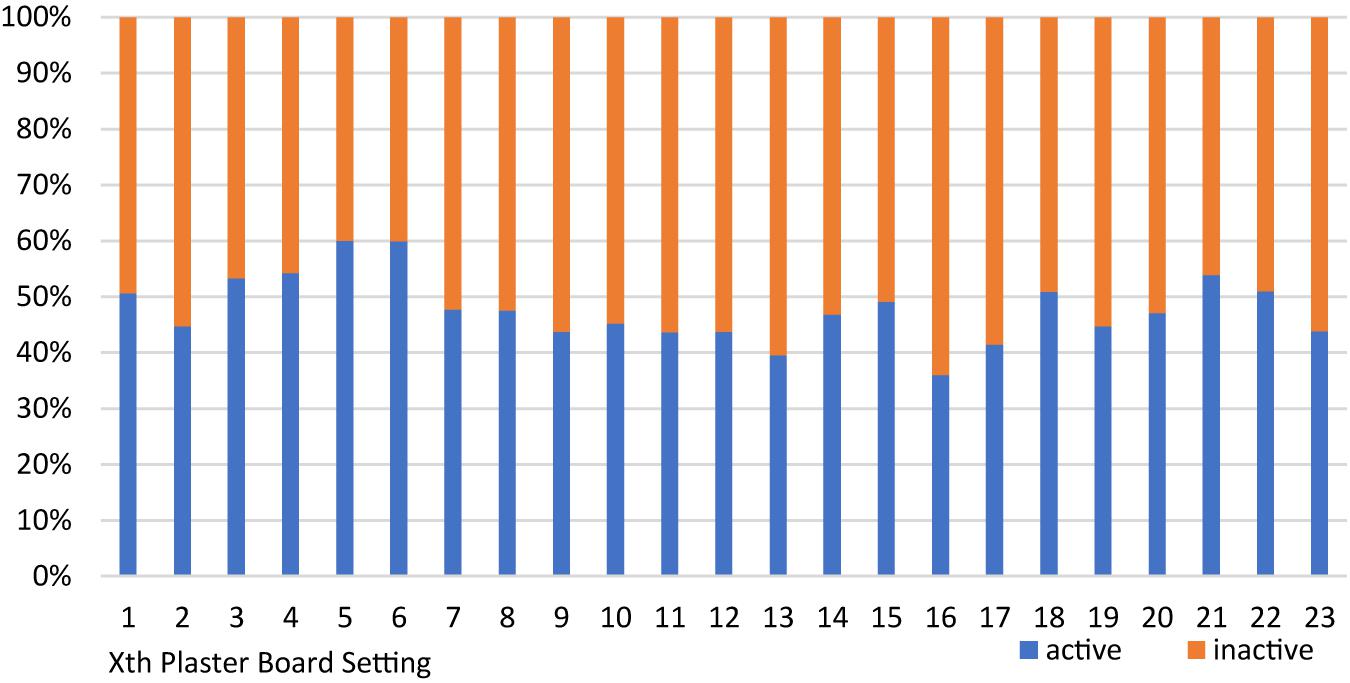
Figure 5. The ratio of active/inactive time in setting plasterboards (House B, 23 plasterboards).
The work time at House B per plasterboard (333 s per board on average) was shorter than at House A (508 s per board on average). The different sizes of the plasterboards may have affected the time required (described in section “Survey 1: Detached House Construction”) and the carpenters’ performance. The active time ratio was varied more in House B (60% at maximum, 35% at minimum) than at House A (36% at maximum and 25% at minimum).
As explained in section “Survey 1: Detached House Construction,” plasterboard setting work can be classified into four tasks: (1) measuring, (2) processing, (3) transporting, and (4) setting. Figure 6 shows the ratio of the active time in each of the four tasks. There was almost no difference in the ratio of activity time for transportation and setting between House A and House B. Conversely, there was a difference of approximately 20% in both measurement and processing, probably because there were fewer locations to measure and to drill holes in the plasterboards in House B. This ratio analysis reveals, quantitatively, the reason for the difference in the workers’ performance between the two sites.
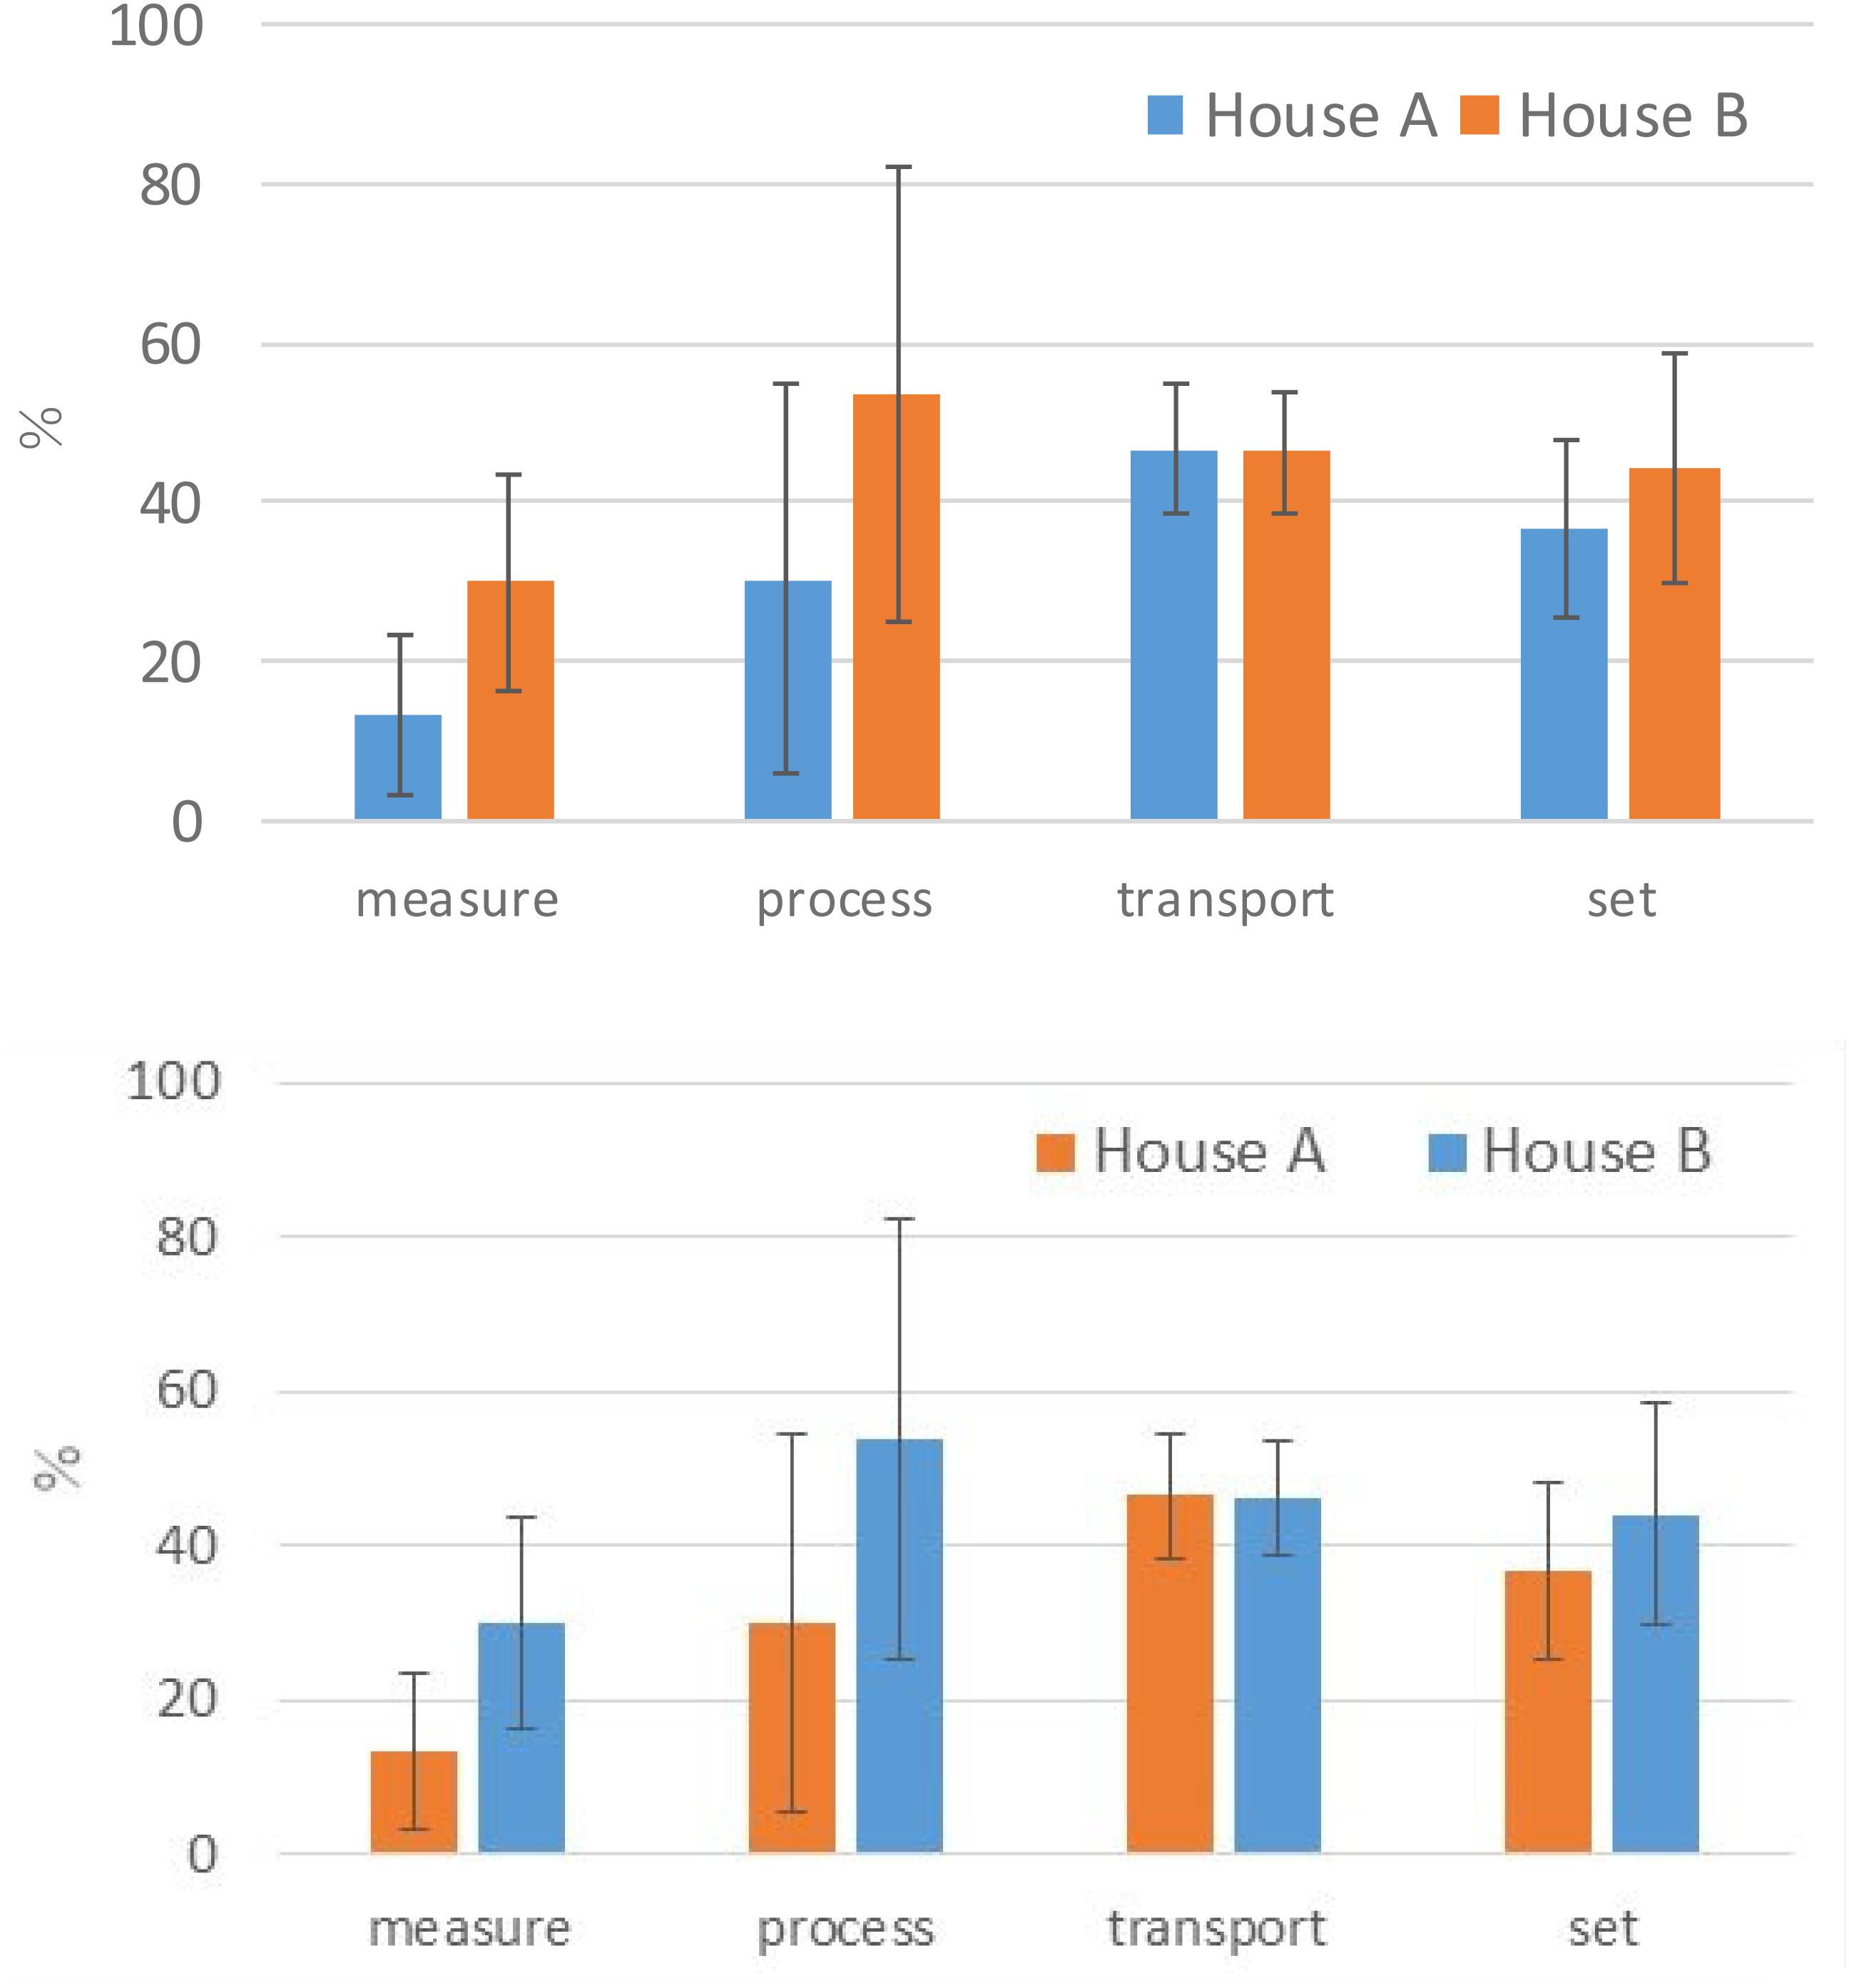
Figure 6. The ratio of active/inactive time for each task (House A and House B).
Figure 7 shows the relationship between the active and inactive time in the plasterboard processing processes in Houses A and B. The coefficient of determination (R2) of House A is 0.91, and that of House B is 0.38. Thus, there is a correlation between active time and inactive time, with House A having a stronger correlation than House B. In addition, the gradient of the approximate line of House A is two times larger than that of House B.
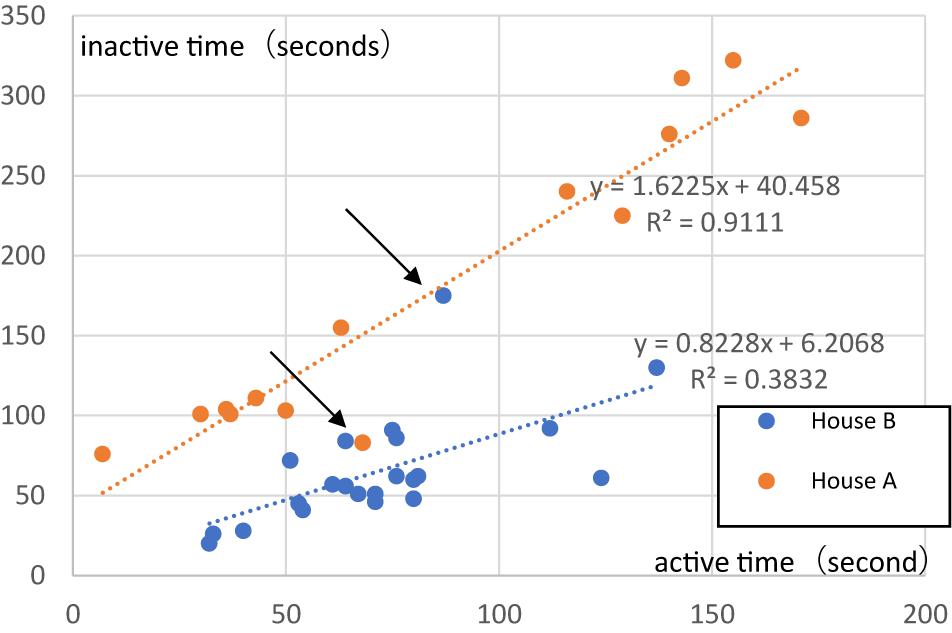
Figure 7. The relation between active time and inactive processing time between House A (orange) and House B (blue); outliers are indicated by arrows.
There are two outlier points from the approximate straight lines both in House A and House B (with arrows in Figure 7). The outlier in House A (near 70 s active and 80 s inactive) was the only point where only one processing task was carried out with the plasterboard (i.e., the work is easier than others). The outliers in House B (approximately 80 s active and 170 s inactive) only consisted of the rework operations because the processed board could not be set. Thus, this finding indicates that the data from the accelerometer have the potential to detect problems at construction sites.
Figures 8, 9 show the transition of the activity intensity (section “Survey 2: Large Office Building Construction”) of the skilled worker and the unskilled worker, respectively. Data are absent in two places in Figure 9 because of periods of time when both Accelerometers A and B failed to work properly; data from Accelerometer A could not be received at those points, and the recording of Accelerometer B stopped because of a sudden shock, as something at the construction site might have hit it. Fluctuations in activity intensity appear in both figures. The reason why the activity intensity exceeded 80% immediately before and after a break (from 9:30 a.m. for 20 min) is that both the skilled worker and the unskilled worker had to walk to a break room at the large construction site.
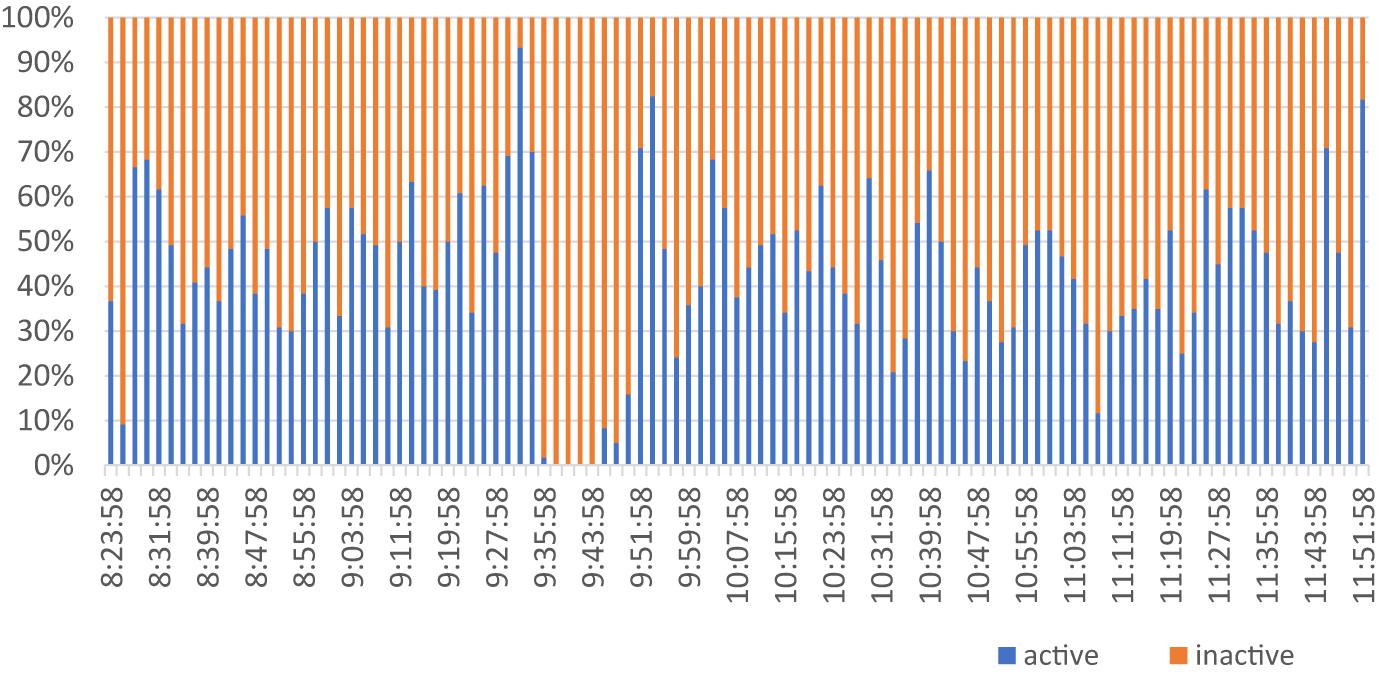
Figure 8. The transition of the activity intensity of the skilled rebar worker.
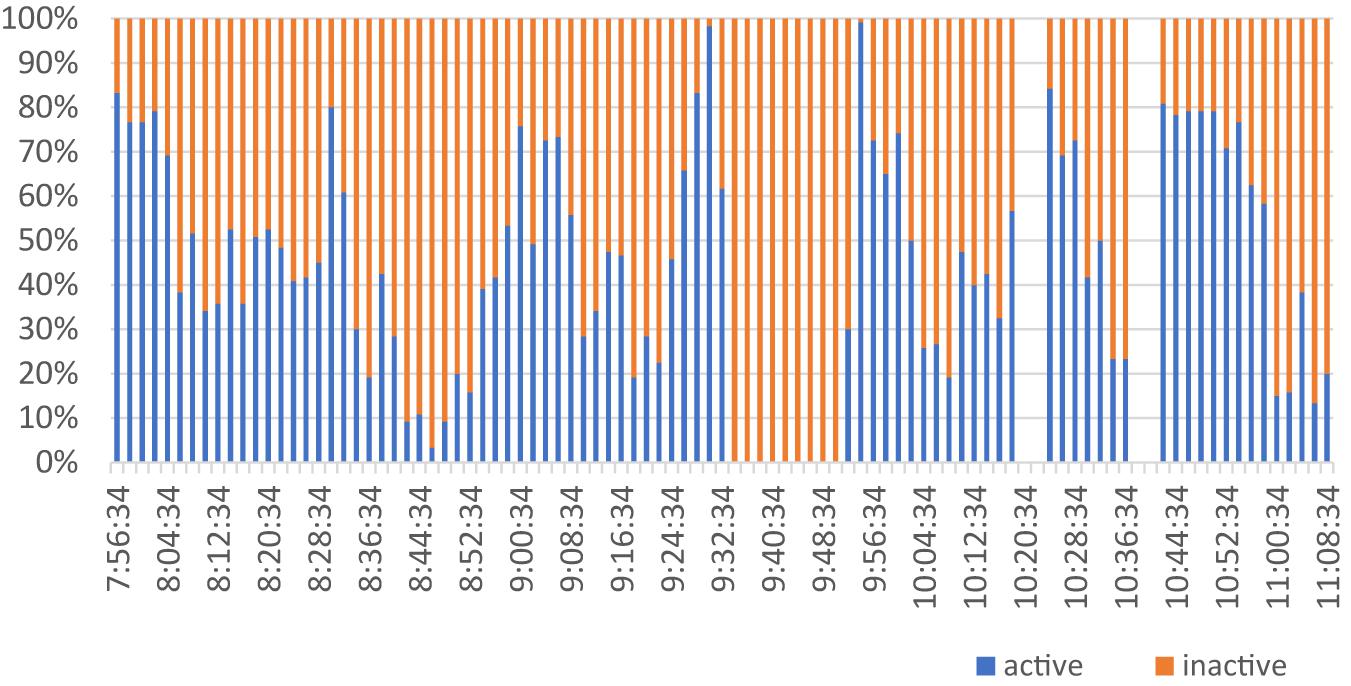
Figure 9. The transition of the activity intensity of the unskilled rebar worker.
The average activity intensities (without the break time and the time walking before/after the break) of the skilled worker and the unskilled worker were 44.2 and 48.3%, respectively. The unskilled worker’s average activity intensity was approximately 15% higher than that of the skilled worker. The reason for this finding might be that the unskilled worker tended to carry the rebar following an order from the skilled worker.
Table 2 displays a comparison of the activity intensity of the skilled worker and the unskilled worker. The activity intensity of the skilled worker was generally in the 30–60% range except before and after the break when the skilled worker was walking. Conversely, the unskilled worker’s activity intensity increased or decreased significantly more than one time until the activity intensity exceeded 80%. The standard deviations of activity intensity were 16.7 and 23.3% for the skilled worker and the unskilled worker, respectively. The number of times the activity intensity surpassed 70% differed for the skilled worker (2) and the unskilled worker (17), as did the number of times the activity intensity dipped below 20% (again, 2 and 10, respectively). Thus, the unskilled worker often ceased activity or moved more vigorously than the skilled worker. Therefore, the average of the activity intensity of the unskilled worker was 4.1% higher than that of the skilled worker.
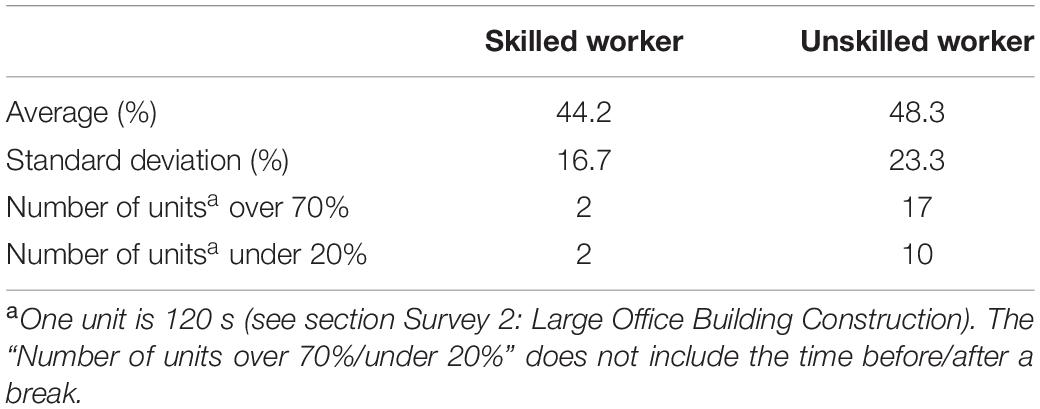
Table 2. Comparison of the activity intensity of the skilled worker and the unskilled worker.
Comparing the two workers, the activity intensity of the skilled worker was more stable than that of the unskilled worker. Although the data were insufficient, several reasons might explain this difference. First, the unskilled worker carried objects more often than the skilled worker, meaning that his activity intensity increased and decreased repeatedly. Second, the skilled worker did not stop working to think about how to approach the tasks.
First, we must address the validity of the position and the number of accelerometers. As for attaching an accelerometer to the waist, the movement of the waist reflects the movement of the whole user’s body and tends to detect activity/inactivity. However, the position of the waist may record inactive time when users move their hands without moving the body as a whole. Hendelman et al. (2000) pointed out the inability of accelerometers attached to the waist to detect the upper body movement. In addition, when using waist-mounted acceleration data, it is difficult to determine the type of the activity, even though the intensity of the activity can be estimated. Thus, in future research, scholars can investigate which kinds of work accelerometers can effectively track when attached to the waist by collecting data on several kinds of workers. In addition, as Duncan et al. (2019) noted, the ankle can have advantages in terms of replicating physical activities. Thus, in future studies, researchers can analyze positions other than the waist, or they can consider combinations of other positions and the waist, taking the loads of the participants into account because, if the latter become larger, it becomes difficult to increase the number of participants or the time available to record data.
Second, compared with previous studies conducted in laboratories (Joshua and Varghese, 2011, 2014) or open-air civil engineering construction sites (Cheng et al., 2011), when using an accelerometer at actual building construction sites with houses and buildings, the data transmission-type accelerometer’s signals sometimes cannot be received because of physical obstacles in the area. Conversely, the data logger type is too large to be worn on the waist, and if something hits the device, it may stop recording. The problem with the data transmission type can be solved by connecting with the network at the construction site (because most large building construction sites in Japan have local-area networks installed), and the problem regarding the size of the data logger type can be solved by developing a smaller one; in the present study, Accelerometer B was the experimental one. Compared with the vision-tracking method (e.g., Hamledari et al., 2017; Yu et al., 2019), even small accelerometers have disadvantages in terms of the loads on workers and the time required to attach them to the workers. However, if it becomes possible to record acceleration data continuously and for a long time, small accelerometers can offer advantages in congested building construction sites compared with the computer vision technique.
Third, the time required for data acquisition and analysis to classify workers’ activity is much shorter than that for human observation because it is possible to measure acceleration data remotely and classify them automatically. Of course, this was an experimental study, and the authors recorded the workers’ motions with a video camera. However, in the future, if whether the worker is active can only be captured by an accelerometer, the cost of acquiring the data will decrease significantly. In this experiment, the accuracy of detection by the accelerometer was lower than that acquired by human observation or computer vision, and it was difficult to detect what the workers were doing specifically. However, this method can apply to many workers and be used for long-term acquisition; furthermore, with these large amounts of data, deep-learning classification can be applied (Nweke et al., 2018; Ramasamy and Roy, 2018). Moreover, the results of the present study indicate that only from the acceleration data the site manager or other engineers can capture workers’ performance, problems, and tendencies.
The possible ways to utilize the acceleration data acquired are outlined below.
First, the data can be used to measure the ratio of active time of workers, which can affect the performance of workers. By using an accelerometer to determine the correlation between the activity intensity and the work at hand, researchers can estimate the efficiency with which the work was performed. With this method, in the future, the performance can be evaluated without a person observing the state of the worker or manually inputting and classifying the data acquired. Moreover, a long-term analysis of a large number of people will enable more inexpensive verification of quantitative effects before and after the adoption of new technologies. Of course, without a video camera or human observation, the reasons behind increases and decreases in the activity intensity will remain unclear. However, with such tools, we can identify changes and patterns in workers’ performance quantitatively.
Second, data can be harnessed to detect problems at construction sites. If the activity intensity is extremely high or low, a problem has likely occurred in the work. When there is a sudden decrease in active intensity, the workers might be waiting for an order or the arrival of materials, among other things, such as the unskilled rebar worker described in section “Result 2: A Large Office Building Construction Site.” In cases where sudden decreases occur, a worker might be working smoothly or walking around at the site to look for materials or managers. If significant increases or decreases in activity intensity are commonly observed among a large number of workers, one can assume that a construction management problem is occurring. Thus, managers can detect changes in the situation without going to the location directly, which can reduce the workload of construction managers.
Third, the data acquired can help clarify workers’ tendencies. For example, although this experimental study only yielded a small amount of data, by examining the variation of the activity time ratio (section “Result 1: Two Construction Sites With Detached Houses”) or activity intensity (section “Result 2: A Large Office Building Construction Site”), the tendencies related to the work or the worker can be indicated. Even if the difficulty of work per piece varies, the work continues at a constant pace; as seen in the rebar work examined in this study, the skilled person also worked at a more constant pace than the unskilled worker, which may suggest that the construction work went smoothly without any problems or stops. However, regarding the activity time ratio and activity intensity, there was also a difference in the plasterboard setting work completed by the same contractor. In this experimental study, the conditions for each work were not uniform. Therefore, it is important to consider increasing the number of subjects in future studies as in the previous studies in other fields (Hendelman et al., 2000; Matthews et al., 2002) and to unify the conditions at each site and for each type of work. Particularly, researchers can apply this method to more repeated tasks. In the present study, even in the setting of plasterboards, the size of the plasterboards varied, and the work required for each board also differed slightly (e.g., at corners). For example, during the finishing stage at large office buildings, there is more repetition of the same tasks. Thus, the difference in the activity intensity could be analyzed more accurately by applying this method.
The present study developed a new method for discriminating between activity and inactivity by using an accelerometer attached to workers at construction sites. Several surveys were conducted at building construction sites with a total of two detached houses and one large office building. From the data on activity/inactivity, the activity time ratio and activity intensity were calculated, and ways to use the acceleration data gathered through this method were also considered. The possible uses of acceleration data include detecting if the workers are active and identifying the problems and tendencies related to workers’ movements. This study presented a new method for capturing workers’ activity quantitatively at construction sites – even for larger numbers of people or for longer continuous periods of time without going to the location directly by construction managers. In a future research study, the authors will reduce the variation in the types of data to be acquired and the content of each type of work by measuring repeated tasks, such as attaching ceilings and walls to large non-residential buildings.
The raw data supporting the conclusions of this article will be made available by the authors, without undue reservation, to any qualified researcher.
Ethical review and approval was not required for the study on human participants in accordance with the local legislation and institutional requirements. The patients/participants provided their written informed consent to participate in this study.
Both authors listed have made a substantial, direct and intellectual contribution to the work, and approved it for publication.
This research was funded by the research fund for building construction management laboratories donated by Kajima Corp., Obayashi Corp., Shimizu Corp., Taisei Corp., and Takenaka Corp.
The authors declare that this study received funding from Kajima Corp., Obayashi Corp., Shimizu Corp., Taisei Corp., and Takenaka Corp. The funder was not involved in the study design, collection, analysis, interpretation of data, the writing of this article, or the decision to submit it for publication.
We appreciate all the support from the site managers and workers during the survey period.
Akhavian, R., and Behzadan, A. H. (2015). Construction equipment activity recognition for simulation input modeling using mobile sensors and machine learning classifiers. Adv. Eng. Inform. 29, 867–877. doi: 10.1016/j.aei.2015.03.001
Akhavian, R., and Behzadan, A. H. (2016). Smartphone-based construction workers’ activity recognition and classification. Autom. Constr. 71, 198–209. doi: 10.1016/j.autcon.2016.08.015
Bai, Y., Jun, H., and Seonghoon, K. (2012). Measuring bridge construction efficiency using the wireless real-time video monitoring system. J. Manag. Eng. 28, 120–126. doi: 10.1061/(asce)me.1943-5479.0000061
Bouten, C. V. C., Koekkoek, K. T. M., Verduin, M., Kodde, R., and Janssen, J. D. (1997). A triaxial accelerometer and portable data processing unit for the assessment of daily physical activity. IEEE Trans. Biomed. Eng. 44, 136–147. doi: 10.1109/10.554760
Cheng, T., Migliaccio, G. C., Teizer, J., and Gatti, U. C. (2013). Data fusion of real-time location sensing and physiological status monitoring for ergonomics analysis of construction workers. J. Comput. Civ. Eng. 27, 320–335. doi: 10.1061/(asce)cp.1943-5487.0000222
Cheng, T., Venugopal, M., Teizer, J., and Vela, P. A. (2011). Performance evaluation of ultra wideband technology for construction resource location tracking in harsh environments. Autom. Constr. 20, 1173–1184. doi: 10.1016/j.autcon.2011.05.001
Dixit, S., Mandal, S. N., Thanikal, J. V., and Saurabh, K. (2019). Evolution of studies in construction productivity: a systematic literature review (2006–2017). Ain Shams Eng. J. 10, 555–564. doi: 10.1016/j.asej.2018.10.010
Duncan, M. J., Roscoe, C. M. P., Faghy, M., Tallis, J., and Eyre, E. L. J. (2019). Estimating physical activity in children aged 8-11 years using accelerometry: contributions from fundamental movement skills and different accelerometer placements. Front. Physiol. 10:242. doi: 10.3389/fphys.2019.00242
Godfrey, A., Conway, R., Meagher, D., and ÓLaighin, G. (2008). Direct measurement of human movement by accelerometry. Med. Eng. Phy. 30, 1364–1386. doi: 10.1016/j.medengphy.2008.09.005
González-Villanueva, L., Cagnoni, S., and Ascari, L. (2013). Design of a wearable sensing system for human motion monitoring in physical rehabilitation. Sensors 13, 7735–7755. doi: 10.3390/s130607735
Güttler, J., Bittner, A., Langosch, K., Bock, T., and Mitsukura, Y. (2018). Development of an affordable and easy-to-install fall detection system. IEEJ Trans. Electr. Electr. 13, 664–670. doi: 10.1002/tee.22648
Güttler, J., Georgoulas, C., Linner, T., and Bock, T. (2015). Towards a future robotic home environment: a survey. Gerontology 61, 268–280. doi: 10.1159/000363698
Ham, Y., and Kamari, M. (2019). Automated content-based filtering for enhanced vision-based documentation in construction toward exploiting big visual data from drones. Autom. Constr. 105:102831. doi: 10.1016/j.autcon.2019.102831
Hamledari, H., McCabe, B., and Davari, S. (2017). Automated computer vision-based detection of components of under-construction indoor partitions. Autom. Constr. 74, 78–94. doi: 10.1016/j.autcon.2016.11.009
Han, S., and Lee, S. (2013). A vision-based motion capture and recognition framework for behavior-based safety management. Autom. Constr. 35, 131–141. doi: 10.1016/j.autcon.2013.05.001
Harichandran, A., Raphael, B., and Mukherjee, A. (2019). “Determination of automated construction operations from sensor data using machine learning,” in Proceedings of the 4th International Conference on Civil and Building Engineering Informatics, Sendai.
Hendelman, D., Miller, K., Baggett, C., Debold, E., and Freedson, P. (2000). Validity of accelerometry for the assessment of moderate intensity physical activity in the field. Med. Sci. Sports Exerc. 32:S442.
Hirano, M. (2010). “Co-evolving management with virtual cluster: what we can learn from Komatsu’s networking strategy,” in IEEE International Technology Management Conference (ICE), Lugano, doi: 10.1109/ICE.2010.7476989
Joshua, L., and Varghese, K. (2011). Accelerometer-based activity recognition in construction. J. Comput. Civ. Eng. 25, 370–379. doi: 10.1061/(asce)cp.1943-5487.0000097
Joshua, L., and Varghese, K. (2014). Automated recognition of construction labour activity using accelerometers in field situations. Int. J. Product. Perform. Manag. 63, 841–862. doi: 10.1108/IJPPM-05-2013-0099
Kang, M., Kang, H., Lee, C., and Moon, K. (2018). “The gesture recognition technology based on IMU sensor for personal active spinning,” in 2018 20th International Conference on Advanced Communication Technology (ICACT), Chuncheon-si, 1.
Kim, S., Yong, B., Luke, H., and Abhinav, P. (2009). “Measuring construction productivity using the write system,” in Construction Research Congress 2009, Reston, VA: ASCE, doi: 10.1061/41020(339)14
Koskimaki, H., Huikari, V., Siirtola, P., Laurinen, P., and Roning, J. (2009). “Activity recognition using a wrist-worn inertial measurement unit: a case study for industrial assembly lines,” in IEEE, In 2009 17th Mediterranean Conference on Control and Automation, Thessaloniki, 24–26. doi: 10.1109/MED.2009.5164574
Kwon, Y., Kang, K., and Bae, C. (2014). Unsupervised learning for human activity recognition using smartphone sensors. Expert Syst. Appl. 41, 6067–6074. doi: 10.1016/j.eswa.2014.04.037
Labour Force Survey (2018). Labour Force Survey. Avalibale at: https://www.stat.go.jp/data/roudou/ (accessed April 20, 2020).
Lim, J.-S., Song, K.-I., and Lee, H.-L. (2016). Real-time location tracking of multiple construction laborers. Sensors 16:1869. doi: 10.3390/s16111869
Lukowicz, P., Ward, J., Junker, H., Stäger, M., Tröster, G., Atrash, A., et al. (2004). “Recognizing workshop activity using body worn microphones and accelerometers,” in Pervasive Computing. Pervasive 2004. Lecture Notes in Computer Science, eds A. Ferscha and F. Mattern (Berlin: Springer).
Makikawa, M. (2016). Monitoring of physical activity in daily life using acceleration sensor. Trans. Jpn. Soc. Med. Biol. Eng. 54, 96–103.
Martín, H., Martín, H., Bernardos, A. M., Bernardos, A. M., Iglesias, J., Iglesias, J., et al. (2013). Activity logging using lightweight classification techniques in mobile devices. Pers. Ubiquit. Comput. 17, 675–695. doi: 10.1007/s00779-012-0515-4
Mathie, M. J., Coster, A. C. F., Lovell, N. H., and Celler, B. G. (2003). Detection of daily physical activities using a triaxial accelerometer. Med. Biol. Eng. Comput. 41, 296–301. doi: 10.1007/bf02348434
Matthews, C. E., Ainsworth, B. E., Thompson, R. W., and Bassett, D. R. Jr. (2002). Sources of variance in daily physical activity levels as measured by an accelerometer. Med. Sci. Sports Exerc. 34, 1376–1381. doi: 10.1097/00005768-200208000-00021
Naya, F., Ohmura, R., Takayanagi, F., Noma, H., and Kogure, K. (2006). “Workers’ routine activity recognition using body movements and location information,” in 2006 10th IEEE International Symposium on Wearable Computers, Montreux, doi: 10.1109/ISWC.2006.286351
Nweke, H. F., Teh, Y. W., Al-garadi, M. A., and Alo, U. R. (2018). Deep learning algorithms for human activity recognition using mobile and wearable sensor networks: state of the art and research challenges. Expert Syst. Appl. 105, 233–261. doi: 10.1016/j.eswa.2018.03.056
Park, M.-W., and Ioannis, B. (2012). Construction worker detection in video frames for initializing vision trackers. Autom. Constr. 28, 15–25. doi: 10.1016/j.autcon.2012.06.001
Peddi, A. (2008). Development of Human Pose Analyzing Algorithms for the Determination of Construction Productivity in Real-Time. Lawrence, KS: University of Kansas. M.S. Level.
Ramasamy, R., and Roy, N. S. (2018). Recent trends in machine learning for human activity recognition-A survey. Wiley Interdiscip. Rev. -Data Min. Knowl. Discov. 8:e1254. doi: 10.1002/widm.1254
Ryu, J., Seo, J., Jebelli, H., and Lee, S. H. (2018). Automated action recognition using an accelerometer-embedded wristband-type activity tracker. J. Constr. Eng. Manag. 145:04018114. doi: 10.1061/(ASCE)CO.1943-7862.0001579
Sarcevic, P., Sarcevic, P., Kincses, Z., Kincses, Z., Pletl, S., and Pletl, S. (2019). Online human movement classification using wrist-worn wireless sensors. J. Ambient. Intell. Humaniz Comput. 10, 89–106. doi: 10.1007/s12652-017-0606-1
Sun, S. J., Zheng, X. C., Gong, B., Paredes, J. G., and Ordieres-Mere, J. (2020). Healthy operator 4.0: a human cyber-physical system architecture for smart workplaces. Sensors 20:011.
Sztyler, T., and Stuckenschmidt, H. (2016). “On-body localization of wearable devices: an investigation of position-aware activity recognition,” in 2016 IEEE International Conference on Pervasive Computing and Communications, PerCom, 1–9.
Umer, W., Li, H., Lu, W., Pui Yuk Szeto, G., and Wong, A. Y. L. (2018). Development of a tool to monitor static balance of construction workers for proactive fall safety management. Autom. Constr. 94, 438–448. doi: 10.1016/j.autcon.2018.07.024
Valero, E., Sivanathan, A., Bosché, F., and Abdel-Wahab, M. (2017). Analysis of construction trade worker body motions using a wearable and wireless motion sensor network. Autom. Constr. 83, 48–55. doi: 10.1016/j.autcon.2017.08.001
Yang, C.-C., and Yeh-Liang, H. (2010). A review of accelerometry-based wearable motion detectors for physical activity monitoring. Sensors 10, 7772–7788. doi: 10.3390/s100807772
Yantao, Y., Heng, L., Waleed, U., Chao, D., Xincong, Y., Martin, S., et al. (2019). Automatic biomechanical workload estimation for construction workers by computer vision and smart insoles. J. Comput. Civ. Eng. 33:4019010. doi: 10.1061/(ASCE)CP.1943-5487.0000827
Yu, Y., Li, H., Yang, X., Kong, L., Luo, X., and Wong, A. Y. L. (2019). An automatic and non-invasive physical fatigue assessment method for construction workers. Autom. Constr. 103, 1–12. doi: 10.1016/j.autcon.2019.02.020
Zhang, M., Chen, S., Zhao, X., and Yang, Z. (2018). Research on construction workers’ activity recognition based on smartphone. Sensors 18:2667. doi: 10.3390/s18082667
Zheng, X., Wang, M., and Ordieres-Meré, J. (2018). Comparison of data preprocessing approaches for applying deep learning to human activity recognition in the context of industry 4.0. Sensors 18:2146. doi: 10.3390/s18072146
Keywords: accelerometer, construction sites, workers, motion, discrimination
Citation: Gondo T and Miura R (2020) Accelerometer-Based Activity Recognition of Workers at Construction Sites. Front. Built Environ. 6:563353. doi: 10.3389/fbuil.2020.563353
Received: 18 May 2020; Accepted: 12 August 2020;
Published: 09 September 2020.
Edited by:
Olli Seppänen, Aalto University, FinlandReviewed by:
Joaquín Ordieres Meré, Polytechnic University of Madrid, SpainCopyright © 2020 Gondo and Miura. This is an open-access article distributed under the terms of the Creative Commons Attribution License (CC BY). The use, distribution or reproduction in other forums is permitted, provided the original author(s) and the copyright owner(s) are credited and that the original publication in this journal is cited, in accordance with accepted academic practice. No use, distribution or reproduction is permitted which does not comply with these terms.
*Correspondence: Tomoyuki Gondo, Z29uZG9AYXJjaDEudC51LXRva3lvLmFjLmpw
Disclaimer: All claims expressed in this article are solely those of the authors and do not necessarily represent those of their affiliated organizations, or those of the publisher, the editors and the reviewers. Any product that may be evaluated in this article or claim that may be made by its manufacturer is not guaranteed or endorsed by the publisher.
Research integrity at Frontiers
Learn more about the work of our research integrity team to safeguard the quality of each article we publish.