 Marija Kušter Marić
 Joško Ožbolt2,3
94% of researchers rate our articles as excellent or good
Learn more about the work of our research integrity team to safeguard the quality of each article we publish.
Find out more
ORIGINAL RESEARCH article
Front. Built Environ., 02 October 2020
Sec. Bridge Engineering
Volume 6 - 2020 | https://doi.org/10.3389/fbuil.2020.561897
This article is part of the Research TopicRecent Advances in Service Life Prediction of Bridges and StructuresView all 8 articles
Although many models for service life predictions have been developed, their application to existing bridges is still not at a satisfactory level. The here presented coupled three-dimensional chemo-hygro-thermo-mechanical (CHTM) model can realistically simulate both corrosion phases: initiation and propagation. The focus of this research is the transport processes in cracked and uncracked concrete before reinforcement depassivation. Realistic environmental conditions with the surface water and chloride contents variable in time are simulated based on the meteorological data for a mountain region in Croatia where case studies bridges are located. Application of the large quantities of de-icing salts in combination with the poorly designed and executed details resulted in a high chloride content in concrete of the superstructure of both bridges: at the reinforcement level, chloride content in cracked concrete elements exceeds the threshold value up to 10 times. Numerical results match well with the chloride content measured on the bridges after 11 and 14 years of service. Accounting for the realistic environmental conditions (wetting–drying cycles, application of de-icing salts only in the winter season, etc.) in the numerical simulations results in the continuous transport processes in concrete and higher chloride content in deeper concrete layers as opposed to the finite element models with the constant boundary conditions.
Failure or even collapse of a bridge causes not only high direct and indirect costs, but sometimes, unfortunately, also human lives. In order to avoid tragedies such as the collapse of the Morandi Bridge in Genoa, Italy, where 43 people were killed (Calvi et al., 2018), regular maintenance and sustainable bridge management are required. As required financial investments are much higher than the available budget in any bridge management system worldwide, it is necessary to develop ranking and prioritizing methods for bridge maintenance at a network level. Besides assessment of the current conditions of the structures, in an efficient and effective bridge management system, it is important to predict their future deterioration and remaining service life using numerical models. Most bridges worldwide are made of concrete and exposed to de-icing salts and/or maritime environment. The main degradation process of those structures is chloride-induced corrosion of steel reinforcement in concrete. Once the threshold chloride content in concrete reaches the reinforcement level, reinforcement depassivation occurs, and electrochemical processes of active corrosion start. Consequences of reinforcement corrosion, e.g., reduction of reinforcement cross-sectional area, a decrease of rebars ductility, local concrete strength reduction, degradation of concrete cover, cover spalling, and loss of steel–concrete bond strength, have an impact on structure reliability by decreasing of load-bearing capacity and changing stiffness. Hence, it is important to consider structural consequences of reinforcement corrosion in the assessment of the time-variant structural safety (Castaldo et al., 2017). However, by including degradation models in probabilistic analysis of structure reliability, high level of uncertainties in knowledge on parameters and processes and their accumulation in complex degradation of structures such as chloride-induced reinforcement corrosion result in low reliability (e.g., high probability of depassivation; Zambon et al., 2019). In other words, to achieve real structure reliability, it is necessary to reduce uncertainties in material properties as well as in electrochemical and mechanical processes by application of more comprehensive models and their verification on existing structures.
Many chloride ingress models for service life prediction of structures have been developed in the last four decades with different levels of complexity and comprehensiveness using various calculation methods. Most of chloride ingress models are based on the Fick’s law and are applicable only in uncracked concrete including one-dimensional (1D) domain where only chloride diffusion through concrete is considered as a dominant transport process, e.g., Duracrete, Life365, the fib model code (MC) 2010 (Muthena et al., 2000; Life 365, 2005; Fib, 2013; Alexander and Beushausen, 2019). To achieve more realistic numerical simulation, it is necessary to include the impact of cracks and damage, which used to be present in concrete of real structure due to shrinkage, thermal effects, loading, etc. This improvement has been made in several models, and it has been found that cracks in concrete significantly reduced depassivation time (Djerbi et al., 2008; Ožbolt et al., 2010; Jang et al., 2011; Šavija and Schlangen, 2011; Bentz et al., 2013; Gu et al., 2015; Hájková et al., 2018; Shayanfar et al., 2020; Imounga et al., 2020; Kušter Marić et al., 2020). In damaged concrete, chlorides penetrate quickly in crack, but with time increase, chloride penetrates also in region between cracks; hence, it is important to include 2D or 3D finite element (FE) model. Additional improvements of numerical model can be made by (i) taking into account chloride binding, because only free chlorides are responsible for steel reinforcement depassivation (Nilsson, 2001; Ožbolt et al., 2010). Moreover, the most vulnerable concrete elements exposed to chlorides are subjected to frequent changes of water content; hence, for realistic simulation, it is important to include several transport processes in concrete, e.g., water diffusion, chloride diffusion, and convection and wetting–drying cycles.
Although there are several model applications on existing bridges (Stipanović et al., 2010; Nguyen et al., 2017; Tesfamariam et al., 2018; Kušter Marić et al., 2020), there is still a big challenge to include service life prediction in bridge management worldwide due to complexity of transport and corrosion processes in reinforced concrete structures, but also due to difficulty in quantifying material-, mechanical-, and corrosion-related parameters and their interaction. Namely, in order to realistically predict corrosion-induced damage of concrete structures, more sophisticated models based on the theory of transport processes and electrochemistry need to be developed and applied on existing structures for their verification.
Several chloride ingress models include wetting–drying cycles and concrete cracking (Ožbolt et al., 2010; Ye et al., 2012; Zanden et al., 2015; Ožbolt et al., 2016b; Wang et al., 2018); however, according to available literature, so far none of them is applied on existing concrete bridge exposed to de-icing salts and compared with measured results.
A coupled 3D chemo-hygro-thermo-mechanical (CHTM) model that is capable of realistically simulating both corrosion phases—initiation and propagation—is briefly presented at the beginning of the article. The model is applied to several FE simulations with a focus on the initiation part of reinforcement corrosion in concrete. In the first study, realistic environmental conditions with the surface water and chloride contents variable in time are simulated, based on the meteorological data for a mountain region, on the FE models with cracked and uncracked concrete. The FE models with variable boundary surface water and chloride content and with wetting–drying cycles are compared with the FE models with the constant boundary conditions and without wetting–drying cycles. Then the FE models with the variable boundary conditions and wetting–drying cycles are applied to a case study—twin concrete bridges exposed to de-icing salts. Numerical and measured values of the chloride content in concrete are compared and causes of chloride-induced deterioration of structures are analyzed.
The 3D CHTM model is a coupled physical model that simulates mechanical, transport, and corrosion processes before and after depassivation of steel reinforcement in concrete in real environmental conditions, but also accelerated corrosion in laboratory (Ožbolt et al., 2010, 2011, 2012, 2013, 2016a, 2016b, 2017a,b; Sola et al., 2016). The model includes the following physical, electrochemical, and mechanical processes: (i) transport of capillary water, heat, oxygen, and chloride through the concrete cover; (ii) immobilization of chloride in the concrete; (iii) cathodic and anodic polarization; (iv) transport of OH– ions through electrolyte in concrete pores; (v) oxygen consumption on steel surface due to cathodic and anodic reaction; (vi) distribution of electrical potential and current density; (vii) transport of corrosion products in concrete and cracks; and (viii) concrete cracking due to mechanical and non-mechanical actions.
The model is implemented into the 3D FE code, and according to the available literature, it is one of the most comprehensive models containing all the following features (Kušter Marić et al., 2018):
• Geometry of a structure and position of reinforcement bars can be optionally modeled in 3D spatial domain.
• The mechanical part of the model, based on the microplane model, is able to realistically simulate behavior of a structure under different types of loading: static, dynamic, cyclic, and impact loading (Ožbolt et al., 2001).
• Both phases of reinforcement corrosion, initiation, and propagation are included.
• The model can simulate non-mechanical and mechanical processes and their interaction before and after depassivation of steel reinforcement.
• Influence of concrete damage (e.g., cracks, voids, layering) on transport and corrosion processes is taken into account by employing concrete diffusivity as a function of crack width based on the experimental results on concrete permeability (Ožbolt et al., 2010).
• Transport processes are modeled to simulate both natural environment (chlorides from a sea or de-icing salts) and laboratory conditions of accelerated corrosion (Sola et al., 2016).
• Chloride and water ingress in concrete are simulated by taking into account wetting–drying cycles and hysteresis, while boundary conditions can vary in time (Ožbolt et al., 2016b).
The transport processes before depassivation of steel reinforcement are analyzed in this research. The novelty in the subsequently improved 3D CHTM model, first presented in this article, is the application of transport model with wetting–drying cycles in cracked concrete, including arbitrary widths and shapes of cracks. The basic mathematical descriptions are given here, whereas more details can be found in literature (Ožbolt et al., 2010, 2016b). Because of the complexity of the 3D CHTM model and the size limitation of the article, the propagation phase is not presented here.
The proposed research includes application of the 3D CHTM model on the real structures. Disadvantage of the model is that high-performance computer servers and long computing time are required to solve the system of high non-linear equations of transport and corrosion processes in concrete. Therefore, only small samples of the structure are analyzed with assumed crack geometry, initial, and boundary conditions.
Content of capillary water in concrete has significant influence on chloride penetration in concrete and depassivation time. Namely, chlorides penetrate in concrete mainly through diffusion and convection. In saturated concrete, with constant capillary water content in concrete, slower chloride diffusion is dominant process, whereas faster convection is dominant in non-saturated concrete with included wetting–drying cycles.
Moisture content in concrete depends on its environment: air relative humidity, exposure to precipitation, and bodies of water (sea, river, and lake), etc. Concrete is porous material, and moisture content may differ for the same relative humidity and temperature. Namely, there are different curves that relate the relative humidity and water in concrete pores during wetting (adsorption) and drying (desorption) at a constant temperature. The hysteretic moisture behavior of concrete is described by two isotherms: desorption curve above and the adsorption isotherm below; i.e., the hysteresis loops are observed during wetting and drying cycles (Ožbolt et al., 2016b).
Wetting and drying cycles are modeled assuming that concrete is exposed only to changes in relative humidity. The distribution of pore humidity is expressed as (Kwiatkowski et al., 2009; Ožbolt et al., 2016b):
where h is the relative humidity (dimensionless), t is time (s), ρw is the density of water (kg of water/m3 of water), θw is the volume fraction of pore water (m3 of water/m3 of concrete), δv(h) is the water vapor permeability (s), pv,sat is the water vapor saturation pressure (Pa), and is the moisture capacity (derivative of the sorption isotherm).
The sorption curves are chosen from the literature considering corresponding water cement ratios. The main adsorption and desorption isotherms for concrete used in this research (w/c = 0.48) are described by Hansen (1990):
where ua and ud are the moisture content in concrete (mass percent related to dry mass of concrete) for adsorption and desorption, respectively; θwa and θwd are the volume fractions of water for adsorption and desorption, respectively, and ρcon is the assumed concrete density.
The water content in concrete during wetting–drying cycles, scanning between the main adsorption and desorption isotherms, can be expressed as (Ožbolt et al., 2016b):
in which θw0 is the initial volume fraction of water, and Δh is the difference between humidity at the time j+1 and j at spatial point i, depending on the chosen time step (Ožbolt et al., 2016b).
The hysteresis model included in the 3D CHTM model includes calculation of volume fraction in concrete based on adsorption and desorption curves and the derivative of the sorption isotherm at a given relative humidity. The model is applicable for different types of concrete (c/w) and exposure to different temperatures and relative humidities (Ožbolt et al., 2016b).
Transport of chloride ions through a non-saturated concrete is simulated as convection, diffusion, and physically and chemically binding by cement hydration product (Ožbolt et al., 2016b):
where Cc is the concentration of free chloride dissolved in pore water (kg of free chlorides/m3 of pore solution), T is the temperature (K), Dc(θw,T) is the effective chloride diffusion coefficient (m2/s), Ccb is the concentration of bound chloride (kg of bound chlorides/m3 of concrete), kr is the binding rate coefficient, and α = 0.7 is constant.
Chloride diffusion coefficient is expressed as a function of water content, θw, and concrete temperature, T (Ožbolt et al., 2016b):
where Dc,ref is the reference value of Dc evaluated at standard conditions, hc = 0.75, h(w) expresses dependence of relative humidity on pore water content in concrete according to the adsorption isotherms used in the model (Hansen, 1986), U is the activation energy of the chloride diffusion process (44.6 kJ/mol for w/c = 0.5), R is the universal gas constant [8.31 × 10⁻³ kJ/(mol ⋅ K)], and Tref = 296 K.
Temperature distribution in concrete is calculated based on the constitutive law for the heat flow and conservation of energy (Ožbolt et al., 2010):
where λ is the thermal conductivity [W/(m ⋅ K)], c is the heat capacity per unit mass of [J/(K ⋅ kg)], and W is the internal source of heating (W/m3).
The mechanical part of the 3D CHTM model is based on the microplane model for concrete with relaxed kinematic constraint (Ožbolt et al., 2001). In the FE analysis, cracks are treated in a smeared way; i.e., smeared crack approach is employed. To ensure the objectivity of the results with respect to the size of the FEs, the crack band method is used (Bažant and Oh, 1983).
The governing equation for the mechanical behavior of a continuous body in the case of static loading condition is as follows (Ožbolt et al., 2001):
in which Dm is the material stiffness tensor, ρb is the specific volume load, T is the temperature, and u is the displacement field.
Water and chloride penetration in concrete structures depends on concrete properties and the presence of cracks, cavities, and other damage of concrete (Wong et al., 2010; Wang and Ueda, 2011; Ghasemzadeh and Pour-Ghaz, 2015). In the current version of the 3D CHTM model, the water vapor permeability, δv(h,cw) is employed as a function of crack width:
where kp is the normalized permeability coefficient, which is obtained by dividing the water permeability coefficient a(cw) of cracked concrete at the crack width cw by permeability of the uncracked concrete, a(cw0). Based on the experimental results for water permeability in cracked and fully saturated concrete (Wang et al., 1997; Aldea et al., 2000), normalized permeability coefficient is calculated as (Ožbolt et al., 2010; Kušter Marić et al., 2020):
Up to a crack width of cw0 = 0.05 mm, the normalized permeability coefficient is the same as for uncracked concrete, and when crack width reaches the threshold value of cwc = 0.20 mm, water permeability of concrete increases up to its maximum value. For wider cracks, the normalized permeability in cracked concrete is assumed to be constant because of numerical and physical reasons (Ožbolt et al., 2010).
The above presented 3D CHTM model is implemented into an FE code. The numerical analysis starts after geometry, initial, and boundary conditions are defined, and FE mesh generated. Each time step includes two parts: (i) transport and corrosion processes and (ii) mechanical processes. The numerical analysis is incremental. In each time or load step, partial differential equations of non-mechanical and mechanical part of the model are solved simultaneously. When the solving non-mechanical part of the problem, mechanical parameters are constant, equal to those from the previous time step, and vice versa. In this research, only transport processes relevant for the initiation stage of corrosion are analyzed. Hence, after material parameters evaluation, distribution of water, temperature, and free and bound chlorides are calculated.
The 3D CHTM model is applied for the numerical simulation of chloride ingress in concrete under different exposure to de-icing salts.
The model geometry and FE mesh are shown in Figure 1. Eight-node solid elements are used for concrete and two-node bar elements for reinforcement. In order to ensure numerical stability of strongly non-linear analysis, very fine mesh is used, with FE height varying from 0.1 mm closer to the exposed surface to 1.0 mm in the deeper layer of concrete, whereas width and depth of FEs are constant and equal to 0.5 mm. Concrete cover depth is 30 mm. Time intervals gradually increase from 3,600 s (1 h) up to 2.592 × 10⁶ s (1 month), and 14.5 years of exposure in total is simulated. The model is limited to 3,864 nodes and 1,762 elements in order to achieve total computation time of 24 h on a single processor workstation.
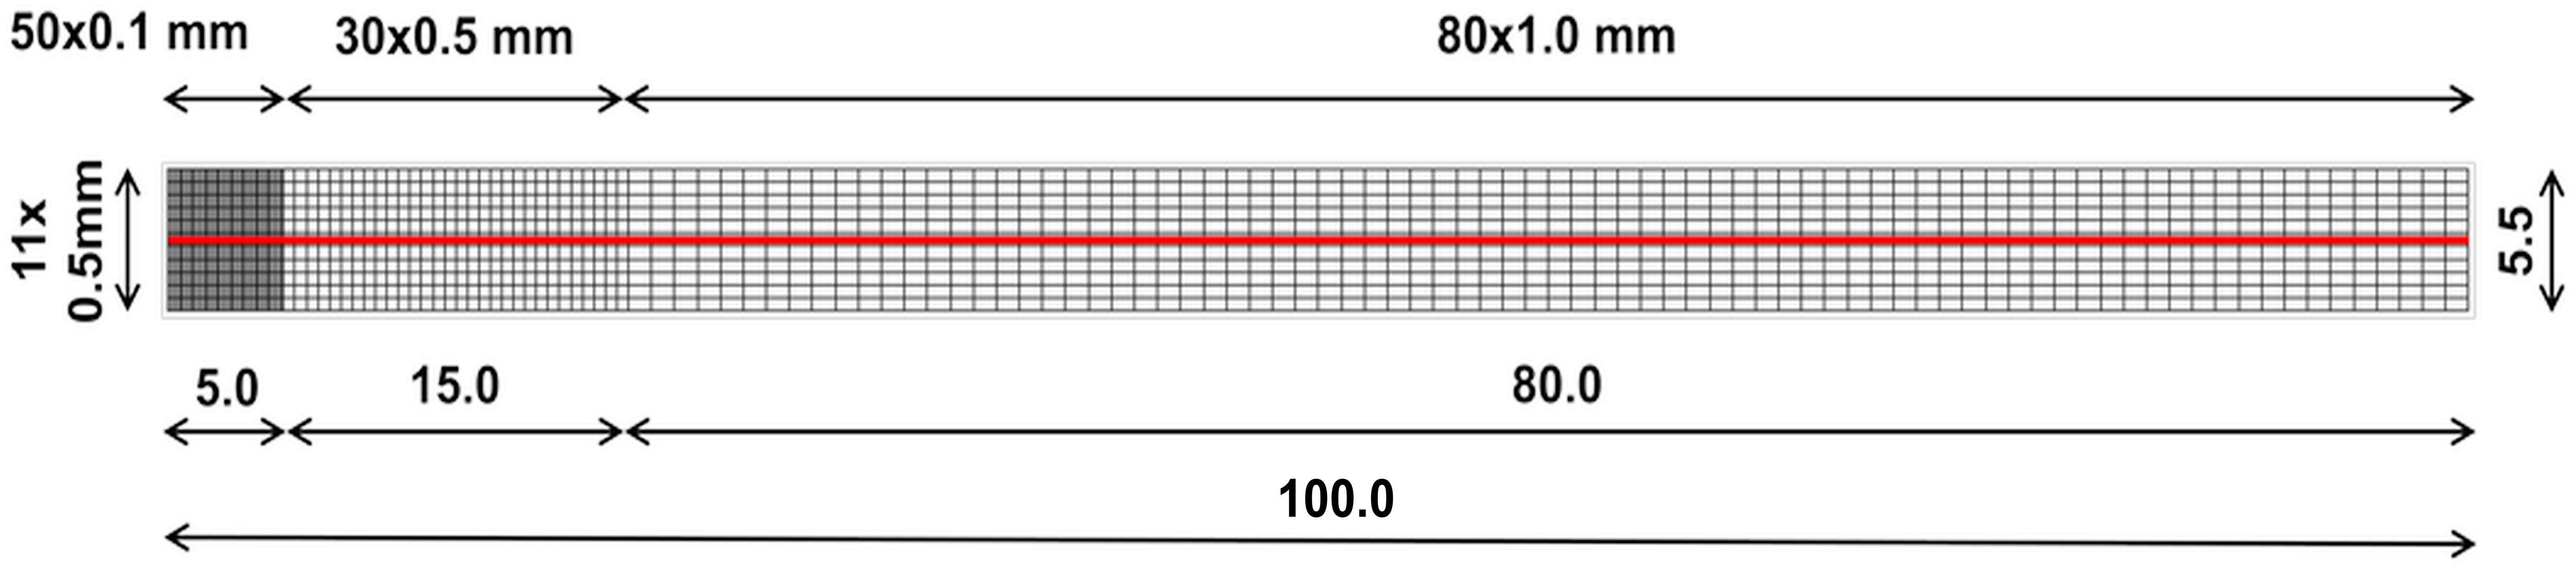
Figure 1. Geometry and the finite element discretization of the model (all dimensions are in mm).
Non-linear equations of transport and mechanical processes (1–7) are rewritten into the weak form using Galerkin weighted residual method. The equations are solved iteratively in each time step by employing Newton–Raphson iterative procedure. Because of very high non-linearity in the calculation of transport processes predefined, the maximal number of iterations is 99, whereas for the mechanical part of the model it is 49.
The non-linear FE analyses are carried out by deterministic approach considering mean values of material properties and environmental action. The FE models used to be subjected to model uncertainties; however, it is possible to adopt probability method. Moreover, the probability method, as the unique safety format able to perform reliable structure assessment, is more suitable for such a local model in comparison with other global resistance methods for non-linear FE analysis, e.g., partial factor method, method of estimating the coefficient of variation of the structural resistance (ECOV), global resistance factor, and global safety format (Castaldo et al., 2019).
The material parameters are summarized in Table 1. Mechanical and material properties are based on the measurements carried out on the case studies bridges (IGM, 2018), while properties related to the transport processes in concrete are taken from the relevant literature (Hansen, 1986; Saetta et al., 1993; Bažant and Kaplan, 1996; Akita et al., 1997; Tang and Nilsson, 1997).
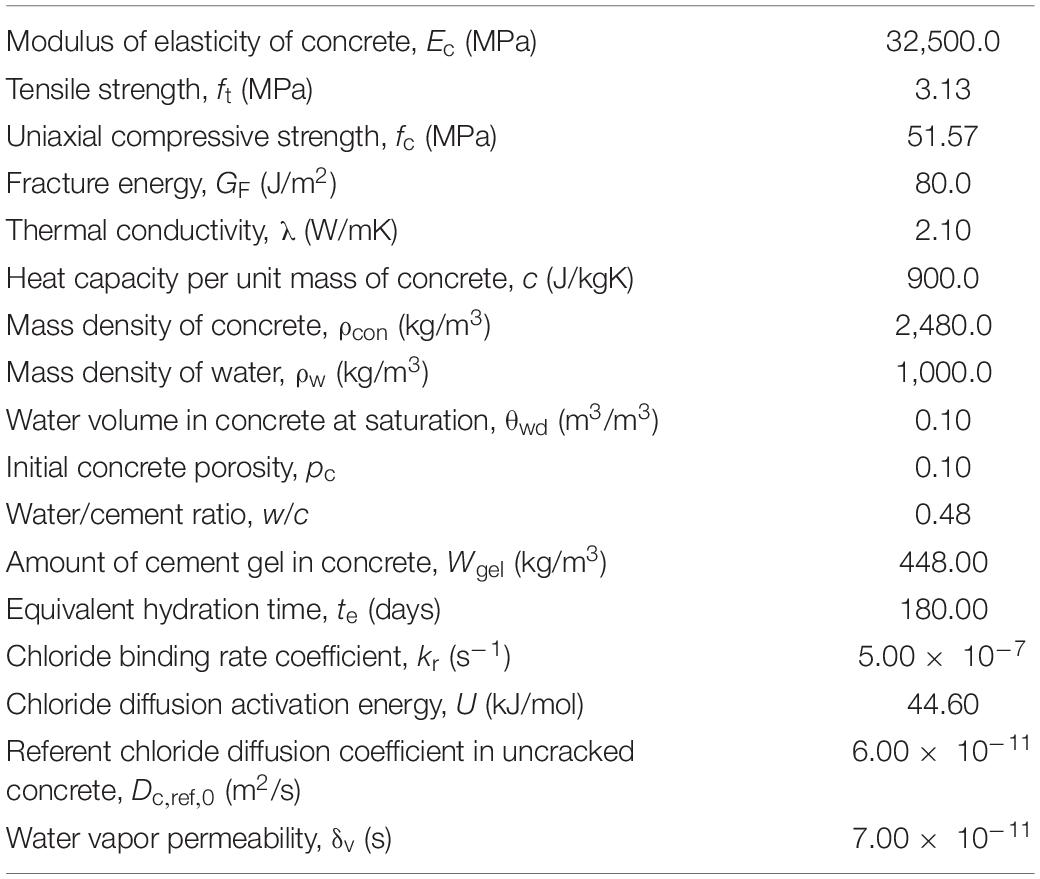
Table 1. Summary of material parameters for numerical analysis (Page et al., 1981; Saetta et al., 1993; Bažant and Kaplan, 1996; Akita et al., 1997; Tang and Nilsson, 1997; IGM, 2018).
The transport processes are analyzed for uncracked and cracked concrete assuming a crack in the middle of the specimen (Figure 1). Parallel-face crack is assumed for four different crack widths, ranging from ≤ 0.05 mm (considered as uncracked concrete) to ≥ 0.20 mm (considered as open crack). Crack width is assumed to be constant over the entire length of the specimen.
Environmental conditions are based on the existing meteorological data for the location of the case studies bridges and change from month to month (Table 2). Numerical simulations are provided taking into account wetting–drying cycles, and three different surface chloride contents are assumed as follows: WD1—low surface chloride content, with the maximum winter value of 9 kg of chlorides per cubic meter of concrete pore solution; WD2—moderate surface chloride content, with the maximum winter value of 12 kg of chlorides per cubic meter of pore solution; and WD3—high surface chloride content, with the maximum winter value of 20 kg of chlorides per cubic meter of pore solution. For the moderate chloride exposure condition (WD2), additional numerical simulations are conducted without simulation of the wetting–drying cycles. For this case, constant boundary condition is assumed, which represents the mean annual values and is marked as noWD2 (Table 2). Initial condition for water is θwi = 0.010 m3 of capillary water per cubic meter of concrete, whereas initial chloride concentration in concrete is Cc = 0.00 kg/m3. Because the exposed surface is relatively small, surface chloride content and relative humidity are uniformly distributed. However, the 3D CHTM model enables non-uniform boundary condition for chloride and water exposure to one or more concrete surfaces.
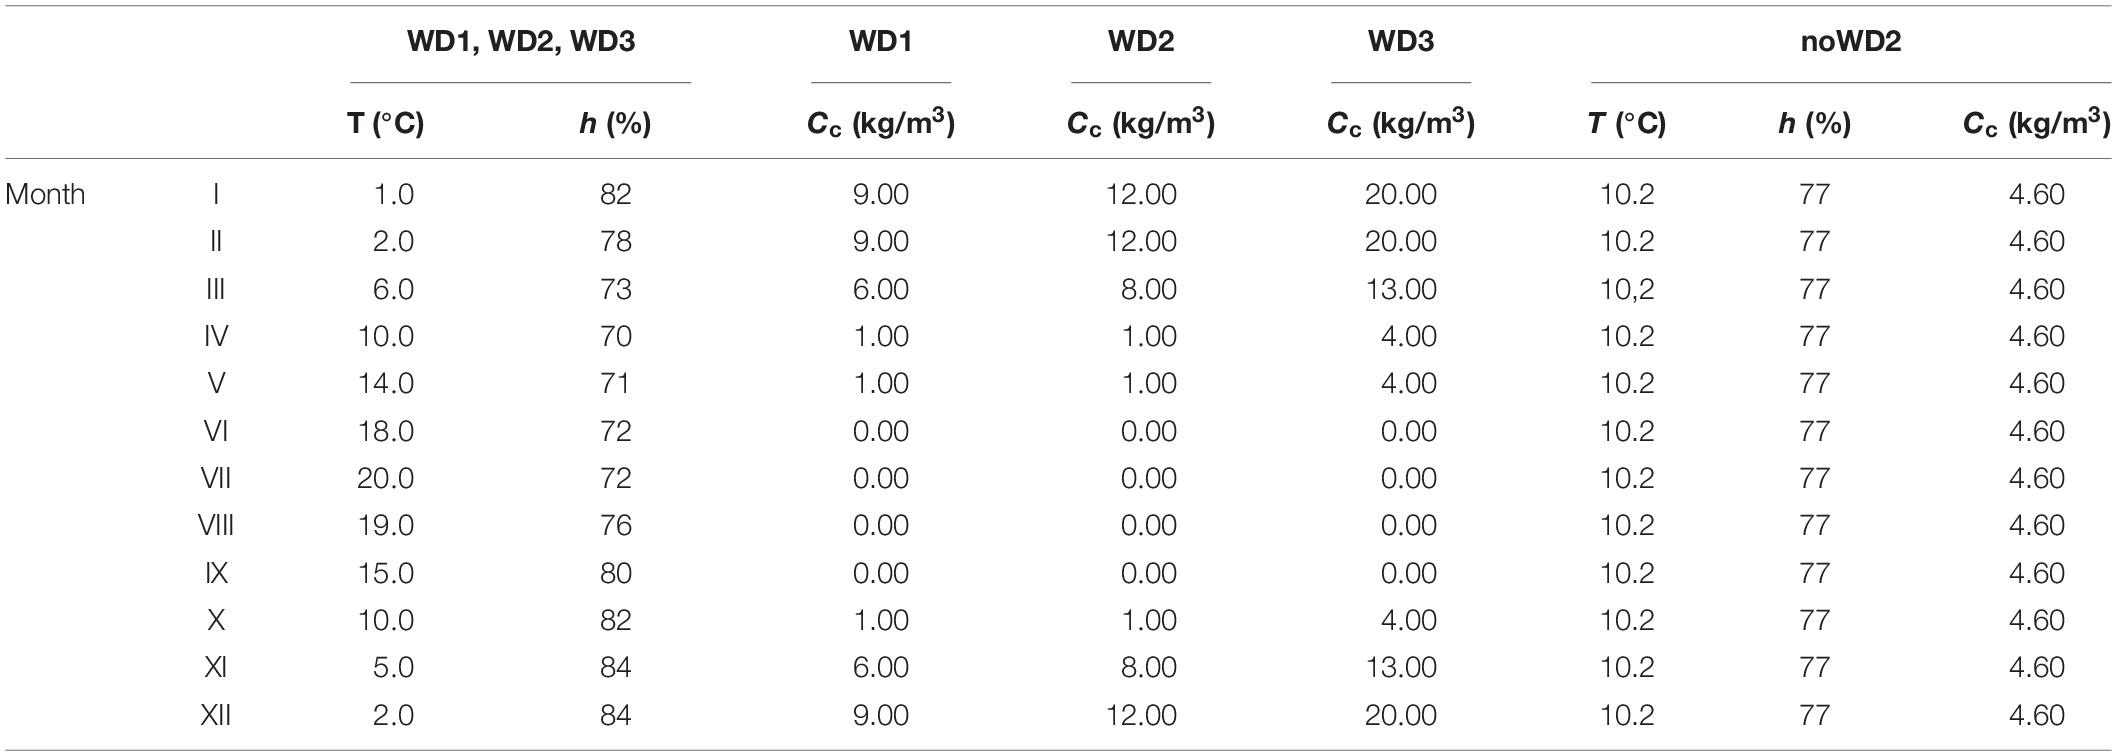
Table 2. Boundary conditions for numerical simulations (DHMZ, 2019).
The goal of the first part of the study is comparison of the cases with the moderate surface chloride content with (WD2) and without (noWD2) wetting drying cycles. The case noWD2 has constant boundary values of capillary water, relative humidity, temperature, and surface chloride content, which are calculated as annual mean values of the model WD2.
The distributions of free and bound chlorides in the specimen per month during the 1st and 10th year of moderate chloride exposure are shown for cases with and without wetting–drying cycles and different crack widths (Figures 2–5). The total chloride content from numerical simulations is calculated as percentage of concrete mass:
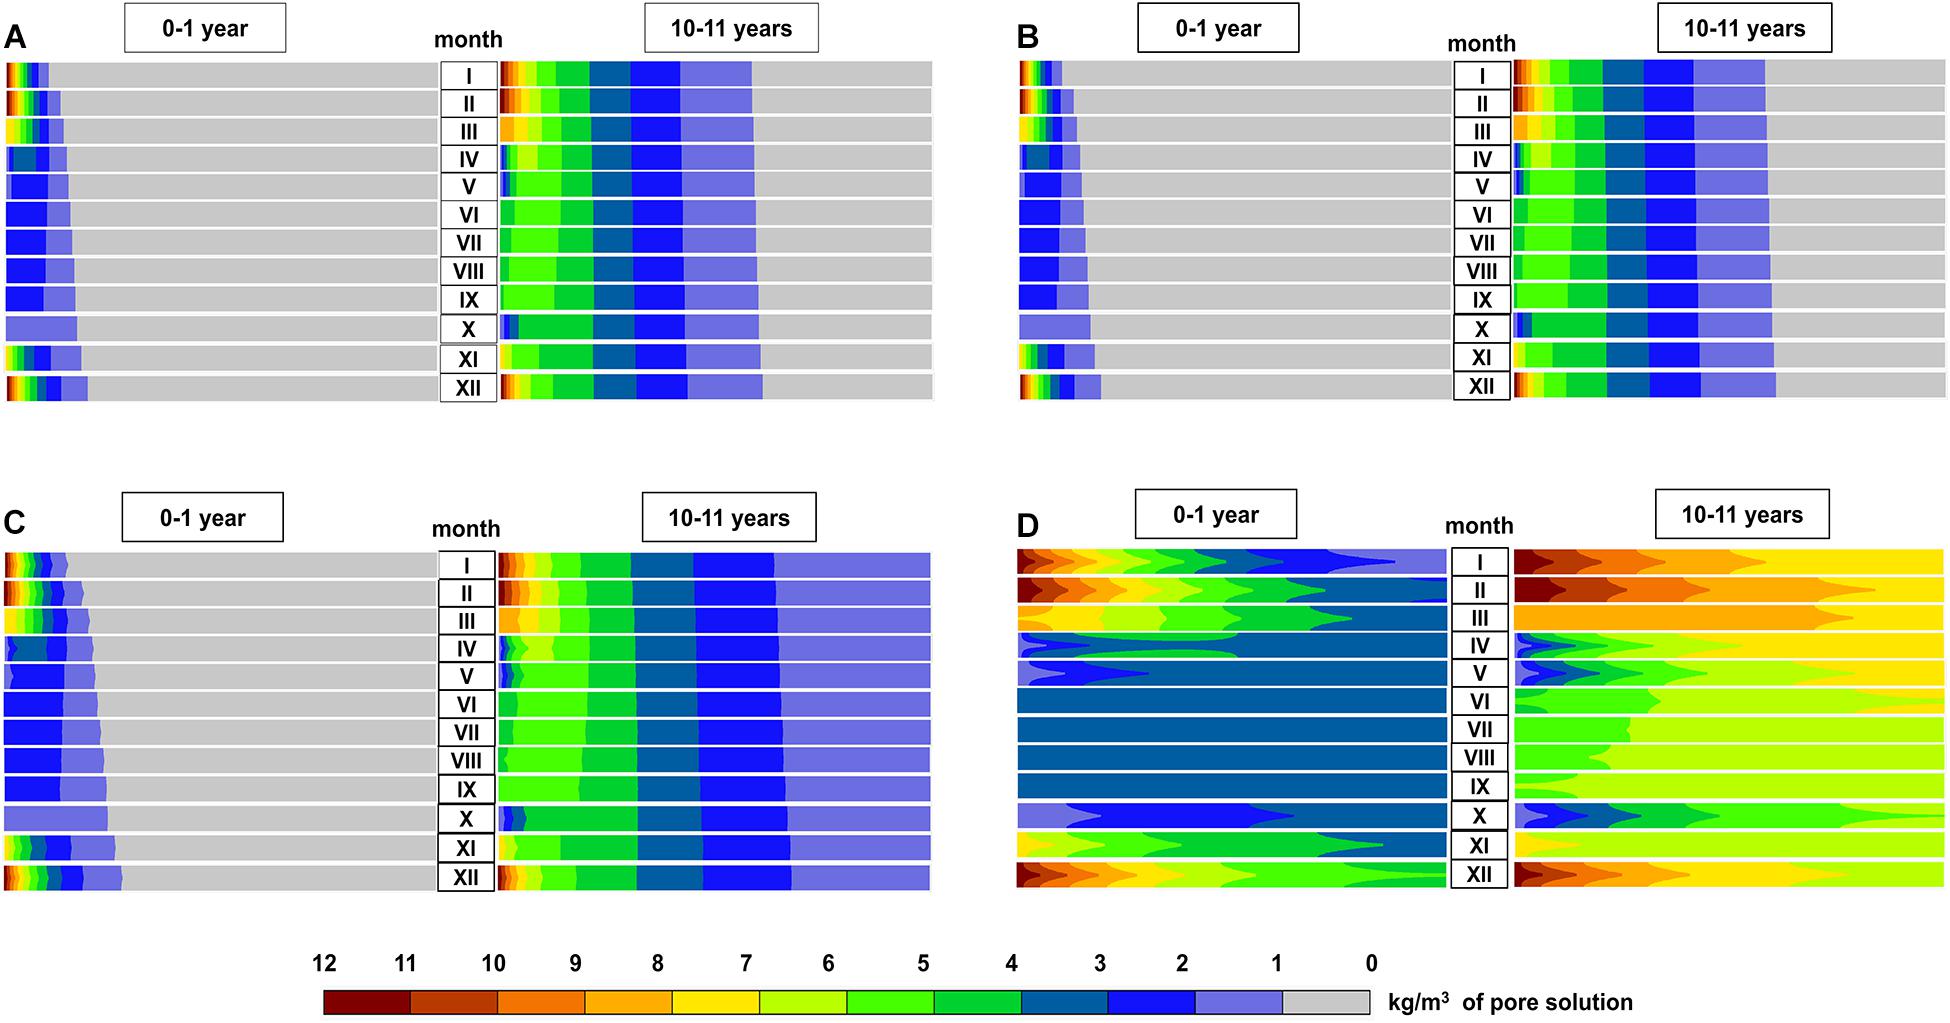
Figure 2. Distribution of free chlorides (kg/m3 of pore solution) over the length of the concrete specimen per month during the 1st and 10th year of service for the numerical models with wetting–drying cycles and exposure condition WD2 for different crack widths (cw): (A) cw ≤ 0.05 mm, (B) cw = 0.10 mm, (C) cw = 0.15 mm, and (D) cw = 0.20 mm.
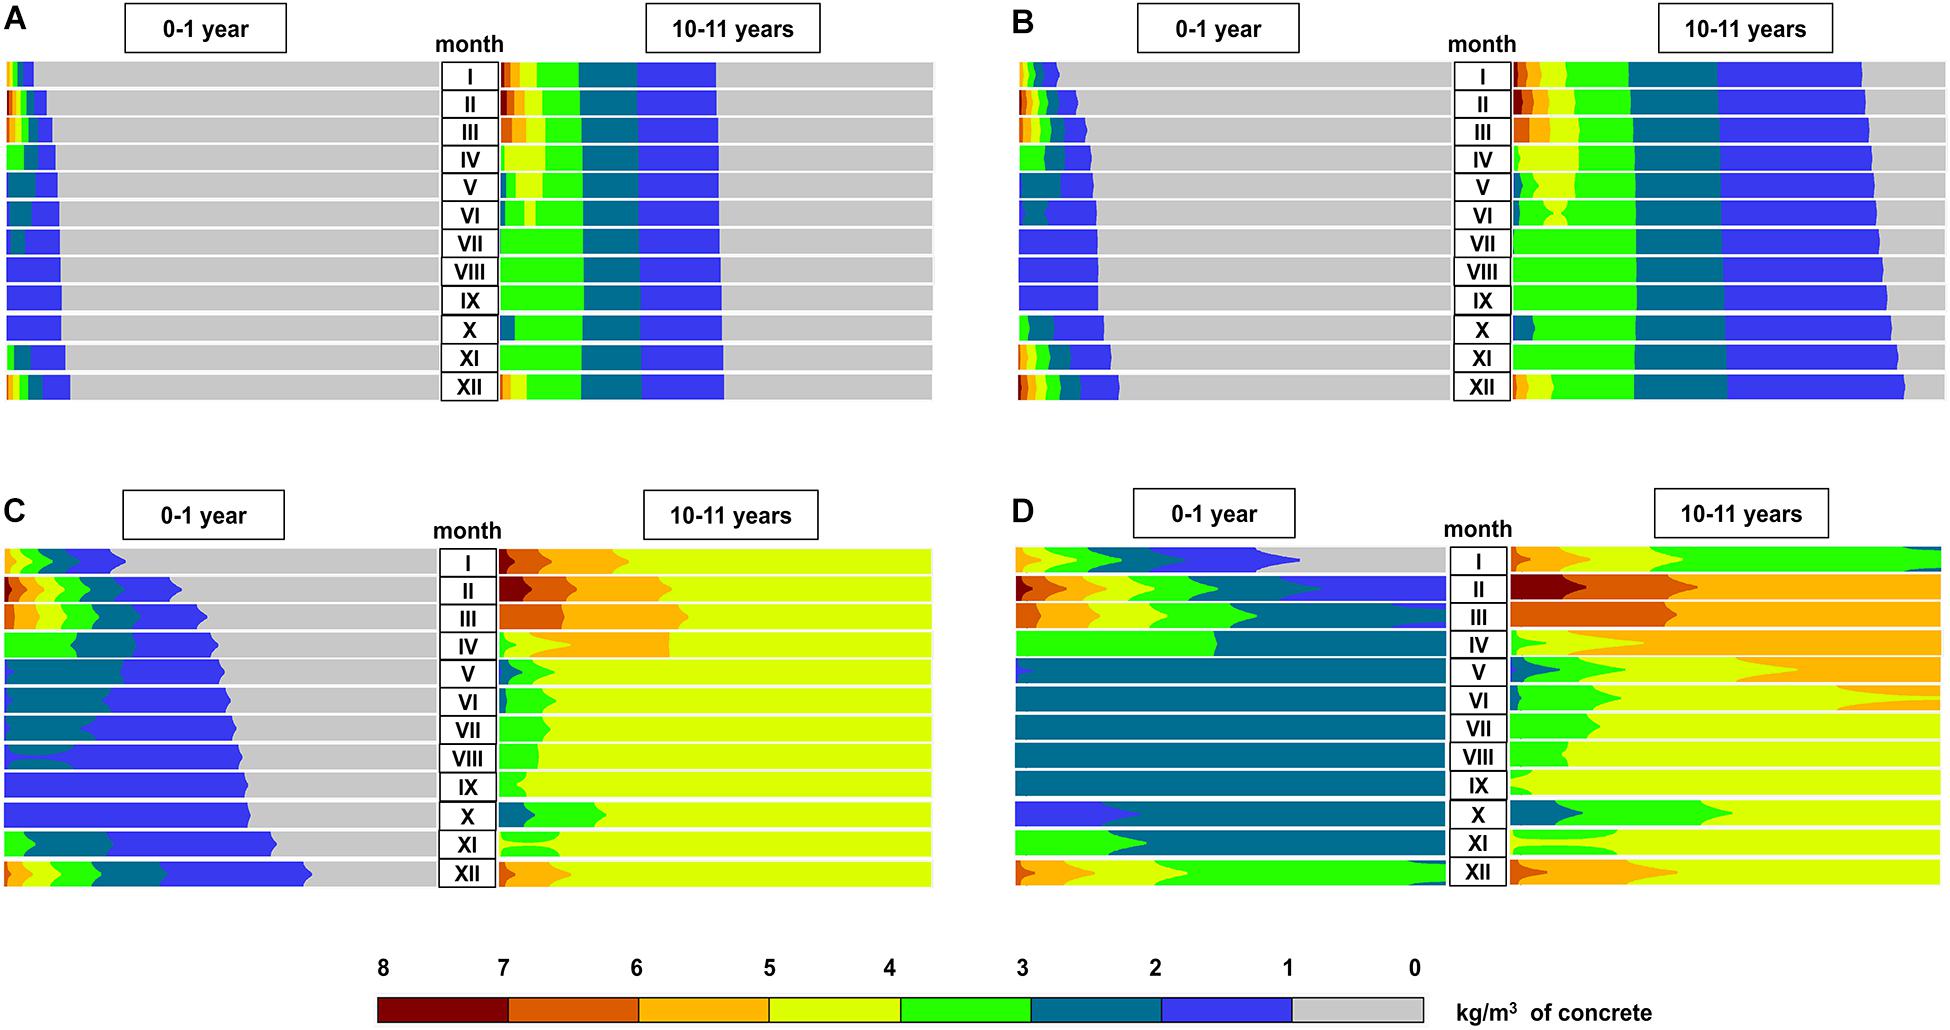
Figure 3. Distribution of bound chlorides (kg/m3 of concrete over the length of the concrete specimen per month during the 1st and 10th year of service for the numerical models with wetting–drying cycles and exposure condition WD2 for different crack widths (cw): (A) cw ≤ 0.05 mm; (B) cw = 0.10 mm; (C) cw = 0.15 mm, and (D) cw = 0.20 mm.
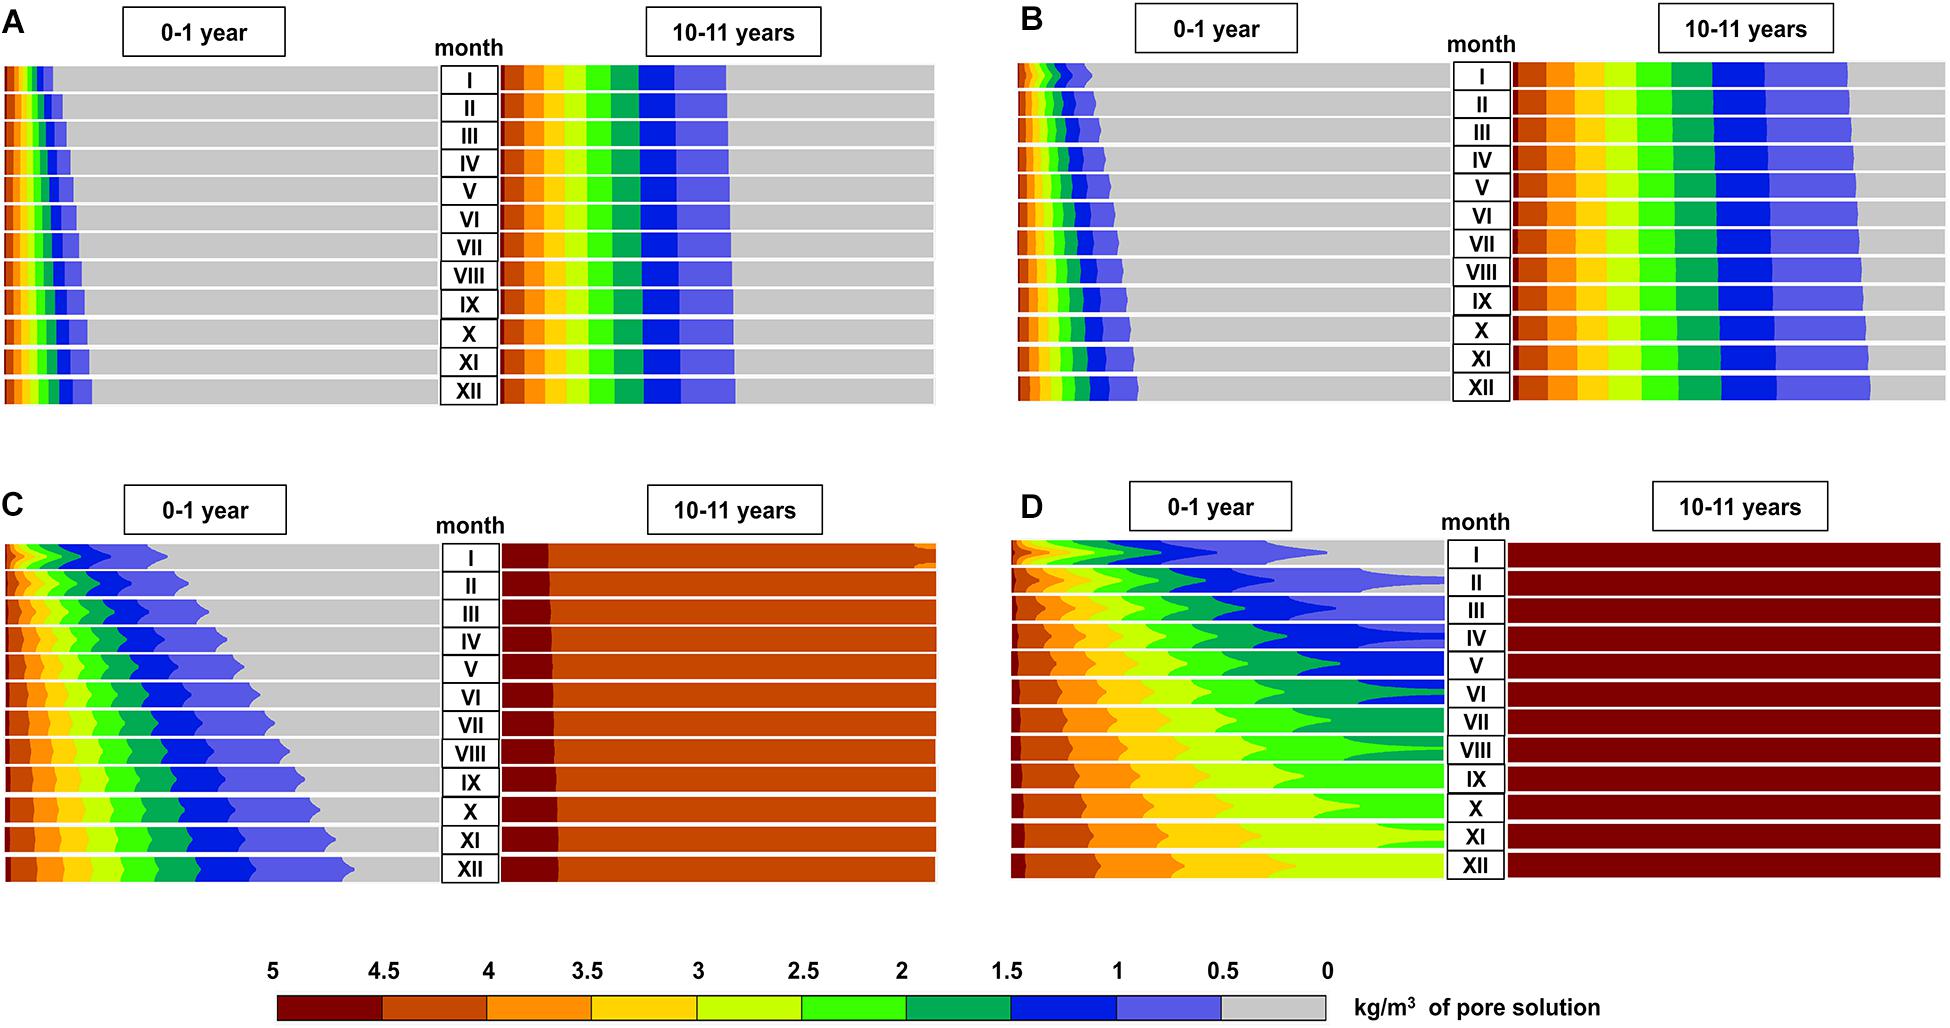
Figure 4. Distribution of free chlorides (kg/m3 of pore solution) over the length of the concrete specimen per month during the 1st and 10th year of service for the numerical models without wetting–drying cycles and exposure condition noWD2 for different crack widths (cw): (A) cw ≤ 0.05 mm, (B) cw = 0.10 mm, (C) cw = 0.15 mm, and (D) cw = 0.20 mm.
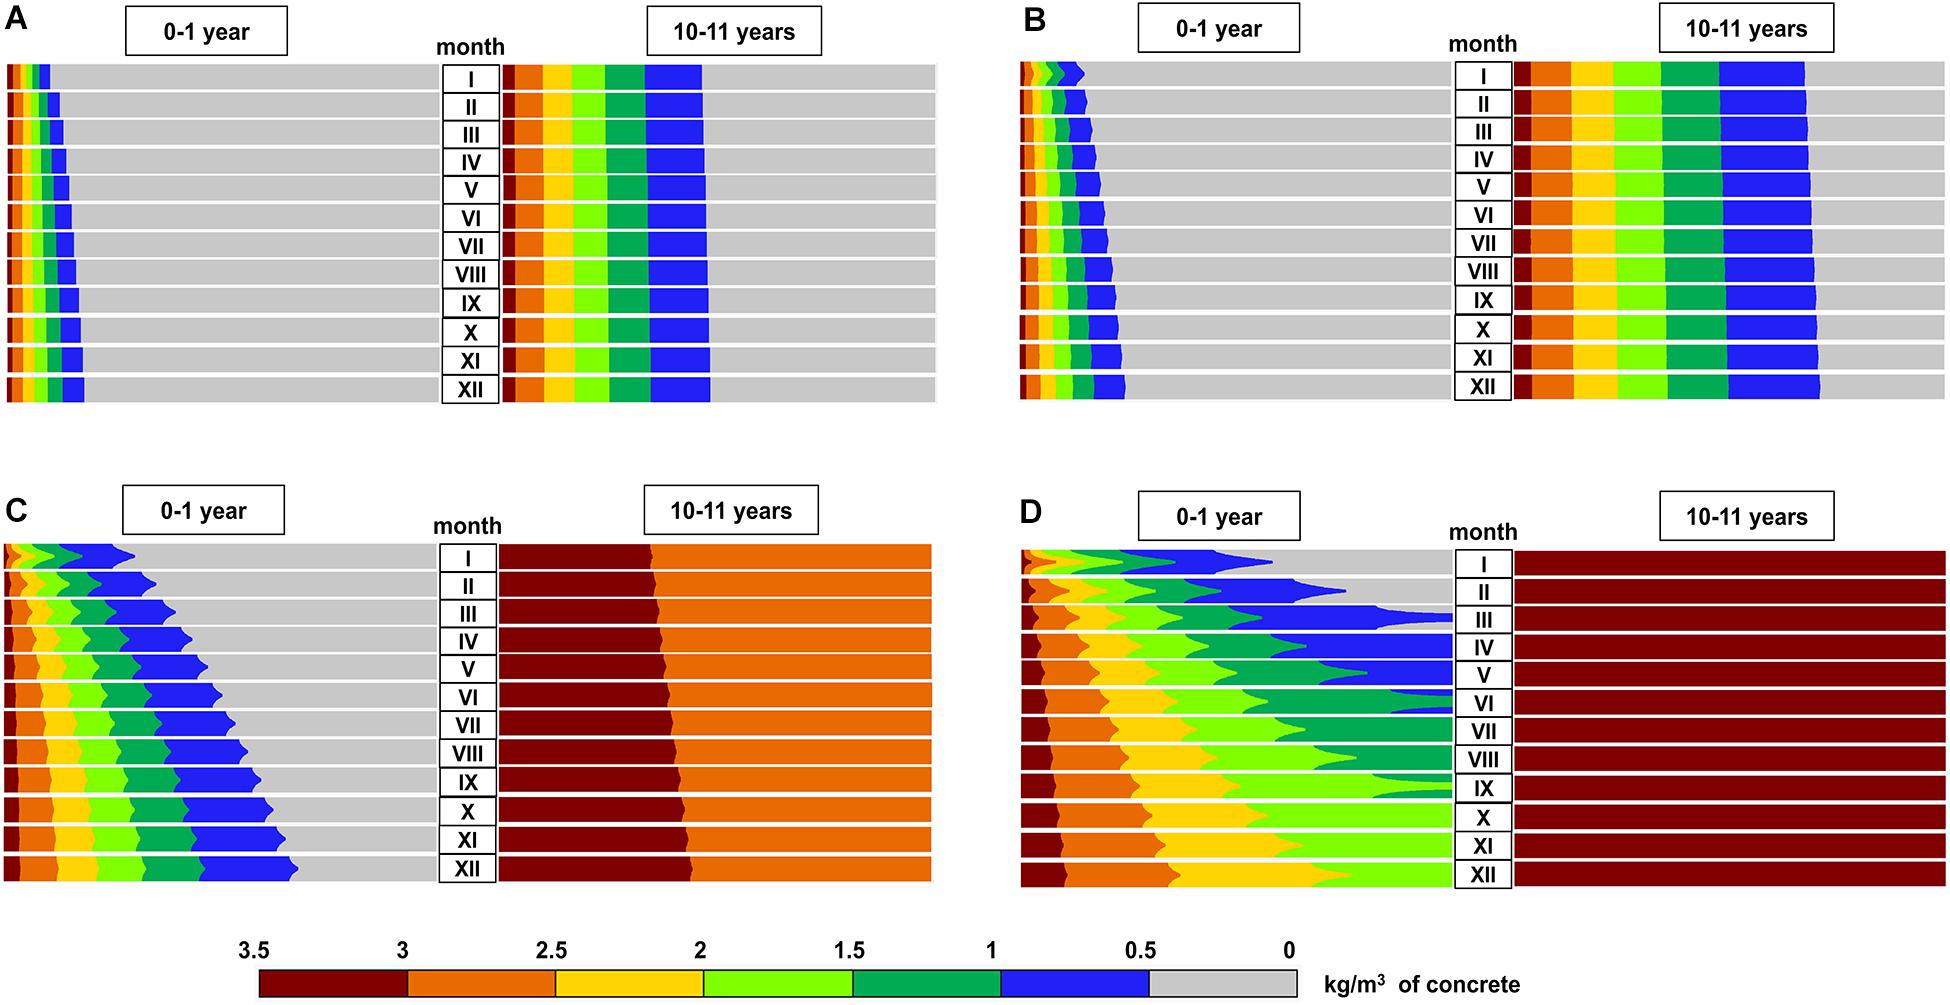
Figure 5. Distribution of bound chlorides (kg/m3 of concrete) over the length of the concrete specimen per month during the 1st and 10th year of service for the numerical models without wetting–drying cycles and exposure condition noWD2 for different crack widths (cw): (A) cw ≤ 0.05 mm, (B) cw = 0.10 mm, (C) cw = 0.15 mm, and (D) cw = 0.20 mm.
Comparison of total (free + bound) chloride content in concrete after 11 years of exposure to moderate chloride environment for the numerical models with (WD2) and without (noWD2) wetting–drying cycles is shown in Figures 6A–D for different crack widths. In the simplest model, without wetting–drying cycles and crack in concrete, cw ≤ 0.05 mm (Figures 4A, 5A), free and bound chloride contents increase in concrete gradually during the 1st and 10th year of exposure. With increasing crack width, cw ≥ 0.10 mm (Figures 4B–D), deeper penetration and higher content of free and bound chlorides in concrete are observed. During the 10th year of service for the crack width of 0.15 mm (Figures 4C, 5C), maximum free and bound chlorides content is achieved almost throughout the whole specimen. At the same time, for crack width of 0.20 mm, there is no further chloride transport after 11 years of exposure because the maximum values of free and bound chlorides are already achieved through the entire specimen (Figures 4D, 5D). This can be also seen in Figure 6D where the total amount of chlorides is compared for the models with the moderate surface chloride concentration with (WD2) and without (noWD2) wetting–drying cycles after 11 years of exposure. In the numerical simulations with wetting–drying cycles (Table 2 and Figures 2, 3), surface chloride content changes by month with the maximal values during the winter and no de-icing salts during the warm season. As it is also observed for models without wetting–drying cycles (noWD2) with wider cracks chlorides penetrate deeper and with greater content in concrete from December to February, when maximal amounts of de-icing salts are used. However, with higher temperature, usage of de-icing salts decreases, and chlorides in surface layers of concrete are washed out because of exposure to rain. The reduction of chloride content in the surface layers of concrete after the winter season is more pronounced at wider cracks (Figures 2, 3). Concrete depth, at which the chloride content varies according to environmental conditions, is 10 mm for uncracked concrete (cw ≤ 0.05 mm), 15 mm for the crack width of cw = 0.10 mm, 40 mm for the crack width of cw = 0.15, and 90 mm for open crack (cw ≥ 0.20 mm; Figure 6).
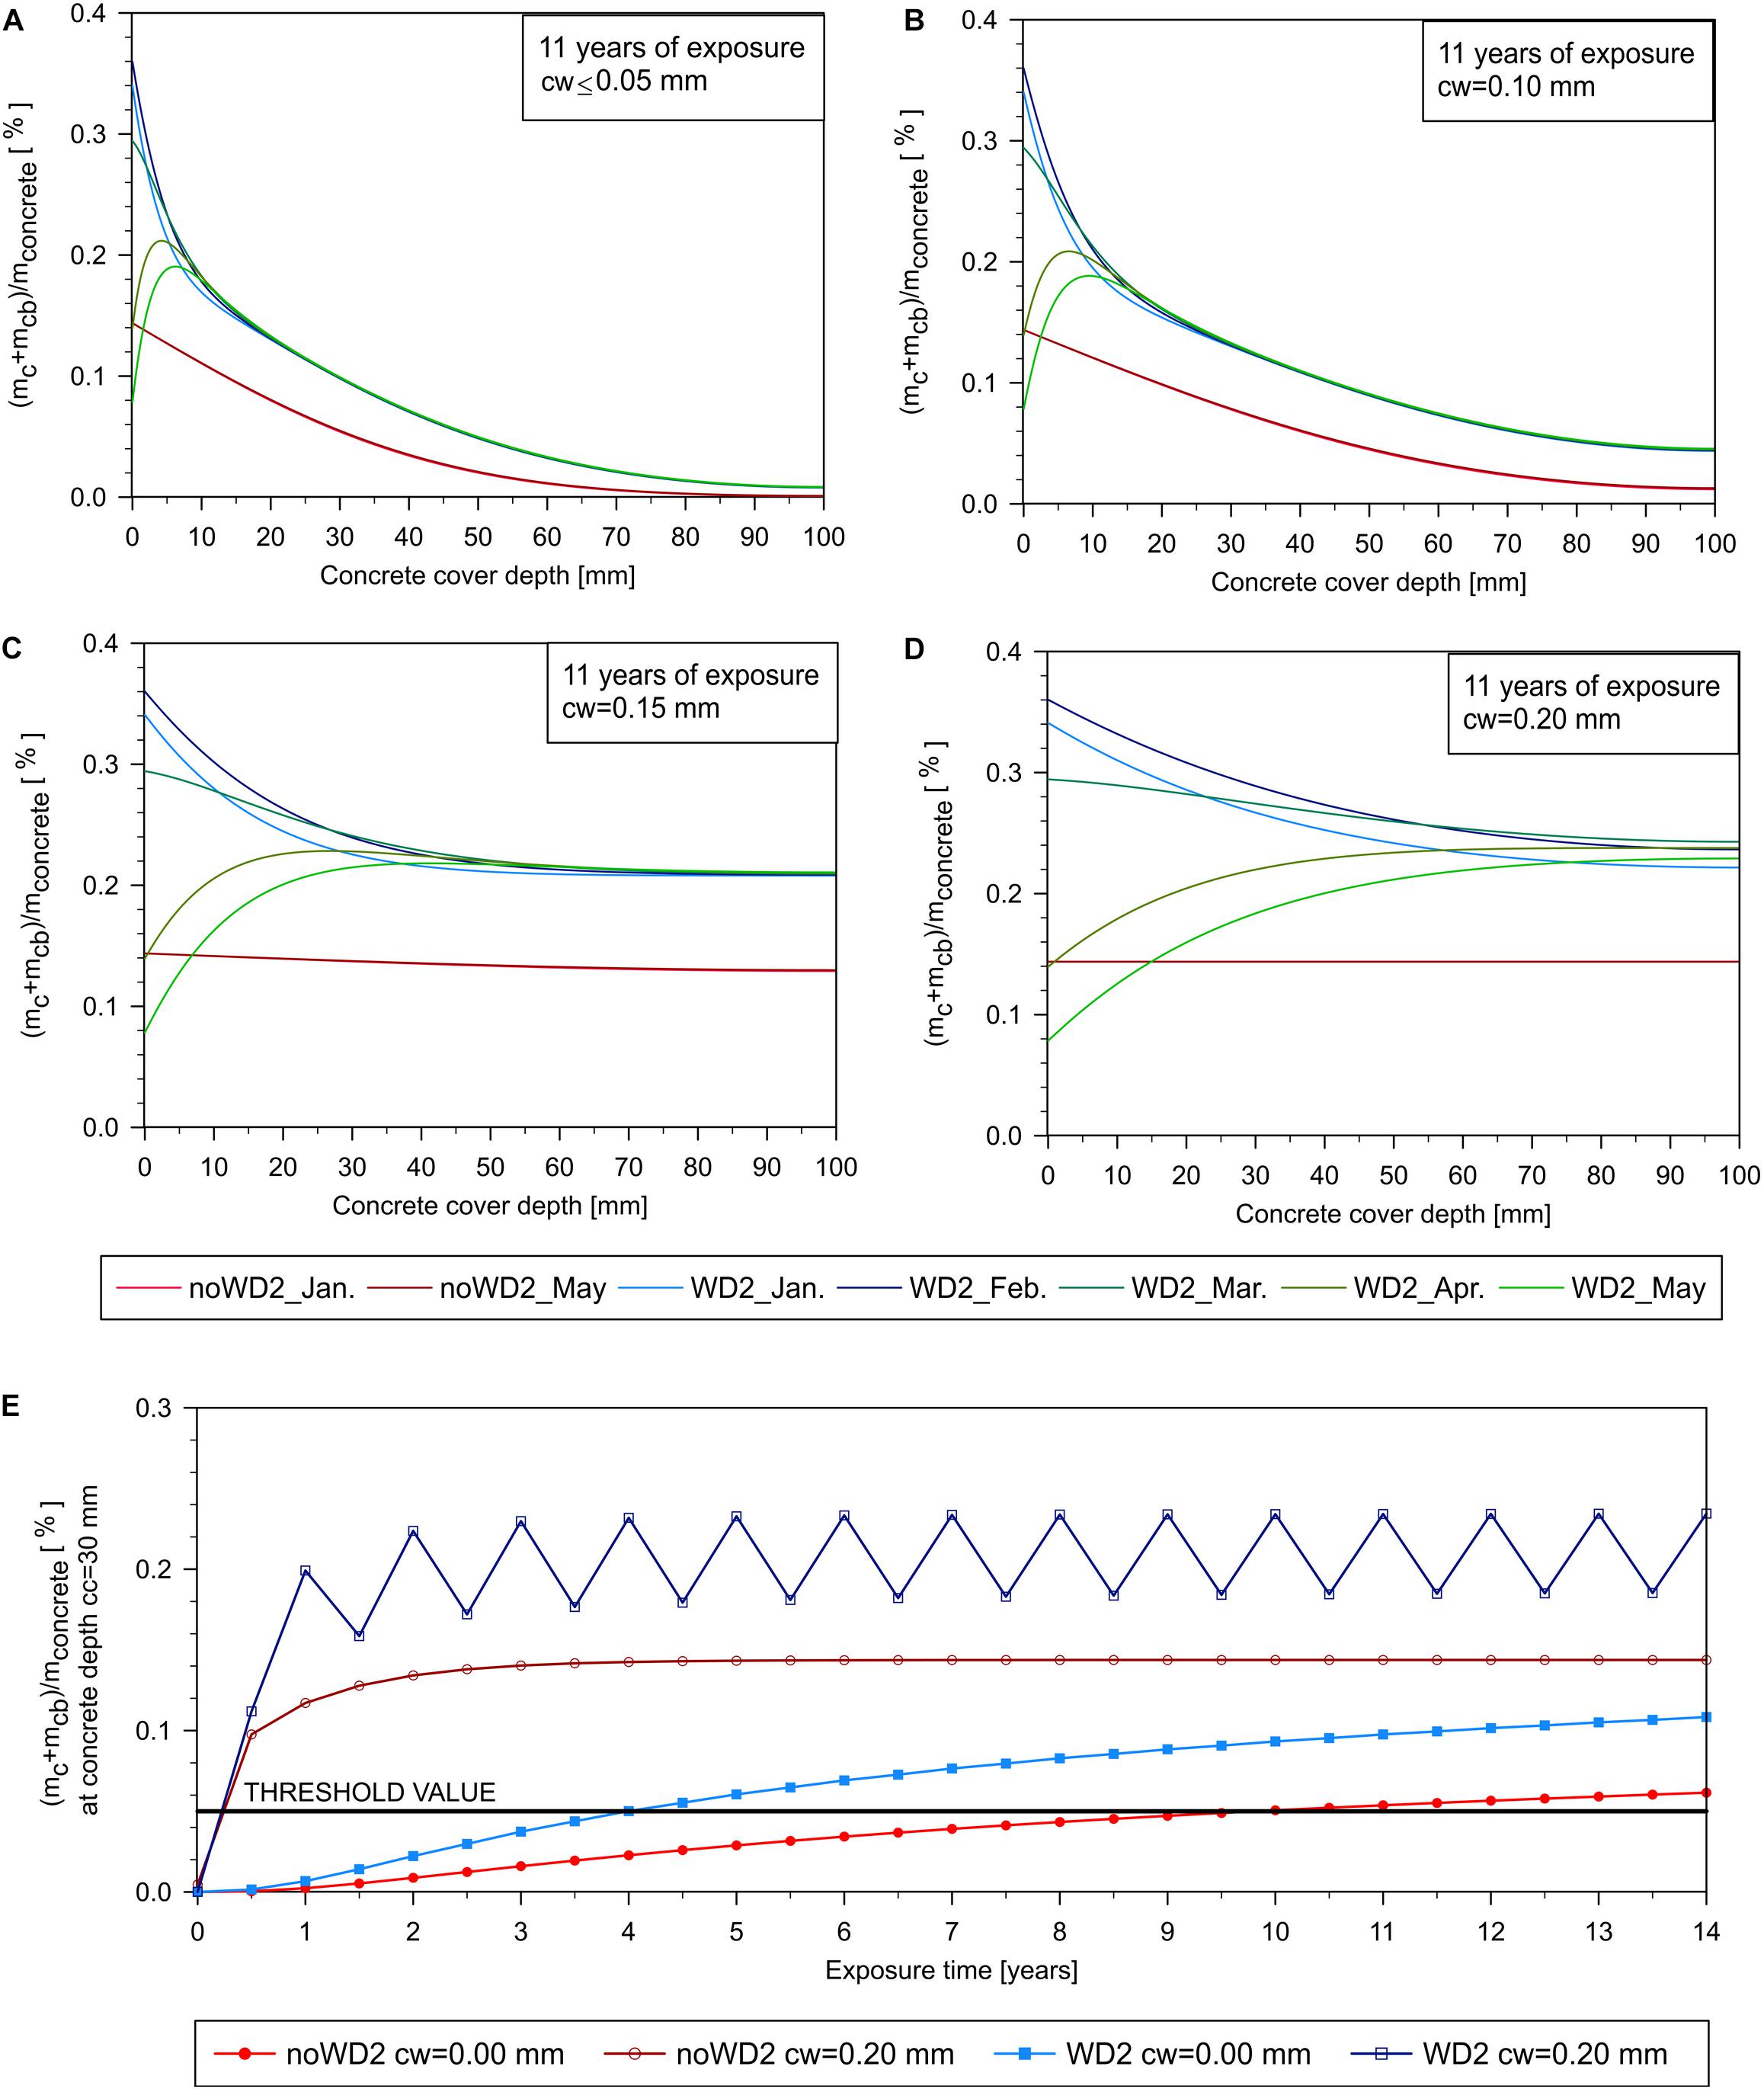
Figure 6. Comparison of total (free + bound) chloride content in concrete after 11 years of exposure to moderate aggressive environment for the numerical models with (WD2) and without (noWD2) wetting–drying cycles for different crack widths (cw): (A) cw ≤ 0.05 mm, (B) cw = 0.10 mm, (C) cw = 0.15 mm, (D) cw = 0.20 mm, and (E) chloride content at the reinforcement level as a function of time in uncracked (cw = 0.00 mm) and cracked (cw = 0.20 mm) concrete for the numerical models with (WD2) and without (noWD2) wetting–drying cycles.
Although both cases (WD2 and noWD2) are exposed to the same annual amounts of chlorides and water, inclusion of wetting–drying cycles and assumption of time-variable surface chloride content, using the realistic quantities of de-icing salts, results in much higher total chloride content in concrete. For example, at the average concrete cover depth of 30 to 50 mm, the chloride content with simulated wetting–drying cycles is doubled compared to the chloride content without wetting drying cycles (Figure 6). Moreover, because of the seasonal changes of surface chloride content, transport processes in WD2 models are continuously taking place in the concrete. This is a more realistic simulation in comparison to the models without wetting–drying cycles (noWD2), where in cracked concrete the maximum chloride content is achieved after in the first decade of service.
The Figure 6E shows the time-dependent behavior of the chloride content at reinforcement level (Cc = 30 mm) in uncracked (cw = 0.00 mm) and cracked (cw = 0.20 mm) concrete for the two numerical models with (WD2) and without (noWD2) wetting–drying cycles. Assuming that depassivation of reinforcement occurs at the same time when the chloride concentration in concrete at the rebar level reaches a threshold value of 0.05% by concrete weigh, initiation phase starts already after 3 months of exposure to de-icing salts for cracked concrete with crack width, cw ≥ 0.20 mm, regardless of wetting–drying process inclusion. Although there is a difference between chloride content in cracked concrete for the numerical model WD2 during the winter and summer seasons, the calculated values surpass the threshold value by two to four times. In uncracked concrete, difference in chloride content during cold and warm season is not expressed at a concrete depth of 30 mm. However, there is a significant difference in duration of initiation time regarding to inclusion of wetting–drying processes: depassivation time for the numerical model without wetting–drying cycles is 10 years, whereas if wetting–drying cycles are included, initiation phase ends already after 4 years.
The Zečeve Drage Viaduct is located on the Zagreb–Rijeka motorway and consists of two twin structures; the right bridge (to Rijeka) is built in 2004, whereas the left bridge (to Zagreb) is completed in 2007 (Figure 7). The viaduct is located in the mountain area characterized by harsh winters with the average annual amount of de-icing salts of 124.24 tons consumed per kilometer of motorway (Kušter Marić et al., 2019).
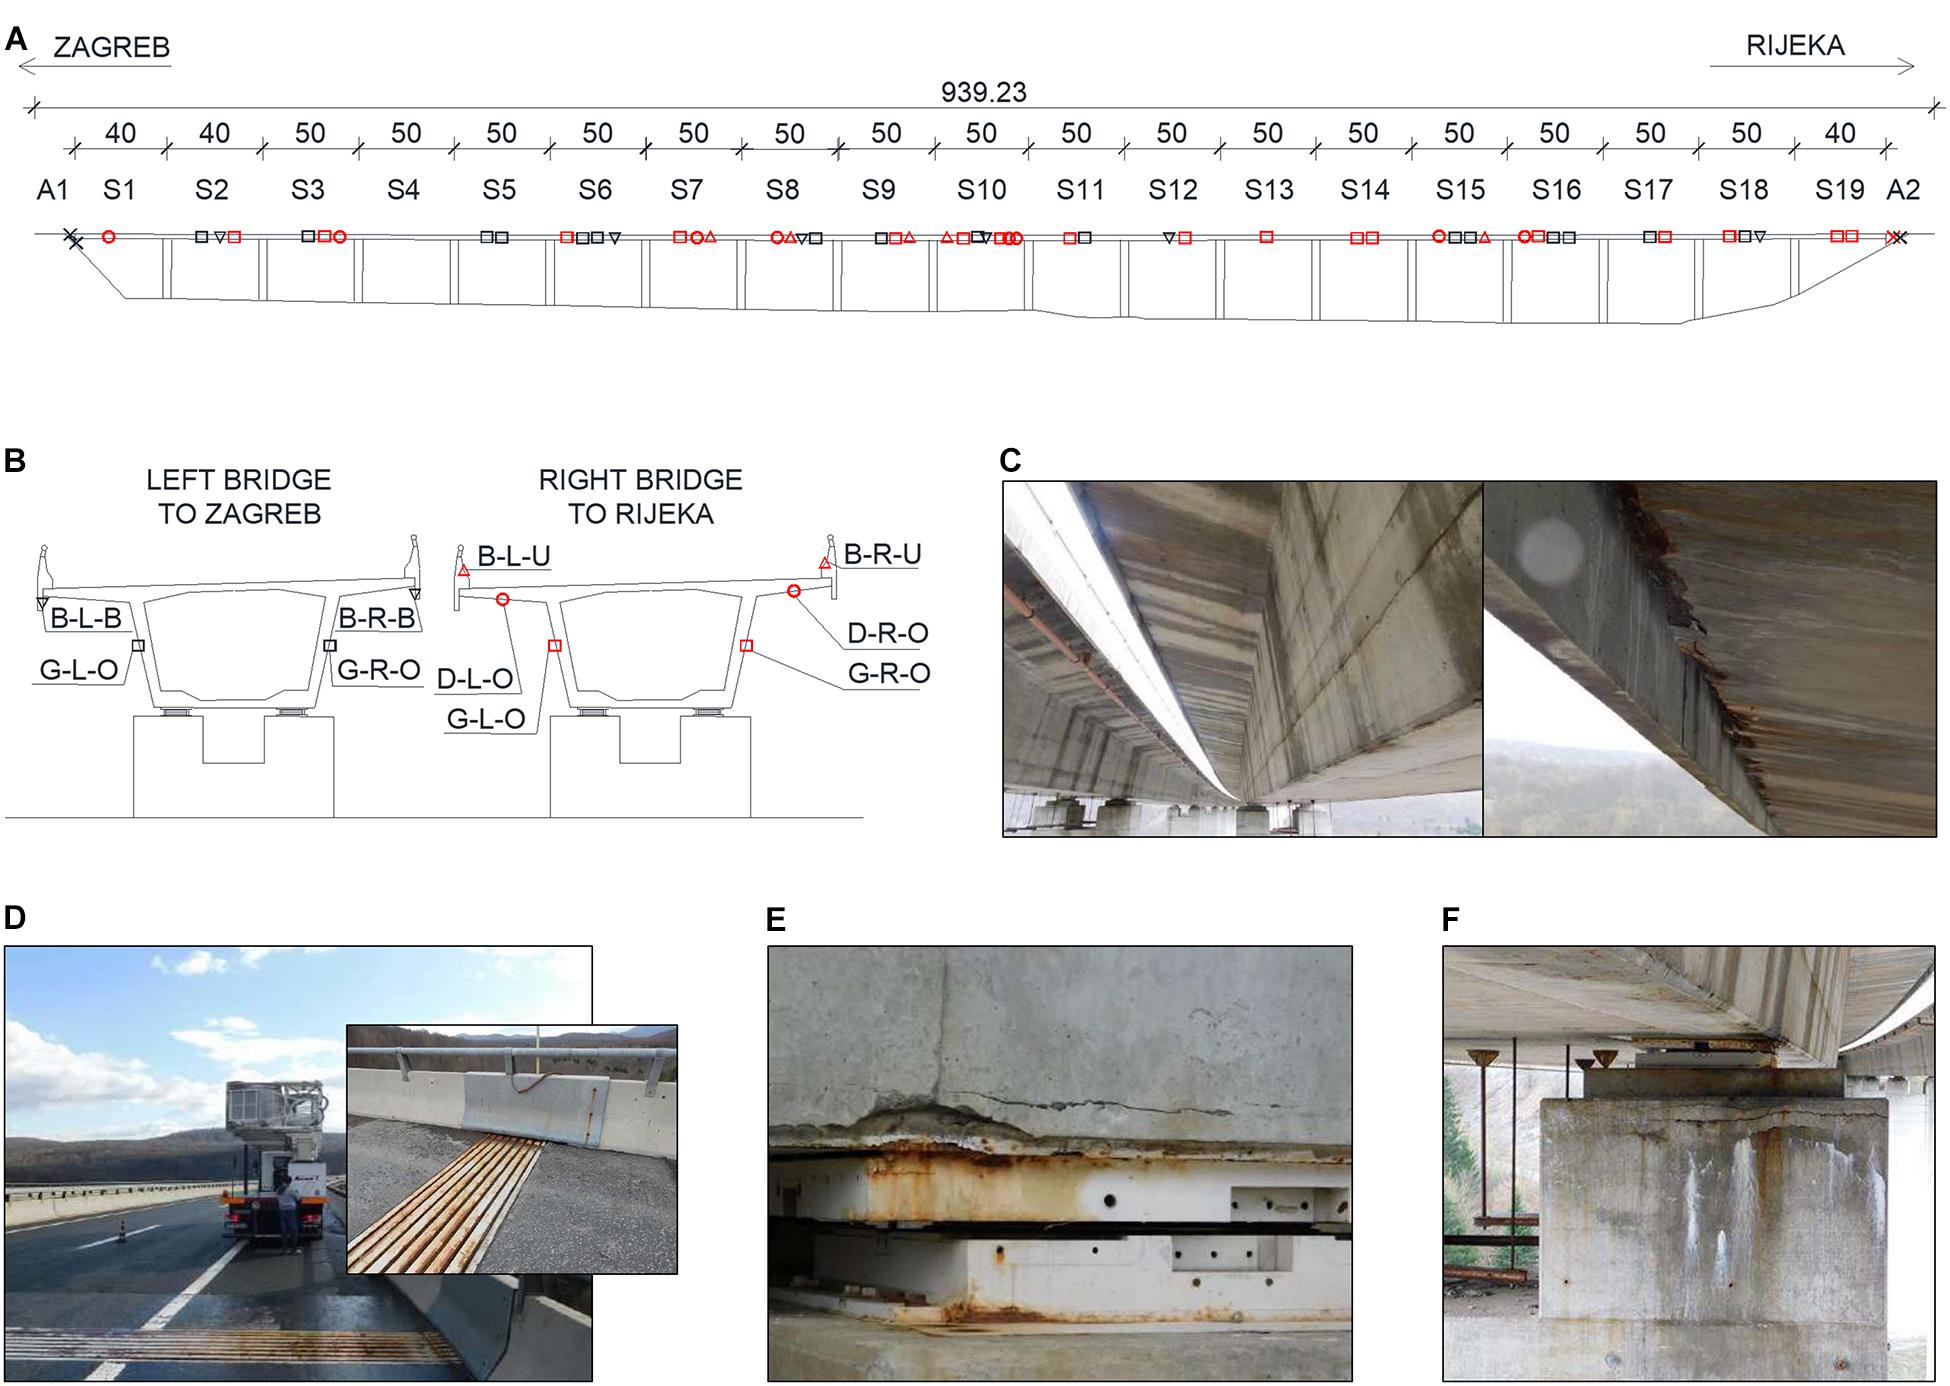
Figure 7. Longitudinal (A) and cross (B) section of the Zečeve Drage Viaduct with the marked locations of measurements taken for determination of the chloride content in concrete; (C) characteristic water leakage along the bridge deck and box girder due to the inadequate joint of the concrete barrier causing reinforcement corrosion on the bridge concrete deck and box girder; (D) damaged expansion joint: corrosion of steel parts and decayed rubber sealing; (E) wide crack at bottom part of the box girder above a bearing; (F) reinforcement corrosion induced cracks on the top of piers.
The horizontal alignment of the viaduct has a curve with a radius of 2,505.10 m. The vertical alignment has a concave curve with a radius of 25,810.00 m, and the longitudinal grade of the road ranges from 4.38 to 0.78%, enabling retention of water contaminated with de-icing salts on the road surface and the superstructure below. The total length of the bridge is 939.23 m, whereas the total width of each superstructure is 12.20 m (IGM, 2018).
The superstructure consists of a continuous pre-stressed concrete box girder with constant height of 4.0 m over 19 spans: 2 × 39.75 + 16 × 49.73 + 39.75 = 914.93 m (Figures 7A,B). Both superstructures were built by incremental launching method. Reinforced concrete piers have a box cross-section with outer dimensions of 6.60 × 3.10 m. The height of the piers varies from 8.72 to 53.04 m.
Both structures deteriorated significantly after 11 and 14 years of service, respectively, because of the combination of the following environmental conditions: (i) high consumption of de-icing salts during winter, (ii) high relative air humidity facilitating the transport and corrosion processes, (iii) numerous freezing—thawing cycles from October till April, and (iv) frequent changes between precipitation and dry weather throughout the year. Some typical damages on bridges are shown in Figures 7C–F. Following structural deficiencies have enhanced the degradation of the bridges, (i) concave vertical alignment enabling water retention on the bridge deck surface, (ii) damaged expansion joints allow water leakage on abutment walls (Figure 7D), (iii) open gap between the concrete barrier and bridge deck through which water leaks along the bridge deck and the box girder (Figure 7C), and (iv) cracks in structural elements up to 1.00 mm wide and 80 mm deep accelerate chloride penetration in concrete.
Chloride content in concrete is measured at different locations on the bridges after 11 (left bridge) and 14 (right bridge) years of service (Figure 7). The total amount of chlorides is determined by the standard laboratory method (potentiometric titration) according the national standard HRN B.C8.020 (IGM, 2018). Concrete samples are taken from minimum three holes at each location and pulverized for chloride determination. For each location, chloride content is determined at the three depths of concrete: (i) 0–20 mm, (ii) 20–40 mm, and (iii) 40–60 mm. The concrete samples are taken from the following elements: (i) web of the box girder, (ii) cantilever part of the bridge deck, (iii) concrete barrier, and (iv) abutments. Each measurement location is marked and labeled in Figure 7. To distinguish the locations on the longitudinal section of the twin structures, symbols for the left structure (to Zagreb) are black, whereas symbols for the right structure are red. For the samples taken from the girder, square symbol is used while the labels start with a “G,” the second letter corresponds to the left (L) or right (R) side of the bridge, whereas the third letter (O) indicates that the sample is taken outside of the box. Lastly, “S” followed by a number indicates the corresponding bridge span. Similar labeling is used for the cantilever part of the bridge deck, except the first letter is “D,” whereas the symbol is a circle. Samples taken from the concrete barrier starts with letter “B”; the second letter refers to the left (L) or right (R) side of a bridge, whereas the third letter indicates upper (U) or bottom (B) part. In this case, a triangle is used as a symbol. Concrete samples are also taken from three locations at the abutments: from the wall (A1-wall) and right wing (A1-R-W) of the first abutment of the left bridge, and left wing of the second abutment of both bridges (A2-L-W).
Because in the previous chapter the numerical simulations with included wetting–drying cycles have shown more realistic results, the models without wetting–drying cycles are not included in the following analysis. Three different exposure conditions depending on the surface chloride content (WD1, WD2, and WD3) are analyzed and compared with measured results (Figures 8–13). For each exposure condition, several numerical models with the different crack widths ranging from cw = 0.00 to cw = 0.20 mm are considered.
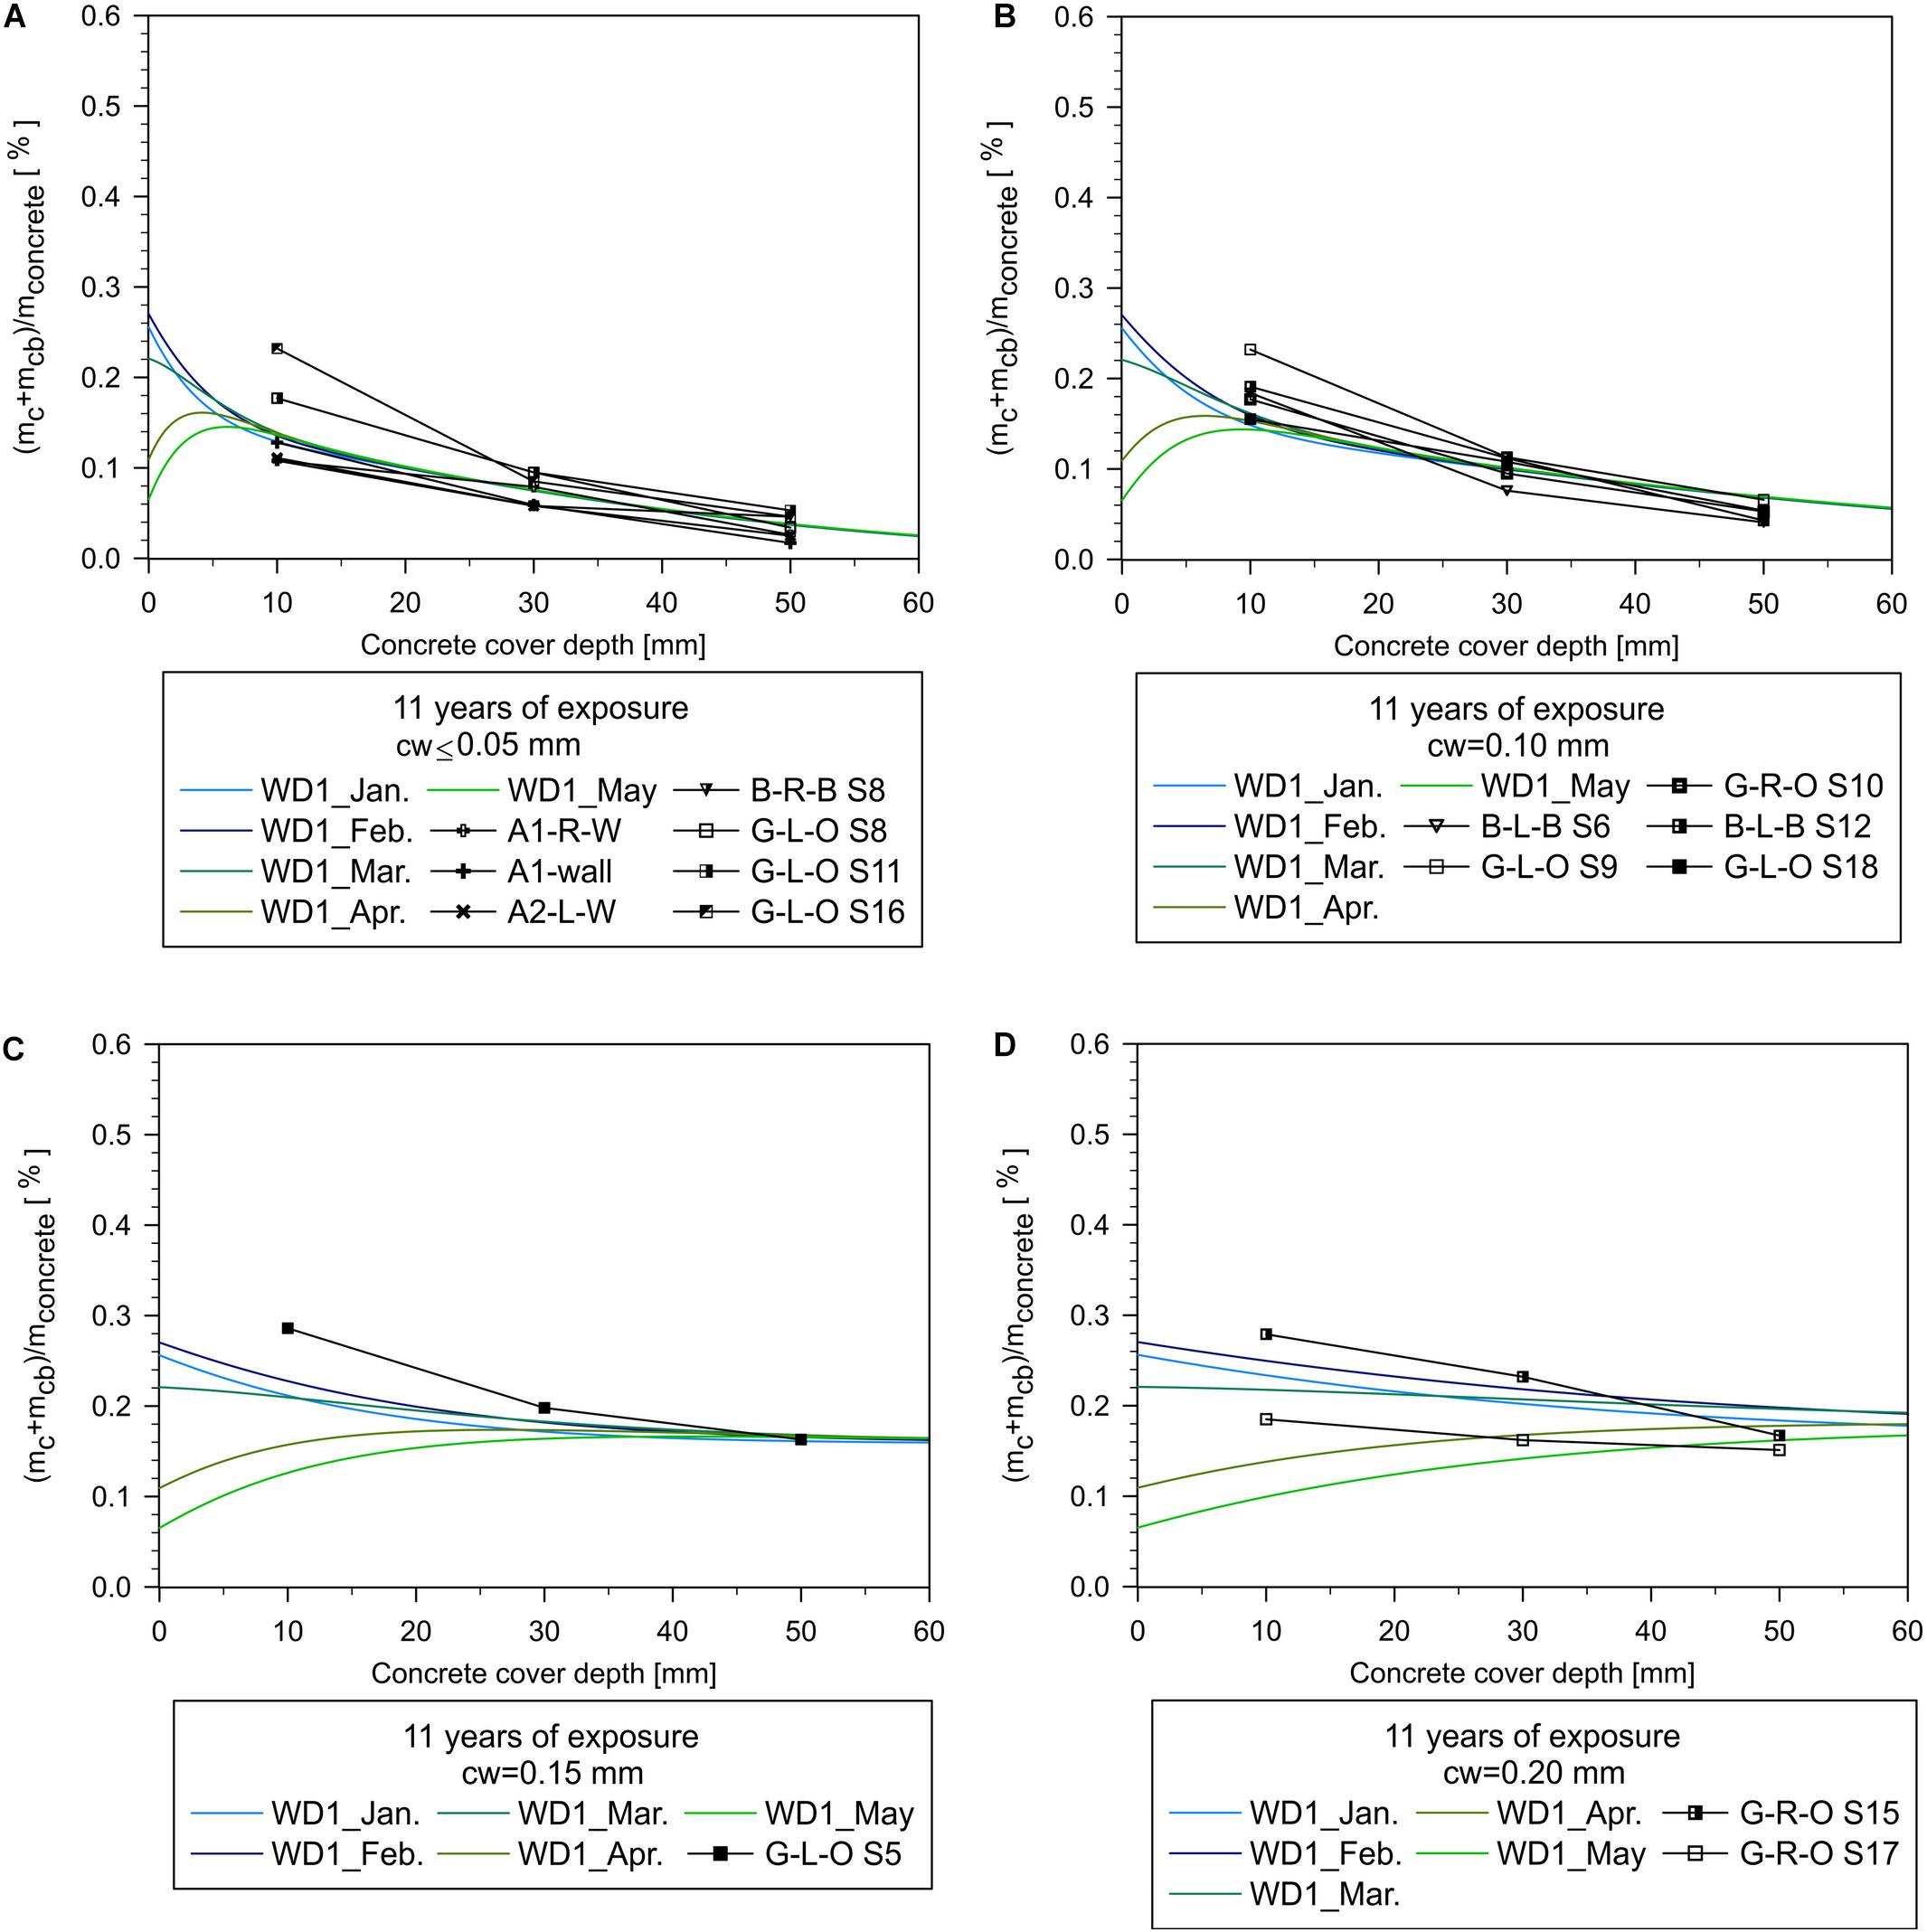
Figure 8. Total (free + bound) chloride content in concrete after 11 years of exposure to low aggressive environment—comparison of the values measured on the Zečeve Drage Viaduct—the left bridge (to Zagreb) and the numerical models (WD1) for different crack widths (cw): (A) cw ≤ 0.05 mm, (B) cw = 0.10 mm, (C) cw = 0.15 mm, and (D) cw = 0.20 mm.
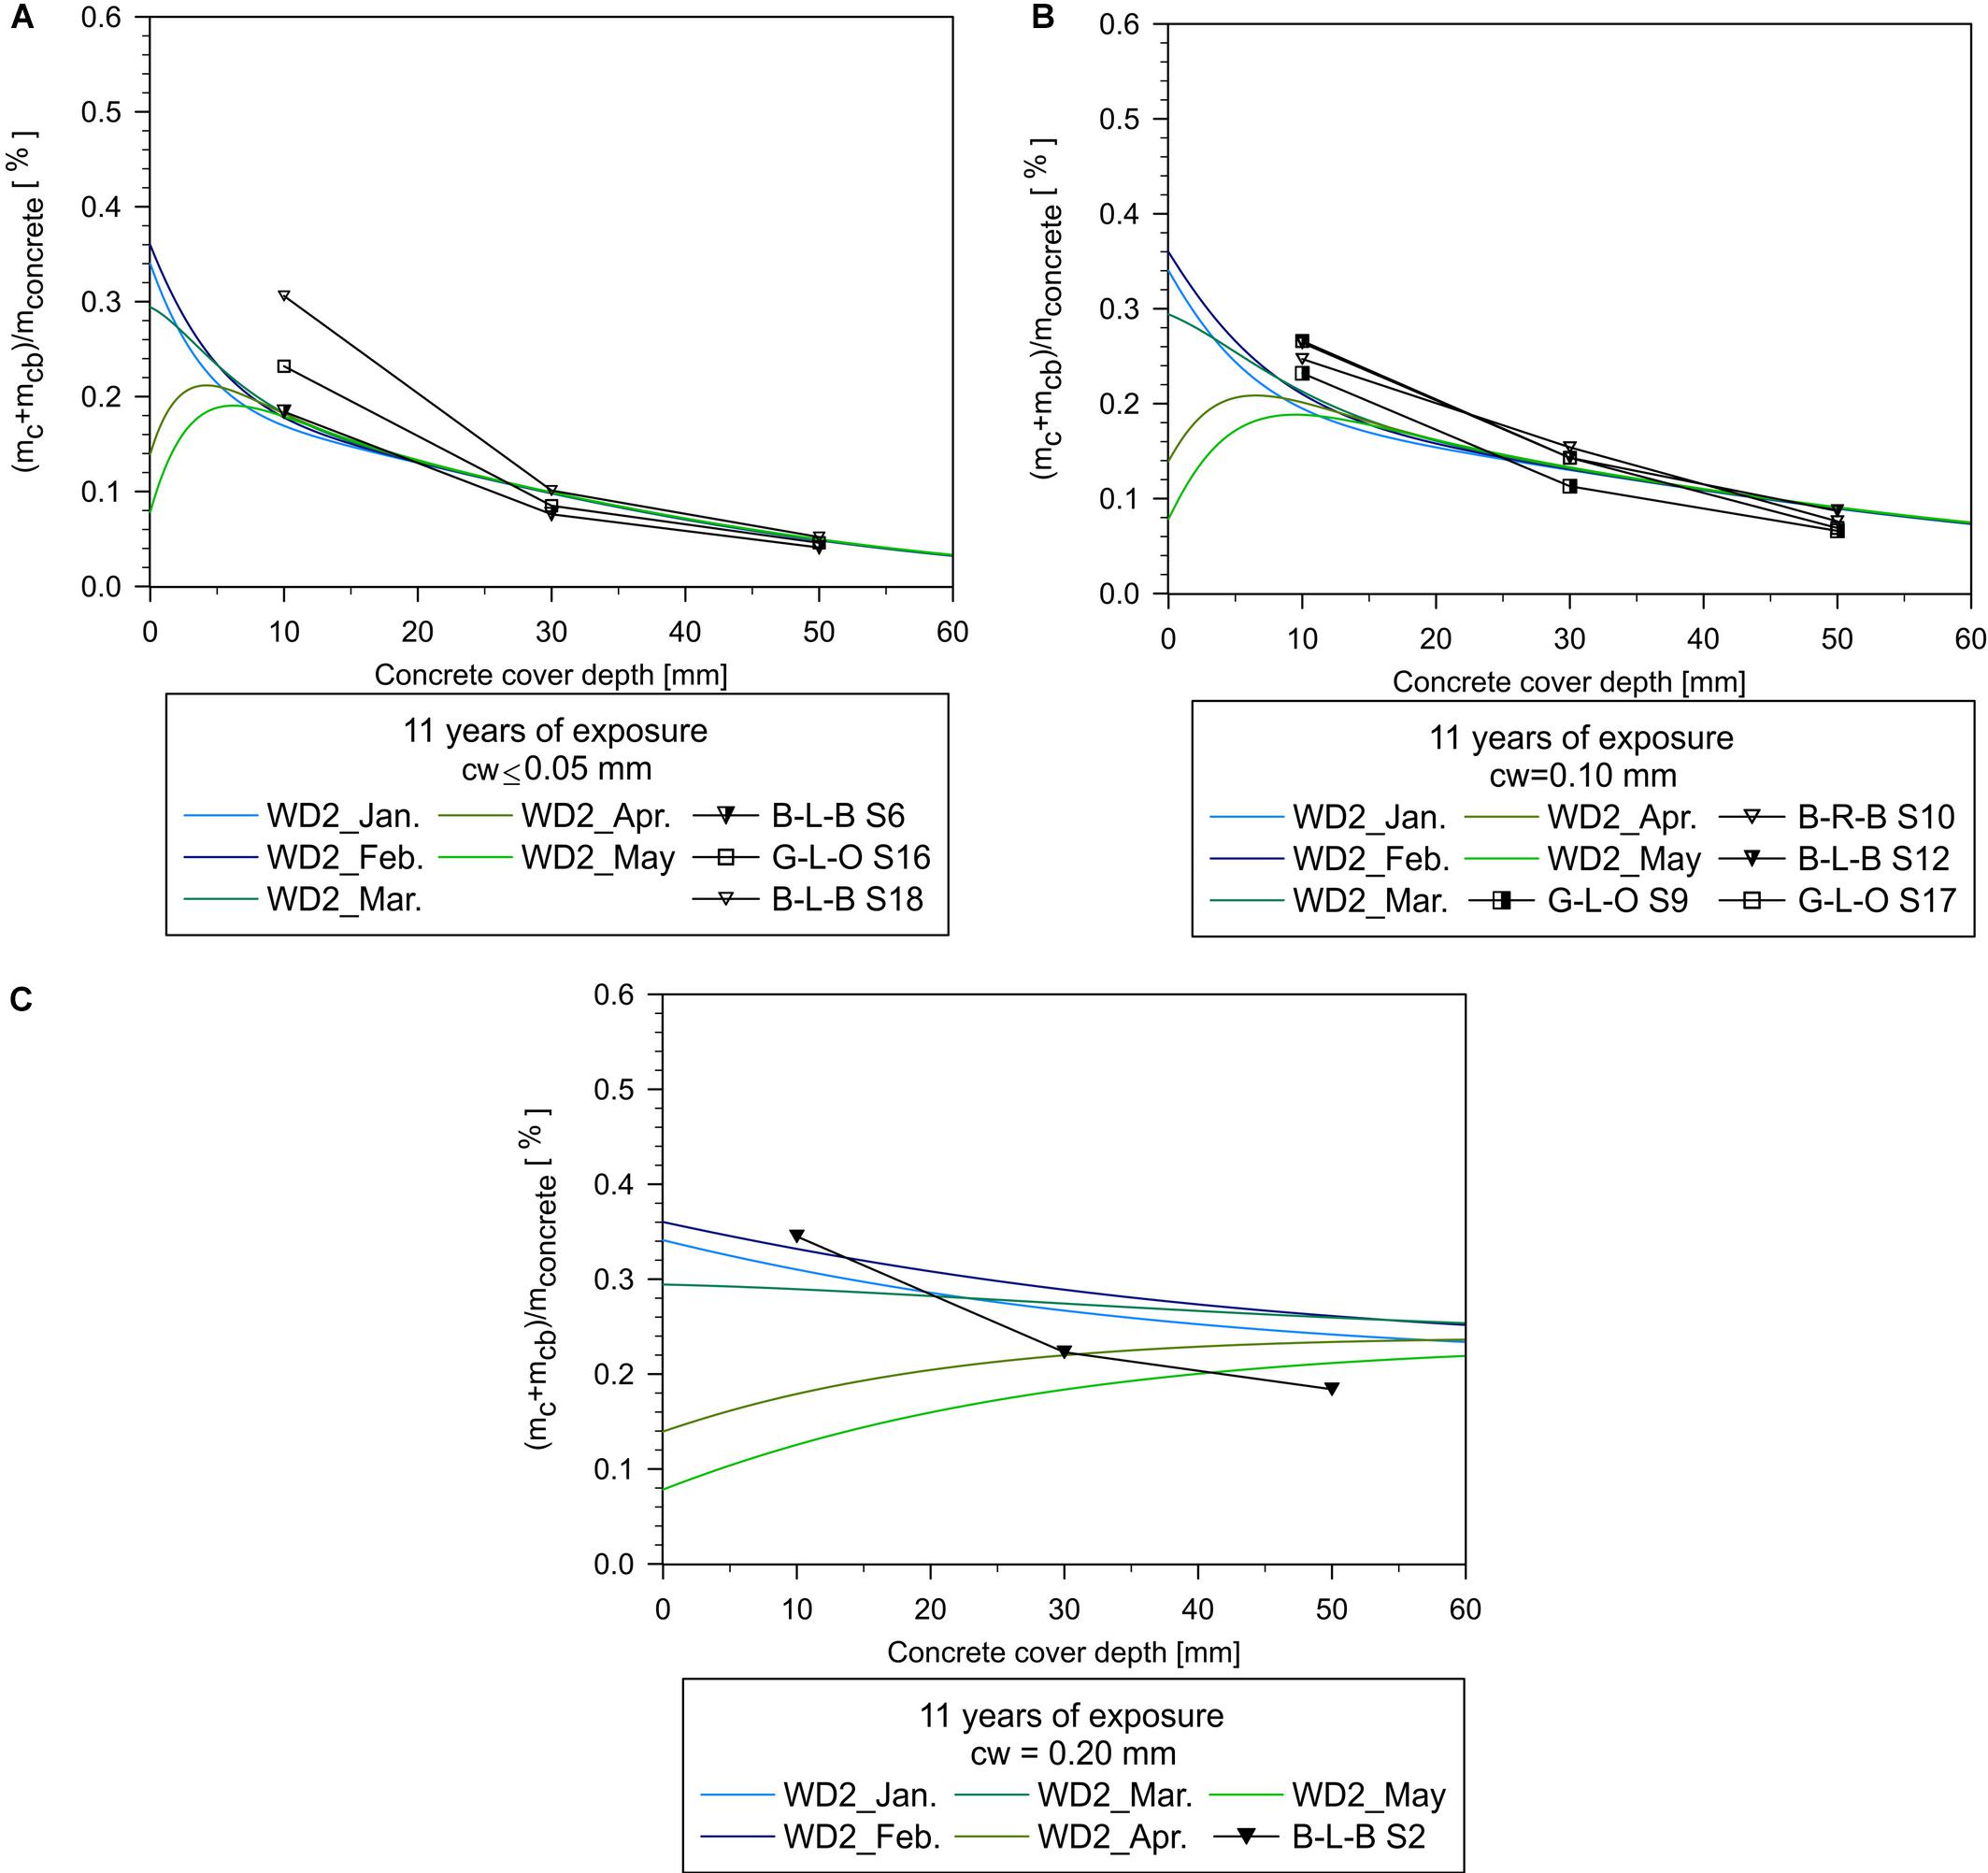
Figure 9. Total (free + bound) chloride content in concrete after 11 years of exposure to moderate aggressive environment—comparison of the values measured on the Zečeve Drage Viaduct—the left bridge (to Zagreb) and the numerical models (WD2) for different crack widths (cw): (A) cw ≤ 0.05 mm, (B) cw = 0.10 mm, and (C) cw = 0.20 mm.
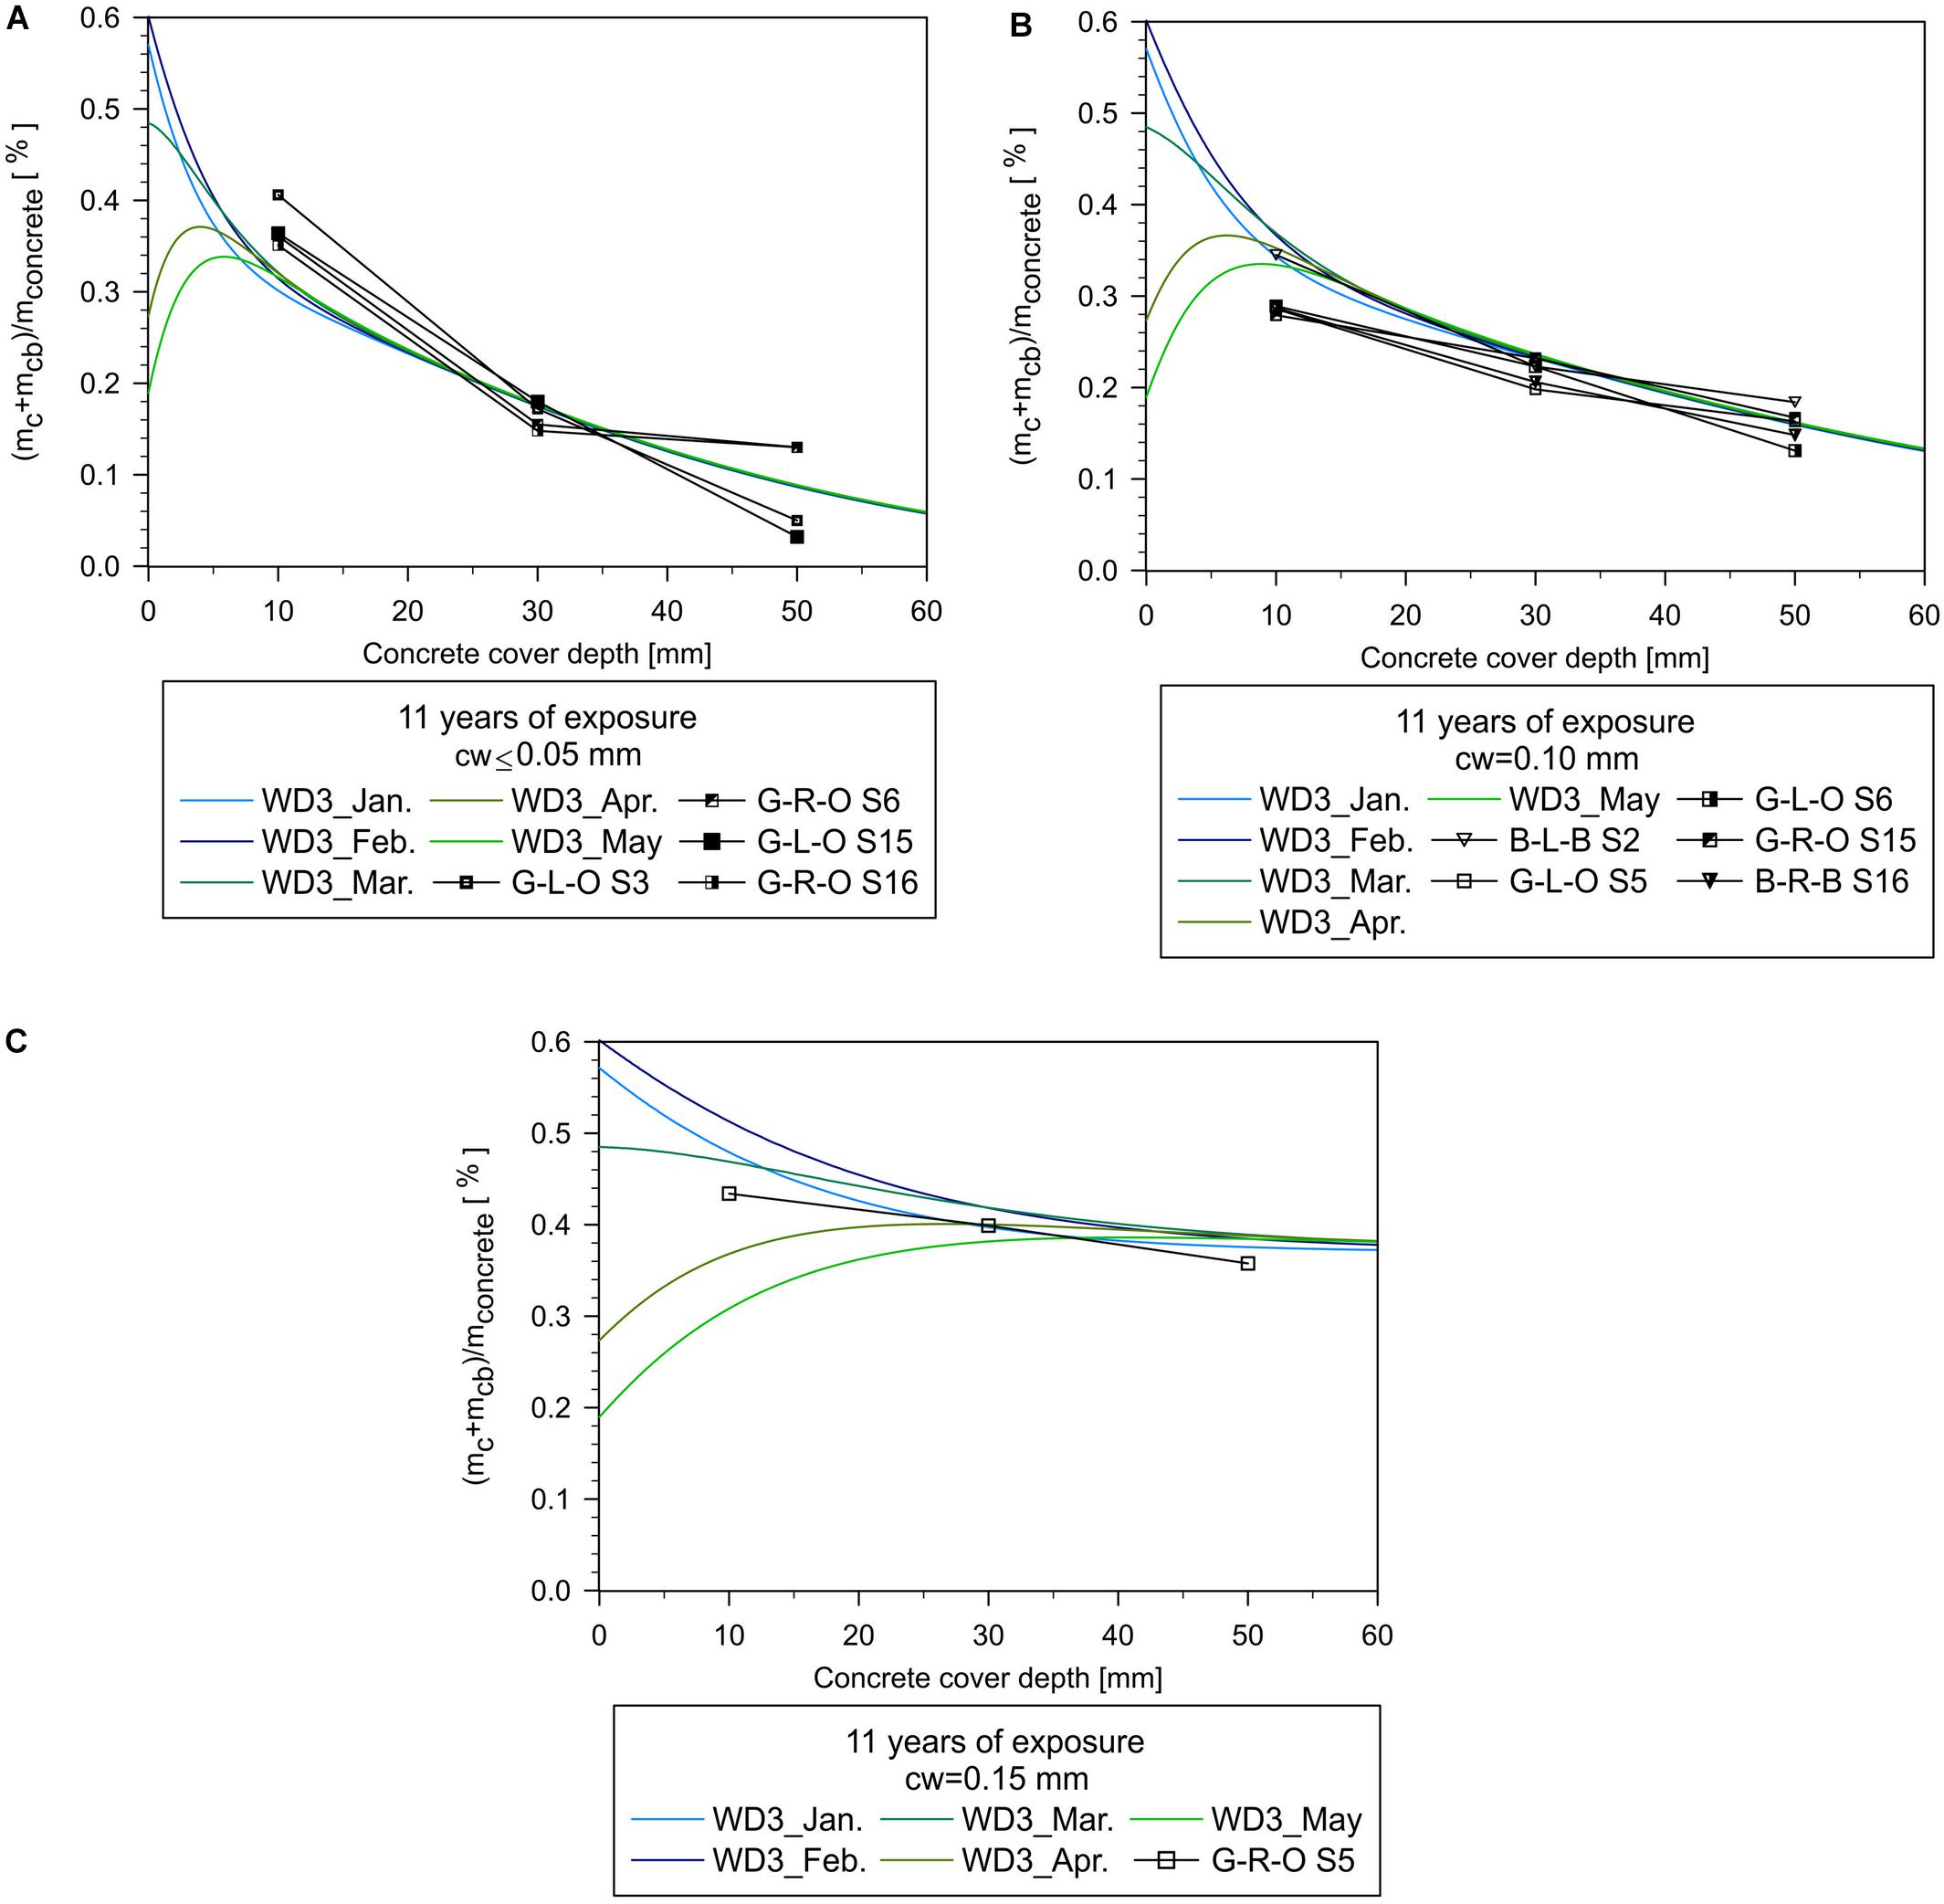
Figure 10. Total (free + bound) chloride content in concrete after 11 years of exposure to high aggressive environment—comparison of the values measured on the Zečeve Drage Viaduct—the left bridge (to Zagreb) and the numerical models (WD3) for different crack widths (cw): (A) cw ≤ 0.05 mm, (B) cw = 0.10 mm, and (C) cw = 0.15 mm.
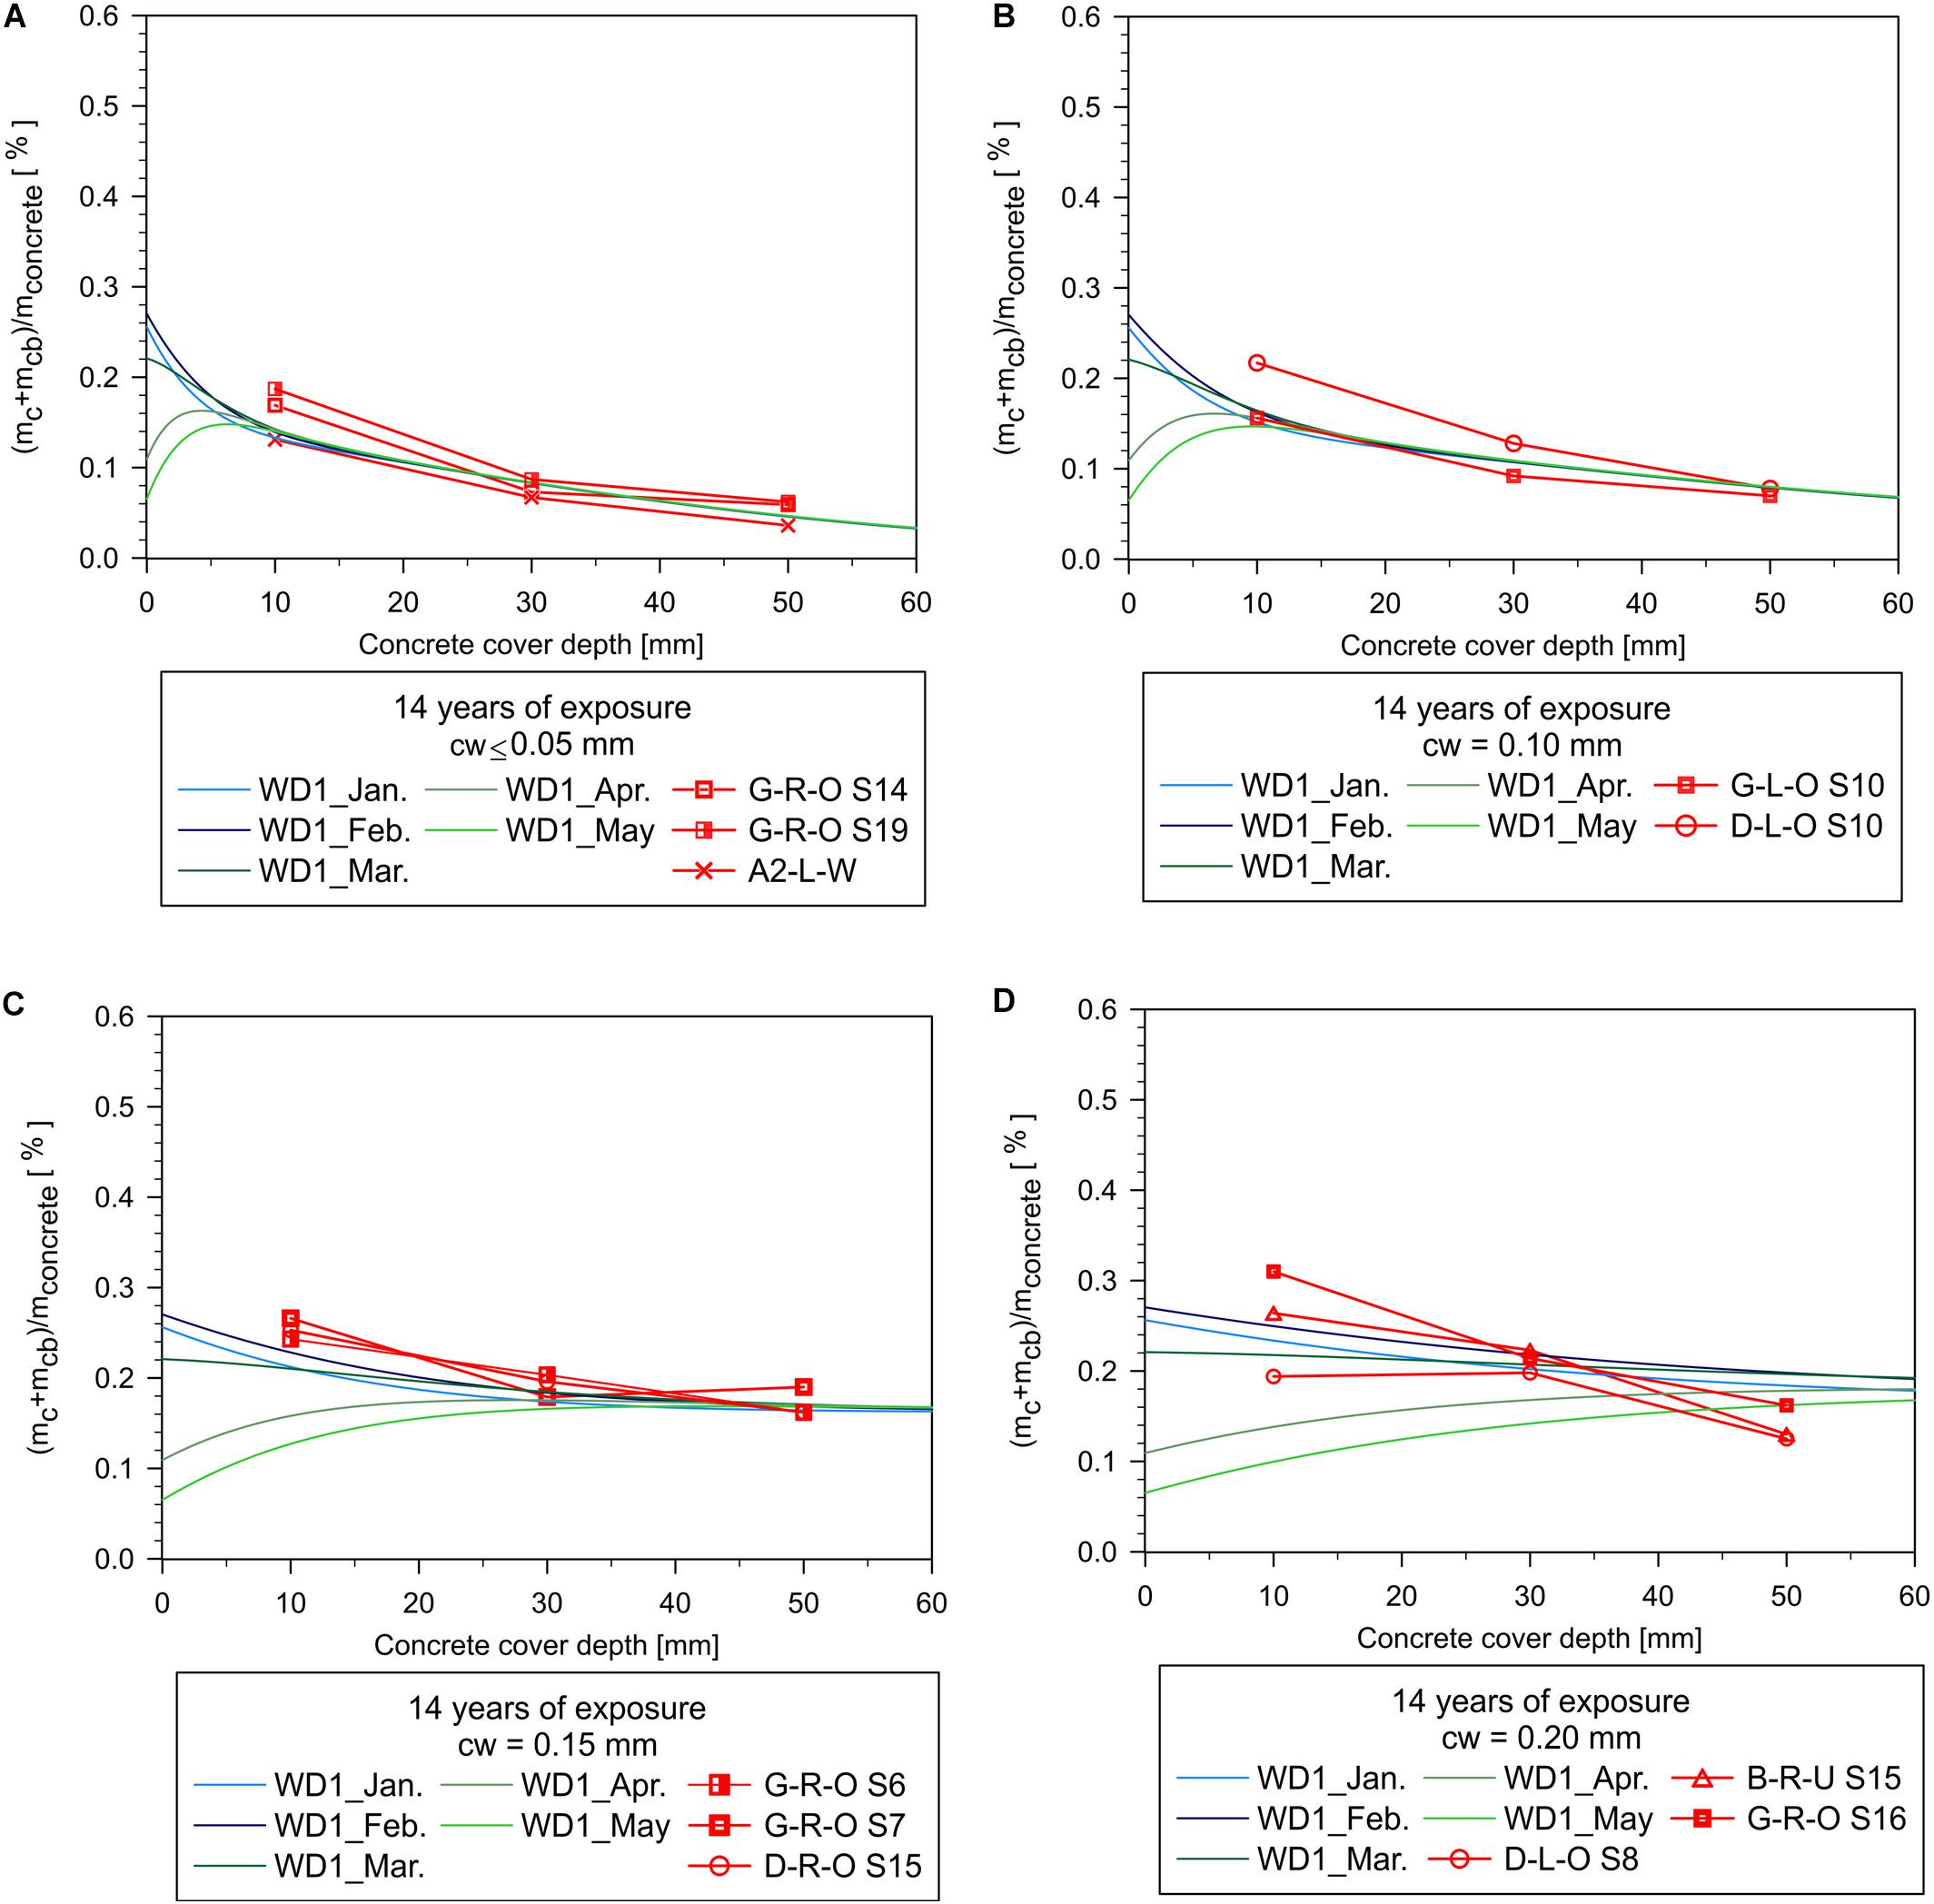
Figure 11. Total (free + bound) chloride content in concrete after 14 years of exposure to low aggressive environment—comparison of the values measured on the Zečeve Drage Viaduct—the right bridge (to Rijeka) and the numerical models (WD1) for different crack widths (cw): (A) cw ≤ 0.05 mm, (B) cw = 0.10 mm, (C) cw = 0.15 mm, and (D) cw = 0.20 mm.
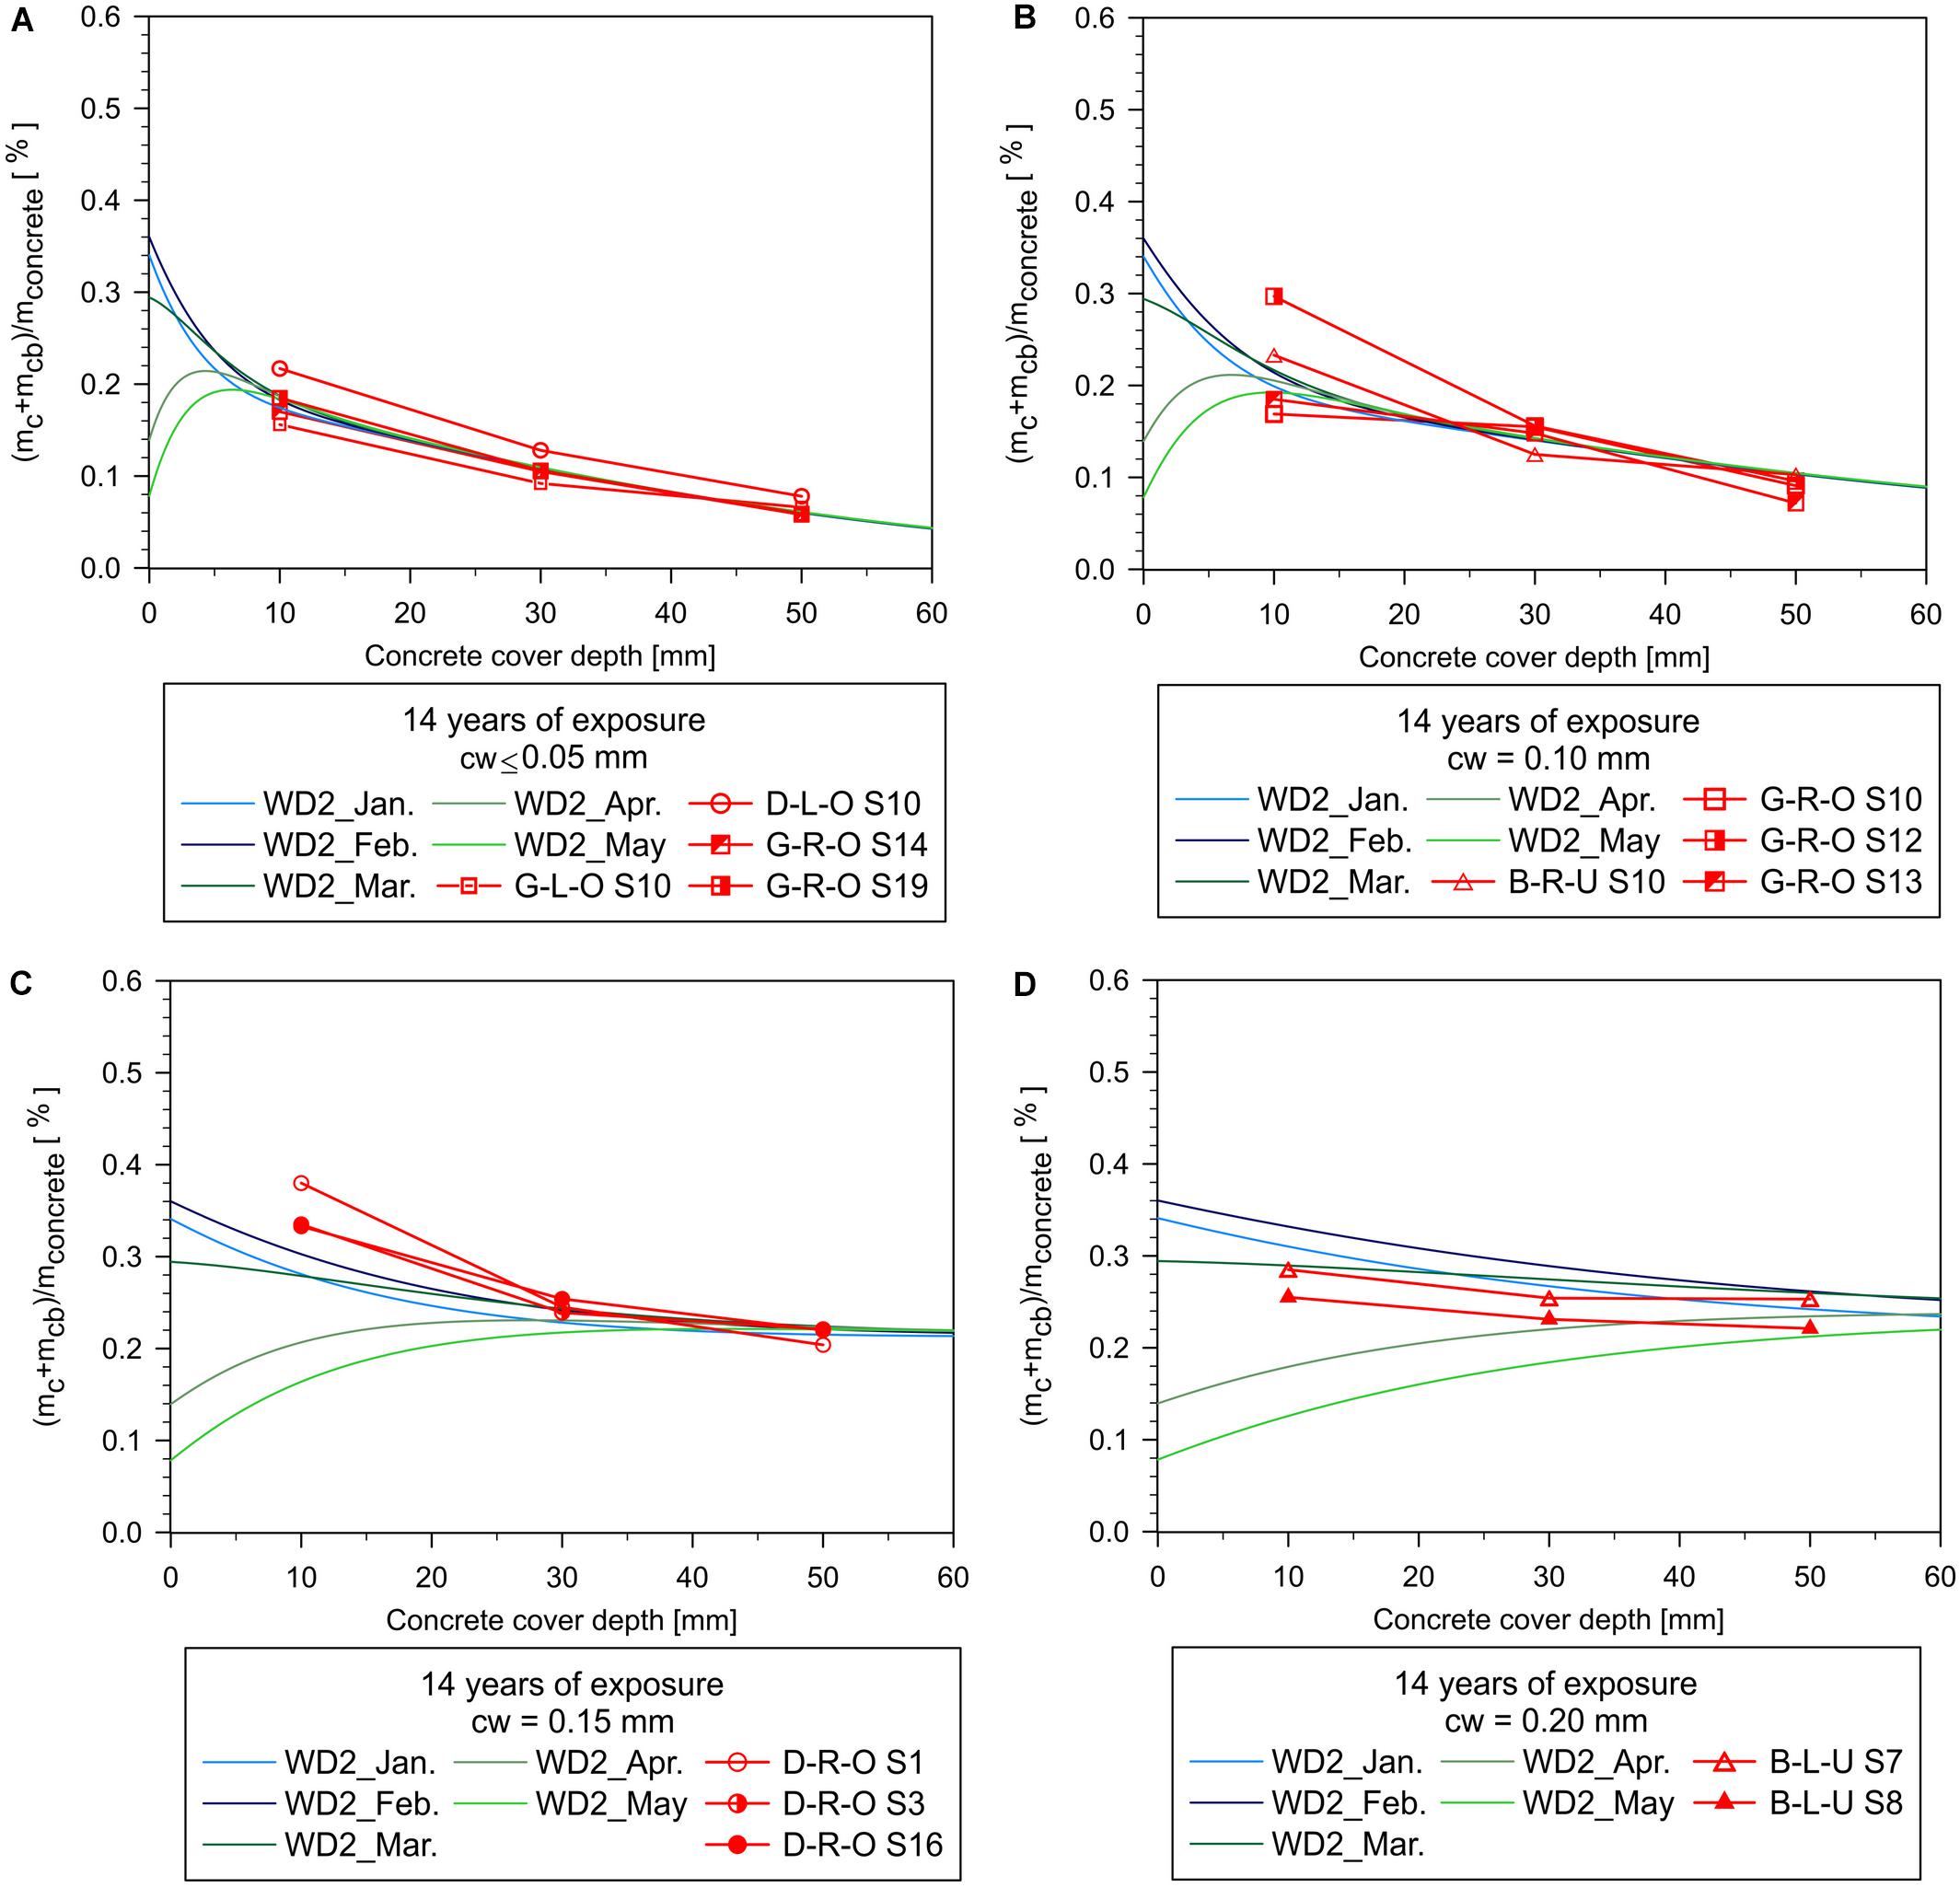
Figure 12. Total (free + bound) chloride content in concrete after 14 years of exposure to moderate aggressive environment—comparison of the values measured on the Zečeve Drage Viaduct—the right bridge (to Rijeka) and the numerical models (WD2) for different crack widths (cw): (A) cw ≤ 0.05 mm, (B) cw = 0.10 mm, (C) cw = 0.15 mm, and (D) cw = 0.20 mm.
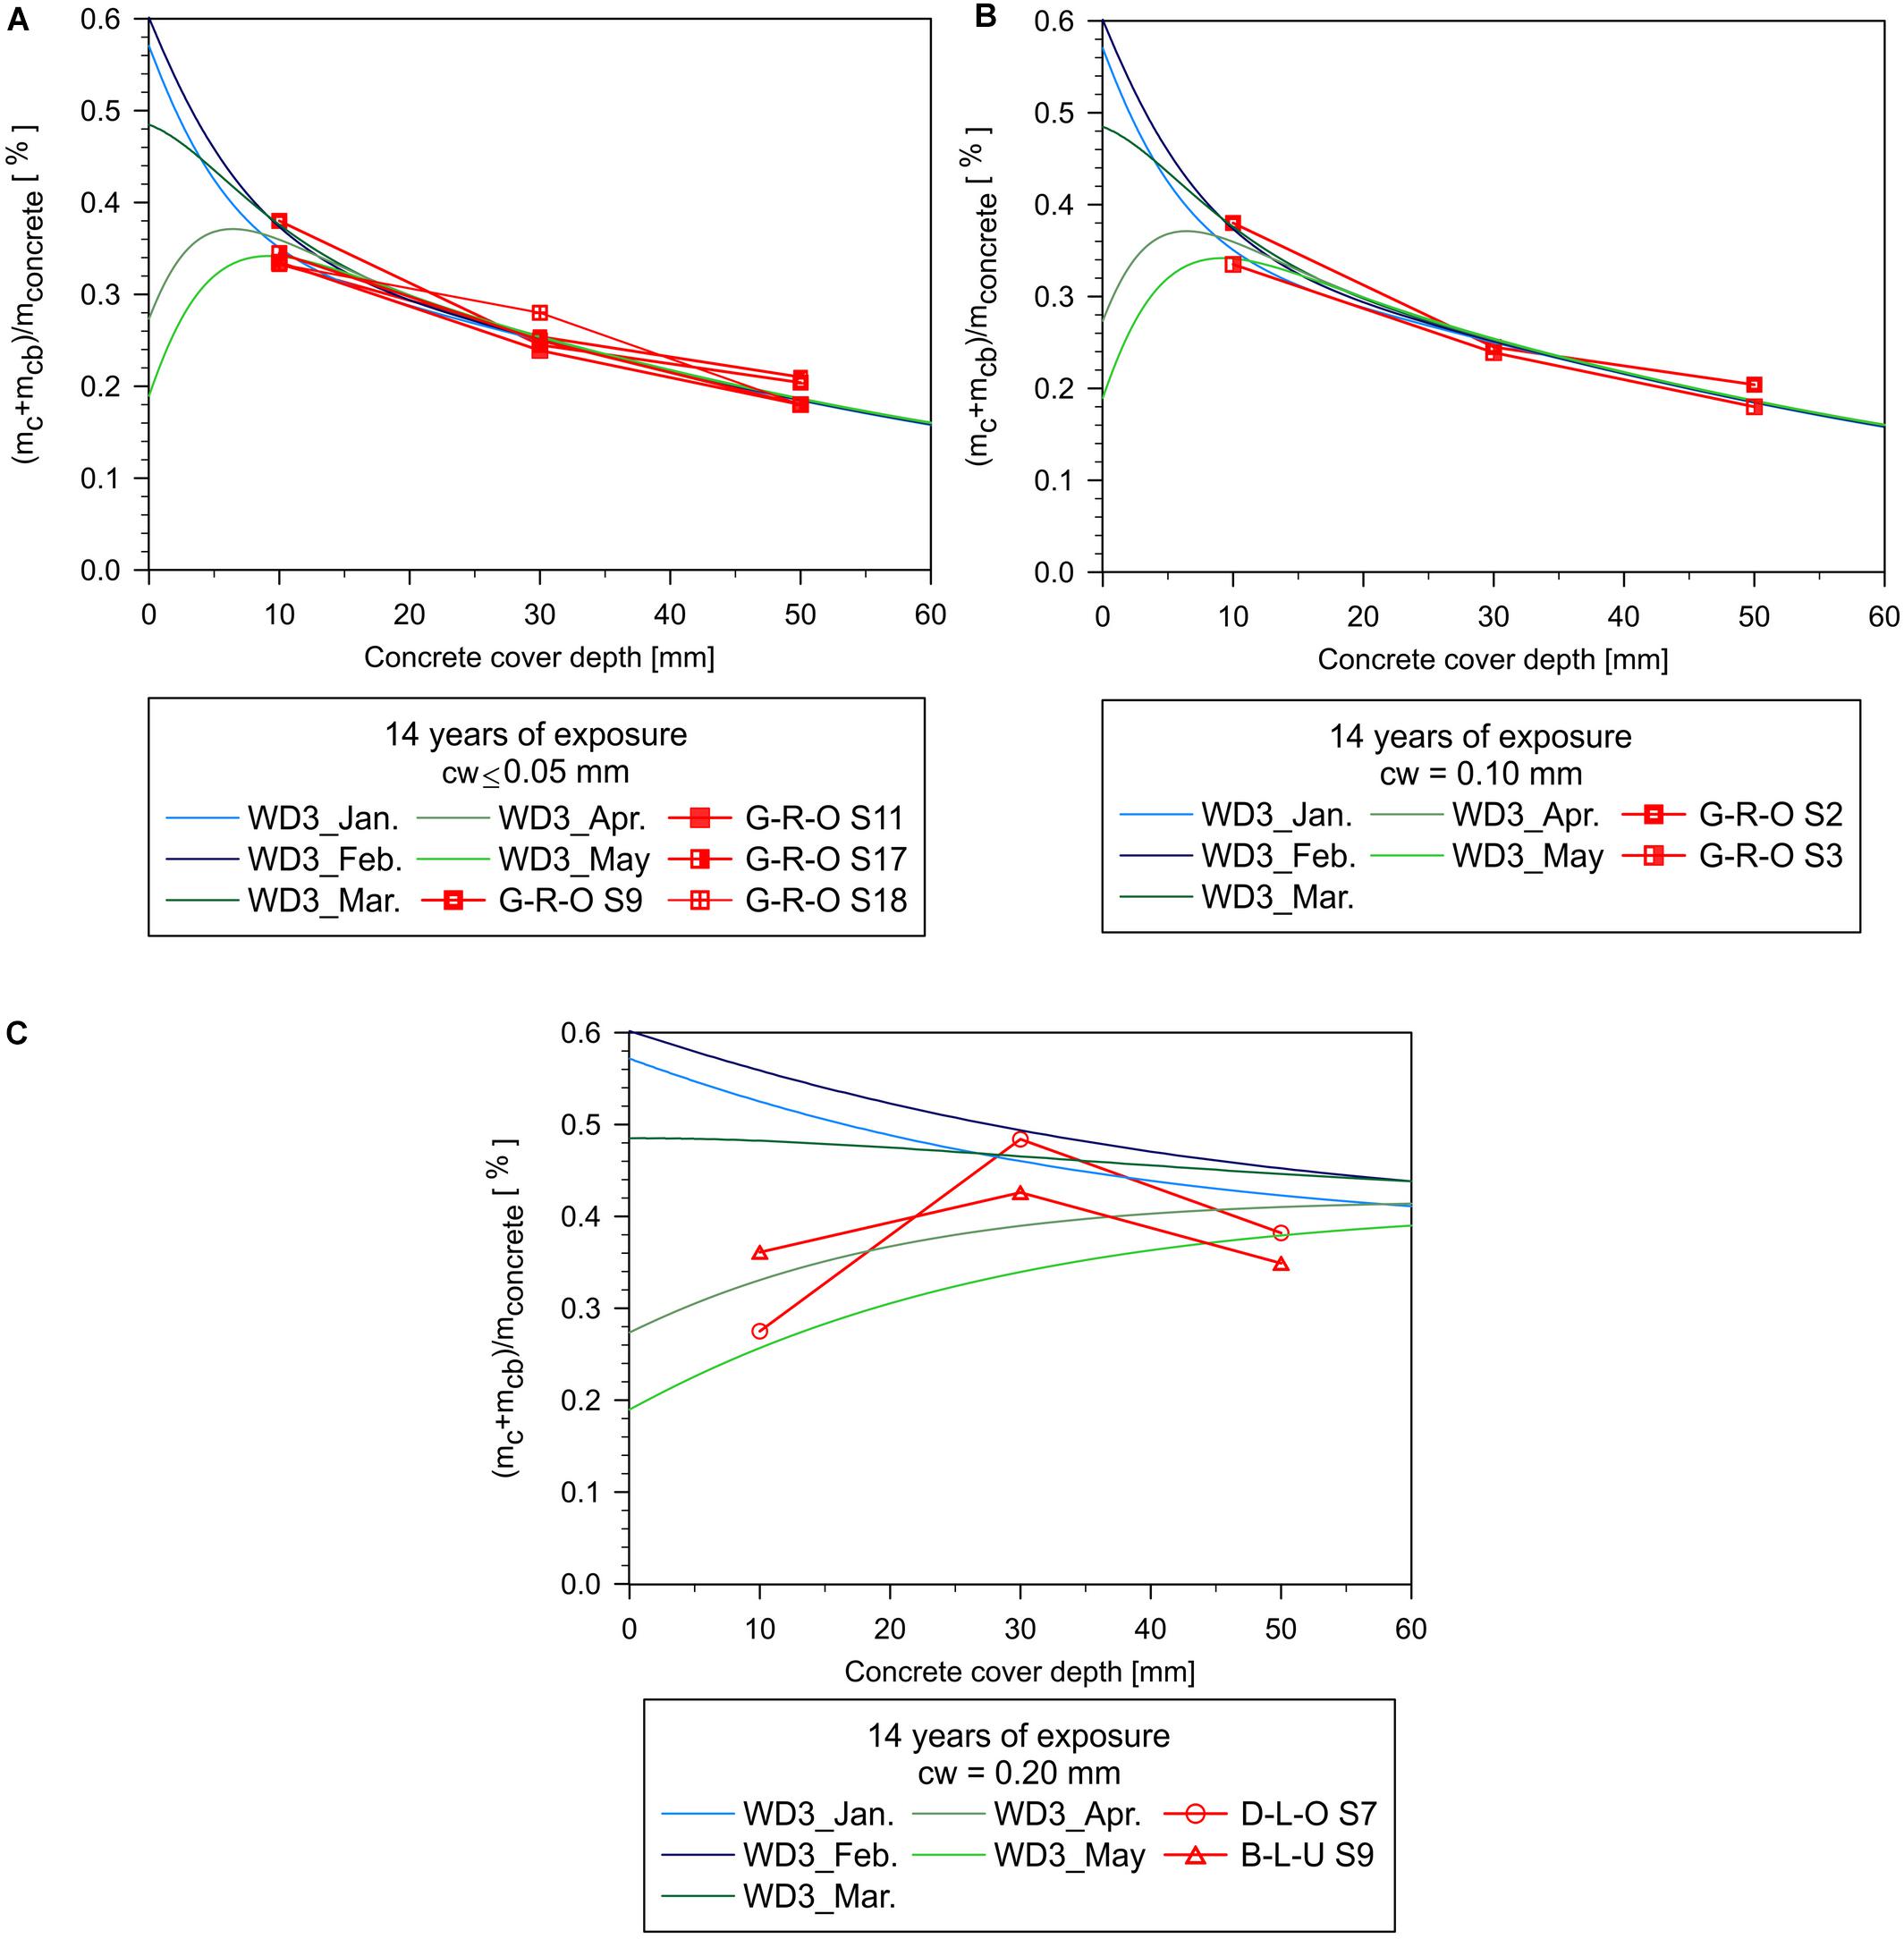
Figure 13. Total (free + bound) chloride content in concrete after 14 years of exposure to high aggressive environment—comparison of the values measured on the Zečeve Drage Viaduct—the right bridge (to Rijeka) and the numerical models (WD3) for different crack widths (cw): (A) cw ≤ 0.05 mm, (B) cw = 0.10 mm, and (C) cw = 0.20 mm.
Concrete samples from the viaduct for the chloride content determination were taken in April 2018. Continuously measured daily meteorological data (temperature, relative humidity, participations, wind, etc.) can oscillate and vary significantly with perennial averages. Therefore, to consider these effects in the numerical simulations, the numerical results are presented after 11 and 14 years of exposure, with the variations shown ranging from January until May. For uncracked concrete (cw ≤ 0.05 mm), differences in chloride content per month are noticeable only in the surface layer of concrete up to the depth of 10 mm (Figures 8–13A). The concrete depth, at which chloride content does not vary on monthly changes in exposure conditions, increases with wider crack width (Figures 8–13B,C). At crack width of cw ≥ 0.20 mm (Figures 8–13), chloride profiles are not the same for the winter and spring months; during the warm season, chloride content decreases in the surface layer and increases in deeper layers of concrete. Differences in the chloride content per month are increasing slightly in a more aggressive environment with the higher surface chloride content and with increase of exposure time.
Chloride content value of 0.05% by concrete weight, corresponding to value of 0.40% by cement weight, is adopted as the threshold chloride concentration based not only on the cement type, concrete mixture, microclimate, and environmental exposure but also on the results of the on-site testing and observations. Concrete cover depths on the analyzed bridge elements vary from 20 to 50 mm (IGM, 2018). At the depth of Cc = 30 mm, which is an average concrete cover, chloride content in all 25 analyzed locations of the left bridge (to Zagreb) and 31 analyzed locations of the right bridge (to Rijeka) surpass the threshold value, whereas at the depth of 50 mm, the threshold value is reached in the majority of analyzed samples (Figures 8–13). At the average reinforcement level (Cc = 30 mm), the chloride content in the girder of the left bridge is eight times higher than the threshold value (Figure 10C), whereas the maximal chloride content on the 3-year older right bridge is measured on the deck and surpass the critical value even 10 times (Figure 13C).
Based on the measured data, it can be concluded that among the analyzed structural elements, abutments are the least exposed to de-icing salts, although the expansion joints above them are damaged and water leaks on the abutment walls. Although the upper parts of the concrete barriers are the most exposed to de-icing salts, the same or even higher chloride content is measured on the bottom part of the deck and outside part of the box girder of both bridges. This is a consequence of a poorly constructed joint between the concrete barrier and deck edge, through which water leaks (Figure 7C). Moreover, a drip inducer for water shedding is not executed on the bottom edge of the bridge deck. Hence, the bottom part of the bridge deck and web of the box girder are continuously exposed to water with dissolved de-icing salts. Despite the concave curve of the vertical alignment, the middle spans are not more vulnerable in relation to the side spans. Because the viaduct alignment is in a horizontal curve, both bridges have a one-sided transverse slope to the left (Figure 7B). Elements on the left side of each bridge have in average higher chloride content in concrete, but this difference is negligible, because the chloride content at the concrete cover depth exceeds the threshold value by multiple times.
Most of the measured chloride profiles correspond well to the numerical profiles for uncracked concrete or concrete with narrow cracks, cw ≤ 0.10 mm (Figures 8–13). The peak of numerical chloride profile (maximum value of chloride content in the numerical simulations) is reached at the depth of 5 mm for uncracked concrete during April and May. Most of the measured chloride profiles do not have a pronounced peak value because the increments of concrete depth of 20 mm at which the chloride content was measured is relatively large. However, there are few measured chloride profiles with the horizontal shape or with the pronounced peak at the concrete depth of 30 mm, which corresponds well to the numerical simulation for the crack width cw ≥ 0.15 mm (Figures 8–13C). This type of chloride profile can be achieved in the numerical simulation only if concrete damage and wetting–drying cycles are considered.
The 3D CHTM model is quite complex for application on real structures requiring an experienced expert in the field of FE modeling, the high computer performance, and long computation time; hence, its application in everyday practice is not suitable. However, by employing this type of a model for service life prediction, some valuable conclusions can be obtained followed by simple design rules for new bridges and maintenance recommendations for existing bridges. Namely, in the motorway network, to which the analyzed bridges belong, there are about 10 bridges of similar age, structure type, environment, maintenance program, and overall structural condition. Therefore, some conclusion made for case studies can be valid for other bridges in the mountain region, such as (i) cracks in the concrete and poorly executed details allow significantly faster chloride leading to much faster structure deterioration; (ii) inclusion of wetting drying cycles in the service life model leads to higher and more realistic chloride content in concrete in comparison to simple chloride ingress model, etc.
In Croatia, only road authorities of higher road classes have developed bridge management systems, while maintenance plans and programs of all bridge owners are based on results of visual inspections (Kušter Marić et al., 2019). However, reinforcement corrosion can be noticed by visual inspection only in advanced stage, when the chance for optimal maintenance is already lost. Hence, application of 3D CHTM model for numerical simulation of chloride ingress in concrete and reinforcement corrosion is valuable for some case studies, e.g., landmark bridge or typical structure, in order to obtain new knowledge, design, and maintenance recommendation, which can help in the maintenance of whole bridge network or in error elimination during the design of new structures.
The brief overview of the 3D CHTM model as one of the most comprehensive models for service life prediction is presented in the article followed by its application on the analysis of the existing concrete structures exposed to de-icing salts, wetting–drying cycles, and mechanical damage. The major conclusions drawn from this study are summarized below:
• Inclusion of the wetting–drying cycles in the chloride-ingress model results in more realistic simulation of the continuous transport processes in concrete. The chloride content at the average concrete cover depth of 30–50 mm is doubled if the wetting–drying cycles and non-uniform surface chloride concentration over the year are considered in comparison with the corresponding model without wetting–drying cycles and with constant surface chloride and water content over time.
• Application of large quantities of de-icing salts on the motorway combined with the poorly executed bridge details (e.g., joint of concrete barrier and bridge deck, lack of a drip inducer for water shedding, etc.) resulted in high chloride content in concrete of bridge superstructure, which exceeds the threshold value up to 10 times in structural elements with cracks (damage).
• The presented numerical results are in good agreement with the values measured on the bridges, what leads to conclusion that the boundary conditions are well defined and numerical simulations of the transport processes in cracked and uncracked concrete is realistic.
The datasets generated for this study can be obtained from the corresponding author upon request.
MKM developed conception and design of the study and wrote the first draft of the manuscript. JO, GB, and MKM developed the 3D CHTM model and implemented it in the FE code. MKM, OZ, and SG worked on numerical models. MKM and OZ collected and analyzed numerical and measured results. OZ and GB wrote sections of the manuscript. All authors contributed to the manuscript revision, read, and approved the submitted version.
This research was carried out in the framework of two projects: (i) the joint Canadian—Croatian research project “Durability of reinforced concrete structures—Croatian and Canadian practices (CROCANDY),” financed by the Prof. Dr. Sc. Jasna Šimunić-Hrvoić Foundation and supported by University of Toronto—Faculty of Applied Science & Engineering, University of Zagreb—Faculty of Civil Engineering, and Rijeka-Zagreb Motorway, and (ii) the UKF project 04/17 “Influence of concrete damage on reinforcement corrosion—computer simulation and in-service performance of bridges (CODEbridges)” co-funded by Unity through Knowledge Fund (UKF), University of Stuttgart and University of Zagreb. The academic mobility among the authors was co-funded by University of Zagreb through academic mobility program in 2019.
The authors declare that the research was conducted in the absence of any commercial or financial relationships that could be construed as a potential conflict of interest.
The authors wish to express their gratitude to Prof. Dr. Sc. Jasna Šimunić-Hrvoić Foundation, Unity through Knowledge Fund (UKF) and included universities for their support. They would like to thank the Rijeka-Zagreb Motorway for transfer of the bridge maintenance data and their support in the projects.
Akita, H., Fujiwara, T., and Ozaka, Y. (1997). A practical procedure for the analysis of moisture transfer within concrete due to drying. Magaz. Concrete Res. 179, 129–137. doi: 10.1680/macr.1997.49.179.129
Aldea, C.-M., Ghandehari, M., Shah, S. P., and Karr, A. (2000). Estimation of water flow through cracked concrete under load. ACI Mater. J. 97, 567–575.
Alexander, M., and Beushausen, H. (2019). Durability, service life prediction, and modelling for reinforced concrete structures – review and critique. Cement Concrete Res. 122, 17–29. doi: 10.1016/j.cemconres.2019.04.018
Bažant, Z. P., and Kaplan, M. F. (1996). Concrete at High Temperatures: Material Properties and Mathematical Models. Harlow: Longman.
Bažant, Z. P., and Oh, B. H. (1983). Crack band theory for fracture of concrete. Mater. Struct. 93, 155–177. doi: 10.1007/bf02486267
Bentz, D. P., Garboczi, E. J., Lu, Y., Martys, N., Sakulich, A. R., and Weiss, W. J. (2013). Modeling of the influence of transverse cracking on chloride penetration into concrete. Cement Concrete Composit. 38, 65–74. doi: 10.1016/j.cemconcomp.2013.03.003
Calvi, G. M., Moratti, M., O’Reilly, G. J., Scattarreggia, N., Malomo, D., Monteiro, R., et al. (2018). Once upon a time in italy: the tale of the morandi bridge. Struct. Eng. Int. 29, 198–217. doi: 10.1080/10168664.2018.1558033
Castaldo, P., Gino, D., and Mancini, G. (2019). Safety formats for non-linear finite element analysis of reinforced concrete structures: discussion, comparison and proposals. Eng. Struct. 193, 136–153. doi: 10.1016/j.engstruct.2019.05.029
Castaldo, P., Palazzo, B., and Mariniello, A. (2017). Effects of the axial force eccentricity on the time-variant structural reliability of aging r. c. cross-sections subjected to chloride-induced corrosion. Eng. Struct. 130, 261–274. doi: 10.1016/j.engstruct.2016.10.053
DHMZ (2019). Climate Monitoring, Croatian Meteorological and Hydrological Service, Zagreb. Zagreb: Croatian Meteorological and Hydrological Service.
Djerbi, A., Bonnet, S., Khelidj, A., and Baroghel-bouny, V. (2008). Influence of traversing crack on chloride diffusion into concrete. Cement Concrete Res. 38, 877–883. doi: 10.1016/j.cemconres.2007.10.007
Ghasemzadeh, F., and Pour-Ghaz, M. (2015). Effect of damage on moisture transport in concrete. J. Mater. Civil Eng. 27, 1–12. doi: 10.1061/(ASCE)MT.1943-5533.0001211
Gu, C.-P., Ye, G., and Sun, W. (2015). A review of the chloride transport properties of cracked concrete: experiments and simulations ∗. J. Zhejiang Univ. Sci. A 16, 81–92. doi: 10.1631/jzus.A1400247
Hájková, K., Šmilauer, V., Jendele, L., and červenka, J. (2018). Prediction of reinforcement corrosion due to chloride ingress and its effects on serviceability. Eng. Struct. 174, 768–777. doi: 10.1016/j.engstruct.2018.08.006
Hansen, K. K. (1986). Sorption Isotherms A Catalogue. Technical Report 162/86. Lyngby: Technical University of Denmark.
IGM (2018). Report on Visual Inspection and Investigations Works Carried out on the Zečeve Drage Viaduct. Zagreb: IGM.
Imounga, H. M., Bastidas-Arteaga, E., Pitti, R. M., Ango, S. E., and Wang, X.-H. (2020). Bayesian assessment of the effects of cyclic loads on the chloride ingress process into reinforced concrete. Appl. Sci. 10, 1–19. doi: 10.3390/app10062040
Jang, S. Y., Kim, B. S., and Oh, B. H. (2011). Effect of crack width on chloride diffusion coef fi cients of concrete by steady-state migration tests. Cement Concrete Res. 4, 9–19. doi: 10.1016/j.cemconres.2010.08.018
Kušter Marić, M., Mandić Ivanković, A., Vlašić, A., Bleiziffer, J., Srbić, M., and Skokandić, D. (2019). Assessment of reinforcement corrosion and concrete damage on bridges using non-destructive testing. Graðevinar 71, 843–862. doi: 10.14256/JCE.2724.2019
Kušter Marić, M., Ožbolt, J., and Balabanić, G. (2020). Reinforced concrete bridge exposed to extreme maritime environmental conditions and mechanical damage: measurements and numerical simulation. Eng. Struct. 205:110078. doi: 10.1016/j.engstruct.2019.110078
Kušter Marić, M., Ožbolt, J., Mandić Ivanković, A., Vlašić, A., Bleiziffer, J., Srbić, M., et al. (2018). “Quality specification for concrete bridges vulnerable to reinforcement corrosion,” in EBook of the 3rd Workshop Meeting Cost Action TU1406, eds J. Matos, J. Casas, J. Bien, and T. Kaminski (Wrocław: University of Stuttgart), 1–8.
Kwiatkowski, J., Woloszyn, M., and Roux, J. J. (2009). Modelling of hysteresis influence on mass transfer in building materials. Build. Environ. 44, 633–642. doi: 10.1016/j.buildenv.2008.05.006
Life 365 (2005). Service Life Prediction Model, Computer Program for Predicting the Service Life and Life-Cycle Costs of Reinforced Concrete Exposed to Chlorides. Michigan: ACI Committee.
Muthena, A., Andrade, C., Nilsson, L.-O., and Edvardsen, C. (2000). DuraCrete. Final Technical Report. Tech. Rep. Final Report of the projectr BE95-1347/R4-5.
Nguyen, P. T., Bastidas-Arteaga, E., Amiri, O., and El Soueidy, C.-P. (2017). An efficient chloride ingress model for long-term lifetime assessment of reinforced concrete structures under realistic climate and exposure conditions. Int. J. Concrete Struct. Mater. 11, 199–213. doi: 10.1007/s40069-017-0185-8
Nilsson, L. O. (2001). Prediction Models for Chloride Ingress and Corrosion Initiation in Concrete Structures. Goteborg: Chalmers University of Technology.
Ožbolt, J., Balabanić, G., and Kušter, M. (2011). 3D numerical modelling of steel corrosion in concrete structures. Corros. Sci. 53, 4166–4177. doi: 10.1016/j.corsci.2011.08.026
Ožbolt, J., Balabanić, G., Periškić, G., and Kušter, M. (2010). Modelling the effect of damage on transport processes in concrete. Constr. Building Mater. 24, 1638–1648. doi: 10.1016/j.conbuildmat.2010.02.028
Ožbolt, J., Balabanić, G., and Sola, E. (2017a). Determination of critical anodic and cathodic areas in corrosion processes of steel reinforcement in concrete. Mater. Corros. 68, 622–631. doi: 10.1002/maco.201609295
Ožbolt, J., Oršanić, F., and Balabanić, G. (2017b). Modelling processes related to corrosion of reinforcement in concrete: coupled 3D finite element model. Struct. Infrastruct. Eng. 13, 135–146. doi: 10.1080/15732479.2016.1198400
Ožbolt, J., Kušter, M., Balabanić, G., and Oršanić, F. (2013). “Numerical modelling of degradation of reinforced concrete structures exposed to cracking and chlorides,” in Proceedings of the IABSE Symposium Report of Assessment, Upgrading and Refurbishment of Infrastructures (Rotterdam: IABSE), 1–8.
Ožbolt, J., Li, Y. J., and Kožar, I. (2001). Microplane model for concrete with relaxed kinematic constraint. Fracture Mech. Concrete Struct. 38, 609–616. doi: 10.1016/S0020-7683(00)00177-3
Ožbolt, J., Oršanić, F., and Balabanić, G. (2016a). Modeling corrosion-induced damage of reinforced concrete elements with multiple-arranged reinforcement bars c and G. Balabani. Mater. Corros. 67, 542–552. doi: 10.1002/maco.201508569
Ožbolt, J., Oršanić, F., and Balabanić, G. (2016b). Modeling influence of hysteretic moisture behavior on distribution of chlorides in concrete. Cement Concrete Compos. 67, 73–84. doi: 10.1016/j.cemconcomp.2016.01.004
Ožbolt, J., Oršanić, F., Balabanić, G., and Kušter, M. (2012). Modeling damage in concrete caused by corrosion of reinforcement: coupled 3D FE model. Int. J. Fract. 178, 233–244. doi: 10.1007/s10704-012-9774-3
Page, C. L., Short, N. R., and Tarras, A. E. (1981). Diffusion of chloride ions in hardened cement pastes. Cement Concrete Res. 11, 395–406. doi: 10.1016/0008-8846(81)90111-3
Saetta, A. V., Scotta, R. V., and Vitaliani, R. V. (1993). Analysis of chloride diffusion into partially saturated concrete. ACI Mater. J. 90, 441–451. doi: 10.14359/3874
Šavija, B., and Schlangen, E. (2011). “Chloride ingress in cracked concrete- a literature review. advances in modeling concrete service life,” in Proceedings of 4th International RILEM PhD Workshop Held in Madrid, Spain, eds C. Andrade and J. Gulikers (Berlin: RILEM Book), 133–142. doi: 10.1007/978-94-007-2703-8_14
Shayanfar, M. A., Farnia, S. M. F., Ghanooni-Bagha, M., and Massoudi, M. S. (2020). The effect of crack width on chloride threshold reaching time in reinforced concrete members. Asian J. Civil Eng. 21, 625–637. doi: 10.1007/s42107-020-00222-6
Sola, E., Ožbolt, J., and Balabanić, G. (2016). “Modelling corrosion of steel reinforcement in concrete: natural vs. accelerated corrosion,” in Proceedings of the 9th International Conference on Fracture Mechanics of Concrete and Concrete Structures Berkeley.
Stipanović, I., Bjegović, D., and Mikulić, D. (2010). Evaluation of service life design models on concrete structures exposed to marine environment evaluation of service life design models on concrete structures exposed to marine environment. Mater. Struct. 43, 1397–1412. doi: 10.1617/s11527-010-9590-z
Tang, L., and Nilsson, L. O. (1997). “Accelerated tests for chloride diffusivity and their application in prediction of chloride penetration,” in Mechanisms of Chemical Degradation of Cement-Based Systems, eds K. L. Scrivener and J. F. Young (Boca Raton, FL: CRC Press).
Tesfamariam, S., Bastidas-Arteaga, E., and Lounis, Z. (2018). Seismic retrofit screening of existing highway bridges with consideration of chloride-induced deterioration: a bayesian belief network model. Front. Built Environ. 4:67. doi: 10.3389/fbuil.2018.00067
Wang, K., Jansen, D. C., Shah, S. P., and Karr, A. F. (1997). Permeability study of cracked concrete. Cement Concrete Res. 27, 381–393. doi: 10.1016/S0008-8846(97)00031-8
Wang, L., and Ueda, T. (2011). Mesoscale modeling of water penetration into concrete by capillary absorption. Ocean Eng. 38, 519–528. doi: 10.1016/j.oceaneng.2010.12.019
Wang, X. H., Bastidas-Arteaga, E., and Gao, Y. (2018). Probabilistic analysis of chloride penetration in reinforced concrete subjected to pre-exposure static and fatigue loading and wetting- drying cycles. Eng. Fail. Anal. 84, 205–219. doi: 10.1016/j.engfailanal.2017.11.008
Wong, H. S., Zhao, Y. X., Karimi, A. R., Buenfeld, N. R., and Jin, W. L. (2010). On the penetration of corrosion products from reinforcing steel into concrete due to chloride-induced corrosion. Corros. Sci. 52, 2469–2480. doi: 10.1016/j.corsci.2010.03.025
Ye, H., Jin, N., Jin, X., and Fu, C. (2012). Model of chloride penetration into cracked concrete subject to drying – wetting cycles. Constr. Build. Mater. 36, 259–269. doi: 10.1016/j.conbuildmat.2012.05.027
Zambon, I., Vidović, A., Strauss, A., and Matos, J. (2019). Use of chloride ingress model for condition assessment in bridge management. Graðevinar 71, 359–373. doi: 10.14256/JCE.2411.2018
Keywords: concrete bridge, de-icing salts, on-site measurements, numerical simulation, crack, wetting–drying cycles, finite element
Citation: Kušter Marić M, Ožbolt J, Balabanić G, Zhychkovska O and Gambarelli S (2020) Chloride Transport in Cracked Concrete Subjected to Wetting – Drying Cycles: Numerical Simulations and Measurements on Bridges Exposed to De-Icing Salts. Front. Built Environ. 6:561897. doi: 10.3389/fbuil.2020.561897
Received: 13 May 2020; Accepted: 26 August 2020;
Published: 02 October 2020.
Edited by:
Bruno Briseghella, Fuzhou University, ChinaReviewed by:
Ivan Zambon, FCP Fritsch, Chiari & Partner ZT, AustriaCopyright © 2020 Kušter Marić, Ožbolt, Balabanić, Zhychkovska and Gambarelli. This is an open-access article distributed under the terms of the Creative Commons Attribution License (CC BY). The use, distribution or reproduction in other forums is permitted, provided the original author(s) and the copyright owner(s) are credited and that the original publication in this journal is cited, in accordance with accepted academic practice. No use, distribution or reproduction is permitted which does not comply with these terms.
*Correspondence: Marija Kušter Marić, bWFyaWphLmt1c3Rlci5tYXJpY0BncmFkLnVuaXpnLmhy; bWFyaWpha0BncmFkLmhy
Disclaimer: All claims expressed in this article are solely those of the authors and do not necessarily represent those of their affiliated organizations, or those of the publisher, the editors and the reviewers. Any product that may be evaluated in this article or claim that may be made by its manufacturer is not guaranteed or endorsed by the publisher.
Research integrity at Frontiers
Learn more about the work of our research integrity team to safeguard the quality of each article we publish.