
94% of researchers rate our articles as excellent or good
Learn more about the work of our research integrity team to safeguard the quality of each article we publish.
Find out more
ORIGINAL RESEARCH article
Front. Built Environ., 21 December 2020
Sec. Wind Engineering and Science
Volume 6 - 2020 | https://doi.org/10.3389/fbuil.2020.547706
This article is part of the Research TopicNatural Hazards Engineering Research Infrastructure (NHERI) 2016-2020: Mitigating the Impact of Natural Hazards on Civil Infrastructure and CommunitiesView all 16 articles
 Ellen M. Rathje1*
 Clint Dawson2
 Jamie E. Padgett3
 Jean-Paul Pinelli4
 Dan Stanzione5Pedro Arduino6Scott J. Brandenberg7Tim Cockerill5
 Maria Esteva5
 Fred L. Haan Jr.8
 Ahsan Kareem9
 Laura Lowes6
 Gilberto Mosqueda10
The DesignSafe cyberinfrastructure (www.designsafe-ci.org) is part of the NSF-funded Natural Hazard Engineering Research Infrastructure (NHERI) and provides cloud-based tools to manage, analyze, understand, and publish critical data for research to understand the impacts of natural hazards. The DesignSafe Data Depot provides private and public disk space to support research collaboration and data publishing through a web interface. The DesignSafe Reconnaissance Portal uses a map interface to provide easy access to data collected to investigate the effects of natural hazards, and the DesignSafe Workspace provides cloud-based tools for simulation, data analytics, and visualization; as well as access to high performance computing (HPC). This paper provides an overview of the DesignSafe cyberinfrastructure and describes specific examples of the use of DesignSafe in research for natural hazards. These examples include electronic data reports that use Jupyter notebooks to allow researchers to interrogate data interactively within the web portal, computational workflows that integrate ensembles of HPC-based simulations and surrogate modeling, and the publication of field research data after natural hazard events that utilize a variety of DesignSafe tools. The paper also provides an overall assessment of current DesignSafe impact and usage, demonstrating how DesignSafe is enhancing research in natural hazards.
The DesignSafe cyberinfrastructure (www.designsafe-ci.org, Rathje et al., 2017) has been developed as part of the Natural Hazards Engineering Research Infrastructure (NHERI) to enable and facilitate transformative research to understand the impacts of natural hazards, which necessarily spans across multiple disciplines (e.g., engineering, earth science, and social science) and can take advantage of advancements in computation, experimentation, and data analysis. DesignSafe allows researchers to more effectively share, find, analyze, and publish data; perform numerical simulations and utilize high performance computing (HPC); and integrate diverse datasets. DesignSafe has been developed as a flexible, extensible, community-driven cyberinfrastructure and it embraces a cloud strategy for the big data generated to study the impacts of natural hazards. It provides a comprehensive cyberinfrastructure (CI) that supports the full research lifecycle, from planning to execution to analysis to publication and curation. DesignSafe represents the next-generation cyberinfrastructure that evolved after NEEShub (Hacker et al., 2013), the cyberinfrastructure that supported research in earthquake engineering from 2009 to 2015. NEEShub played an important role in promoting data publishing within the earthquake engineering community, and DesignSafe is building on that effort to foster a cultural shift toward the pervasive use of cyberinfrastructure and the ubiquitous publishing/reuse of data in natural hazards research.
This paper summarizes the DesignSafe components available to facilitate research and describes examples of how DesignSafe is being used by the community. These examples are derived from current work being enabled by DesignSafe, and include (1) a Jupyter notebook that allows researchers to interrogate experimental data interactively within the DesignSafe web portal (Arduino et al., 2018), (2) a computational workflow that integrates ensembles of HPC-based storm surge simulations and uncertainty quantification to estimate wind drag coefficients, (3) a computational workflow that optimizes building shape for wind effects using HPC-based computational fluid dynamics simulations and surrogate modeling (Ding et al., 2019), and (4) published field reconnaissance datasets from recent natural hazards (e.g., Kijewski-Correa et al., 2018; Brandenberg et al., 2020). We conclude with an overall assessment of current DesignSafe impact and usage.
The DesignSafe vision is to deliver a (CI) that is an integral part of research discovery and enables breakthroughs that could not be made otherwise. The three main DesignSafe components that are at the core of realizing this vision are: the Data Depot data repository, the Workspace with its cloud-based tools and access to HPC, and the Reconnaissance Portal to interface with field research data collected after natural hazard events (Figure 1). These components have been designed to quickly share, publish, and find data, to easily perform cloud-based analytics, and to lower the bar toward using high performance computing. The use of these tools is facilitated by the tutorials provided in the Learning Center (Figure 1).
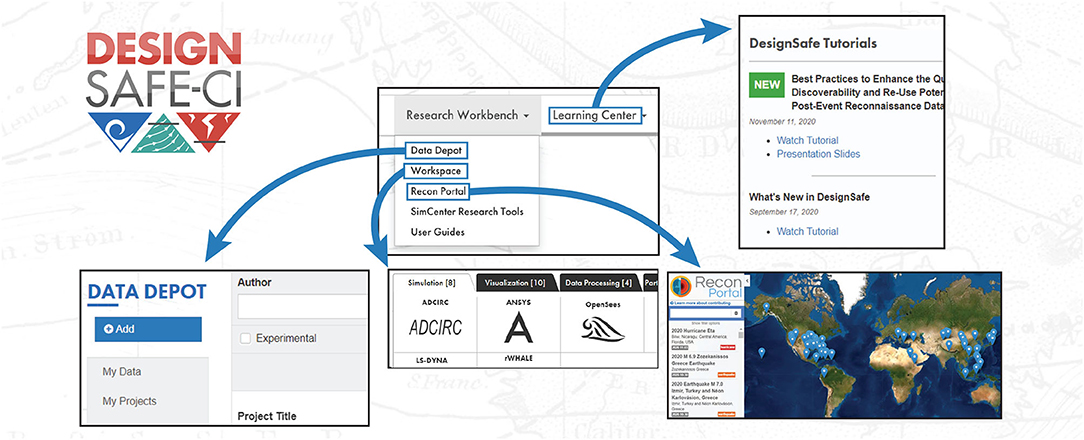
Figure 1. Main components of the DesignSafe cyberinfrastructure.
The Data Depot is the central shared data repository that supports the full research lifecycle, from data creation to analysis to curation and publication. Researchers have access to a private “My Data” space, a semi-private and collaborative “My Projects” space, and a “Published” space for curated and publicly available data. Upload/download of data is streamlined through a range of interactive and automated options for both single file and bulk transfer, including drag and drop file upload, federation with existing cloud data services (e.g., Box, Dropbox, Google Drive, Globus), and command line interfaces that can be automated by power users. There are no limitations regarding data format, such that users are free to use the format that best supports their research, and large data volumes can also be accommodated.
Data curation services are provided to all users in DesignSafe. Curation involves organizing data and gathering the documentation that is needed for its use now and in the future. DesignSafe provides the tools and resources required to fully curate complex datasets that are ultimately published within the Data Depot. These tools have been developed to handle the unique characteristics of different types of datasets, specifically Experimental data, Simulation data, Hybrid Simulation data, Field Research data, as well as Other data. DesignSafe has adopted a progressive approach to data curation, in which the research team can provide the curation information during the course of the research, and thus shares responsibility for the curation process. When initially uploaded, data may have limited or even no user-supplied metadata. As data progresses toward publication, the requirements for metadata increase and at publication the user may edit the metadata and complete the process of assigning Digital Object Identifiers (DOIs) and applying the appropriate license. On demand assistance from a curator is available to provide training and to guide users through their data curation and publication needs. Published datasets are available within the “Published” area of the Data Depot, which is fully indexed and searchable.
The Workspace provides tools for researchers to analyze, visualize, and transform their data in the cloud, and to perform simulations using the most sophisticated computational tools available. Within the web portal, the Workspace provides a wide variety of Apps that can access the files in the Data Depot, and user-defined Apps can be installed with assistance from DesignSafe staff. The Apps available within the Workspace are continuously evolving, but the current deployment of tools includes computational simulation tools (e.g., OpenSees, ADCIRC, OpenFOAM, LS-Dyna), as well as tools for both data analytics and visualization (e.g., MATLAB; Jupyter; HazMapper, QGIS). Open source codes are preferred but commercial codes also are available, with the commercial codes requiring an active license for the user to access them. Jupyter is a particularly noteworthy component of DesignSafe. A Jupyter notebook is an electronic notebook that allows users to embed rich text elements, as well as computer code, graphs, and visualizations, within a single notebook that can be shared through the web. The JupyterHub deployed as part of DesignSafe supports notebooks written in the common coding languages of Python and R, making it a versatile tool that can enable research workflows as well as data processing and analysis.
Many of the tools within the Workspace have access to HPC resources, making it easy for researchers to employ these resources in their work. These HPC-enabled tools in the Workspace can be used without request of a specific DesignSafe HPC allocation. We can also provide command line access to HPC resources for more advanced researchers. Details regarding the DesignSafe HPC allocation policy can be found at https://www.designsafe-ci.org/rw/user-guides/allocations-policy/.
The Reconnaissance Portal is the main access point for data collected during the reconnaissance after windstorm and earthquake events. Reconnaissance activities produce diverse data, including infrastructure performance data (e.g., damage estimates, ground movements, coastal erosion, wind field estimates), remotely sensed data (e.g., photos, video, LIDAR point clouds, satellite imagery data), or human experiential data (e.g., social media data, societal impact data, survey or interview data). These diverse data types have different metadata requirements, but their use hinges on information regarding the location from which the data were collected. Therefore, the Reconnaissance Portal utilizes a mapping framework to display the natural hazard events for which reconnaissance data are available. The reconnaissance data is physically located in the Data Depot and accessible by analytics and visualization tools in the Workspace (e.g., HazMapper, QGIS), but the Reconnaissance Portal provide improved discoverability of the data.
Another feature that can be used by all DesignSafe users is the DesignSafe Slack team, which can be accessed through a web host (https://designsafe-ci.slack.com) or the Slack App. Slack is an online collaborative communication tool that represents a modern, highly capable and integrative user forum. Communication can take place publicly via organized, topical channels (e.g., Jupyter, OpenSees, or a specific natural hazard event), or privately through direct messages between individuals or small groups. Files can be shared easily through drag and drop, and all content is indexed for easy search.
The NHERI Science Plan (Edge et al., 2020) includes three Grand Challenges with five Key Research Questions to guide NHERI research to deliver technical breakthroughs to improve the resilience and sustainability of the built environment. Two of the Key Research Questions relate directly to DesignSafe functionalities that enable simulation and data sharing, but at some level all of the research questions require access to the big data, cloud-based tools, and HPC resources provided by DesignSafe. And thus, DesignSafe plays an important role toward enabling the vision of the NHERI Science Plan.
The key to transforming research in natural hazards engineering is transforming research workflows by providing access to the data and tools required to innovate. Approximately 4 years after initial deployment, it is clear that DesignSafe is influencing the research being performed in natural hazards engineering and the approaches being employed. Jupyter notebooks are being used to interact with data, and they are also being used as workflow engines that integrate large-scale simulations and data analytics. The Reconnaissance Portal, along with other reconnaissance tools, are actively being used by the field research community and the CONVERGE extreme events research networks (https://converge.colorado.edu/research-networks). Below are specific examples of how DesignSafe is being used by the research community.
Damage to coastal communities caused by tsunamis is often the result of the water inundation and transported debris. Although efforts to characterize forces from single debris impacts exist, a more general scenario of multiple debris impacts is necessary. To address this need, experimental studies were conducted at the O.H. Hinsdale Wave Research Laboratory's Large Wave Flume (LWF) at Oregon State University to study the impact of debris carried by waves.
Impact and damming forces on a calibrated instrumentation box were evaluated both qualitatively and quantitatively to provide insight into the nature of these forces. While the dimensions of individual pieces of debris were the same, the number of debris pieces, the orientation of debris pieces, and the relative layout of multiple debris pieces were changed. The main parameter of interest was the force recorded through nine load cells strategically located on the instrumentation box to record forces in different directions. The collected data were curated and are available in the DesignSafe project PRJ-1709—NHERI Debris Impact Experiments (Arduino et al., 2018).
A Jupyter notebook was published with the dataset to provide a clear description of the experimental work, allow navigation and visualization of the recorded data within the cloud, and facilitate basic analysis of the recorded data. For this purpose, the notebook is split into six sections each of which employs widgets to display information relevant to the viewer. This includes:
• Project Description, providing an overview of the experiments.
• Large Wave Flume, describing the experimental facility, with multiple tabs displaying specific flume information.
• Sensor Arrangement and Positioning, describing the location and arrangement of the load cells used in the experiment.
• Debris Layouts and Orientation, describing the physical properties of the debris blocks and layouts considered, with multiple tabs displaying debris dimensions, experimental layouts, test photos and videos.
• Data Viewer, allowing the user to select any particular case/layout and sensor and view the time-history of the forces.
• Frequency Analysis, allowing the user to apply a low pass frequency filter to the force time histories recorded by any sensor in any layout combination and a view its effect on frequency content and time history plots.
Figure 2 displays extracts of the Jupyter notebook corresponding to the Data Viewer and Frequency Analysis windows. The layout and load cell boxes in both windows allow for the selection of the specific case to visualize. The sliders in the data viewer window allow expansion of the X axis. The Window Width [Hz] and Center [Hz] boxes in the Frequency Analysis window allows selection of the frequency range to consider in the low pass frequency filtering. The plots show the unfiltered and filtered signals in the time and frequency domains and selected frequency range. Together, the NEHRI Debris experiments dataset and notebook provide useful information that can be used to guide further experimental and numerical studies on debris-laden tsunami flows.
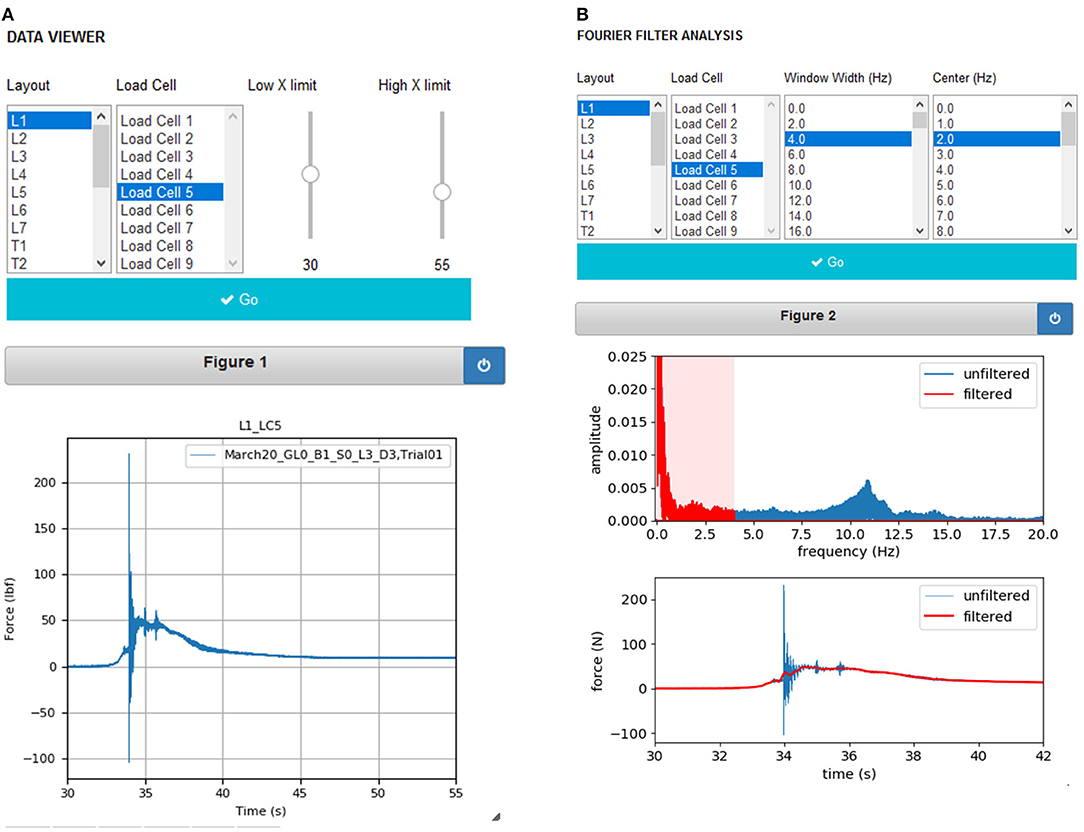
Figure 2. Debris Impact Jupyter Notebook: (A) Data Viewer window showing a recorded load-time history, (B) Frequency Analysis window showing the application of a low pass filter.
Storm surge is often the leading cause of life and property loss during hurricanes and extratropical cyclones. Accurate storm surge forecasting relies both on accurately forecasted winds and accurately modeled air–sea drag, which parameterizes the transfer of momentum from air to the water column. In operational models, typically the wind drag is parameterized in terms of the wind speed at 10-m height, however, this remains an active field of research, see Bryant and Akbar (2016) for a review. The large number of recent hurricanes for which there are large quantities of measured data (e.g., hurricane track, wind speeds, wave heights, storm surge, etc.) provide an opportunity to quantify the uncertainty in a given choice of wind drag parameterization. Uncertainty quantification algorithms combined with forward models for predicting storm surge given wind data, provide a framework for estimating wind drag given measured storm surge data (i.e., water elevations at gage locations).
The Python package LUQ (forthcoming at https://github.com/CU-Denver-UQ/LUQ/), developed by S. M. Mattis (CSU post-doctoral scholar) and T. Butler (CU Denver professor) as part of Mattis et al. (2020), encodes a framework for Learning Uncertain Quantities from the output of dynamical systems (i.e., from time series data) for the data-consistent solutions of stochastic inverse problems (SIP). This provides a conceptual and computational framework for uncertainty quantification of dynamical systems, namely, for propagating uncertainties in model outputs to uncertainties in model inputs that are otherwise not directly observable. Practically, this framework requires running an ensemble of hundreds to thousands of forward simulations to accurately solve a given SIP.
In research led by C. N. Dawson and K. R. Steffen at the University of Texas at Austin, this framework is being used in uncertainty quantification of wind drag parameters for storm surge modeling due to extratropical cyclones using the Advanced Circulation (ADCIRC) framework. Ensembles of ADCIRC simulations are generated using pylauncher (https://github.com/TACC/pylauncher, developed by V. Eijkhout), generating hundreds to thousands of time series (e.g., water surface elevations at a specific location). Jupyter notebooks developed by Butler, Mattis, and Steffen as part of Mattis et al. (2020) provide an interactive environment for experimental analysis of the time series data and solution of the stochastic inverse problem for the model inputs. Useful features of the Jupyter Notebook environment include: the wide selection of Python packages available through pip or conda that can be integrated into a Jupyter notebook through a few clicks and one or two lines of code; interactive plots of raw data, processed data, and results; and the capability to experiment with hyperparameters, such as the effect of additive noise, desired accuracy, etc.
Preliminary work used a test problem on a small ADCIRC domain spanning ~100 km by 100 km, discretized with ~5,000 triangular elements. A wind drag parameterization is proposed as a generalization of the commonly used parameterizations: Cd increases linearly with u10 (wind speed at 10-m) for small wind speeds, up to some cut-off (saturation) given by λ2. Then, the following SIP is solved: given a set of 100 (synthetic) observations (i.e., time series of water surface elevation measured at a specific location) and initial probability distributions on the parameters λ1 and λ2, compute updated probability distributions that are data-consistent in the sense that they are calibrated to the probabilistic information available in the observed data.
Results from a Jupyter notebook implementation of the approach, are presented in Figure 3. The probability distributions for λ1 and λ2 used to create the set of 100 synthetic ADCIRC observed time series are two Beta distributions, as shown in green in Figure 3. The initial (prior) probability distributions are uniform distributions and are shown in blue. The prior probability distributions are used to generate 1,000 predicted ADCIRC time series, which are used within the LUQ framework to solve the SIP. The updated distributions resulting from the SIP are shown in orange, and do not require a forward ADCIRC simulation. Given the excellent match between the solution (in orange) and the synthetic distribution (in green), the experiment demonstrates that the uncertainty in the model inputs λ1 and λ2 has been accurately calibrated to the probabilistic information in the synthetic data set analyzed within the LUQ framework.
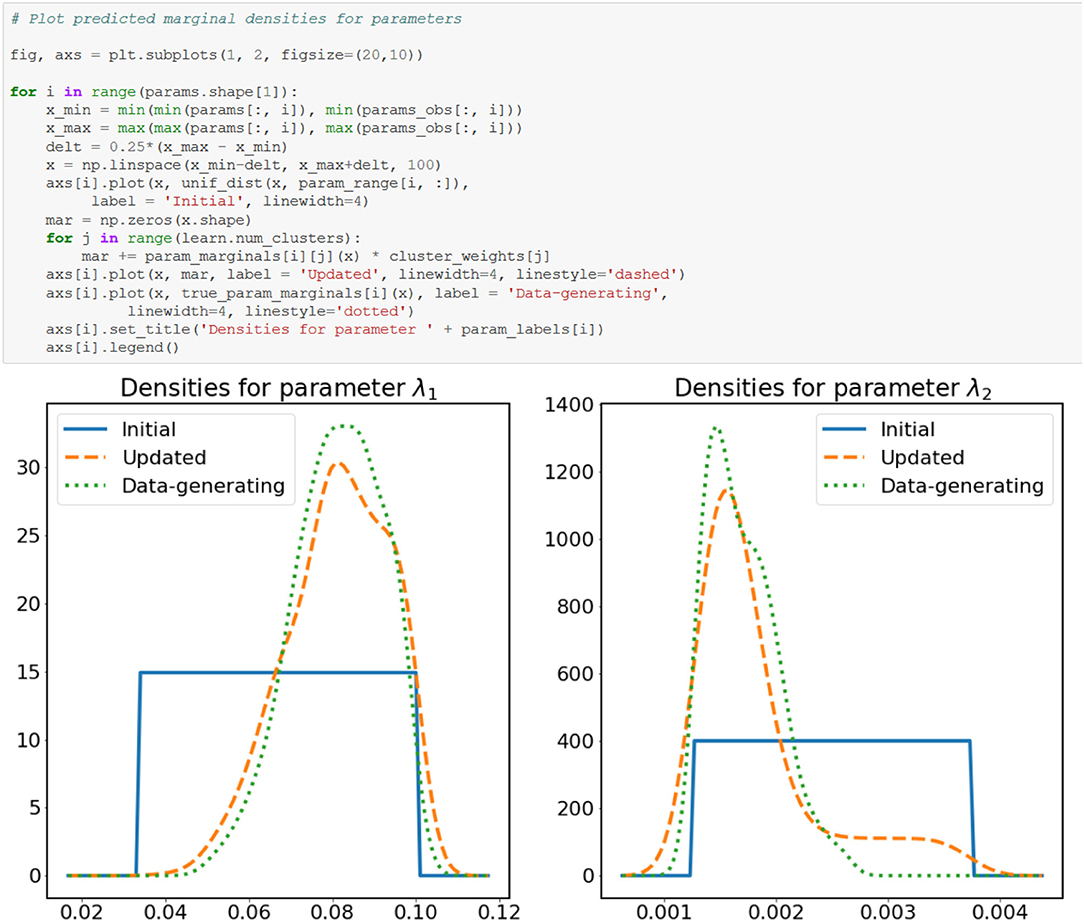
Figure 3. Jupyter notebook that utilizes the LUQ framework to solve for the probability distribution of the ADCIRC wind drag coefficient parameters based on observed storm surge water surface elevations.
DesignSafe enables this research through the Workspace, where both Jupyter and ADCIRC are installed as applications, and where python-based packages such as LUQ can be utilized. Current research is focused on developing a complete workflow within a single Jupyter notebook. The workflow will generate multiple ADCIRC ensembles and submit jobs within the Jupyter notebook using pylauncher, then use the LUQ package to estimate the distribution of wind drag given the measured data and ensemble predictions. This algorithm will be used to estimate wind drag for storms in Western Alaska, where potential ice cover leads to an additional source of uncertainty for wind drag formulations. The model input, ensemble output, and overall results of the research will be archived and published through the DesignSafe Data Depot.
Tall buildings exposed to wind undergo complex interactions, which precludes a functional relationship between wind and its load effects. In the digital age with burgeoning growth in computational resources and parallel advances in computational fluid dynamics (CFD), computational simulations are evolving with a promise of becoming versatile, convenient, and reliable means of assessing wind load effects. DesignSafe offers an effective cloud-based platform to promote the use of computational technologies to address these challenges. Herein an illustrative example is presented, in which aerodynamic shape sculpting of tall buildings was carried using the open-source OpenFOAM CFD software available on the HPC resources provided by DesignSafe. While such an assessment is currently performed via wind tunnels with a very limited set of configurations, computational platforms based on CFD promise to explore the optimal configuration in a large search design space (Ding et al., 2019).
In this study, the relationship between the shape variation of the cross-section of the building and its aerodynamic characteristics is systematically investigated through this digital design platform. The scheme is schematically outlined in Figure 4. The aerodynamic characteristics are defined as the mean drag coefficient (μCd) and the standard deviation of the lift perpendicular to the wind (i.e., lift force coefficient, σCl). The goal is to minimize these two competing aerodynamic objectives by modifying the cross-section shape in terms of (), which yield the Pareto optimal solutions. The biggest concern that exists in aerodynamic shape optimization is the significant computational challenge posed by the multiple CFD simulations involved in the shape optimization process. One remedy involves the use of surrogate models that can replace computationally prohibitive simulations with computationally tractable approximate models.
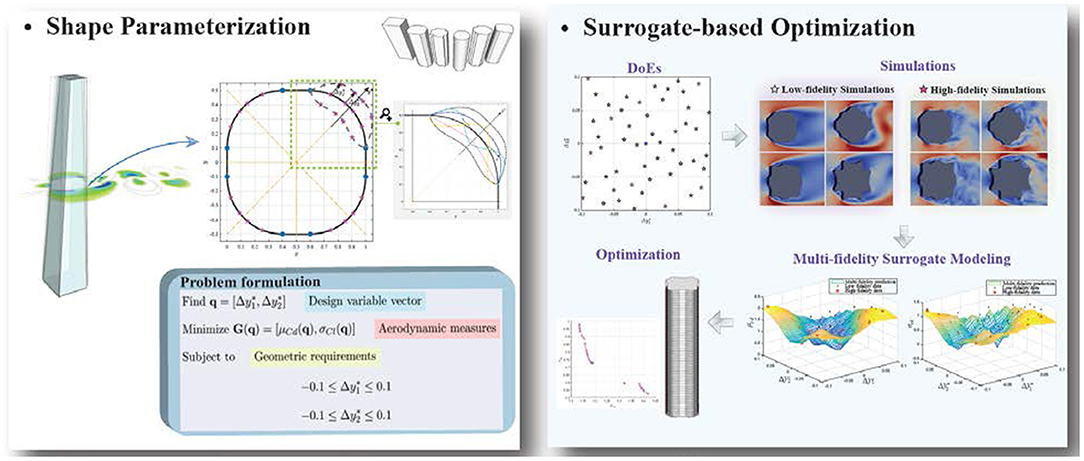
Figure 4. Schematic of aerodynamic shape optimization on a computational platform (Ding and Kareem, 2020).
A surrogate model is built based on regression against the limited set of observations from computational simulations. It starts with the design of experiments (DoEs, Forrester et al., 2008) that generate samples of () for the calibration of the surrogate model as shown in Figure 4. CFD is employed to evaluate the aerodynamic objective functions [i.e., ] on buildings with the sampled geometric profiles. The response surfaces of the surrogate models are used to emulate the original CFD simulations of the two aerodynamic quantities. Optimization algorithms guide the search of the optimal geometric configurations with the best aerodynamic performance to inform the building design.
The success of using the surrogate model largely depends upon the accuracy of the simulation data that are used for model calibration. In the context of CFD simulations for the separated wind flow around bluff bodies, two fundamental approaches are primarily used to numerically capture the massively separated wind flows around buildings (Ferziger et al., 2002), Reynolds-averaged Navier-Stokes (RANS) and Large Eddy Simulation (LES). Currently, RANS is the workhorse of CFD but its model accuracy is compromised. LES enhances the accuracy of the low-fidelity RANS models, but at a major additional computational effort. Therefore, a multi-fidelity surrogate modeling approach is introduced in the aerodynamic shape optimization, which utilizes hierarchical surrogate models relating low-fidelity (i.e., RANS) to high-fidelity (i.e., LES) models (Ding and Kareem, 2018). It has been shown to provide high-quality predictions without significantly increasing the computational effort.
This example demonstrates that the HPC-enabled codes available on the cloud platform offered by DesignSafe is facilitating such advances that are helping to promote and take advantage of CFD to address real world problems.
The last few years have been an active time for natural hazards, with many damaging hurricanes (e.g., Harvey, Maria, Dorian) and earthquakes (e.g., Ridgecrest, CA, Palu Indonesia, Anchorage AK) happening around the world. These events provide an opportunity for the natural hazards reconnaissance community to make use of various DesignSafe functionalities that facilitate activities during field deployments and data integration/publishing after field deployments. Datasets associated with each of the natural hazard events are available via the Reconnaissance Portal (https://www.designsafe-ci.org/recon-portal/, Figure 5). Selection of a natural hazard event, either from the list on the left or the map on the right, takes the user to an event page that provides details of the event and links to available datasets.
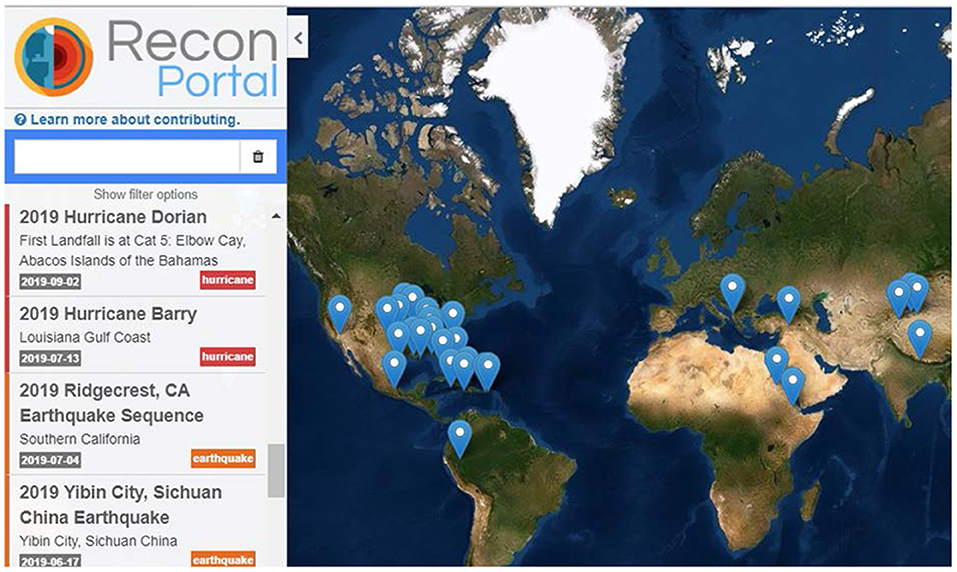
Figure 5. DesignSafe Reconnaissance Portal and natural hazard events for which data are available.
The Geotechnical Extreme Events Reconnaissance (GEER, www.geerassociation.org) Association, part of the CONVERGE network, deployed a team to Ridgecrest, CA following the Ridgecrest earthquake sequence on July 4 and 5, 2019, and made significant use of DesignSafe resources to coordinate their field efforts, curate and publish their data, and visualize their data products (Brandenberg et al., 2019, 2020; Stewart et al., 2019). The data were published in the Data Depot using the “Field Research Project” data model, and are organized into collections representing different types of data.
Researchers utilized the DesignSafe HazMapper tool to organize their GPS track logs and geotagged photos, and GeoJSON files saved from the HazMapper tool are published and can be viewed directly in DesignSafe. A reduced resolution version of each image is stored in the GeoJSON files, and full resolution images are also published with the data. Hand measurements made in the field, including ground crack observations, were synthesized into tables and published with the project data. UAV's equipped with cameras were flown over several key sites of interest to gather digital images and produce orthomosaics and point clouds using structure from motion techniques. Figure 6 shows a screenshot of a point cloud in Trona, CA, where liquefaction and lateral spreading features were observed. These data were processed and visualized using the Potree converter and viewer available through the DesignSafe Workspace. Dense aerial LiDAR data gathered over the surface rupture features for the M6.4 and M7.1 events are currently being processed in Potree, and will be compared with hand measurements of the fault crack features.
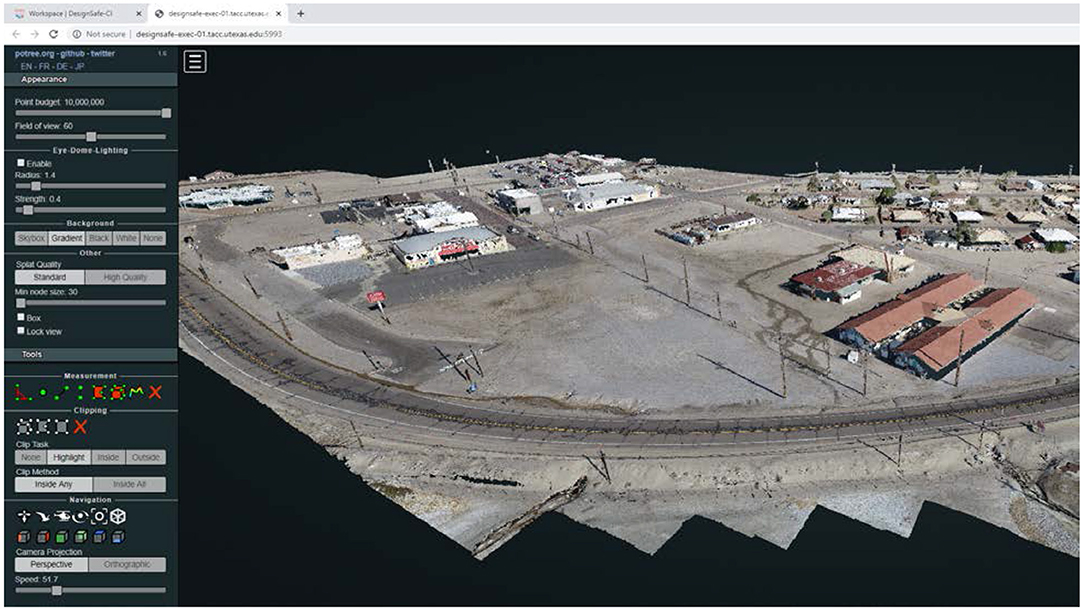
Figure 6. Potree viewer screen shot of point cloud generated from UAV data collected over Trona, CA following the Ridgecrest earthquake sequence.
The free open source geographic information system, QGIS, is also available in the DesignSafe Workspace and was utilized to integrate field observations with other geospatial data, such as surface geology maps and orthomosaic images. Figures published in the GEER report and subsequent papers were generated in DesignSafe using QGIS and the Potree viewer. DesignSafe therefore provided an important resource to the GEER team for coordinating their efforts and learning from the data they collected as part of their reconnaissance efforts. This also marked the first time, to our knowledge, that a GEER reconnaissance team published and assigned a DOI to their data products; typically GEER reports are published, but the data are not.
The Structural Extreme Event Reconnaissance network (StEER, https://www.steer.network/) intends to deepen the structural natural hazards engineering community's capacity for reliable post-event reconnaissance. DesignSafe makes possible an integrated disaster assessment workflow through various stages of deployment, which enhances the ability of StEER to collect higher-quality perishable data and more rapidly process, curate, and publish reconnaissance data. This workflow was first tested during the 2017 hurricane season with hurricane deployments for Harvey, Irma, and Maria (Kijewski-Correa et al., 2018). During the 2018 hurricane season, the workflow was enhanced when DesignSafe facilitated the action of StEER during reconnaissance efforts after Hurricane Michael hit Florida. It was again fully implemented when Hurricane Dorian hit the Bahamas in 2019 (Marshall et al., 2019). This collaborative effort provides a template for deployments in other parts of the world (Robertson et al., 2019), and it is being replicated for other hazards as well (Mosalam et al., 2019).
During the pre-deployment stage, the StEER team assembles data on the event from public sources and issues a Preliminary Virtual Reconnaissance Report (PVRR) (e.g., Kijewski-Correa et al., 2019). These reports, which are published in the DesignSafe Data Depot and are posted in the DesignSafe Reconnaissance Portal, inform the action of the field assessment teams. In addition, teams and interested stakeholders can use Slack as a central communication hub to discuss early observations and deployment strategies.
During deployment, DesignSafe Slack facilitates communication between Field Assessment Structural Teams (FAST) and central coordination and management teams. DesignSafe also supports the direct synchronization of data and metadata from certain data collection platforms, including the RAPID mobile application, and the Fulcrum mobile smartphone application (Spatial Networks Inc., 2017; Pinelli et al., 2018). Using this workflow, data and metadata can be synced to a specified DesignSafe project in real-time or at regular intervals (e.g., daily) as connectivity permits.
Following the completion of field deployments, the FAST publishes an overview of the damage and their preliminary findings in an Early Access Reconnaissance Report (EARR) on DesignSafe (e.g., Marshall et al., 2019 for Hurricane Dorian). It is worth noting that that this workflow is flexible enough so that in extraordinary circumstances where field deployment is not possible (e.g., during coronavirus pandemic), DesignSafe can still provide valuable data. In Spring 2020, StEER decided that events that would traditionally warrant an EARR will still be documented solely through a Preliminary Virtual Reconnaissance Report (PVRR). Events that would traditionally warrant a PVRR will be documented by an Event Briefing. Aerial and satellite data will still be made available through DesignSafe.
StEER also takes advantage of the other DesignSafe cloud-based tools to enhance the post-processing, aggregation, curation, and publication of the reconnaissance datasets with appropriate metadata. Tools such as Hazmapper and QGIS allow for rapid visualization and analysis of spatial data. Jupyter notebooks can be used to join damage assessment data with external data sources such as county parcel attributes. The DesignSafe Slack facilitates the communication between data librarians to ensure the proper standardization, aggregation and quality control of the damage assessment datasets. During this process, DesignSafe provides tools for synthesizing the variety of processed damage assessment data types (e.g., point clouds, orthomosaics) to support the curation process. For example, data librarians can supplement ground-based, door-to-door observations of building damage with three-dimensional views of the building using the Potree viewer tool to ensure all damage is accurately identified and quantified.
As of September 30, 2020, the DesignSafe cyberinfrastructure has over 5,000 registered users. More than 2,200 of these users have accessed DesignSafe over the last year, averaging more than 7 logins per user. We can also infer significant usage by unregistered visitors, based on the more than 50,000 Google analytics web hits of our training and documentation, as well as the number of file downloads detailed below. DesignSafe registered users span a range of technical disciplines (e.g., structural engineering, geotechnical engineering, coastal engineering, and social science) and they investigate a diverse set of natural hazards (e.g., wind storms, tsunami, storm surge, and earthquake). Users are predominantly located in the United States, but ~35% are from other countries.
As stated earlier, our vision for DesignSafe is that it serves users throughout the research lifecycle, from data creation to analysis to curation and publication. As a result, DesignSafe becomes more than simply a data publisher, but becomes a comprehensive research environment that is an integral part of research and discovery. The Workspace and Data Depot are critical parts of enabling this vision, and various metrics indicate significant activity by our users. In the Workspace, we see that almost 450 unique users have run a job through a Workspace App during the last year. Separately, we see an explosion of the use of Jupyter for data analysis, computation, and visualization, with over 1,300 unique users accessing our JupyterHub and over 35,000 Jupyter notebooks created. Within the Data Depot, over 1,100 projects have been created in which researchers are sharing, organizing, and curating data from across the coastal, earthquake, wind, and social science domains. Over 316 TB of data are currently stored within these projects and within the private “My Data” space, demonstrating that researchers are using the Data Depot as part of their day-to-day research.
Of course, the Data Depot also represents a traditional data repository, in which data are formally published and made publicly available. More than 34 TB of publicly accessible data is currently available within the 293 projects published in the Data Depot and these projects are authored by 411 unique researchers. From these projects, we see more than 40,000 downloads over the last year. Also available in the Data Depot are the 265 projects with 28 TB of associated data that were previously published during the 10-year NEES program. The large volume of data published in the Data Depot over a relatively short time period of 4 years is a testament to our strategy of facilitating and simplifying the data curation and publication process.
Finally, the impact of DesignSafe can be evaluated by identifying research papers that cite the use of DesignSafe or the data available at DesignSafe. Table 1 lists identified citations during 2018, 2019, and through October 2020 as determined from papers identified via Google Alerts. The first column represents papers that make any reference to DesignSafe through citation of the DesignSafe marker paper (Rathje et al., 2017) or through the acknowledgments. The next column represents papers in which a researcher cites their own data in DesignSafe as a part of the original research project, and the third column represents papers that re-use data available in DesignSafe after the original project is over. Note that a paper may contribute to multiple columns in Table 1. For instance, a data re-use paper may also reference the marker paper, or a paper may cite more than one dataset. There is a meaningful number of total citations that reference the use of DesignSafe and the data published in DesignSafe, and the rate of citations has increased noticeably in 2020. While Google Alerts may not capture all of the citations and mentions of DesignSafe datasets that are available in the literature, the positive trend highlights the value of publishing data, the importance of citing data in the references using DOIs, and the types of research being conducted using data published in DesignSafe.
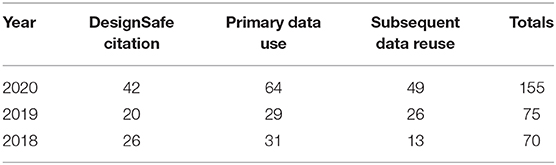
Table 1. Scholarly Citations of DesignSafe.
The future of natural hazards research requires integration of diverse data sets from a variety of sources, including experiments, computational simulation, and field research. The DesignSafe cyberinfrastructure provides the functionalities that will enable transformative research in natural hazards through the availability of datasets, computational resources, and cloud-based tools that allow for a fundamental change in the way that research is performed. In particular, we are now at the precipice of a new paradigm where the natural hazards community can embrace the publishing of datasets, scripts, and workflows, the use of high-performance computing, and the potential of artificial intelligence and machine learning techniques. In particular, Jupyter notebooks are being used within DesignSafe to provide improved access and integration of experimental and simulation data, the Reconnaissance Portal and HazMapper App are being used to improve field research activities and data sharing, and the use of the DesignSafe Slack team is facilitating a virtual community of researchers who can easily interface to improve their research. The DesignSafe cyberinfrastructure is available to the global natural hazard research community and account registration is free. We encourage researchers to join and explore the ways in which DesignSafe can be used in their research.
Publicly available datasets were analyzed in this study. These data can be found in the Data Depot data repository of the DesignSafe cyberinfrastructure (www.designsafe-ci.org), and are cited in the references section along with their DOIs.
The authors have all been involved in the design, development, and testing of the DesignSafe Cyberinfrastructure.
Frontiers Media SA remains neutral with regard to jurisdictional claims in published maps and institutional affiliations.
The authors declare that the research was conducted in the absence of any commercial or financial relationships that could be construed as a potential conflict of interest.
The National Science Foundation (NSF) financially supports the DesignSafe project under Grant Nos. CMMI-1520817 and CMMI-2022469. DesignSafe also leverages NSF Grant Nos. OAC-1663578 and OAC-1548562 for high performance computing, and Grant No. OAC-1931439 for the development of the TAPIS API. This support is gratefully acknowledged.
Arduino, P., Motley, M., Eberhard, M., Cox, D., Barbosa, A., and Lomonaco, P. (2018) “NHERI Debris Impact Experiments,” DesignSafe-CI, Dataset. doi: 10.17603/DS2T09V
Brandenberg, S. J., Goulet, C. A., Wang, P., Nweke, C. C., Davis, C. A., Hudson, M. B., et al. (2019). “GEER field reconnaissance,” in Ridgecrest, CA Earthquake Sequence, July 4 and 5, 2019, Designsafe-CI. doi: 10.17603/ds2-vpmv-5b34
Brandenberg, S. J., Stewart, J. P., Wang, P., Nweke, C. C., Hudson, K., Goulet, C. A., et al. (2020). Ground deformation data from GEER investigations of ridgecrest earthquake sequence. Seismol. Res. Lett. 91, 2024–2034. doi: 10.1785/0220190291
Bryant, K. M., and Akbar, M. (2016). An exploration of wind stress calculation techniques in hurricane storm surge modeling. J. Mar. Sci. Eng. 4:58. doi: 10.3390/jmse4030058
Ding, F., and Kareem, A. (2018). A multi-fidelity shape optimization via surrogate modeling for civil structures. J. Wind Eng. Ind. Aerodyn. 178, 49–56. doi: 10.1016/j.jweia.2018.04.022
Ding, F., and Kareem, A. (2020). Tall buildings with dynamic facade under winds. Engineering (2020). doi: 10.1016/j.eng.2020.07.020. [Epub ahead of print].
Ding, F., Kareem, A., and Wan, J. (2019). Aerodynamic tailoring of structures using computational fluid dynamics. Struct. Eng. Int. 29, 26–39. doi: 10.1080/10168664.2018.1522936
Edge, B., Ramirez, J., Peek, L., Bobet, A., Holmes, W., Robertson, I., and Smith, T. (2020) “Natural Hazards Engineering Research Infrastructure, 5-Year Science Plan, Multi-Hazard Research to Make a More Resilient World, 2nd Edn.” DesignSafe-CI. 10.17603/ds2-4s85-mc54
Ferziger, J. H., Peric, M., and Street, R. L. (2002). Computational Methods for Fluid Dynamics. Springer. doi: 10.1007/978-3-642-56026-2
Forrester, A., Sobester, A., and Keane, A. (2008). Engineering Design Via Surrogate Modelling: a Practical Guide. John Wiley & Sons. doi: 10.1002/9780470770801
Hacker, T. J., Eigenmann, R., and Rathje, E. (2013). Advancing earthquake engineering research through cyberinfrastructure. ASCE J. Struct. Eng. 139, 1099–1111. doi: 10.1061/(ASCE)ST.1943-541X.0000712
Kijewski-Correa, T., Alagusundaramoorthy, P., Alsieedi, M., Crawford, S., Gartner, M., Gutierrez Soto, M., et al. (2019) “StEER - hurricane Dorian: preliminary virtual reconnaissance report (PVRR),” DesignSafe-CI. doi: 10.17603/ds2-saf8-4d32
Kijewski-Correa, T., Roueche, D., Pinelli, J.-P., Prevatt, D., Zisis, I., Gurley, K., et al. (2018). “RAPID: a coordinated structural engineering response to Hurricane Irma (in Florida)”, DesignSafe-CI. doi: 10.17603/DS2TX0C
Marshall, J., Smith, D., Lyda, A., Roueche, D., Davis, B., Djima, W., et al. (2019) “StEER - Hurricane Dorian: Field Assessment Structural Team (FAST-1) Early Access Reconnaissance Report (EARR),” DesignSafe-CI. doi: 10.17603/ds2-4616-1e25
Mattis, S., Steffen, K. R., Butler, T., Dawson, C. N., and Estep, D. (2020). Learning quantities of interest from dynamical systems for data-consistent inversion. J. Comput. Phys. arXiv [Preprint]. arXiv:2009.06918.
Mosalam, K., Abuchar, V., Archbold, J., Arteta, C., Fischer, E., Gunay, S., et al. (2019) “StEER - M6.4 and M7.1 Ridgecrest, CA Earthquakes on July 4-5, 2019: Preliminary Virtual Reconnaissance Report (PVRR),” DesignSafe-CI. doi: 10.17603/ds2-xqfh-1631
Pinelli, J.-P., Roueche, D., Kijewski-Correa, T., Prevatt, D., Zisis, I., and Elawady, A. (2018) “Overview of damage observed in regional construction during the passage of hurricane irma over the state of Florida,” in ASCE Forensic Engineering Conference (Austin, TX). 10.1061/9780784482018.099.
Rathje, E., Dawson, C., Padgett, J. E., Pinelli, J.-P., Stanzione, D., Adair, A., et al. (2017) DesignSafe: a new cyberinfrastructure for natural hazards engineering. ASCE Nat. Hazards Rev. 18. doi: 10.1061/(ASCE)NH.1527-6996.0000246
Robertson, I., Prevatt, D., Roueche, D., Kijewski-Correa, T., and Mosalam, K. (2019) “StEER - 14 March 25 April, 2019 cyclones idai kenneth in mozambique: event briefing,” DesignSafe-CI. doi: 10.17603/ds2-ae92-6v90
Spatial Networks Inc. (2017). Fulcrum App for Android (Release Version 2.26). Retrieved from https://play.google.com/store/apps/details?id=com.spatialnetworks.fulcrum (accessed March 1, 2020).
Stewart, J. P., Brandenberg, S. J., Wang, P., Nweke, C. C., Hudson, K., and Mazzoni, S., et al. (2019) Preliminary Report on Engineering and Geological Effects of the July 2019 Ridgecrest Earthquake Sequence. Geotechnical Extreme Events Reconnaissance Association Report GEER-064. doi: 10.18118/G6H66K
Keywords: cyberinfrastructure, cloud-based tools, data analytics, data repository, natural hazards
Citation: Rathje EM, Dawson C, Padgett JE, Pinelli J-P, Stanzione D, Arduino P, Brandenberg SJ, Cockerill T, Esteva M, Haan FL Jr, Kareem A, Lowes L and Mosqueda G (2020) Enhancing Research in Natural Hazards Engineering Through the DesignSafe Cyberinfrastructure. Front. Built Environ. 6:547706. doi: 10.3389/fbuil.2020.547706
Received: 31 March 2020; Accepted: 25 November 2020;
Published: 21 December 2020.
Edited by:
Katrin Beyer, École Polytechnique Fédérale de Lausanne, SwitzerlandReviewed by:
Emanuele Brunesi, Fondazione Eucentre, ItalyCopyright © 2020 Rathje, Dawson, Padgett, Pinelli, Stanzione, Arduino, Brandenberg, Cockerill, Esteva, Haan, Kareem, Lowes and Mosqueda. This is an open-access article distributed under the terms of the Creative Commons Attribution License (CC BY). The use, distribution or reproduction in other forums is permitted, provided the original author(s) and the copyright owner(s) are credited and that the original publication in this journal is cited, in accordance with accepted academic practice. No use, distribution or reproduction is permitted which does not comply with these terms.
*Correspondence: Ellen M. Rathje, ZS5yYXRoamVAbWFpbC51dGV4YXMuZWR1
Disclaimer: All claims expressed in this article are solely those of the authors and do not necessarily represent those of their affiliated organizations, or those of the publisher, the editors and the reviewers. Any product that may be evaluated in this article or claim that may be made by its manufacturer is not guaranteed or endorsed by the publisher.
Research integrity at Frontiers
Learn more about the work of our research integrity team to safeguard the quality of each article we publish.