 Kimberlee A. Marcellus-Zamora
 Patricia M. Gallagher2
 Sabrina Spatari
- 1Construction Management Program, College of Architecture and the Built Environment, Thomas Jefferson University, Philadelphia, PA, United States
- 2Department of Civil, Architectural and Environmental Engineering, Drexel University, Philadelphia, PA, United States
- 3Faculty of Civil and Environmental Engineering, Technion – Israel Institute of Technology, Haifa, Israel
There is a significant amount of waste generated during construction and demolition (C&D) activities, but few data to understand the sources, age, spatial origin, and its fate following entry into the waste management system. With few public records that track C&D waste flows, we turned to industry and Leadership in Energy and Environmental Design (LEED) to quantify C&D data and meta-data using material flow analysis (MFA). LEED databases are not normally used to build life cycle inventories or material flow accounts because they do not house sufficiently detailed data. We propose using the geo-referenced data on reused C&D waste in LEED databases to source parameters needed to build MFA models that support a circular building materials economy. By quantifying the change in C&D waste flow over years 2007–2017 and the diversion of materials from landfills from buildings in the United States City of Philadelphia, we found that, on average, 81% of total incoming waste was diverted from landfill and recycled into secondary materials markets. From LEED spatial data, we found that 77% of buildings sampled diverted C&D waste activities and installed building materials with recycled content. Although these findings describe material reuse metrics from different system boundaries in the built environment that cannot be statistically validated, they provide complementary data to describe C&D recycling performance benchmarks and incentive for future data collection to study and track trends in building material reuse. This case study highlights observations of C&D recovery and reuse from two separate but related operations, which could suggest that policies that incentivize C&D material reuse could promote a circular flow of building materials.
Introduction
The built environment in the United States generates significant volumes of waste through construction and demolition (C&D) activities; as a result, municipal and regional waste processors are left with the task of managing the waste. Recycling and salvage practices are becoming more common (Horvath, 2004), and in the northeastern region of the United States, they have progressed over the last decade (Marcellus et al., 2012b) with the advent of technology that accepts comingled waste, not requiring site separation (NEWMOA, 2009, 2017) at construction sites or at centralized waste reclamation facilities (WRFs) to recover and reuse C&D waste materials. Up until the late 1990s, C&D waste recycling activities usually involved contractors conducting on-site separation of waste materials and sorting into separate dumpsters. More recently, constructors have begun systematically separating C&D waste into waste and comingled recycled materials dumpsters on-site. Where possible, equipment, such as grinding machines that can directly reuse C&D waste on site, are now employed to use recycled concrete for aggregates in place (Lockrey et al., 2018; Wu et al., 2019). Moreover, it has become common for waste haulers to transport the comingled C&D dumpsters to WRF for further sorting and processing. Modern WRFs take comingled C&D waste feeds onto conveyer belt lines and manually sort and separate the waste into materials that can be sold to specific industries (e.g., secondary ferrous and non-ferrous metal industries).
In the United States, C&D waste is not federally regulated. As such, there is limited up-to-date and publicly accessible data on waste quantity and composition. Furthermore, there is no standard practice for reporting C&D data. In their last known national report, the US Environmental Protection Agency (EPA) estimated that 170 million tons of C&D waste was generated in the United States in 2003 (United States Environmental Protection Agency US EPA, 2009). This aggregate figure accounts for all waste generated by C&D activities in the United States; few, if any, data exist at regional or municipal levels. Generally, the data that are reported tend not to follow a standardized protocol, which leads to inconsistent public datasets (Marcellus et al., 2012b; NEWMOA, 2017). Little information is shared with the public on the size and composition of C&D waste volumes, which makes it difficult to understand trends in C&D waste reuse over time. In order to better understand landfill diversion rates and waste material flows deposited in end-of-life (EOL) facilities such as C&D landfills or WRF, more precise reporting of waste material composition and quantity is needed. Because public data are scarce, approximation methods are necessary for determining C&D waste flow volumes. Additionally, the acquisition of C&D data and management practices through consultation with private industry is possibly the only way to derive reliable estimates of C&D waste recycling and reuse patterns. However, working with private industry to collect data presents challenges because their data tend to be proprietary, and they may not want to divulge precise material accounts. Despite this challenge, validating material flow analysis (MFA) estimates with support from industrial collaborators while preserving the confidentiality of their data can strengthen C&D waste accounting. The limitation is procuring a relationship with private industry; thus, public data such as the database of the Leadership in Energy and Environmental Design (LEED) can potentially fill the missing data gap. Our objective is to evaluate data generated from third-party activities through the LEED database and from a WRF and apply MFA to quantify C&D waste diversion in the Philadelphia region. The data acquired also define materials diverted from landfills and overall waste diversion rates in the Philadelphia region. Through accessing private and public sources of data and industrial ecology tools, waste diversion trends and recycled materials are identified.
Do Third Parties Influence C&D Best Management Practices?
Third-party non-profit organizations such as the US Green Building Council (USGBC) award credits for a variety of best management practices employed in C&D activities. The USGBC developed and supports a self-reporting rating system entitled “Leadership in Energy and Environmental Design” that assesses sustainability aspects of design and construction in several categories. The materials and resources category provides credits for waste management and material selection. The construction waste management (CWM) credit acknowledges waste diversion efforts by contractors who divert 50 or 75% of C&D waste from landfills during construction. The recycled content (RC) credit incentivizes effort to incorporate 10 or 20% recycled postconsumer and preconsumer (waste material from manufacturing processes) content in building materials in new construction projects. The USGBC maintains a database for all buildings that have gone through the certification process. The extent to which LEED has been effective (since its inception and over time) in changing patterns of C&D waste reuse may give insight into its broader benefits to managing and diverting waste from landfills.
Leadership in Energy and Environmental Design is an example of a voluntary program that encourages the building industry to recover C&D waste and reuse the recovered waste materials in new buildings because gaining LEED building certification is valued in the building industry. The concurrence of rising numbers of LEED buildings (Kahn and Vaughn, 2009; Wu and Low, 2010; Fuerst and McAllister, 2011) and improvements in materials recovery from WRF as observed in waste reuse trends (Cidell and Beata, 2009; Marcellus et al., 2012b; Lu et al., 2019) suggests that LEED could be stimulating material reuse in the construction sector. However, the paucity of measured or reported data on C&D waste recovery makes it difficult to track the effectiveness of LEED on C&D waste reuse.
Which Strategies Are Beneficial in Analyzing C&D Waste Activities?
Material flow analysis is an analytical tool for estimating materials produced and used in all sectors of the economy (Brunner and Rechberger, 2016). Through top-down and bottom-up material balance estimation techniques, MFA can be used to quantify annual waste flows in the economy where data are not normally measured, including in the C&D sectors. Material flow analysis was used to understand municipal waste management in different economies including in Pacific Islands (Eckelman and Chertow, 2009) and large Asian cities (Hu et al., 2010). It has been used along with life cycle assessment (LCA) in case studies that evaluated transportation energy and the metabolism of waste recycling (Chong and Hermreck, 2010). Material flow analysis has been combined with substance flow analysis (SFA) and used to analyze a wet sorting plant located in Austria (Schachermayer et al., 2000), to evaluate copper substance flows in C&D and other waste categories in Europe using bottom-up methods (Bertram et al., 2002), and to estimate losses of copper from in-use stocks (Bergbäck et al., 2001). It has been used to evaluate materials stocked in the built environment (Marcellus-Zamora et al., 2016), which may in the future help identify recyclable materials in future demolition activity.
In addition to MFA approximation methods, researchers who partner with local contractors have generated site-specific construction material datasets for undertaking LCA and MFA research. Haselbach and Bruner (2006) obtained field data for a building under construction to determine dumpster densities and C&D waste recycling in South Carolina. Bilec et al. (2010) used project data (drawings and schedule) for a typical office building as a data source for hybrid-LCA modeling of construction processes for buildings. Quale et al. (2012) obtained completed project data from three residential modular companies and surveyed local homebuilders to compare construction methods for modular versus conventional home building environmental impacts. Thus, prior research has effectively used MFA with primary data from industry to describe material waste flows intended for recycling and reuse. Our goal is to review and evaluate the use of MFA and spatial analysis methods in combination with public datasets from the USGBC and proprietary data from one local contractor based in Philadelphia to characterize recycled materials and waste diversion rates. This concept extends previous analysis conducted in waste flows and spatial analysis (Marcellus et al., 2012a, b).
The circular economy (CE) framework (Geissdoerfer et al., 2017) has gained traction among researchers and policymakers. Its intent is to replace the linear EOL concept (Foster, 2020) with materials recovery, reuse, and recycling loops (Kirchherr et al., 2017; Stephan and Athanassiadis, 2018). Policies to promote a CE are emerging in Europe (Talens Peiró et al., 2019), and moreover, the concept is gaining adoption in C&D waste analysis (Ghaffar et al., 2020). The CE framework has potential to advance sustainable construction through the promotion of practices that lend value to C&D waste.
Collaboration With Industry for the Collection of Waste Data
We partnered with an anonymous Philadelphia C&D WRF and used MFA to quantify C&D waste flows in the greater Philadelphia region; we determined waste fractions by material category and overall diversion rates. This WRF is one of only a few facilities that handle a portion of C&D waste that are being disposed in the Philadelphia region. Data were inventoried and analyzed from the WRF over the study period of 2007–2017. The annual data tracked all C&D waste materials entering and exiting the facility. The WRF maintains an inventory of self-audited data on the mass of incoming C&D waste and materials recovered from the waste, outputs of materials sold to new use markets (e.g., processors of secondary material), and materials sent to landfill.
The data gathered were direct measurements, recorded by the WRF. Material flows were constructed from data collected at WRF from anonymous contractors and haulers who deliver waste at the separation phase (Supplementary Figure S1). This Philadelphia WRF provides dumpster service over a 160-km radius. At the WRF, materials are received in trucks, and each load is weighed on an electronic scale, documented, and archived. The materials enter the facility by dump trucks and are visually assessed and presorted, and large waste fractions such as metal or rubble are divided and set aside on the tipping floor. The materials are then loaded by machine onto the conveyor belt and separated by hand into stacks of individual streams; the sorting system incorporates labor, automated equipment, and conveyor lines. The individual streams are stockpiled, baled if necessary, and transported to various recycle markets. The remaining waste materials that do not get diverted to secondary markets are transported to local landfills. In summary, waste enters the WRF in mixed debris loads, is sorted on site, and then leaves the facility in separated recycle streams.
The annual data that correspond with material inputs and outputs from the recycling activities were organized by material waste type, weight in tons, processed each year. For the waste audit, the data were combined into a cumulative dataset and organized by recycled material (R) type and total waste (W). We tracked the percentage of material fraction (MF) corresponding to each flow, which is the ratio of Ri to W, for i from 1 to n and the material diverted (MD) from the landfill, which is the summation of Ri to W, respectively.
The MF (%) accounts for individual material waste fractions, whereas MD (%) accounts for the overall diversion rate of total materials. The diversion rate is defined as waste flows that were not disposed in C&D landfills but diverted to secondary recycling facilities.
From the waste audit and using Equation 1, the major R and MF were calculated and ranked from highest to lowest (Table 1 and Figure 1a): Fines (27%), Wood (23%), Rubble (14%), Drywall (6%), and Metal (6%) (Figure 1a) and minor MFs returned that are less than 5% (wt.%).
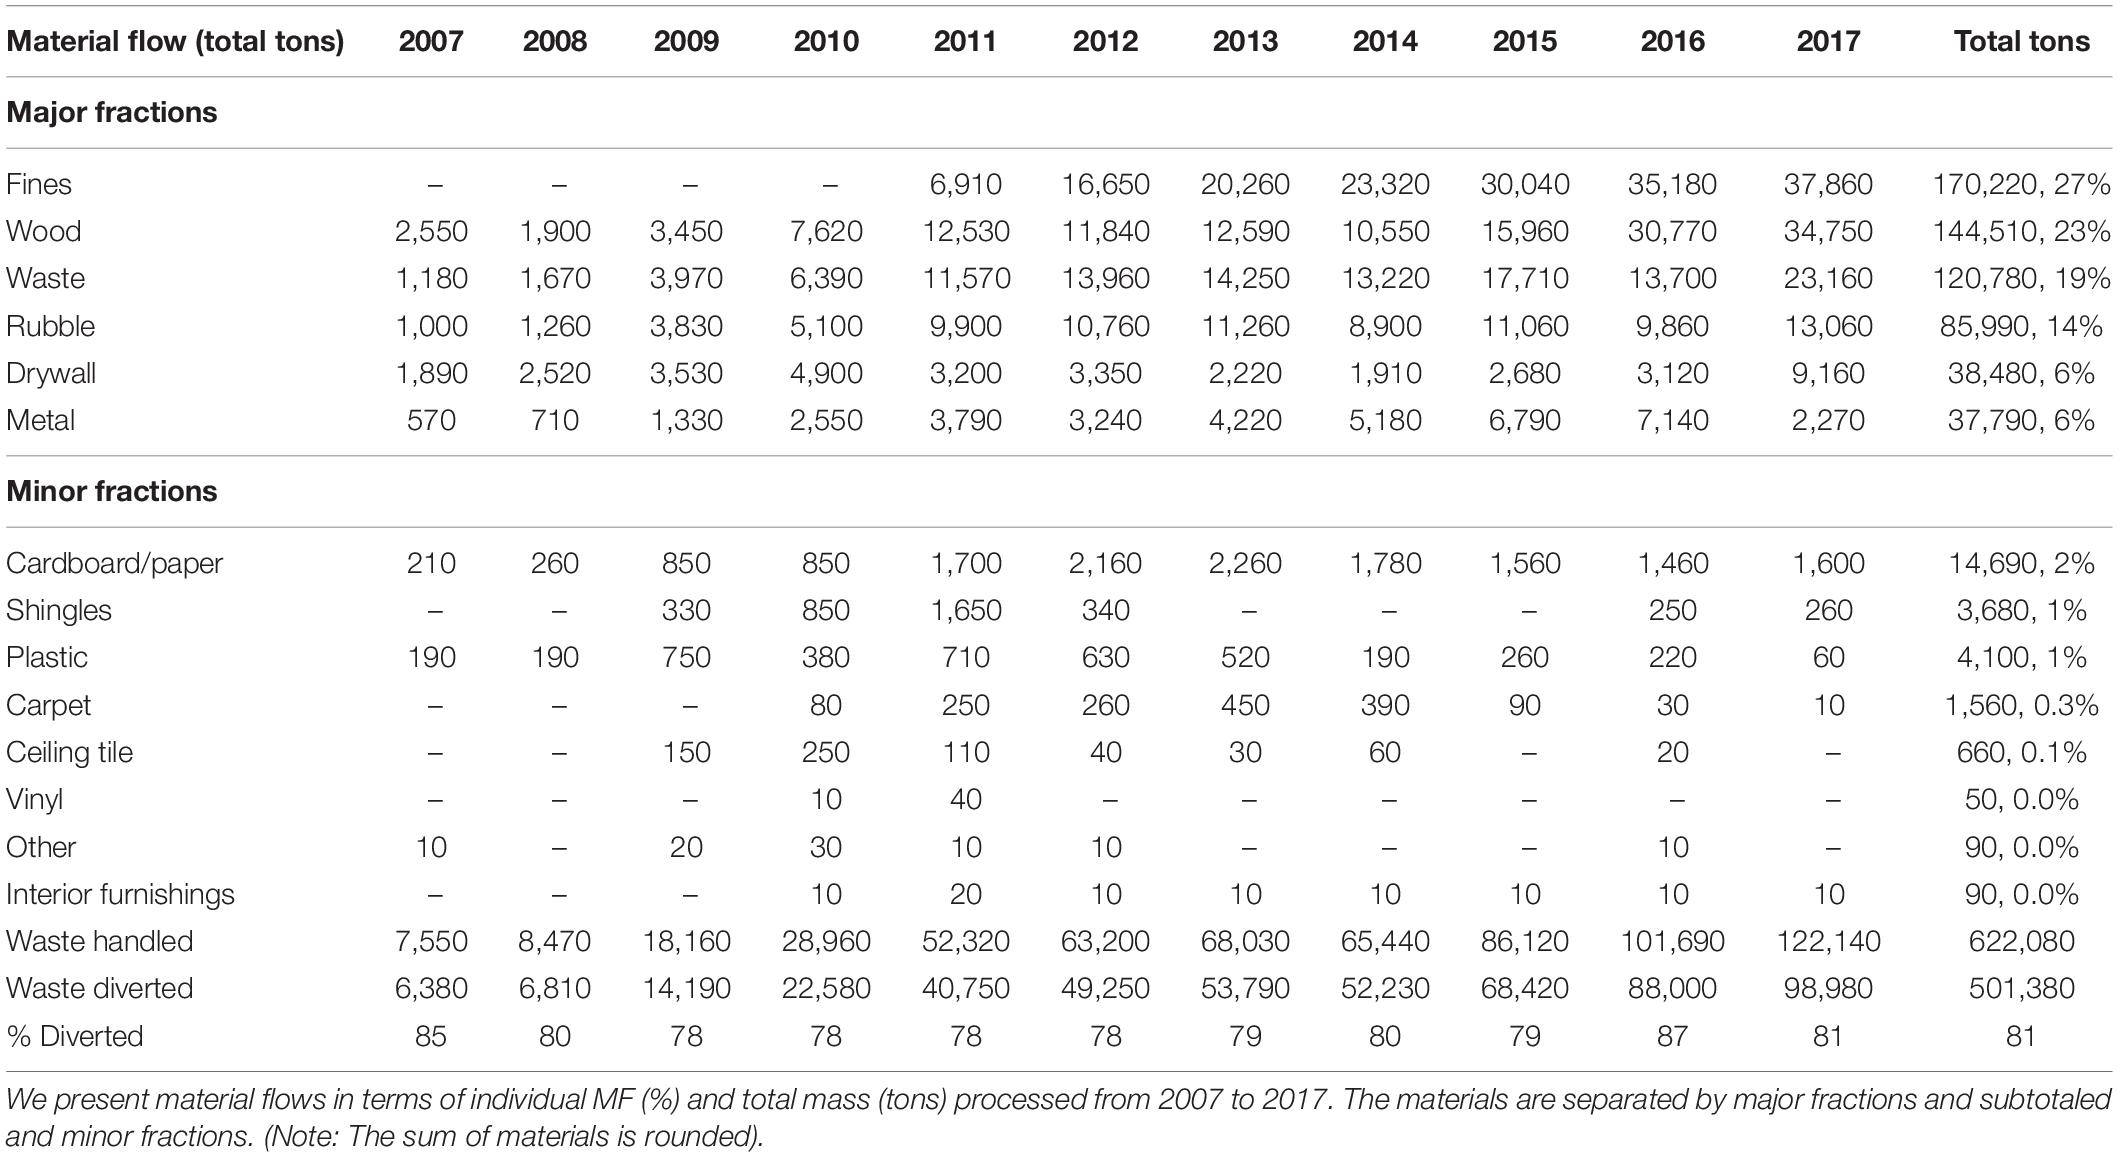
Table 1. Summary of self-reported materials leaving WRF.
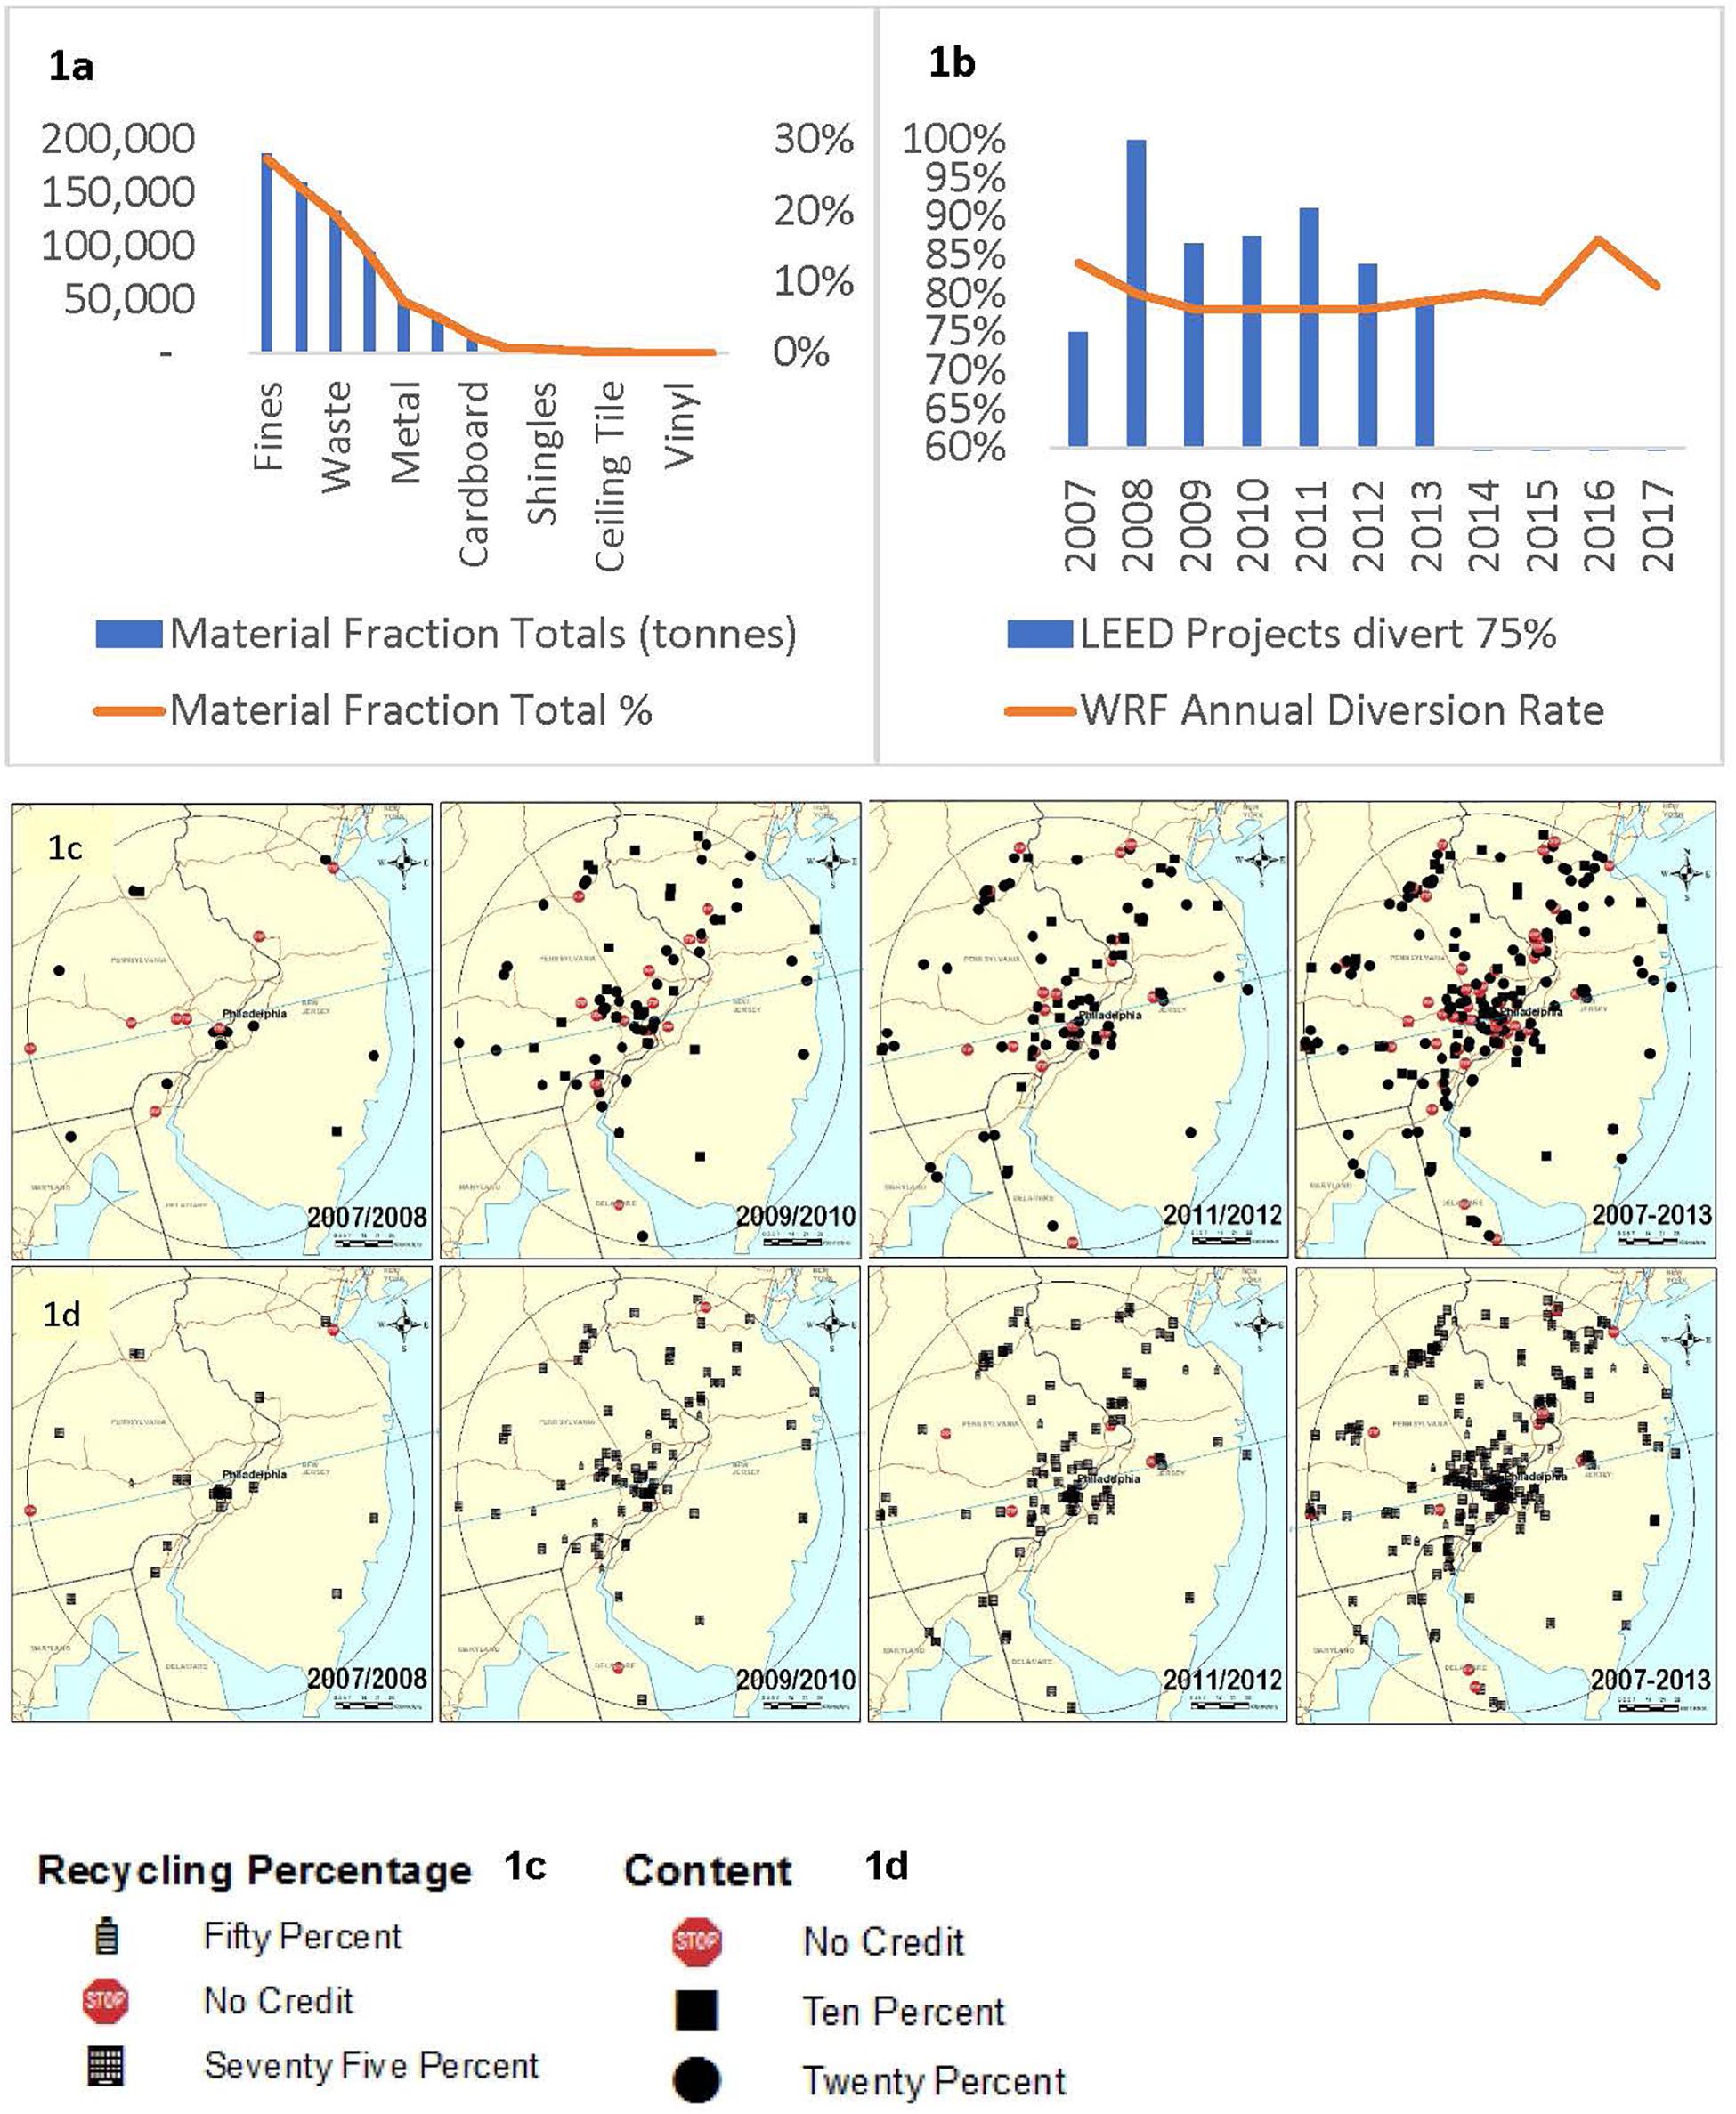
Figure 1. (a–d) Recycling activities in the system boundary are indicated in two ways, WRF total flow and individual fractions and spatial relationship in the Philadelphia region with LEED activities. Because the data are from two different sources, they are difficult to compare; however, both demonstrate growth in waste diversion over the same spatiotemporal scale. This figure describes the individual fractions reported in the WRF data, as well as the spatial relationship reported in the LEED data. (Note: See Supplementary Material for full-sized maps and graphs Supplementary Figures S2a–j, 3a,b).
From the waste audit applied to Eq. 2, the MD calculated for years 2007–2017 averaged 81%. While the mass of materials handled annually (Table 1) increased 16 times from 2007 (7,550 tons/year) to 2017 (122,140 tons/year), MD (Table 1) has remained nearly constant over this period despite more than tripling the materials processed daily between 2009 and 2017.
Combining Third-Party Data With Spatial Analysis Tools
The LEED building stock in the Philadelphia region was evaluated and separated by buildings that pursued credits during construction activities by diverting waste from landfills and installing new building materials with RC. The USGBC database of completed projects contains information about completed LEED project data for all registered and certified buildings from 2000 onward. Each building owner and project team is required to complete a LEED scorecard when submitting their building to the USGBC for final certification review and can opt to publish their data or keep it confidential. Only certified buildings with published scorecards in the database were considered.
Data from the USGBC completed projects database (United States Green Building Council (USGBC), 2013) were queried to isolate and extract project scorecards for certified buildings (Marcellus et al., 2012a). The base map layer of Pennsylvania, New Jersey, Maryland, and Delaware in ArcGIS was used to locate LEED-certified buildings that attained a CWM or RC credit within a 100-km radius of Philadelphia, PA. The major transportation corridors were represented to reference possible routes to developed areas. An individual map layer was created for each of the years and combined into one map file. From this map, we created spatial proximity (buffer) zones and summed the number of buildings to analyze and track development trends and waste flow patterns. Spatial proximity zones were created and identified with the spatial analyst tool in ArcGIS. A layer was created, centered with Philadelphia for various zones in 25- to 100-km steps. The trends in cumulative LEED buildings with the 50 and 75% CWM credit, and the 10 or 20% RC credits were mapped over 2-year time steps between 2007 and 2012 data from Marcellus et al. (2012a) in order to observe the growth of adoption of those credits by the building sector in parallel with observed changes in the management of C&D waste at the WRF.
Overview maps were generated including the following layers: LEED buildings, the city of Philadelphia, federal highway system, and state boundaries; these data were analyzed for their spatial proximity from Philadelphia. Of the 291 completed LEED-certified buildings from the USGBC database with published scorecards within the study area, 95% of buildings reported C&D waste diverted from landfills, and 78% reported that RC materials were installed. The credit for diverting 50 or 75% waste was awarded to 27 (9%) and 250 (86%) of certified buildings (Figure 1c). The credit for installing 10 or 20% RC was awarded to 68 (23%) and 159 (55%) of certified buildings (Figure 1d). The time-series maps also show the number of LEED buildings that reported 0% waste diversion (Figure 1c) and 0% RC (Figure 1d).
Can We Find Relationships From Different Data Sources?
We have identified alternative data sources that describe the diversion of materials from landfills with WRF private industry data (81% on average) and LEED third-party data (most times 75%) in Philadelphia, PA (Figure 1b). Although both estimates are calculated from measured data on quantities of C&D waste material leaving the building environment, they cannot be easily correlated statistically because they are sampled from different data pools, where WRF data account for a portion of wastes processed, and LEED data account for a different portion of waste processed (Figure 1d) recycled materials added to new building construction (Figure 1c). Instead, their value is highlighting a consistent upward trend in C&D waste diversion from landfill (Figure 1b).
Furthermore, the data reported from the WRF and LEED building stock are not complete. The LEED data are building level data, and the WRF data are aggregate data for any building undergoing construction in Philadelphia. In the LEED dataset if actual MD and MF were reported, we could compare the WRF to LEED data. Reporting building spatial data to the WRF at acceptance to the facility would aid relating both datasets. Although it is not possible to directly match the two figures because of incomplete data and large uncertainties tracking specific materials at every C&D activity, the time-series maps (Figures 1c,d) suggest a trend of increased recycling during construction activities in LEED buildings accumulated over time. In parallel, the Philadelphia sample of increasing C&D volume over time and high C&D waste diversion rates suggests that LEED certification may be incentivizing C&D waste recycling. Despite these obstacles, this regional snapshot of C&D waste recycling from two independent sources provides insight on the magnitude of waste diversion to be approximately 75%. The WRF is striving for an overall diversion rate of 75% so that they are in line with the LEED standards. The WRF data are very detailed and provide information for individual material recycling flows.
Discussion
We present data from two separate industries within the building and construction sector to characterize the flow of recoverable C&D waste, quantify aggregated C&D diversion, and evaluate recycling patterns for a portion of the C&D waste generated in Philadelphia. We are optimistic that third-party databases not commonly used can help generate material flow accounts to understand trends in C&D recovery in major cities. For example, Jun and Cheng (2017) used LEED data for project information and climatic factors utilizing GIS tools. Difficulties lie in aligning time scales, version changes in rating systems, and quantification metrics weight versus volume versus percentage of materials diverted. Based on the multiyear data from Philadelphia reviewed, incentives in the market, like LEED, have raised effort to recycle building materials in the construction sector. The difficulty in matching up various sources of data suggests a need for more research in more cities to determine trends. Researchers can access LEED data in other US cities to determine if their area is engaged in recycling activities as directed by local third-party verifiers. Similarly, data from local C&D waste recyclers can be compared to third-party LEED verified data on recycling to track and compare trends in total waste diverted and recycled materials recovery rates over time. Such a data-mining effort could help understand the role of green building rating systems in incentivizing a circular building materials economy. It could also reveal trends across cities adopting practices to recycled EOL building materials and divert waste to landfill.
Among MFA studies, models are commonly used with input data taken from existing literature rather than measured directly in the field. Select studies from literature that have combined LCA and MFA methods with industry data (Haselbach and Bruner, 2006; Bilec et al., 2010; Quale et al., 2012; Bovea and Powell, 2016; Bakchan and Faust, 2019; Lu et al., 2019) and LCA and LEED data (Aktas et al., 2017; Jun and Cheng, 2017; Meneghelli, 2018; Ingrao et al., 2019; Illankoon and Lu, 2020) have been more robust and reliable due to measurement in industry.
Overall, industrial ecology tools are most effective when combining publicly sourced data with industrial data. With a sample of industrial C&D data, we show the change in volume and composition from WRF over time. For future research, we recommend extending data collection effort by approaching reclamation centers, manufacturers, and contractors. A deep data-mining endeavor (e.g., see Bilal et al., 2016) in more cities with public records, including LEED, can help us understand where materials are going after C&D activities. Such efforts will enable better understanding material cycles in the built environment to achieve a more CE.
Data Availability Statement
All datasets generated for this study are included in the article/Supplementary Material.
Author Contributions
KM-Z conducted the waste audit and spatial analysis guided by the PG and SS. All authors contributed to the content and editing of the manuscript.
Funding
KM-Z was supported by Agriculture and Food Research Initiative Competitive Grant No. 2012-68005-19703 from the USDA National Institute of Food and Agriculture while conducting this research.
Conflict of Interest
The authors declare that the research was conducted in the absence of any commercial or financial relationships that could be construed as a potential conflict of interest.
Acknowledgments
We kindly thank the anonymous WRF for facility waste audit data and Drexel students Carolyn Comer and Gavriel Gefen for their work in consolidating spatial data and Aswathi John for assisting with graphics. We also thank the editor and reviewers for their insightful review and comments.
Supplementary Material
The Supplementary Material for this article can be found online at: https://www.frontiersin.org/articles/10.3389/fbuil.2020.00131/full#supplementary-material
References
Aktas, C. B., Bartholomew, P., and Church, S. (2017). Application of GIS to prioritize brownfield sites for green building construction based on LEED criteria. J. Urban Plan. Dev. 143:04017004. doi: 10.1061/(asce)up.1943-5444.0000387
Bakchan, A., and Faust, K. M. (2019). Construction waste generation estimates of institutional building projects: leveraging waste hauling tickets. Waste Manag. 87, 301–312. doi: 10.1016/j.wasman.2019.02.024
Bergbäck, B., Johansson, K., and Mohlander, U. (2001). Urban metal flows–a case study of Stockholm. review and conclusions. Water Air Soil Pollut. Focus 1, 3–24.
Bertram, M., Graedel, T. E., Rechberger, H., and Spatari, S. (2002). The contemporary European copper cycle: waste management subsystem. Ecol. Econom. 42, 43–57. doi: 10.1016/S0921-8009(02)00100-3
Bilal, M., Oyedele, L. O., Akinade, O. O., Ajayi, S. O., Alaka, H. A., Owolabi, H. A., et al. (2016). Big data architecture for construction waste analytics (CWA): a conceptual framework. J. Build. Eng. 6, 144–156. doi: 10.1016/j.jobe.2016.03.002
Bilec, M. M., Ries, R. J., and Matthews, H. S. (2010). Life-cycle assessment modeling of construction processes for buildings. J. Infrastruct. Syst. 16, 199–205. doi: 10.1061/(asce)is.1943-555x.0000022
Bovea, M. D., and Powell, J. C. (2016). Developments in life cycle assessment applied to evaluate the environmental performance of construction and demolition wastes. Waste Manag. 50, 151–172. doi: 10.1016/j.wasman.2016.01.036
Brunner, P. H., and Rechberger, H. (2016). Practical Handbook of Material Flow Analysis: for Environmental, Resource, and Waste Engineers. Boca Raton, FLA: CRC press.
Chong, W. K., and Hermreck, C. (2010). Understanding transportation energy and technical metabolism of construction waste recycling. Resour. Conserv. Recycl. 54, 579–590. doi: 10.1016/j.resconrec.2009.10.015
Cidell, J., and Beata, A. (2009). Spatial variation among green building certification categories: does place matter? Landsc. Urban Plan. 91, 142–151. doi: 10.1016/j.landurbplan.2008.12.001
Eckelman, M. J., and Chertow, M. R. (2009). Using material flow analysis to illuminate long-term waste management solutions in Oahu. Hawaii. J. Ind. Ecol. 13, 758–774. doi: 10.1111/j.1530-9290.2009.00159.x
Foster, G. (2020). Circular economy strategies for adaptive reuse of cultural heritage buildings to reduce environmental impacts. Resour. Conserv. Recycl. 152:104507. doi: 10.1016/j.resconrec.2019.104507
Fuerst, F., and McAllister, P. (2011). Green noise or green value? Measuring the effects of environmental certification on office values. Real Estate Econ. 39, 45–69. doi: 10.1111/j.1540-6229.2010.00286.x
Geissdoerfer, M., Savaget, P., Bocken, N. M., and Hultink, E. J. (2017). The circular economy–a new sustainability paradigm? J. Clean. Prod. 143, 757–768. doi: 10.1016/j.jclepro.2016.12.048
Ghaffar, S. H., Burman, M., and Braimah, N. (2020). Pathways to circular construction: an integrated management of construction and demolition waste for resource recovery. J. Clean. Prod. 244:118710. doi: 10.1016/j.jclepro.2019.118710
Haselbach, L. M., and Bruner, S. U. (2006). Determining construction debris recycling dumpster densities. J. Green Build. 1, 139–147. doi: 10.3992/jgb.1.3.139
Horvath, A. (2004). Construction materials and the environment. Ann. Rev. Environ. Resour. 29, 181–204. doi: 10.1146/annurev.energy.29.062403.102215
Hu, M., Van Der Voet, E., and Huppes, G. (2010). Dynamic material flow analysis for strategic construction and demolition waste management in Beijing. J. Indust. Ecol. 14, 440–456. doi: 10.1111/j.1530-9290.2010.00245.x
Illankoon, I. M. C. S., and Lu, W. (2020). Cost implications of obtaining construction waste management-related credits in green building. Waste Manag. 102, 722–731. doi: 10.1016/j.wasman.2019.11.024
Ingrao, C., Arcidiacono, C., Bezama, A., Ioppolo, G., Winans, K., Koutinas, A., et al. (2019). Sustainability issues of by-product and waste management systems, to produce building material commodities: a comprehensive review of findings from a virtual special issue. Resour. Conserv. Recycl. 146, 358–365. doi: 10.1016/j.resconrec.2019.04.001
Jun, M. A., and Cheng, J. C. P. (2017). Selection of target LEED credits based on project information and climatic factors using data mining techniques. Adv. Eng. Inform. 32, 224–236. doi: 10.1016/j.aei.2017.03.004
Kahn, M. E., and Vaughn, R. K. (2009). Green market geography: the spatial clustering of hybrid vehicles and leed registered buildings. BE J. Econ. Anal. Pol. 9, 1–24.
Kirchherr, J., Reike, D., and Hekkert, M. (2017). Conceptualizing the circular economy: an analysis of 114 definitions. Resour. Conserv. Recycl. 127, 221–232. doi: 10.1016/j.resconrec.2017.09.005
Lockrey, S., Verghese, K., Crossin, E., and Nguyen, H. (2018). Concrete recycling life cycle flows and performance from construction and demolition waste in Hanoi. J. Clean. Prod. 179, 593–604. doi: 10.1016/j.jclepro.2017.12.271
Lu, W., Chi, B., Bao, Z., and Zetkulic, A. (2019). Evaluating the effects of green building on construction waste management: a comparative study of three green building rating systems. Build. Environ. 155, 247–256. doi: 10.1016/j.buildenv.2019.03.050
Marcellus, K. A., Sabrina, S., and Gallagher, P. M. (2012a). “Utilizing GIS as a geospatial tool to inventory LEED certified buildings and construction and demolition (C&D) waste flows in the United States,” in IALCCE 12 - Life Cycle Civil Engineering, ed. A. S. D. F. K. Bergmeister (Boca Raton, Fla: CRC Press), 516.
Marcellus, K. A., Spatari, S., and Gallagher, P. M. (2012b). “Construction waste management decision making process: identification, framework and detailed urban c&d waste profile analysis,” in proceedings of the IEEE ISSST - International Symposium on Sustainable Systems and Technology (Boston, MA: IEEE).
Marcellus-Zamora, K. A., Gallagher, P. M., Spatari, S., and Tanikawa, H. (2016). Estimating materials stocked by land-use type in historic urban buildings using spatio-temporal analytical tools. J. Indust. Ecol. 20, 1025–1037. doi: 10.1111/jiec.12327
Meneghelli, A. (2018). Whole-building embodied carbon of a North American LEED-certified library: sensitivity analysis of the environmental impact of buildings materials. Build. Environ. 134, 230–241. doi: 10.1016/j.buildenv.2018.02.044
NEWMOA (2009). Construction & Demolition (C&D) Waste Management in the Northeast in 2006. Boston, MA: NEWMOA
NEWMOA (2017). Construction & Demolition (C&D) Materials Management in the Northeast in 2013. Boston, MA: NEWMOA
Quale, J., Eckelman, M. J., Williams, K. W., Sloditskie, G., and Zimmerman, J. B. (2012). Construction matters. J. Indust. Ecol. 16, 243–253. doi: 10.1111/j.1530-9290.2011.00424.x
Schachermayer, E., Lahner, T., and Brunner, P. H. (2000). Assessment of two different separation techniques for building wastes. Waste Manag. Res. 18, 16–24. doi: 10.1034/j.1399-3070.2000.00093.x
Stephan, A., and Athanassiadis, A. (2018). Towards a more circular construction sector: estimating and spatialising current and future non-structural material replacement flows to maintain urban building stocks. Resour. Conserv. Recycl. 129, 248–262. doi: 10.1016/j.resconrec.2017.09.022
Talens Peiró, L., Polverini, D., Ardente, F., and Mathieux, F. (2019). Advances towards circular economy policies in the EU: the new Ecodesign regulation of enterprise servers. Resour. Conserv. Recycl. 154:104426. doi: 10.1016/j.resconrec.2019.104426
United States Environmental Protection Agency US EPA (2009). Estimating 2003. Building-Related. Construction and Demolition Material Amounts. Washington DC: EPA.
United States Green Building Council (USGBC) (2013). Project Directory. Available online at: http://www.usgbc.org/projects
Wu, H., Zuo, J., Zillante, G., Wang, J., and Yuan, H. (2019). Status quo and future directions of construction and demolition waste research: a critical review. J. Clean. Prod. 240:118163. doi: 10.1016/j.jclepro.2019.118163
Keywords: C&D waste (cdw), material flow analysis (MFA), data mining, LEED (Leadership in Energy and Environmental Design), circular ecomomy
Citation: Marcellus-Zamora KA, Gallagher PM and Spatari S (2020) Can Public Construction and Demolition Data Describe Trends in Building Material Recycling? Observations From Philadelphia. Front. Built Environ. 6:131. doi: 10.3389/fbuil.2020.00131
Received: 16 December 2019; Accepted: 17 July 2020;
Published: 25 August 2020.
Edited by:
Izuru Takewaki, Kyoto University, JapanReviewed by:
George Wardeh, Université de Cergy-Pontoise, FranceSteven R. Padget, University of Kansas, United States
Copyright © 2020 Marcellus-Zamora, Gallagher and Spatari. This is an open-access article distributed under the terms of the Creative Commons Attribution License (CC BY). The use, distribution or reproduction in other forums is permitted, provided the original author(s) and the copyright owner(s) are credited and that the original publication in this journal is cited, in accordance with accepted academic practice. No use, distribution or reproduction is permitted which does not comply with these terms.
*Correspondence: Kimberlee A. Marcellus-Zamora, a2ltYmVybGVlLnphbW9yYUBqZWZmZXJzb24uZWR1