 Gian Piero Malfense Fierro
 Michele Meo
- Department of Mechanical Engineering, Materials Research, University of Bath, Bath, United Kingdom
Recently, there has been high interest in the capabilities of non-linear ultrasound techniques for damage/defect detection as these techniques have been shown to be more sensitive than linear ultrasound techniques for certain types of damage. This paper presents a non-linear ultrasound phased array modulation method based on the principles of frequency and amplitude modulation, for the detection and imaging of material defects/damage. The proposed method requires the use of standard ultrasound phased array systems, which use multiple transmitting and receiving elements. An adjusted dual frequency method and tri-frequency is employed, which focuses on the evaluation of harmonic sidebands. A pump signal at a frequency of f2 is used to initialize a “breathing/ringing” crack scenario after which a second frequency at f1 is used to further excite the crack and improve the probability that harmonic sidebands are generated. The modulation method employs a subtraction method which is used to filter out the fundamental frequencies. The technique adds benefits in ensuring that equipment based non-linearities produced by single frequency setups are eliminated, ensuring that only defect related non-linearities are present. A closed fatigue crack was evaluated using multiple linear and non-linear ultrasound phased array techniques with the suggested method showing clear benefits. Furthermore, it is shown that modulation techniques with more than two driving frequencies could further improve damage detection capabilities of phased array systems.
Introduction
Non-destructive testing and evaluation (NDT/E) has been an area of continued growth and the development of reliable and effective techniques to detect the occurrence of critical failure modes in materials has been pursued, due to the ever increasing use of these materials in numerous engineering disciplines (Tan et al., 1995; Bar-Cohen, 1999; Lemistre et al., 1999; Chen, 2007; Meo et al., 2008). The reliability of traditional NDT/E methodologies depend on the sensitivity of the technique and the capabilities and experience of the inspectors or technicians. One of the most promising and well-developed fields of NDT/E is ultrasonic testing methods which have been found to provide high levels of suitability and effectiveness in damage/defect evaluation. Ultrasonic testing has become very popular due to its capability, flexibility, and relative cost-effectiveness.
Traditional ultrasonic techniques generally rely on measuring some particular parameter in order to determine the elastic properties of the material or detect defects, such as; velocity of sound in the medium, attenuation, transmission, and reflection coefficients. One of the main reasons for focusing on non-linear ultrasound techniques is that linear techniques are not sufficiently sensitive to the microscopic damage in materials.
A non-linear phased array dual frequency modulation method for the early detection of a propagating fatigue crack was proposed by the authors (Fierro and Meo, 2019), this work builds on this earlier work by introducing a tri-frequency modulation method and the implementation of a non-linear modulation parameter. The method focuses on using ultrasonic phased array techniques; which arguably lead the field in terms of damage detection capabilities. Conventional linear ultrasonic (LU) techniques such as C-scan and linear array scanning are quite advanced and mature, and are frequently used in industry to monitor metallic and composite components. Phased array systems generally use three methods for damage assessment and imaging, such as the plane/focus swept method, full matrix capture (FMC), and total focusing method (TFM) a post-process technique (Chiao and Thomas, 1994; Oralkan et al., 2002). Ohara et al. and Park et al. have extensively developed, evaluated and improved the detection of open and closed cracks in metallic structures using a subharmonic phased array (Ohara et al., 2007; Park et al., 2016), while Potter et al. has developed a non-linear array based on diffuse field methodology (Potter et al., 2014). Haupert et al. subtracted linear response between images using an amplitude modulation technique, resulting in non-linear imaging of a defect (Haupert et al., 2017). Alston et al. evaluated kissing bonds using a modulated subtraction method utilizing three transducer/sensor layout, two to excite the structure and one array to receive (Alston et al., 2018). Furthermore, Cheng et al. showed that suppression of linear features using a coherent non-linear parallel-sequential field subtraction technique could be used early detection of fatigue damage (Cheng et al., 2018).
In order to generate non-linearities at stiff damage regions (i.e., small cracks), large amplitudes and long signals (in time) are generally required, this is not possible with standard phased array equipment due to physical limitations of the equipment. In this work, a modulated (i.e., dual frequency and tri frequency) method is proposed based on frequency and amplitude modulation which incorporates a tailored delay law routine. A system is excited by two (f1, f2) and three (f1, f2, f3) frequencies independently and then with various combinations (dual—f12 and f21, tri—f123, f312, and f231) of the input frequencies, the subtraction of these images (B-Scans) relates to the non-linear harmonic sidebands produced by damage/defects. The main novelty of this work is the coupling of a non-linear ultrasonic phased array tri modulation subtraction method with a frequency sequence used to excite a cracked region. This is done by using a pump signal at a frequency of f1 (f1 and f3, in tri-modulation scenario) was used to initialize a “breathing” crack (opening and closing) scenario after which a second frequency at f2 is used to further excite the crack and improve the probability that harmonic sidebands are generated. This is important, as small stiff cracks require large amounts of energy in order to generate non-linearities which come from “clapping” or “rubbing” of the discontinuities of the crack interfaces (i.e., breathing). One of the issues (and benefits) with phased array setups is depth resolution, which require short time domain signals and thus low (relative) energy pulses. This is contrary to long high energy excitation signals generally required to generate sufficient non-linearities, which suffer from low signal to noise ratios.
Ultrasonic guided waves inspection methods, based on the analysis of material non-linear elastic effects, have been developed for the detection and localization of structural defects such as micro-cracks (fatigue), delaminations, weak adhesive bonds, etc. In particular, Fierro and Meo (2015) outlines a modulated non-linear elastic wave spectroscopy method for the evaluation of the fatigue of metallic components for fatigue crack evaluation. This prior work derived two modulated non-linear parameters (βS—sum frequency and βD—difference frequency) which is used as the basis for this work (described in detail in the next section):
where: AS is the amplitude of the of the sum frequency at f2 + f1, AD is the amplitude of the of the difference frequency at f2– f1, Af1 is the amplitude of the of the difference frequency at f1, Af2 is the amplitude of the of the difference frequency at f2, kf1 is the wavenumber of f1, kf2 is the wavenumber of f2, and x is the propagation distance.
In this work a frequency and amplitude modulation technique is proposed that utilizes two or more frequencies along with a delay law routine designed to enhance the production of non-linearities. The delay law routine significantly improves the generation of non-linearities in the tested medium while also allowing for longer signals to be transmitted. Both the frequency and amplitude modulation techniques are combined to improve the SNR of captured non-linear responses. Additionally, equipment based non-linearities (present in single frequency systems) are reduced under the modulation methodology, thus overcoming some of the physical limitations of current phased array systems when assessing non-linearities. One of the other benefits of the suggested technique is that it only requires a single multi-element transducer, whereas previous works outline methods that require 2–3 multi-element transducers/sensors for damage evaluation. Three aluminum fatigue samples were evaluated using the proposed technique; undamaged (UD), small fatigue crack (SFC), and large fatigue crack (LFC). The ability of the method over linear methods is clearly demonstrated, by the detection of damage regions and enhanced contrast at these regions.
Theory and Background
Frequency and Amplitude Modulation
This work proposes a pump methodology based on both frequency and amplitude modulation to improve the potential of non-linear phased array imaging techniques; while addressing issues of attenuation, energy, and low signal to noise levels. The dual frequency method proposed by Fierro and Meo (2019) where the B-Scan of two frequencies at f1 and f2 are used to evaluate the non-linear responses of the structure is expanded by introducing a non-linear modulation parameter and tri-frequency excitation. Fierro and Meo presented a dual frequency modulation technique which used four B-Scan images to determine the modulated response MR2 (refer to Equation 3). This was done by capturing two B-Scan images at two different frequencies, f1 and f2 (refer to Figure 1). Then subsequently two further images were captured by switching the transmitted frequency per phased array element, with the first image (f12) firing f1 on all odd elements (1, 3, 5…) and f2 on all even elements (2, 4, 6.), and the reverse being done for f21. Once these four images were captured a final non-linear image was generated by using a subtraction method highlighted in Figure 1 and Equation 3. The method is summarized in Table 1.
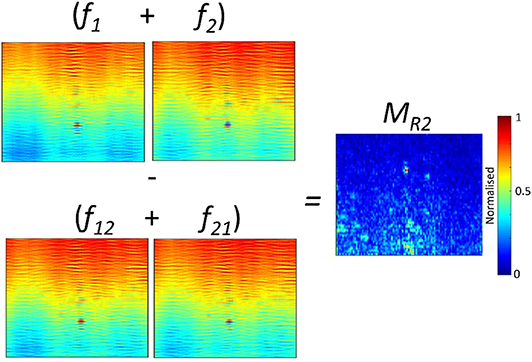
Figure 1. Summary of dual frequency modulation calculation for MR2.
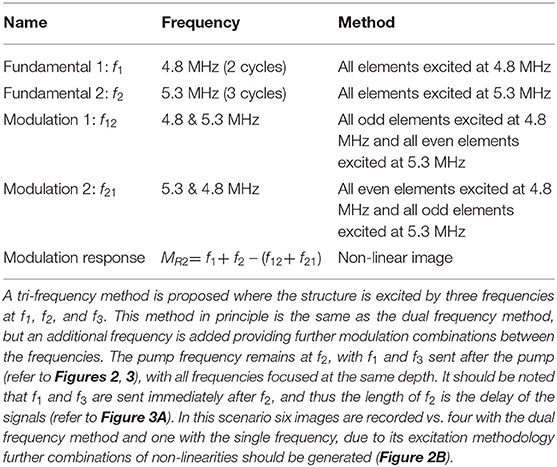
Table 1. Dual frequency modulation technique.
A standard broadband 128 element (2.5 MHz−7 MHz—Diagnostic Sonar Probe and System) phased array probe (element pitch = 0.5257 mm and width = 0.5 mm) utilizing a stepped-linear (sequential) firing approach over 32 elements was used for these experiments.
Figure 3 shows the actual delay laws tested for the pump frequency excitation methodology for the tri modulation method. Where: Figures 3A,C refers to the delayed single frequency signal at f1 and f3 (identical delay laws), Figure 3B refers to the pump single frequency signal at f2 and Figures 3D–F refer to the dual modulation signals f123, f231, and f312, respectively. All signals were focused at a depth of 40 mm (just above the machined notch in the tested aluminum samples) with f1 and f3 delayed by 540 ns for each element relative to f2 (please refer to Figure 3). Please note, that the Diagnostic Sonar system was programmed to complete the 6 detailed delay laws sequentially and compile them into a single B-Scan image. With the first six columns relating to beam 1 of f1, f2, f3, f123, f231, and f312, respectively, with beam 2 relating to columns 7–12, and so forth. This data was then post-processed to generate the final B-Scan images. Compiling and processing this data real-time onboard the system is not a large step forward as many systems today already incorporate pulse inversion techniques (requires two B-Scan images with signals of phase 0 and 180°) into the software packages. Figures 3G–L shows the six raw B-Scan images received using the delay laws highlighted in Figures 3A–F for the tri frequency and amplitude modulation method. The images are focused at a depth between 20 and 42 mm and show the notch location (depth-42 mm, width-22), but do not show the presence of a crack.
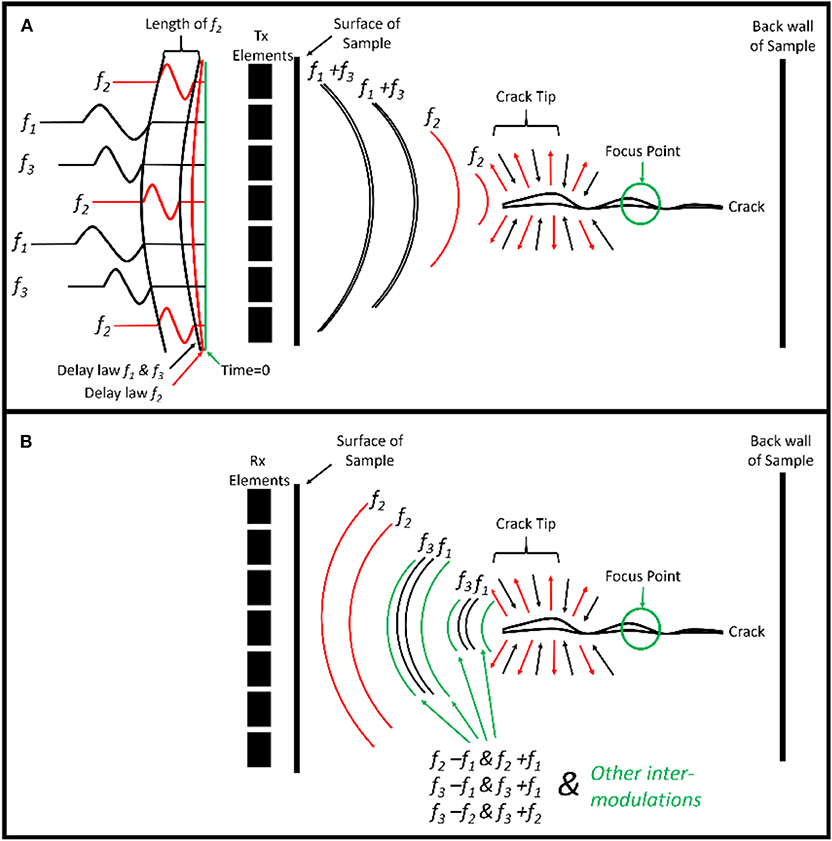
Figure 2. Example of delay laws, excitation signals and wave propagation for: (A) transmitted (Tx) and (B) received signals (Rx), for a tri frequency excitation through the thickness of a damaged sample.
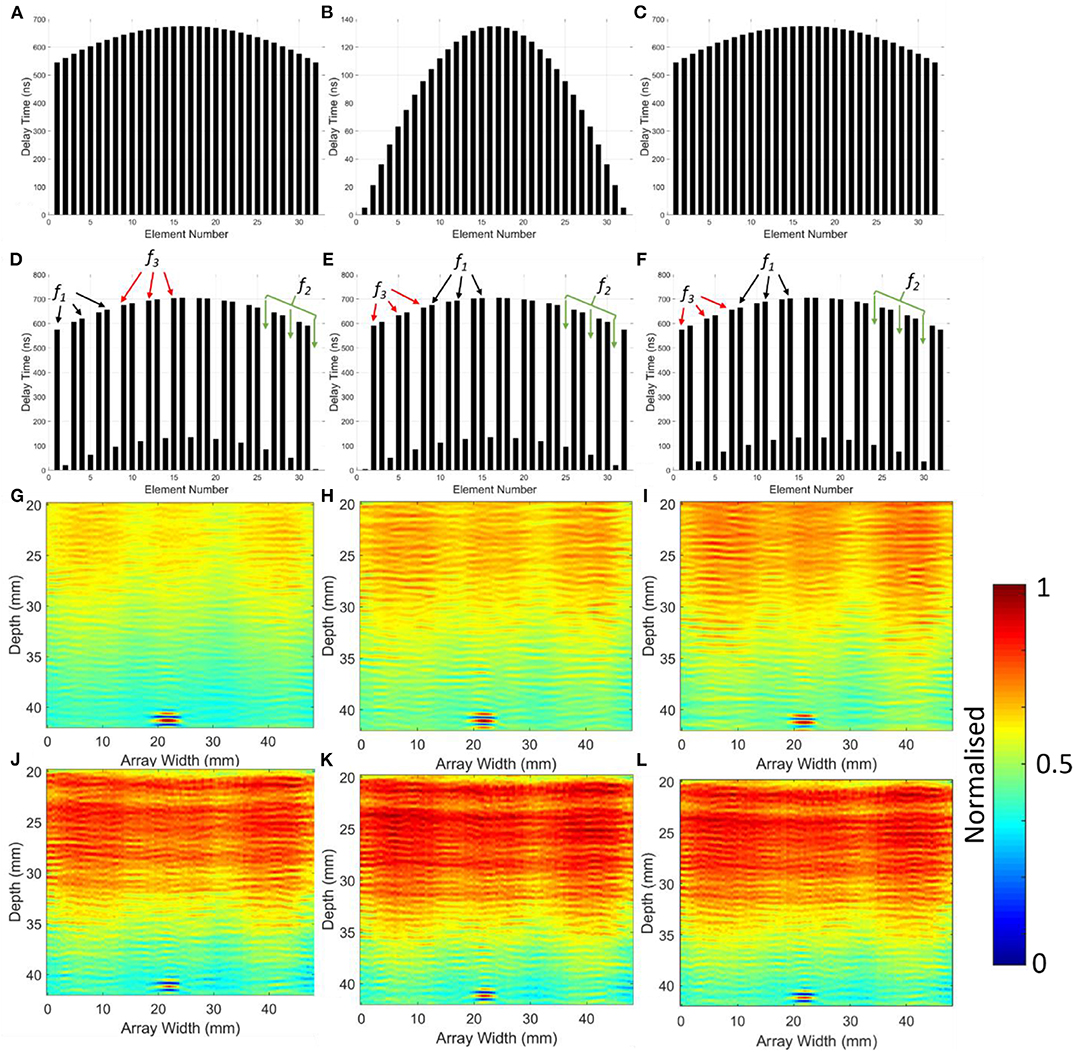
Figure 3. Delay laws for tri frequency modulation for 32 elements using a stepped/sequential firing method: (A) f1; (B) f2; (C) f3; (D) f123; (E) f231; (F) f312, and raw B-Scan images for: (G) f1; (H) f2; (I) f3; (J) f123; (K) f231; (L) f312.
Equation 4 and Figure 4 shows the subtraction process used to determine the image of the tri frequency modulated non-linear response (MR3—refer to Equation 4). In the same respect as the dual frequency method, it is known that f1, f2, and f3 do not contain any modulated non-linear content, whereas f123, f231, and f312 contain modulated non-linear content that is related to various combinations between the frequencies used to excite the structure. In particular, sum (f3 + f1, f2 + f1, and f3 + f2) frequencies and different (f3– f1, f2– f1, and f3– f2) frequencies, but due to complex interactions between frequencies it is expected that further intermodulation's between these frequencies may occur. As further frequencies and total energy of the system increases (six B-Scans vs. four B-Scans) it is expected that amplification of the non-linearities produced by defects/damage will occur. Considering, the data implications for the suggested approach, the data captured is 6× that of a single frequency scan and 1.5× that of the dual frequency modulation method, which corresponds to an increase in the time to complete the scan.
Table 2 summarizes the testing strategy of the tri frequency system and highlights the seven steps of the subtraction process. In the tri modulation tests three different frequency test scenarios were evaluated (1) f1= 3.8 MHz, f2= 4 MHz, f3= 4.2 MHz, (2) f1= 4.8 MHz, f2= 5 MHz, f3= 5.2 MHz, and (3) f1= 5.8 MHz, f2= 6 MHz, f3= 6.2 MHz. This was done in order to evaluate the effect of frequency (resonance of the damage) and attenuation of the signal through the thickness of the sample. Note that the purpose of this paper is not to draw definitive conclusions on frequency selection or the attenuation of the signal, but rather to highlight that these are important factors to take into account when evaluating non-linear techniques, this is something to be focused on in future work. In this case the central frequencies (f2= 4, 5, and 6 MHz) were chosen as they are all close to the central frequency of the probe (5 MHz), with f1and f3chosen at f2± 0.2 MHz. In the scenario of unknown defect resonance, energy into the sample is maximized in order to promote the generation of non-linearities, hence f1and f3are near f2. The importance of the work is to highlight improved detection capabilities of the outlined modulation method, as well as the improved signal to noise levels that can be achieved by increasing the number of modulating frequencies.
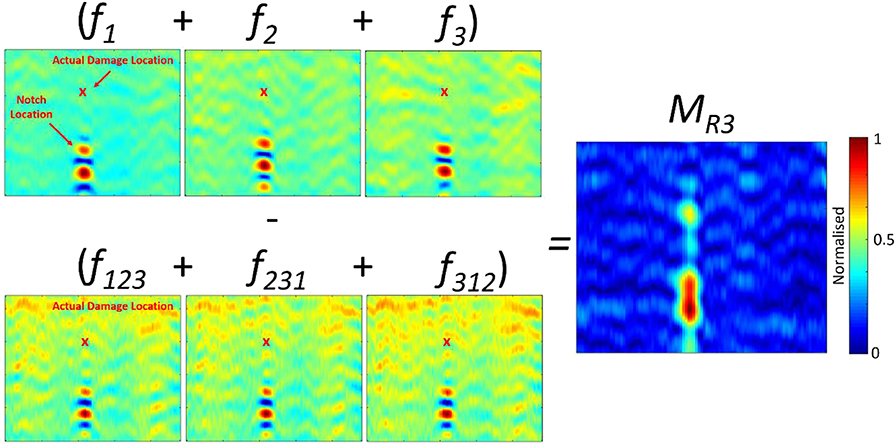
Figure 4. Summary of tri frequency modulation calculation for MR3.
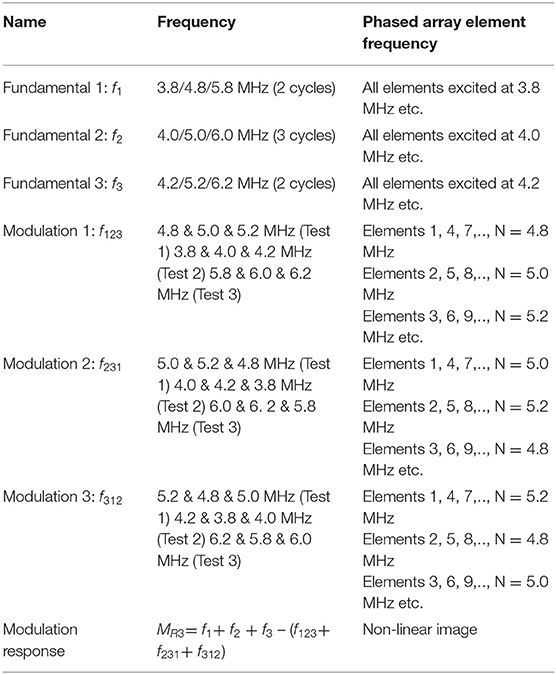
Table 2. Tri frequency modulation technique.
Non-linear Ultrasound
Non-linear elastic wave spectroscopy (NEWS) techniques have been shown to be innovative ultrasonic NDE and SHM inspection methods. Some of these methods center on the theory of “clapping/rubbing mechanism” (such as defects and damages), which generate non-linear elastic effects which can be evaluated using the frequency response of a time domain signal (Ciampa and Meo, 2012). Compared to linear ultrasound methods, these techniques have shown higher sensitivity in diagnosing material micro-defects such as porosity, inclusions, and early stage damage in the form of micro-cracks, delaminations and adhesive bond weakening (Cantrell and Yost, 2001; Cantrell, 2004; Boccardi et al., 2015; Fierro et al., 2016).
These non-linear elastic effects give rise to further harmonic responses known as the second, third and fourth harmonics (and so forth). It has also been shown that subharmonic production can also be produced by such mechanisms which also provide higher sensitivity than linear ultrasound techniques (Korshak et al., 2002; Ohara et al., 2006; Jhang, 2009). Non-linear ultrasound uses these extra harmonics to determine the extent of defects in a material.
The proposed non-linear wave modulation technique focuses on additional sidebands (modulation) that are produced when two different frequency signals (f1 & f2) pass over a cracked region. This can be further compounded by the introduction of a third frequency (f3), giving rise to a complex collection of modulations and intermodulation's.
By adding equations 1 and 2 (βS + βD), developed by Fierro and Meo (2015), a sum and difference modulation (βS+D) parameter can be expressed as:
It can be assumed that the subtracted response can be equated to the amplitudes of (AS and AD) as follows:
Thus,
And for a tri frequency system (βTRI) the equation can be adjusted to:
Finally, in order to quantitatively validate the results the intensity at the crack/notch region (IC/N) is compared to the mean background noise level (IB), giving a signal to noise ratio (SNR) as follows:
Equipment and Experimental Setup
Three aluminum coupons (AA2024) specifically designed according to ASTM standards for fatigue crack growth (Figure 5) were used to evaluate fatigue cracks. The fatigue coupon had a length of 185 mm, width of 50 mm and thickness of 8 mm. A 2.4 mm notch was machined and then tapered in from both edges to a fine point, with a total depth of around ~8 mm. The fatigue crack was induced through a fatigue machine (Instron 8801), which allowed the plate to be fixed with hydraulic clamps and apply low-cycle fatigue loading until a significant fatigue crack had propagated. An analysis of the crack was performed with an optic microscope (Leyca M205 C). Figure 5 shows the placement of the phased array probe, the B-Scan zone and the crack location. The phased array probe as placed directly above the crack and notch region and was coupled to the aluminum surface using ultrasonic gel. No delay line (i.e., Perspex) was used in order to reduce attenuation effects on the transmitted and received ultrasound signal.
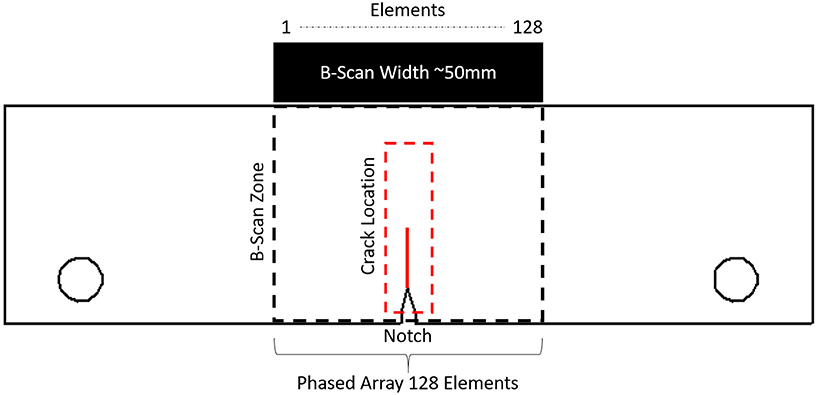
Figure 5. Aluminum fatigue sample with experimental layout (Fierro and Meo, 2019).
Three samples were used to evaluate the proposed modulation techniques (refer to Figure 6); an undamaged sample (UD), small fatigue crack (SFC—crack length ~3.5 mm) sample and a large fatigue crack (LFC—crack length ~14 mm) sample.
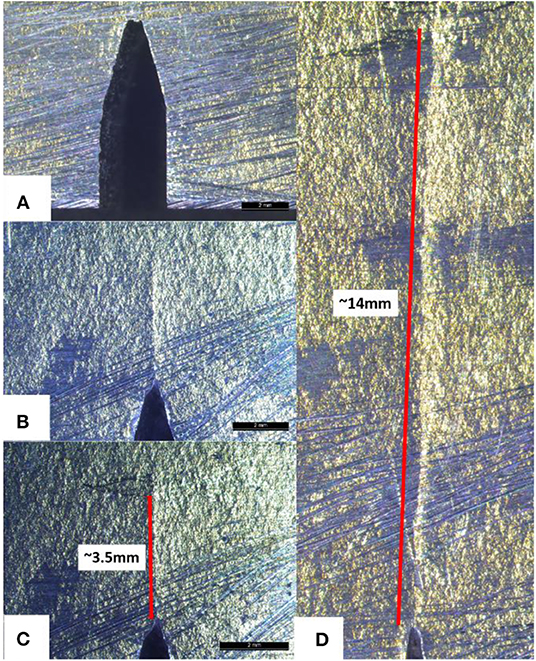
Figure 6. Samples evaluated during testing: (A) Undamaged (UD) aluminum fatigue sample; (B) small fatigue crack (SFC) aluminum sample; (C) SFC showing crack length; (D) large fatigue crack aluminum sample.
Results and Discussion
Dual Frequency Modulation
In order to evaluate the dual frequency modulation method three test samples were evaluated; an undamaged (UD) sample with a notch, a small fatigue crack (SFC) samples (crack length-−3.5 mm) and a large fatigue crack (LFC) sample (crack length-−14 mm). Figures 7A,D show the full field B-Scan image for single frequency excitation at f1 (4.8 MHz) and f2(5.3 MHz) for the UD sample. Due to near field effects, it is difficult to visualize the notch location, thus the area of interest between 20 and 45 mm depth has been focused on in Figures 7B,E. The zoomed images clearly show the notch location and depth (~42 mm). The subtraction process highlighted in Equation 3 (MR2) Figure 7C and Equation 8 (βS+D) Figure 7F are then used to evaluate the non-linear responses of the UD sample. Both the linear and non-linear methods clearly identify the location of the notch. When using the dual frequency modulation parameter (βS+D), the response area becomes very small with a high relative amplitude and thus the area has been magnified in order to highlight the response (refer to Figure 7F). It should be noted that the non-linear response is likely due to discontinuities near the notch tip.
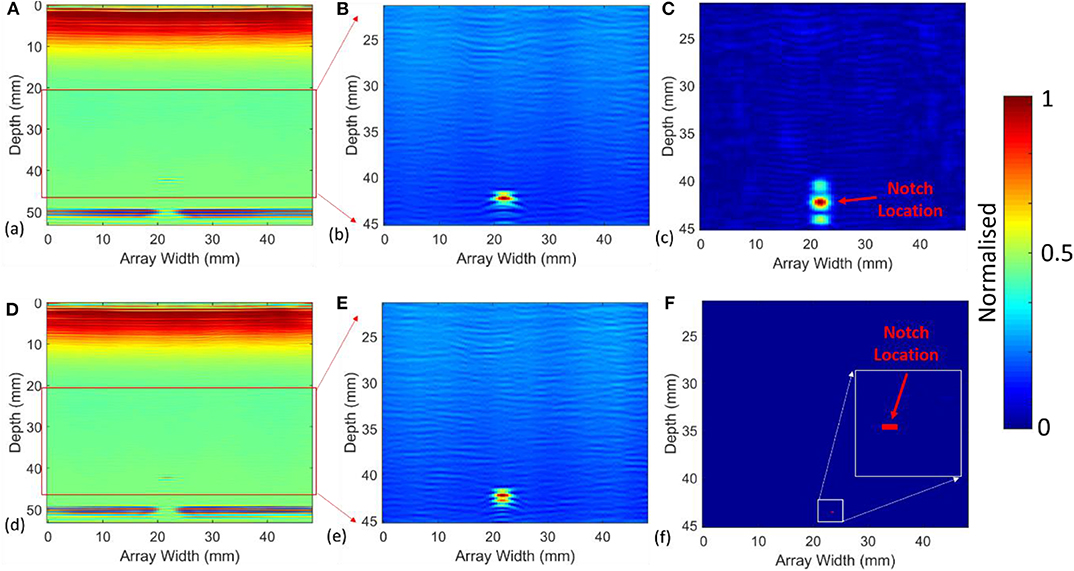
Figure 7. B-Scan of UD fatigue samples using linear and modulated responses: (A) UD aluminum fatigue sample for f1; (B) zoomed region for UD fatigue sample for f1; (C) MR2 for zoomed region; (D) UD fatigue sample for f2; (E) zoomed region for UD fatigue sample for f2; (F) βS+D for zoomed region.
The SFC sample was then used to evaluate whether non-linearities can be used to assess a vertical fatigue crack and whether the pump methodology provides benefits over a traditional approach where there is no delay between f1 and f2. The first observation is that linear methods are unable to distinguish the existence of the fatigue crack (refer to Figures 8A,D) and are only able to determine the notch location. Figures 8B,E show the differences between the delayed (pump method) vs. the traditional (no-delay) subtracted images for MR2. From these images it is clear that the pump methodology distinguishes the notch and identifies a response from the crack location, with the traditional delay methodology failing to determine the crack existence. Finally, in Figures 8C,F, the modulated parameter (βS+D) is evaluated, in this instance the delayed methodology identifies the crack (within ~1 mm of actual position) while the non-delayed method identifies the notch. It should be noted the total energy used to excite the sample for the delayed and traditional methods is equal with the only difference being the delay between f1 and f2. Thus, the results provide evidence that a “breathing/ringing” crack scenario is required in order to exploit modulated responses in the case of stiff vertical fatigue cracks. The non-linear parameter βS+D (Figure 8C) has also shown that it can eliminate linear responses from the notch.
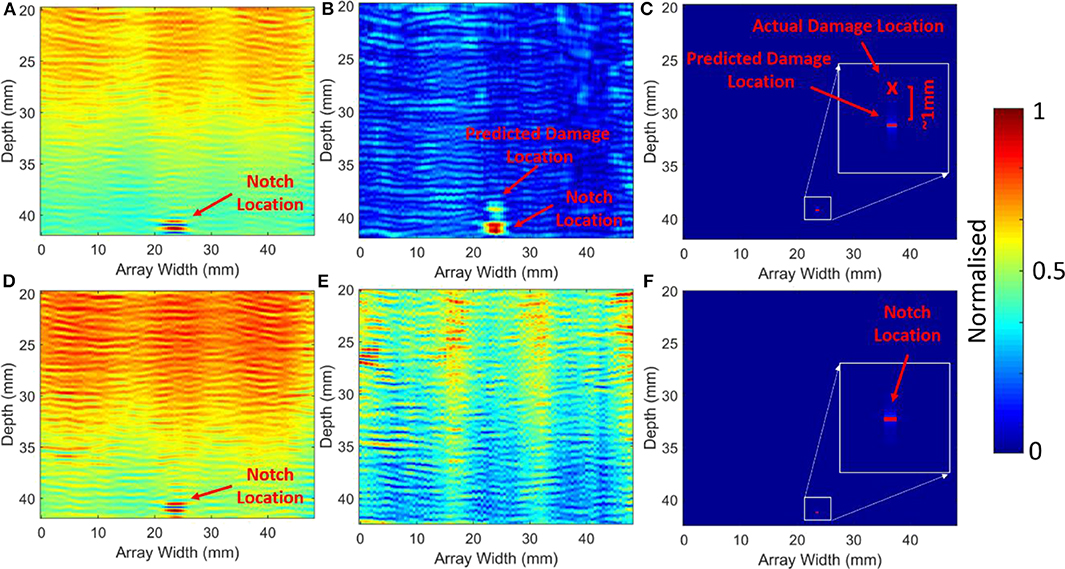
Figure 8. SFC sample comparison of linear response vs. non-linear: (A) f1; (B) MR2with delay on f1; (C) βS+D with delay on f1; (D) f2; (E) MR2no delay between f1 & f2; (F) βS+D no delay between f1 & f2.
The LFC sample was used to evaluate a larger crack and the ability of linear and non-linear techniques to identify the crack tip. The same process for the UD and SFC samples was used, Figures 9A,B show the linear predicted crack depth at around ~30 mm while Figures 9C,D show the modulated responses predicting a crack depth between ~30 and ~27 mm, respectively. In this case, due to the larger scattering of the incident wave in response to the larger vertical crack, the noise floor is considerably higher. Therefore, due to the higher background noise a 50% threshold was applied to the linear and non-linear responses, refer to Figure 9. It can be seen that f1, f2, and MR2 predict similar crack tip depths (within 2.8 mm of actual position, refer to Figures 9E,F while the modulated parameter βS+Dprovides a more accurate prediction within 1.2 mm of the actual crack tip position (refer to Figure 9G).
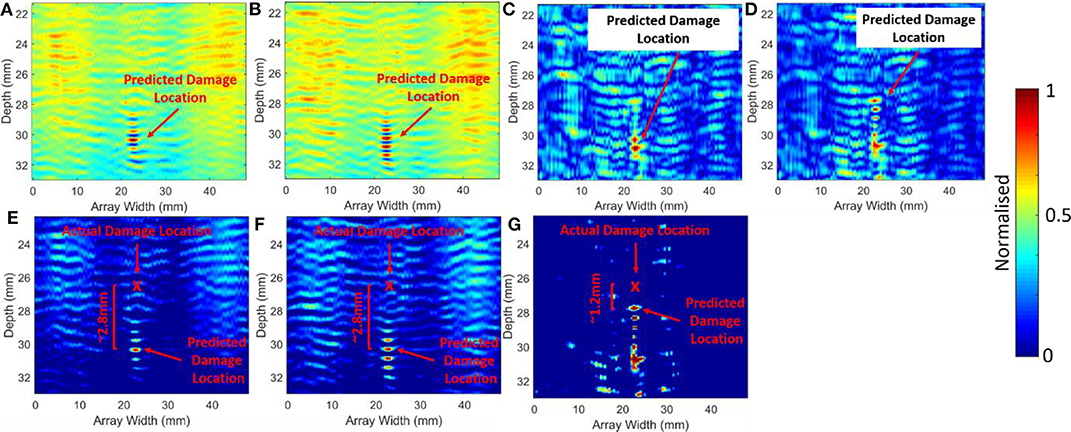
Figure 9. LFC sample comparison between linear vs. non-linear results: (A) f1; (B) f2; (C) MR2; (D) βS+D, and 50% threshold of LFC sample comparison of linear comparison between linear vs. non-linear results: (E) f1; (F) f2; (G) βS+D.
Tri Frequency Modulation
From the previous section it is clear that the pump frequency modulation method provides advantages over traditional linear techniques, and was shown to provide more accurate assessment for small and large vertical fatigue cracks. As the modulation parameter is a function of f1 and f2 and the non-linear frequency combinations, it is expected that increasing the number of transmit frequencies can have benefits in defect/damage evaluation. It is expected that further non-linearities will be introduced through frequency mixing and lead to greater non-linear signal to noise levels. Figures 10A,C show the dual frequency modulation results for f1 (4.8 MHz) and f2(5.3 MHz) and Figures 10B,D shows the tri frequency modulation results for f1 (4.8 MHz), f2(5.0 MHz), and f3(5.2 MHz). Although these two cases cannot be directly compared, as they have a different number of frequencies, they show similar results and predict the same crack tip location within 1 mm from the actual crack tip location.
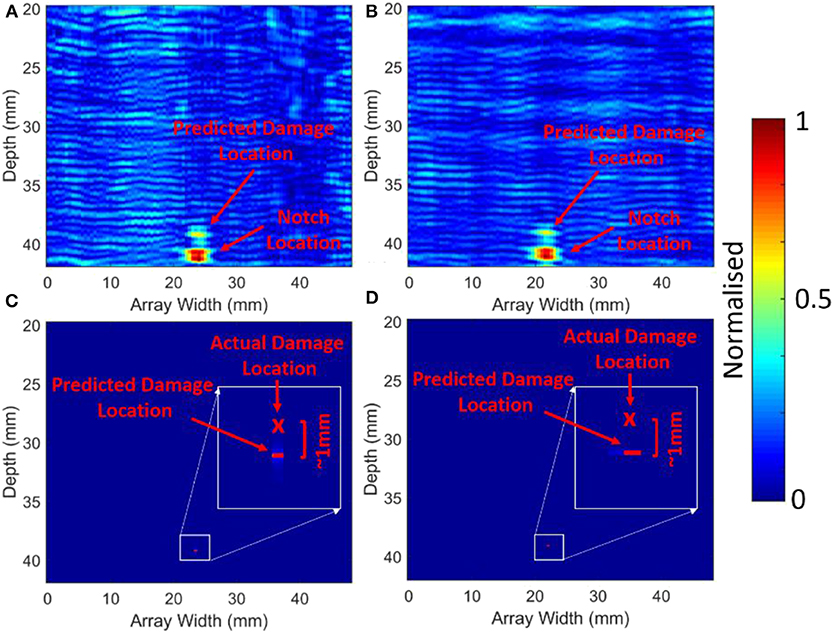
Figure 10. SFC sample comparison of dual frequency (f1 & f2 = 4.8 & 5.3 MHz) and tri frequency modulation (f1 & f2 & f3 = 4.8 & 5 & 5.2 MHz): (A) dual frequency MR2, (B) tri frequency MR3; (C) dual frequency βS+D; (D) tri frequency βTRI.
Figures 11A,B shows different frequency combinations tested for the tri modulation method. At low excitation frequencies (f1 = 3.8 MHz, f2= 4.0 MHz, and f3= 4.2 MHz, Figures 11A,C), the prediction of the crack tip improves relative to all the other cases tested (within 0.5 mm), while at high excitation frequencies (f1 = 5.8 MHz, f2= 6.0 MHz, and f3= 6.2 MHz, Figures 11B,D) the prediction of the crack tip is inferior. It is also clearly noticeable that the background noise level increases as the frequency increases. These results can be explained by two factors (1) the transmitted amplitude of the signal is much lower at the higher frequencies due to attenuation and the probes capabilities and (2) due to the stiffness of the crack, larger energy is required to produce the “breathing/ringing”' crack scenario. It is expected that crack stiffness increases from the base of the crack toward the crack tip. Thus, in this case, the lower frequencies ability to excite stiffer parts of the crack (closer to the crack tip) is improved as this is directly related to the energy of the wave.
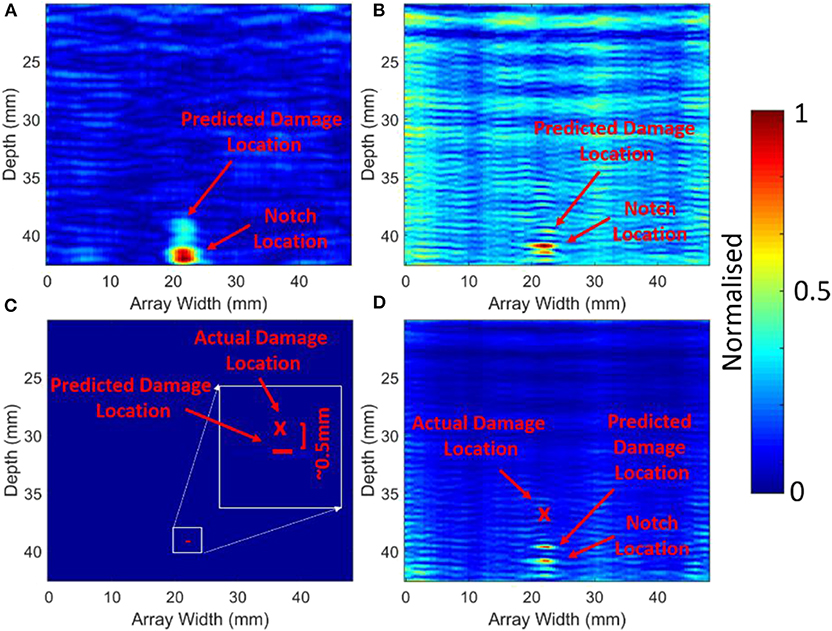
Figure 11. SFC sample comparison of different frequency excitation signals for tri frequency modulation: (A) MR3 for 3.8 & 4 & 4.2 MHz; (B) MR3 for 5.8 & 6 & 6.2 MHz; (C) βTRI for 3.8 & 4 & 4.2 MHz; (D) βTRI for 5.8 & 6 & 6.2 MHz.
Table 3 summarizes the estimated crack tip location found by the linear and dual/tri frequency methods. For the SFC sample (crack length of ~3.5 mm) the dual frequency method (f1 −4.8 MHz and f2−5.3 MHz) and tri frequency method (f1 −4.8 MHz, f2−5.0 MHz, and f3−5.2 MHz) both predicted a crack length of ~2 mm. While the tri frequency method at f1 = 3.8 MHz, f2= 4.0 MHz, and f3= 4.2 MHz, provided the best estimation of the actual crack length ~3 mm (within ~0.5 mm). While the standard linear method was not able to detect the fatigue crack in this instance. For the LFC sample (crack length of ~14 mm) the dual frequency method (f1 −4.8 MHz and f2−5.3 MHz) estimated a crack length of ~12.8 mm; 2.8 mm longer than that predicted by the linear method. It is clear from these results that the non-linear modulated results outperform those of the standard linear methods, furthermore the tri frequency method is also capable of providing better results than the dual frequency method, although this is dependent on the correct frequency selection. Frequency characterization and selection optimization does not form part of this work.
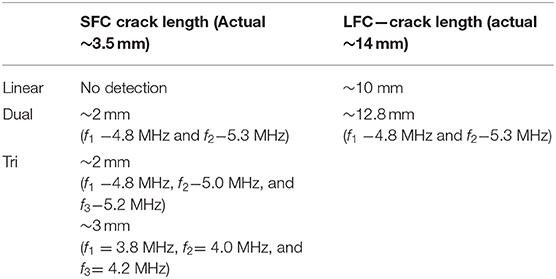
Table 3. Summary of linear, dual, and tri frequency results.
To further quantify the ability of the linear vs. the non-linear methods Figure 12 summarizes and compares the linear, dual frequency modulation (Figure 12A) and tri frequency modulation (Figures 12B–D) methods in terms of the signal to noise ratio (SNR, refer to Equation 10). The intensity at the crack location (or notch—linear case) was divided by the mean noise intensity value for each of the zoomed images. Figure 12A shows that for the dual frequency method, there was three orders of magnitude difference between the modulated parameter βS+D (2,487) when compared to the linear results (SNR for f1, f2, f12, f21 <2), furthermore the linear results are referenced to the notch not a crack location. Figures 12B,C show that SNR can be further improved by increasing the number of excitation frequencies, with the results close to four orders of magnitude greater than the linear cases (SNR for f1, f2, f3, f123, f231, f312 ≤ 2). Figure 12D, shows a low non-linear SNR factor which was expected due to the low tri frequency response at high frequencies (f1 = 5.8 MHz, f2= 6.0 MHz, and f3= 6.2 MHz, refer Figures 11B,D).
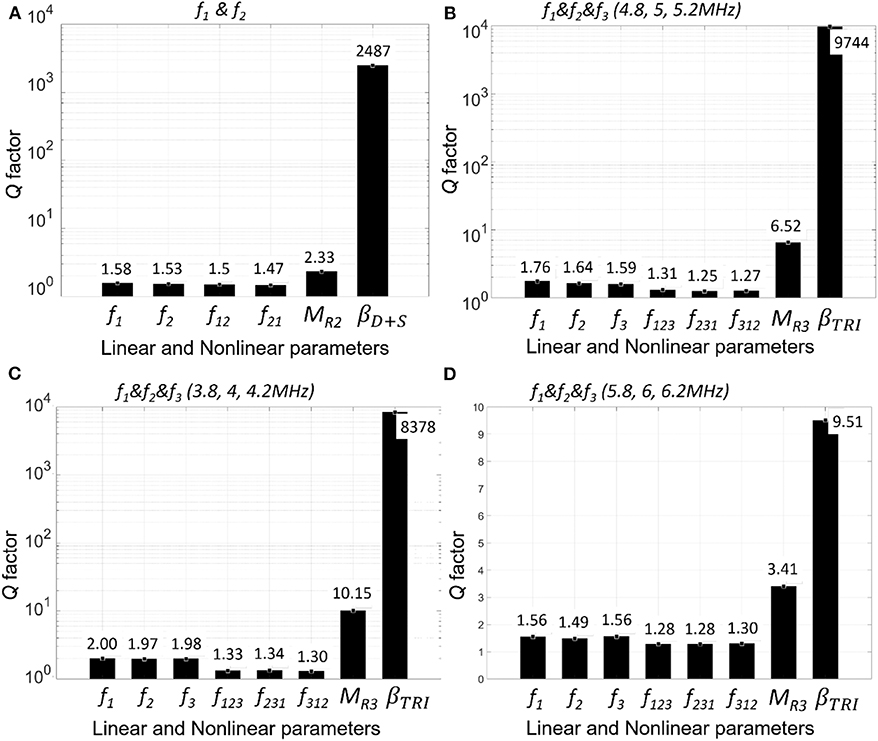
Figure 12. SFC sample comparison of SNR at damage region/notch for dual frequency modulation (A) and tri frequency modulation: (A) dual frequency modulation (4.8 & 5.3 MHz); (B) tri frequency modulation (4.8 & 5 & 5.2 MHz); (C) tri frequency modulation (3.8 & 4 & 4.2 MHz); (D) tri frequency modulation (5.8 & 6 & 6.2 MHz).
Conclusion
A frequency and amplitude modulation based non-linear ultrasound imaging technique coupled to a delay law routine expected to promote “breathing/ringing” in fatigue cracks was proposed. The technique is based on the subtraction between images (B-Scans) containing only linear components with images containing modulations, i.e., non-linearities. A standard phased array system was programmed to transmit the advanced delay law routine, including the relevant frequency components per element on a standard phased array probe. Three samples with different damage characteristics were evaluated in order to compare the proposed technique against traditional (linear) ultrasound methods. The ability of the method to more accurately determine the location of the vertical crack tip vs. traditional ultrasound methods was shown for small (accuracy within ~0.5 mm) and large (accuracy within ~1.2 mm) fatigue cracks. While the non-linear method allowed for linear feature suppression, it more importantly resulted in a high signal to noise ratio (SNR) between the predicted crack tip and the background noise levels typically >3 orders of magnitude. By increasing the number of excitation frequencies from 2 to 3, there was a further improvement in the SNR. It is clear from the results that using a frequency modulation technique improves the non-linear signal to noise levels and accentuates damage regions relative to the background while provided detection capabilities not possible with traditional methods. Further work will include evaluation of different samples under various fatigue loads, evaluation of horizontal contact defects and optimization of the frequency selection process.
Data Availability Statement
All datasets generated for this study are included in the article.
Author Contributions
All authors listed have made a substantial, direct and intellectual contribution to the work, and approved it for publication.
Funding
This paper has been funded by the EXTREME project of the European Union's Horizon 2020 research and innovation programme under grant agreement No. 636549.
Conflict of Interest
The authors declare that the research was conducted in the absence of any commercial or financial relationships that could be construed as a potential conflict of interest.
References
Alston, J., Croxford, A., Potter, J., and Blanloeuil, P. (2018). Nonlinear non-collinear ultrasonic detection and characterisation of kissing bonds. NDT E Int. 99, 105–116. doi: 10.1016/j.ndteint.2018.07.003
Bar-Cohen, Y. (1999). In-service NDE of aerospace structures–emerging technologies and challenges at the end of the 2nd millennium. NDT. Net 4, 1–21.
Boccardi, S., Calla, D., Fierro, G.-P., Ciampa, F., and Meo, M. (2015). Nonlinear damage detection and localisation using a time domain approach. Struct. Health Monitor. doi: 10.12783/SHM2015/320
Cantrell, J. H. (2004). Fundamentals and applications of non-linear ultrasonic nondestructive evaluation. Ultrasonic Non Destruct. Eval. 6, 363–434. doi: 10.1201/9780203501962.ch6
Cantrell, J. H., and Yost, W. T. (2001). Nonlinear ultrasonic characterization of fatigue microstructures. Int. J. Fatigue 23, 487–490. doi: 10.1016/S0142-1123(01)00162-1
Chen, C. (2007). Ultrasonic and Advanced Methods for Nondestructive Testing and Material Characterization. Singapore; Hackensack, NJ; London: World Scientific Publishing Co. Pvt. Ltd.
Cheng, J., Potter, J. N., and Drinkwater, B. W. (2018). The parallel-sequential field subtraction technique for coherent nonlinear ultrasonic imaging. Smart Mater. Struct. 27:065002. doi: 10.1088/1361-665X/aabcb2
Chiao, R. Y., and Thomas, L. J. (1994). Analytic evaluation of sampled aperture ultrasonic imaging techniques for NDE. Ultrasonics Ferroelectr. Freq. Control IEEE Trans. 41, 484–493. doi: 10.1109/58.294109
Ciampa, F., and Meo, M. (2012). Nonlinear elastic imaging using reciprocal time reversal and third order symmetry analysis. J. Acoust. Soc. Am. 131, 4316–4323. doi: 10.1121/1.4707522
Fierro, G. P. M., Ginzburg, D., Ciampa, F., and Meo, M. (2016). “Nonlinear thermosonics and laser vibrometry for barely visible impact damage of a composite stiffener panel,” in Nondestructive Characterization and Monitoring of Advanced Materials, Aerospace, and Civil Infrastructure 2016, Vol. 9804 (International Society for Optics and Photonics), 980419.
Fierro, G. P. M., and Meo, M. (2015). Residual fatigue life estimation using a nonlinear ultrasound modulation method. Smart Mater. Struct. 24:025040. doi: 10.1088/0964-1726/24/2/025040
Fierro, G. P. M., and Meo, M. (2019). “Nonlinear phased array imaging of flaws a modulation technique,” in Nondestructive Characterization and Monitoring of Advanced Materials, Aerospace, Civil Infrastructure, and Transportation XIII Vol. 10971 (International Society for Optics and Photonics). 1097116 doi: 10.1117/12.2514962
Haupert, S., Renaud, G., and Schumm, A. (2017). Ultrasonic imaging of nonlinear scatterers buried in a medium. NDT E Inte. 87, 1–6. doi: 10.1016/j.ndteint.2016.12.010
Jhang, K.-Y. (2009). Nonlinear ultrasonic techniques for nondestructive assessment of micro damage in material: a review. Int. J. Precision Eng. Manuf. 10, 123–135. doi: 10.1007/s12541-009-0019-y
Korshak, B., Solodov, I. Y., and Ballad, E. (2002). DC effects, sub-harmonics, stochasticity and “memory” for contact acoustic non-linearity. Ultrasonics 40, 707–713. doi: 10.1016/S0041-624X(02)00241-X
Lemistre, M., Gouyon, R., Kaczmarek, H., and Balageas, D. (1999). Office National D Etudes Et De Recherches Aerospatiales. Chatillon: Onera-Publications-TP.
Meo, M., Polimeno, U., and Zumpano, G. (2008). Detecting damage in composite material using nonlinear elastic wave spectroscopy methods. Appl. Composite Mater. 15, 115–126. doi: 10.1007/s10443-008-9061-7
Ohara, Y., Mihara, T., Sasaki, R., Ogata, T., Yamamoto, S., Kishimoto, Y., et al. (2007). Imaging of closed cracks using nonlinear response of elastic waves at subharmonic frequency. Appl. Phys. Lett. 90:011902. doi: 10.1063/1.2426891
Ohara, Y., Mihara, T., and Yamanaka, K. (2006). Effect of adhesion force between crack planes on subharmonic and DC responses in nonlinear ultrasound. Ultrasonics 44, 194–199. doi: 10.1016/j.ultras.2005.10.006
Oralkan, Ö., Ergun, A. S., Johnson, J. A., Karaman, M., Demirci, U., Kaviani, K., et al. (2002). Capacitive micromachined ultrasonic transducers: Next-generation arrays for acoustic imaging? Ultrasonics Ferroelectr. Freq. Control IEEE Trans. 49, 1596–1610. doi: 10.1109/TUFFC.2002.1049742
Park, C.-S., Kim, J.-W., Cho, S., and Seo, D.-C. (2016). A high resolution approach for nonlinear sub-harmonic imaging. NDT E Int. 79, 114–122. doi: 10.1016/j.ndteint.2016.01.001
Potter, J., Croxford, A., and Wilcox, P. (2014). Nonlinear ultrasonic phased array imaging. Phys. Rev. Lett. 113:144301. doi: 10.1103/PhysRevLett.113.144301
Keywords: non-linear ultrasound, non-linear imaging, phased array, fatigue, modulation, tri-modulation, defects, damage
Citation: Malfense Fierro GP and Meo M (2020) Non-linear Phased Array Imaging of Flaws Using a Dual and Tri Frequency Modulation Technique. Front. Built Environ. 6:68. doi: 10.3389/fbuil.2020.00068
Received: 06 December 2019; Accepted: 27 April 2020;
Published: 21 May 2020.
Edited by:
Gennaro Scarselli, University of Salento, ItalyReviewed by:
Gelacio Juárez-Luna, Autonomous Metropolitan University, MexicoAntonio Salvador Gliozzi, Politecnico di Torino, Italy
Andrzej Klepka, AGH University of Science and Technology, Poland
Copyright © 2020 Malfense Fierro and Meo. This is an open-access article distributed under the terms of the Creative Commons Attribution License (CC BY). The use, distribution or reproduction in other forums is permitted, provided the original author(s) and the copyright owner(s) are credited and that the original publication in this journal is cited, in accordance with accepted academic practice. No use, distribution or reproduction is permitted which does not comply with these terms.
*Correspondence: Michele Meo, bWljaGVsZS5tZW9AZ21haWwuY29t