
94% of researchers rate our articles as excellent or good
Learn more about the work of our research integrity team to safeguard the quality of each article we publish.
Find out more
REVIEW article
Front. Built Environ., 21 May 2019
Sec. Earthquake Engineering
Volume 5 - 2019 | https://doi.org/10.3389/fbuil.2019.00065
This article is part of the Research TopicSeismic Analysis and Retrofitting of Historical BuildingsView all 14 articles
Safety assessment with respect to seismic and vertical loads of existing and very old masonry structures is currently a central topic for the scientific engineering community. In particular, there are many ancient bridges still in service that are subjected to higher and more frequent cyclic loads. For these structures, it is important to determine the actual fatigue strength, rather than the ultimate carrying capacity. In this way the remaining service life, with possible traffic load limitations, may be estimated. This paper reports an updated review of the state-of-the art on recently published fatigue models that account for deterioration effects under cyclic loads. In addition, results related to fatigue performance of a bridge are shown and comments are provided. The numerical comparisons among existing fatigue models reveal that the application of the available fatigue models is particularly problematic for ancient masonry elements, where appropriate stress-life curves are required.
To date, there have been conspicuous advances in simulating the response of ancient masonry structures, mainly with the aim of determining the ultimate vertical loads and capacity with respect the lateral seismic actions. For example, among other studies, modeling criteria for ancient bridges may be found in Laterza et al. (2017b) and D'Amato et al. (2017), while for ancient churches they are reported in Pelà et al. (2009); Formisano and Marzo (2017); Betti et al. (2018); D'Amato et al. (2018), Formisano et al. (2018); Fuentes et al. (2019); Ramirez et al. (2019), and Lopez et al. (2019), and they are discussed for towers in Shakya et al. (2016); Bartoli et al. (2018) and Sarhosis et al. (2018). Models of general historical buildings are discussed in Caprili et al. (2017) and Milani et al. (2018), while detailed study on in-situ tests may be found, among the others, in Krstevska et al. (2010); Bartoli et al. (2013), and Luchin et al. (2018).
Nowadays, the study of ancient masonry structures' responses is a relevant topic since most of them are still in service without any kind of limitation.
By contrast, in the scientific community there is not yet the same level of interest for a correct understanding of fatigue effects and the prediction of the remaining service life of masonry elements under cyclic compressive loads. Among ancient masonry structures, it is known that arch bridges are affected by fatigue problems. This is due to the fact that they are currently subjected to higher and more frequent cyclic loads due to population growth, resulting in premature cracking and deterioration. As such, the available fatigue strength, that is the maximum stress acting in cyclic conditions, is significantly lower than the one obtained under quasi static loading conditions. Therefore, rather than the ultimate carrying capacity, it is important to know the actual fatigue strength, starting from which useful indications on the remaining service life with a possible traffic load limitation may be established. Moreover, the deterioration of materials and cyclic action may accelerate masonry deterioration and reduce carrying capacity. Clark (1994) and Roberts et al. (2006) performed cyclic tests on brick masonry columns and concluded that the stress limit of dry specimens was about 50% of the static compressive strength, whereas Choo and Hogg (1995) and Schueremans and Van Gemert (2001) instead suggested limiting the applied load to < 50% of the ultimate vertical load. Furthermore, in Melbourne et al. (2004) the cyclic vertical load capacity of multi-ring masonry arches varied between 37 and 57% of the static load carrying capacity. This significant reduction was due to a separation of rings, which was provoked by a shear failure mode among bricks and mortar joints instead of a four-hinge failure mechanism. Finally, in Melbourne et al. (2007), a unitary assessment procedure (named SMART procedure) was proposed for evaluating fatigue performance of masonry arches, involving the application of the fatigue model reported in Roberts et al. (2006).
Stress-life curves for masonry elements, indicated as S-N curves, are usually established in a limited number of experimental tests and, very often, are not adequate to reproduce the elements of ancient masonry. Moreover, in many of the actual design codes—among which are (Ministerial Decree D.M. 14/01/2008 (NTC-08), 2008), with the related (Italian Design Code Instructions (NTC-08 Instructions), 2009), and Eurocode 3 (EC3, 2003)—appropriate indications for evaluating the fatigue strength of masonry elements are still missing, contrarily to steel elements. Nevertheless, as highlighted from laboratory tests carried out on prototype models cast in a reduced scale, cycling loads related to in-service conditions may provoke fatigue failure for a vertical load significantly lower than the one related to the ultimate condition (Melbourne et al., 2004).
In this study, an updated review is provided for the main stress-life curve models available in the literature for estimating the fatigue strength of masonry elements. In particular, the models proposed by Ronca et al. (2004), Roberts et al. (2006), Casas (2009), Tomor and Verstrynge (2013), and Koltsida et al. (2018a) are considered. At first, they are separately described and shown. Then, the considered models are applied to a case study, an ancient masonry arch bridge. In particular, the main arch fatigue strength is assessed by considering the numerical simulations for repeated vertical loads reported in a previous study (Laterza et al., 2017a).
Ronca et al. (2004) conducted, in accordance with BS EN998-2 (2003), a series of tests applying repeated vertical loads on masonry specimens that contained M4 mortar, with an average strength in compression of 48.86 N/mm2 and an average ultimate strength in compression ranged between 10 and 13 MPa. The tests were performed in order to evaluate the role of loading rate on material response, with the aim of deriving a fatigue model in terms of S-N curves. In the tests, the specimens were subjected to heavy sustained loads with small perturbations, mostly due to environmental conditions (for example traffic vibrations and thermal excursion, among others). The brickwork prisms were tested under very high vertical loads applied axially (65–80% of the ultimate compressive strength) and by imposing a small variation of the alternating loads with three different frequencies: 1, 5, and 10 Hz.
Table 1 summarizes the ratios Smin/Smax, and Sa/Su reached in each test, where Sa is the stress induced with the alternating load (in absolute value); Su is the compressive strength of the investigated masonry; Smax and Smin are the maximum and the minimum stresses induced during the cycle, respectively; R is a parameter given by the ratio of Smin to Smax; while S is the ratio of Smax to Su, measuring how far the maximum stress is cyclically induced from the monotonic masonry compressive strength. In particular, during the tests the R ratio ranged from 0.73 to 0.88, while the S ratio ranged from 0.7 to 0.90. Figure 1 shows, in the semi-logarithmic plane logN-Sa/Su, the experimental values obtained from each test together with the stress-life curves proposed by the same authors. It is important to note that fatigue strength increases as the number of cycles, N, decreases.
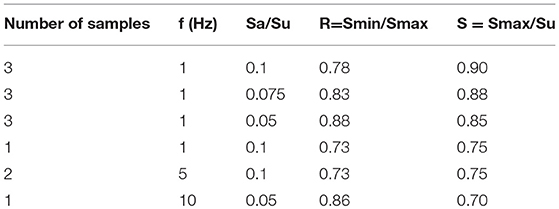
Table 1. Tests results obtained by Ronca et al. (2004).
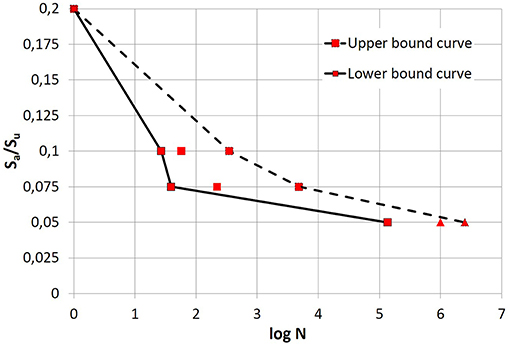
Figure 1. Ronca et al. (2004) fatigue curves: experimental data obtained.
Roberts et al. (2006) conducted experimental tests on different types of masonry prisms considering also different levels of water saturation degree. Starting from the obtained results, Equation (1) was proposed, representing a lower bound for the fatigue strength:
where F(S) is the function of the induced stress range, Smax is the maximum stress amplitude, ΔS is the difference between Smax and Smin, Su is the compressive strength and N is the number of cycles to failure.
Three types of specimens were tested for simulating more closely the masonry arch barrels, while considering both dry and saturated conditions. A vertical load eccentricity ratio e/d ranging from 0 to 0.256 (where e is the vertical load eccentricity and d the specimen depth) was applied. The load frequency was kept constant to 5 Hz until failure. The test series indicated that the high cycle fatigue strength of wet and submerged brick masonry specimens was only slightly less than that of dry specimens. The mortar was mixed in order to reproduce the representative mortar used for ancient brick masonry arches. It was shown that the compressive strength measured at 28 days ranged between 0.45 MPa and 2.78 MPa. The masonry compressive strength, determined by assuming a linear stress distribution along the specimens, varied between 6 and 14 MPa.
By introducing in Equation (1) the stress ratio R = Smin/Smax, and substituting ΔS for the difference Smax-Smin, the formulation proposed by Roberts et al. (2006) may be rewritten in the familiar form of stress-life curve logN- Smax/Su as follows:
In Equation (2), the fatigue strength S depends only on the imposed number of cycles N and on the amplitude of the induced stresses range R (the lower the R ratio the higher the interval amplitude of stresses).
Based on the test results from Roberts et al. (2006) , Casas (2009) post-processed the experimental results using a probabilistic approach. A new stress life curve for different survival probability levels was proposed for masonry under compressive loading, in accordance with Equation (3):
where N is the number of cycles to failure, R = Smin/Smax is the ratio between minimum and maximum induced stresses, and S = Smax/Su is the ratio between the maximum induced stress and compressive strength of the masonry. The coefficients A and B are reported in Table 2, defined as a function of the survival probability levels, while Figure 2 shows the stress-life curves obtained with Equation (3) by varying the stress ratio R from 0 to 0.9.

Table 2. Casas (2009) coefficients for different values of survival probability (Pb).
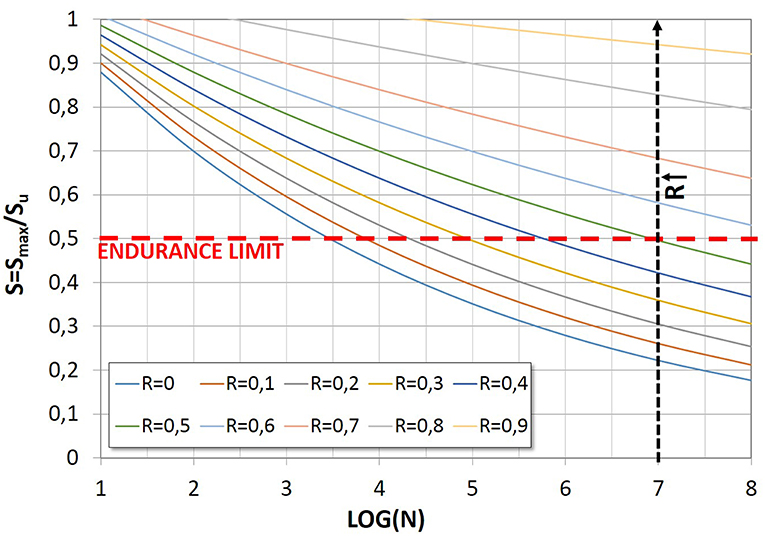
Figure 2. Casas (2009) fatigue curves, referred to a 5% of failure probability.
Starting from the Casas (2009) formulation, Tomor and Verstrynge (2013) proposed a probabilistic fatigue model, introducing the correction coefficient C set equal to 0.62 for accounting for the joined fatigue and creep deterioration simultaneously. In this model the material deterioration due to fatigue damage is more relevant for lower stress, while the creep effects dominate the cyclic response at higher stresses. In accordance with this work, Equation (4) was proposed, where the values of A and B are equal to 1 and 0.04, respectively:
For completeness, Figure 3 illustrates a series of fatigue curves obtained according to the model proposed by Tomor and Verstrynge (2013) by considering 5% of failure probability.
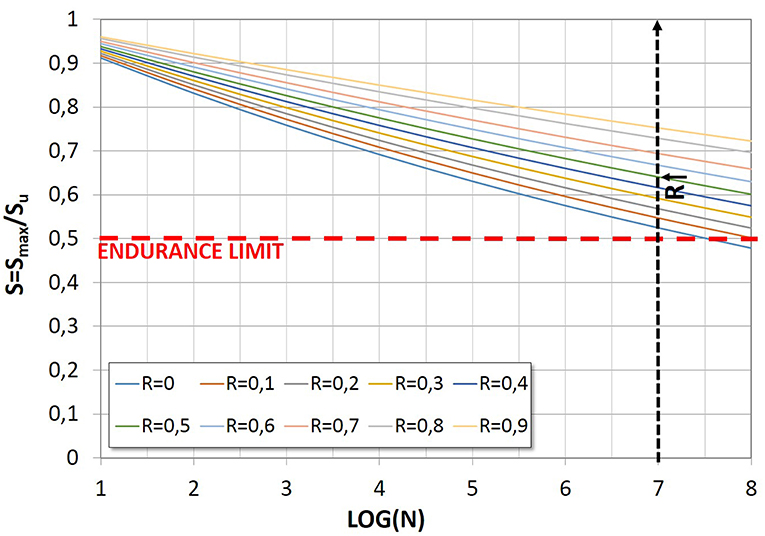
Figure 3. Tomor and Verstrynge (2013) fatigue curves, referred to a 5% of failure probability.
In order to develop new stress life curves for masonry under compressive loading, Koltsida et al. (2018a) performed a series of experimental fatigue tests on low-strength masonry prisms under compressive cyclic load, proposing stress-life curves for different values of survival probability. They tested 64 brick full-size masonry prisms according to ASTM (2014) . Static and cyclic tests were performed with a frequency of 2 Hz. The tests showed an average compressive strength of 4.86 MPa for bricks and of 2.94 MPa for the masonry. The minimum induced stress during the tests was set to 10% of the masonry compressive strength, while the maximum induced stress ranged between 55 and 80%. The limit on the number of cycles up to failure was fixed as 107. For a given survival probability L, the fatigue curve may be described as follows (Koltsida et al., 2018a):
In Figure 4, Equation 5 is reported by considering different values of R ratios, assuming L = 0.05 (i.e., by assuming a 5% failure probability).
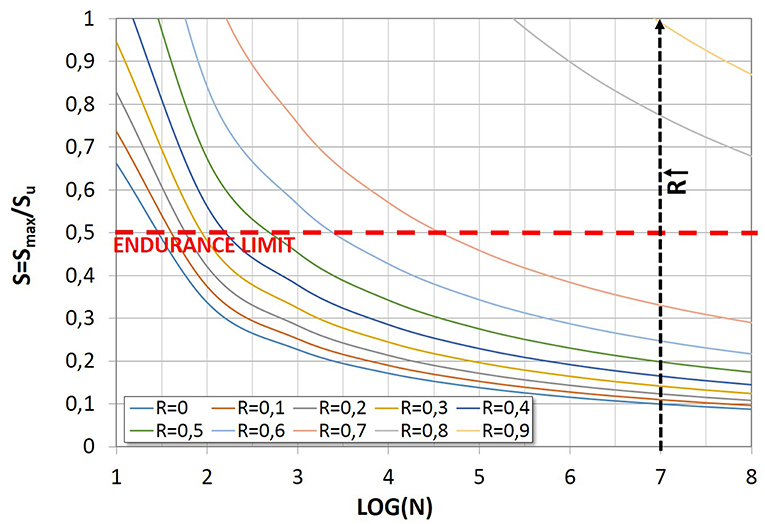
Figure 4. Koltsida et al. (2018a) fatigue curves, referred to a 5% of failure probability.
Koltsida et al. (2018b) investigated deterioration of the elastic modulus of masonry during compressive cyclic loading. This study was conducted starting from similar studies regarding concrete specimens, as reported in Crumley and Kennedy (1977); Holmen (1982); Cachim et al. (2002); Mu and Shah (2005); Breitenbucher and Ibuk (2006); Zanuy et al. (2011);Vicente et al. (2014).
Specifically, Crumley and Kennedy (1977) in their tests concluded that the elastic modulus decreased by about 40% over the concrete usable life, and that a remarkable reduction of elastic modulus arose often at 75% of the fatigue life. In Holmen (1982) the elastic modulus of concrete cylinders consisted of three different phases: a first rapid decrease from 0 to about 10% of the number of failure cycles, a constant decrease from 10 up to 80% of the number of failure cycles, and then a sudden decrease until the specimen's fatigue failure. These reductions resulted from increasing the number of cycles up to the failure. In addition, during the performed tests it was found that the absorbed energy at failure was the same for static and fatigue loads with different intensities. Mu and Shah (2005) performed experimental fatigue tests on the concrete cylinders to evaluate the damage evolution in the case of biaxial fatigue loading, compression and torsion. The results showed that the evolution of cracks in the material may be divided into two phases: the first phase was characterized by a deceleration of the crack, and the second one by a sudden acceleration. The authors proposed the following relationship:
where k, N and Nf are the elastic modulus, cycle and fatigue life, respectively. It should be noted that this relationship is independent of the fatigue load range. A different approach for predicting the elastic modulus of concrete under repeated compressive loads was proposed by Zanuy et al. (2011). In accordance with this model, the maximum strain (εmax) and the elastic modulus (E) were directly related to the number of cycles:
The deterioration influence on Equation (7) and Equation (8) depends on the maximum and the minimum stresses (σmax/fc, σmin/fc). In particular, the authors defined three different deterioration stages. In Stage 1, concrete deterioration was due to micro-cracks forming at the aggregate-paste interface. This stage covered approximately 10–15% of the fatigue life. In Stage 2, micro-cracks grew steadily, with a constant reduction of the elastic modulus. This stage covered about 80–90% of the fatigue life. In Stage 3, micro-cracks converged to form a macro-crack causing specimen failure. The expressions proposed to determine elastic modulus in the transition from Stage 1 to Stage 2 and the rate of modulus decline in fatigue Stage 2 were as follows (Zanuy et al., 2011):
where Ec is the static modulus of deformation.
Starting from the previous studies, a few research groups have proposed similar formulations by considering, instead of concrete, the masonry material. Among these groups, it is worth mentioning the studies conducted by (Alshebani and Sinha, 2001). In this work, the authors concluded that deterioration of the elastic modulus began at 20% of the compressive load capacity. Moreover, the strength and stiffness deterioration depended on the number and intensity of cyclic loads, and in particular the degradation increased as the load and number of cycles increased.
As mentioned above, Koltsida et al. (2018b) recently proposed a different formulation to describe the evolution of the stiffness degradation under cyclic loading. The tests highlighted that until 95% of the fatigue life, the variation of the elastic modulus remained constant, while beyond the 95% mark it rapidly decreased until failure. To describe the evolution of the elastic modulus during cyclic loading, a linear model was proposed as described by Equation 11 and Equation 12, where E/E0 represents the ratio between the elastic modulus and initial elastic modulus, and N/Nf is the ratio between the number of cycles and the number of cycles to failure. In Equation 12 the coefficient a is the gradient coefficient, while b is the intercept coefficient of the linear equation:
In Koltsida et al. (2018b) the following function was found as the best fit curve of the maximum induced stress:
By substituting the previous Equation (13) into Equation (11), the following relationship describing the reduction of the elastic modulus under cycling loading was proposed:
In Figure 5 the comparisons among the stress–life curves considered in this work are reported and illustrated in the semi-logarithmic plane Log N- S. In the comparisons the following values of the ratio R = Smin/Smax are considered: 0.2, 0.4, 0.6, and 0.8. Moreover, the curves proposed by Casas (2009) and Koltsida et al. (2018a) are drawn by referring to the 5% of failure probability, as considered by the EC3 and NTC-08 for the material nominal compressive strength. Also, Figure 5 reports the Tomor and Verstrynge (2013) stress life curves, and the ones proposed by Ronca et al. (2004), related to the ratio R equal to 0.8, since 0.8 is approximately the average value of the imposed R in all the performed tests. In all the graphs, the fatigue endurance limit S = 0.5 is also highlighted. It is important to outline that all the considered models may predict a low number of cycles at failure, even lower than the stress level corresponding to the classic endurance limit. From the comparisons, it is possible to highlight that when the stress ratio R decreases, i.e., the stress fluctuation between the minimum and maximum compressive stress increases, the number of cycles to failure decreases for any value of ratio S = Smax/Su. Moreover, it can be observed that for R equal to 0.6 and 0.8, the fatigue strength becomes significantly higher than the endurance limit, very high also for a number of cycles. Finally, the curves proposed by Tomor and Verstrynge (2013) indicated very different values for the number of cycles to failure compared to the other curves, especially for high values of ratio S, where the effect of the plastic deformations are more influent.
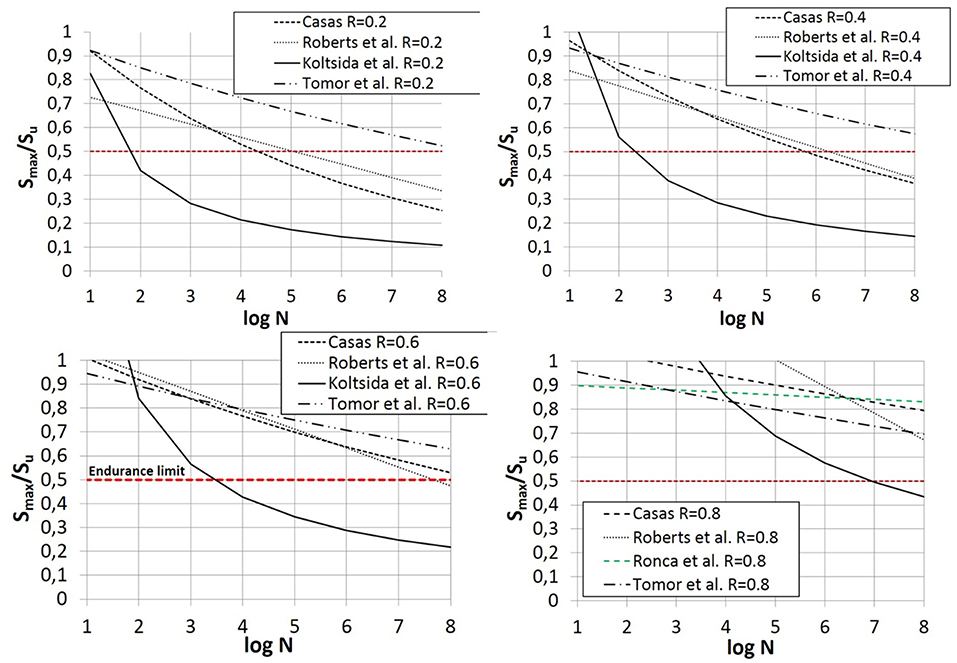
Figure 5. Comparisons between stress life curves for different values of the ratio R, referred to the 5% of failure probability.
In this paper fatigue assessment related to a case study is discussed. In particular, the results related to the main and secondary arches of an ancient masonry arch bridge are shown.
The case study, “Cavone Bridge,” was built in Italy before the Second World War and is currently still open to the traffic. It takes its name from the river it crosses and consists of seven arches of brick masonry. The bridge is 140 m in length and 5.6 m wide, and it is composed of three main arches with span lengths of 22 m and three secondary arches with span lengths of 10 m. The arches are supported by two piers of which 14 m are outside the riverbed. The piers have a total height from the foundation plane of about 24 m.
The bridge serves a provincial road according to the Italian Transport Classification (1992). The bridge was subjected to some in situ tests to identify the typology and the thickness of all its elements and components. The tests showed that the piers, abutments and spandrel walls consist of an external leaf of regular stone blocks. The piers have a core of cohesive backfill, while the bridge deck is formed by an incoherent backfill that has the function of spreading the traffic loads to the supporting arches. More details about numerical investigations carried out on this bridge for fatigue and seismic performance may be found performance in Laterza et al. (2017a,b) and D'Amato et al. (2017). In particular, in this section the numerical investigations illustrated in Laterza et al. (2017a) regarding the most unfavorable section for fatigue assessment verifications are discussed.
As for the load scheme, in this study Fatigue Model 3, which has two axles with a load of 120 kN/axle, is used. In accordance with Eurocode 1 (EC1, 2003) the considered fatigue model is more appropriate for typical heavy traffic on European main roads or motorways. In addition, a Traffic Category 2 has been assumed, resulting in 5 × 10⁵ passages for the year (Ncat). Since there is an absence of a relative procedure for masonry elements, in this study the fatigue assessment for steel elements has been applied, as proposed in the Italian Design Code Instructions (NTC-08 Instructions) (2009) and EC3 (2003), while applying fatigue stress-strain curves for masonry.
In accordance with the Italian Design Code Instructions (NTC-08 Instructions) (2009), two different values for the masonry compressive strength associated with Knowledge Level 1 (KL1) and Knowledge Level 3 (KL3) have been considered for the arches (NTC-08). Precisely, the compressive strength of masonry is assumed equal to 2.4 MPa for KL1 and 3.2 MPa for KL3. The strength is further reduced by a confidence factor FC = 1.35 for KL1 and FC = 1 for KL3.
Figure 6 reports the comparisons of the fatigue curves considered in this study, plotted for main and secondary arches. It should be noted that, in accordance with the NTC-08 and EC3 methods, all the curves are factorized, i.e., the fatigue strength is divided by γMf (fatigue strength partial factor), assumed in this case equal to 1.35 by supposing a high consequence of arch failure due to the fatigue strength achievement. Meanwhile, the stress range Δσi, due to the stresses fluctuation resulting from the transit of the load along the arch, is amplified by γFf = 1, where γFf is the partial factor for equivalent constant amplitude stress range Δσi.
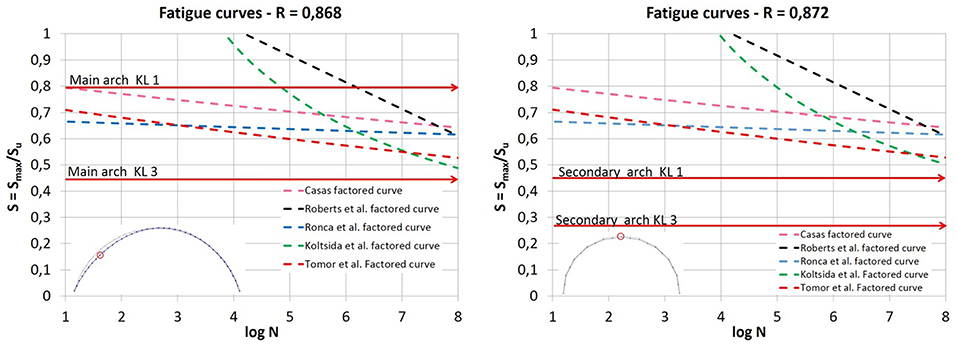
Figure 6. Main arch (left) and secondary arch (right): calculation of the life cycles at the failure.
As far as the stress fluctuation is concerned, three different sections (2 haunches section, and 1 key section) for each arch have been numerically investigated in Laterza et al. (2017a) by means of FEM models. However, in this study only the most unfavorable section for fatigue assessment in terms of Δσi fluctuation is considered, which is the haunch section for the main arches and the key for the secondary ones. For these sections the ratio Smin/Smax results in value equal to 0.868 for the main arches and to 0.872 for the secondary ones, where Smin and Smax are the minimum and maximum axial stresses. In Tables 3, 4, the numerical results are summarized for the main and secondary arches, reporting the ratios Smax/Su (maximum stress Smax over the ultimate strength in compression Su) for both KL1 and KL3.
The fatigue performance is evaluated through the calculation of the residual service life, expressing the residual time (in year) before the failure to fatigue. This is given by the following ratio:
where N is the cycle number to failure obtained from the stress-life curve and Ncat is the number of passages per year assumed for the category of the bridge (Ncat = 5 × 10⁵ passages/year).
It should be noted that for KL3, by referring to the main arches, and for KL1 and KL3 in the case of secondary ones, the cycles' number to failure N are always very high (greater than 108) so that, substantially, the residual life may be considered infinite.
On the other hand, the fatigue assessment results drastically change if the KL1 is considered for main arches. In this case, the models of Tomor and Verstrynge (2013) and Ronca et al. (2004) are not applicable, since the stress level Smax/Su = 0.790 falls beyond the stress-life curves for any value of logN. As for the model proposed by Casas (2009) and Koltsida et al. (2018a), the residual life is < 1 year. Meanwhile, according to the Roberts et al. (2006) model, the residual life is about 3.5 years.
By comparing the chosen models, it is possible to conclude that the models proposed by Koltsida et al. (2018a), Tomor and Verstrynge (2013) and Casas (2009) actually represent the most complete models, since they have been derived from experimental results considered with a probabilistic approach. Differently from the Ronca et al. (2004) model (derived by imposing a small variation of the alternating loads), both the Roberts et al. (2006) and Casas (2009) models estimate, at a number of cycles that is not too high, fatigue strength ratios (Smax/Su) significantly lower than 0.5, which is the value usually indicated as the fatigue endurance limit. This demonstrates the importance of an appropriate evaluation of the fatigue strength that may lead, if simplified methods are applied (such as the endurance limit criterion), to an overestimation of the actual fatigue strength.
In this paper, a critical review has been made and we have applied some fatigue models to a case study, considering also the deterioration of the masonry due to the effect of the cyclic loads.
In particular, different fatigue curves have been considered for evaluating the damage accumulation due to traffic load, in compliance with the procedure proposed by the EC3 (2003) and NTC-08 (2008). Since in the examined codes no clear indication is reported for masonry elements, the fatigue performance approach has been applied similarly to the one proposed for steel elements, with masonry fatigue curves.
Different stress-life curves have been considered in accordance with the models proposed by Ronca et al. (2004), Roberts et al. (2006), Casas (2009), Tomor and Verstrynge (2013) and Koltsida et al. (2018a), which are also capable of estimating the degradation of the material due to fatigue.
By comparing the chosen models, it possible to conclude that the models proposed by Casas (2009), Tomor and Verstrynge (2013), and Koltsida et al. (2018a) actually represent the most complete models, since they have been derived from the experimental results considered with a probabilistic approach. It must be remarked, however, that they have been derived from laboratory tests performed on masonry specimens having compressive strength values higher than the usual ones encountered in existing masonry. To this aim, particular attention should be also paid to the influence on the fatigue capacity of the cyclic load frequency. As a matter of fact, the fatigue models examined in this study have been proposed for cycled loads having frequencies (more than 1 Hz) higher than the ones associated with traffic loads indicated in the considered codes (for example, in the case analyzed the traffic load frequency results equal to 0.015 Hz). A first approach has been adopted to evaluate the degradation of the material due to the fatigue effects by using the recent model proposed by Koltsida et al. (2018b).
Finally, new laboratory tests focused on ancient masonry specimens will permit researchers to study in a more in-depth manner the fatigue behavior and the evolution of the material degradation of masonry, which have not yet been fully detailed.
The datasets generated for this study are available on request to the corresponding author.
All authors listed have made a substantial, direct and intellectual contribution to the work, and approved it for publication.
The authors declare that the research was conducted in the absence of any commercial or financial relationships that could be construed as a potential conflict of interest.
Alshebani, M. M., Sinha, N. S. (2001). Stiffness Degradation of Brick Masonry Under Cyclic Compressive Loading, Vol. 15. Masonry International, 13–16.
ASTM (2014). “Standard test method for compressive strength of masonry prisms,” in Annual Book of ASTM Standards, Vol. 4.05, eds ASTM (West Conhohocken, ASTM International), 889–895.
Bartoli, G., Betti, M., Galano, L., Zini, G. (2018). Numerical insights on the seismic risk of confined masonry towers. Eng. Struct. 180, 713–727. doi: 10.1016/j.engstruct.2018.10.001
Bartoli, G., Betti, M., Giordano, S. (2013). In situ static and dynamic investigations on the “Torre Grossa” masonry tower. Eng. Struct. 52, 718–733. doi: 10.1016/j.engstruct.2013.01.030
Betti, M., Borghini, A., Boschi, S., Ciavattone, A., Vignoli, A. (2018). Comparative seismic risk assessment of basilica-type churches. J. Earthq. Eng. 22 (supp1), 62–95. doi: 10.1080/13632469.2017.1309602
Breitenbucher, R., Ibuk, H. (2006). Experimentally based investigations on the degradation-process of concrete under cyclic loading. Mater. Struct. 39, 717–724. doi: 10.1617/s11527-006-9097-9
BS EN998-2 (2003). Specification for Mortar for Masonry. Masonry Mortar. London, UK: British Standard Institution.
Cachim, P., Figueiras, J., Pereira, P. (2002). Fatigue behaviour of fiber reinforced concrete in compression. Cement Concrete Composites 24, 211–217. doi: 10.1016/S0958-9465(01)00019-1
Caprili, S., Mangini, F., Salvatore, W., Bevilacqua, M. G., Karwacka Codini, E., Squeglia, N., et al. (2017). A knowledge-based approach for the structural assessment of cultural heritage, a case study: la Sapienza Palace in Pisa. Bull. Earthq. Eng. 15, 4851–4886. doi: 10.1007/s10518-017-0158-y
Casas, J. R. (2009). A probabilistic fatigue strength model for brick masonry under compression. J. Construct. Build. Mater. 23, 2964–2972. doi: 10.1016/j.conbuildmat.2009.02.043
Choo, B. S., Hogg, V. (1995). “Determination of the serviceability limit state for masonry arch bridges,” in Arch Bridges, ed C. Melbourne (London, UK: Thomas Telford), 529–536.
Clark, G. W. (1994). Bridge Analysis Testing and Cost Causation Project: Serviceability of Brick Masonry. British Rail Research Report LR CES 151.
Crumley, J., Kennedy, W. (1977). Fatigue and Repeated-load Elastic Characteristics of Inservice Portland Cement Concrete. Texas, USA: Center of Highway Research, The University of Texas.
D'Amato, M., Laterza, M., Casamassima, V. M. (2017). Seismic performance evaluation of a multi-span existing masonry arch bridge. Open Civil Eng. J. 11 (Suppl. 5) M11, 1191–1207. doi: 10.1063/1.4992619
D'Amato, M., Laterza, M., Diaz Fuentes, D. (2018). Simplified seismic analyses of ancient churches in matera's landscape. Int. J. Architect. Heritage. doi: 10.1080/15583058.2018.1511000. [Epub ahead of print].
Formisano, A., Marzo, A. (2017). Simplified and refined methods for seismic vulnerability assessment and retrofitting of an Italian cultural heritage masonry building. Comput. Struct. 180, 13–26. doi: 10.1016/j.compstruc.2016.07.005
Formisano, A., Vaiano, G., Fabbrocino, F., Milani, G. (2018). Seismic vulnerability of italian masonry churches: the case of the nativity of blessed virgin mary in stellata of bondeno. J. Build. Eng. 20, 179–200. doi: 10.1016/j.jobe.2018
Fuentes, D. D., Laterza, M., D'Amato, M. (2019). “Seismic vulnerability and risk assessment of historic constructions: the case of masonry and adobe churches in Italy and Chile,”in Proceedings of SAHC 2018, 11th International Conference on Structural Analysis of Historical Constructions. RILEM Bookseries 18 (Cusco), 1127–1137.
Italian Design Code Instructions (NTC-08 Instructions) (2009). Circolare 2 Febbraio 2009, n. 617 – Istruzioni per l'Applicazione Delle Nuove Norme Tecniche per le Costruzioni di cui al D.M. 14 gennaio 2008. Pubblicata su S.O. n. 27 alla G.U.
Italian Transport Classification (1992). Nuovo Codice Della Strada.” Pubblicato sul supplemento ordinario n.74 alla “Gazzetta Ufficiale” n. 114 del 18 Maggio 1992 – Serie Generale Quanto Definito Da: “Nuovo Codice Della Strada”.
Koltsida, I. S., Tomor, A. K., Booth, C. A. (2018a). Probability of fatigue failure in brick masonry under compressive loading. Int. J. fatigue. 112, 233–239. doi: 10.1016/j.ijfatigue.2018.03.023
Koltsida, I. S., Tomor, A. K., Booth, C. A. (2018b). Experimental evaluation of changes in strain under compressive fatigue loading of brick masonry. Construct. Build. Mater. 162, 104–112. doi: 10.1016/j.conbuildmat.2017.12.016
Krstevska, L., Tashkov, L., Naumovski, N., Florio, G., Formisano, A., Fornaro, A., et al. (2010). “In-situ experimental testing of four historical buildings damaged during the 2009 L'Aquila earthquake,” in COST ACTION C26: Urban Habitat Constructions under Catastrophic Events - Proceedings of the Final Conference (Naples), 427–432.
Laterza, M., D'Amato, M., Casamassima, V. M. (2017a). Stress-life curves method for fatigue assessment of ancient brick arch bridges. Int. J. Archit. Heritage 11. 843–858. doi: 10.1080/15583058.2017.1315621
Laterza, M., D'Amato, M., Casamassima, V. M. (2017b). “Seismic performance evaluation of multi-span existing masonry arch bridge,” in AIP Conference Proceedings, 1863, art. no. 450010. International Conference of Numerical Analysis and Applied Mathematics 2016, ICNAAM 2016 (Rhodes).
Lopez, S., D'Amato, M., Ramos, L., Laterza, M., Lourenço, P. B. (2019). Simplified formulation for estimating the main frequencies of ancient masonry churches. Front. Built Environ. 5:18. doi: 10.3389/fbuil.2019.00018
Luchin, G., Ramos, L. F., D'Amato, M. (2018). Sonic tomography for masonry walls characterization. Int. J. Architec. Heritage. doi: 10.1080/15583058.2018.1554723. [Epub ahead of print].
Melbourne, C., Tomor, A. K., Wang, J. (2004). “Cyclic load capacity and endurance limit of multi-ring masonry arches,” in Arch Bridge ‘04” Conference Proceedings (Barcelona), 375–384.
Melbourne, C., Wang, J., Tomor, A. K. (2007). “A new masonry arch bridge assessment strategy (SMART),” in Proceedings of the Institution of Civil Engineers-Bridge Engineering, 160 (London, UK).
Milani, G., Formisano, A., Fabbrocino, F. (2018). Design of new structures and vulnerability reduction of existing buildings in presence of seismic loads: Open challenges. AIP Conf. Proceed. 1978:450001. doi: 10.1063/1.5044055
Ministerial Decree D.M. 14/01/2008 (NTC-08) (2008). Norme Tecniche per le Costruzioni. S.O. n. 30 of the Official Gazette of the Italian Republic.
Mu, B., Shah, S. (2005). Fatigue behavior of concrete subjected to biaxial loading in the compression region. Mater. Struct. 38, 289–298. doi: 10.1007/BF02479293
Pelà, L., Aprile, A., Benedetti, A. (2009). Seismic assessment of masonry arch bridge. Eng. Struct. 31, 1777-1788. doi: 10.1016/j.engstruct.2009.02.012
Ramirez, E., Lourenço, P. B., D'Amato, M. (2019). “Seismic assessment of the Matera Cathedral,” in Proceedings of SAHC 2018, 11th International Conference on Structural Analysis of Historical Constructions. RILEM Bookseries 18 (Perù), 1346–1354.
Roberts, T. M., Hughes, T. G., Dandamudi, V. R., Bell, B. (2006). Quasi-static and high-cycle fatigue strength of brick masonry. J. Constr. Build. Mater. 20, 603–614. doi: 10.1016/j.conbuildmat.2005.02.013
Ronca, P., Franchi, A., Crespi, P. (2004). “Structural failure of historic buildings: masonry fatigue tests for an interpretation model,” in Proceeding Paper of the Fourth International Conference on Structural Analysis of Historical Constructions (Bologna), 273–279.
Sarhosis, V., Milani, G., Formisano, A., Fabbrocino, F. (2018). Evaluation of different approaches for the estimation of the seismic vulnerability of masonry towers. Bull. Earthq. Eng. 16, 1511–1545. doi: 10.1007/s10518-017-0258-8
Schueremans, L., Van Gemert, D. (2001). “Assessment of existing structures using probabilistic methods-state of the art, Computer methods in structural masonry-5,” in Proc. Fifth Int. Symp. Computer Methods in Structural Masonry (Rome), 255–262.
Shakya, M., Varum, H., Vicente, R., Costa, A. (2016). Empirical formulation for estimating the fundamental frequency of slender masonry structures. Int. J. Architect. Heritage 10, 55–66. doi: 10.1080/15583058.2014.951796
Tomor, A., Verstrynge, E. (2013). A joint fatigue–creep deterioration model for masonry withacoustic emission based damage assessment. Construct. Build. Mater. 43, 575–588.
Vicente, M., Gonzalez, D., Minguez, J., Martinez, J. (2014). Residual modulus of elasticity and maximum compressive strain in HSC and FRHSC after high-stress-level cyclic loading. Struct. Concrete. 15, 210–218. doi: 10.1016/j.conbuildmat.2013.02.045
Keywords: masonry, fatigue assessment, fatigue deterioration, residual service life, stress-life curves
Citation: Casamassima VM and D'Amato M (2019) Fatigue Assessment and Deterioration Effects on Masonry Elements: A Review of Numerical Models and Their Application to a Case Study. Front. Built Environ. 5:65. doi: 10.3389/fbuil.2019.00065
Received: 18 February 2019; Accepted: 30 April 2019;
Published: 21 May 2019.
Edited by:
Hussam Mahmoud, Colorado State University, United StatesCopyright © 2019 Casamassima and D'Amato. This is an open-access article distributed under the terms of the Creative Commons Attribution License (CC BY). The use, distribution or reproduction in other forums is permitted, provided the original author(s) and the copyright owner(s) are credited and that the original publication in this journal is cited, in accordance with accepted academic practice. No use, distribution or reproduction is permitted which does not comply with these terms.
*Correspondence: Vito Michele Casamassima, dml0b21pYy5jYXNhbUBnbWFpbC5jb20=
Disclaimer: All claims expressed in this article are solely those of the authors and do not necessarily represent those of their affiliated organizations, or those of the publisher, the editors and the reviewers. Any product that may be evaluated in this article or claim that may be made by its manufacturer is not guaranteed or endorsed by the publisher.
Research integrity at Frontiers

Learn more about the work of our research integrity team to safeguard the quality of each article we publish.