 Piotr Olaszek
 Joan Ramon Casas
94% of researchers rate our articles as excellent or good
Learn more about the work of our research integrity team to safeguard the quality of each article we publish.
Find out more
ORIGINAL RESEARCH article
Front. Built Environ., 11 February 2019
Sec. Bridge Engineering
Volume 5 - 2019 | https://doi.org/10.3389/fbuil.2019.00011
This article is part of the Research TopicDiagnostic and Proof Load Tests on BridgesView all 16 articles
Bridge tests are a helpful tool for bridge assessment and evaluation. Both in the case of a static and dynamic load testing, each element of the test: the load selection and application, the creation of a numerical model to follow the progress of the test or to check the validity of the test results, the measurement process itself and the comparative analysis of experimental results and calculations could be a source of errors in the bridge final evaluation if these errors and uncertainties are not properly considered. The article presents some of the most important factors that may bring errors in the interpretation of the test results and their comparison to targeted values or values derived from a numerical model. This, at the end, may result in the adoption of decisions that are not accurate and appropriate. The selected sources of feasible errors are presented with the division into static and dynamic loading tests. The presented examples of bridge load testing show how the use of improper test methods could lead to significant errors in bridge assessment and evaluation and, consequently, to wrong decisions.
The role of the test loading research in the bridge management system is significant in the world. The publication (Casas, 2006; Wiśniewski et al., 2012) presented the current situation and future trends related to the assessment of the condition and bearing capacity of a structure. The importance of diagnostic test loading was emphasized to be the most accurate tool to assess the structure's bearing capacity. The method of bridge bearing capacity assessment which integrates analytical methods with experimental tests is particularly useful and is verified by test loading research (Wang et al., 2011).
The basic division of test loading is made on the basis of the load variations in time:
- static load testing,
- dynamic load testing.
There are three types of tests distinguished due to the method and purpose of testing:
- diagnostic load testing (also called supplementary load testing) carried out in order to assess the carrying capacity of a bridge structure in service, based on an integration of the structure numeric analysis results and load tests-(Institution of Civil Engineers and National Steering Committee for the Load Testing of Bridges, 1998).
- proof load testing carried out in order to assess the carrying capacity of a bridge structure in service, based on testing the structure under increasing load until the structure's non-linear response to the increasing load can be observed (Faber et al., 2000; Casas and Gomez, 2010; Casas and Gómez, 2013; Wiśniewski et al., 2012).
- acceptance tests carried out before a bridge structure is approved for use; it's similar to diagnostic load testing due to the method of the results analysis, and similar to proof load testing but with the level of the load reaching the design load and not going beyond this point.
Regardless of the type of bridge tests and the purpose of performing these tests, it should be strongly taken into account that the test results are always subject to undesired errors. The impact of these errors on the outcome of the final evaluation of the bridge depends on many factors. An important element of the research is to find the causes of errors and to estimate their influence on the final uncertainty of the bridge evaluation, or to try to avoid them by taking the appropriate solutions during the execution and analysis of the test results.
Analyzing the causes of errors related to various elements of the bridge evaluation process by a loading test, some of them appear during the preparation and execution of the test, meanwhile others are derived in the posterior analysis of the results. We can distinguish the following causes:
- measurement errors related to the measuring equipment used;
- method errors related to inaccuracies in the definition (standardization) of a particular test method;
- modeling errors in the numerical model used for comparison in diagnostic and acceptance tests;
- environmental errors related to disturbances from changes in temperature or external vibrations unrelated to the load of the tested bridge;
- analysis of the results from the measurements.
The individual errors may be random or systematic. Based on the recognition of error sources, it is possible to estimate the uncertainty of individual elements of the loading test (Guide, 2010).
Figure 1 presents a block diagram of static test loading process during diagnostic tests of a bridge structure with marked sources of the bridge assessment uncertainty, while Figure 2 shows analogous scheme in case of dynamic test loading. The diagrams were developed by analogy or on the basis of the diagram presented in the norm (ISO 18649, 2004).
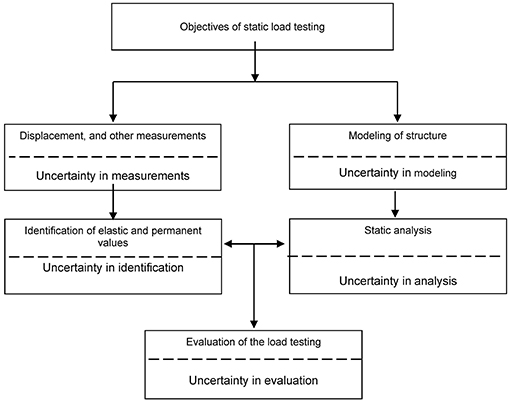
Figure 1. Block diagram of static test loading process during diagnostic tests of a bridge structure; developed by analogy with the diagram from the norm (ISO 18649, 2004).
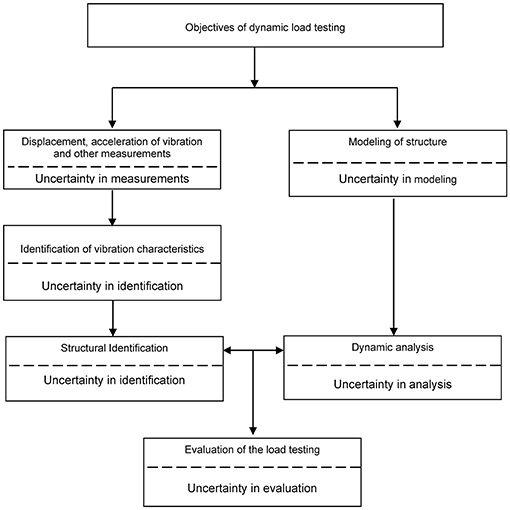
Figure 2. Block diagram of dynamic test loading process during acceptance tests of a bridge structure; developed on the basis (ISO 18649, 2004).
Moon and Aktan (2006) discuss the state of the art related to the structural identification of constructed civil systems. They pointed out that constructed civil systems cannot be isolated from sources of uncertainty during the structural identification process. Dynamic and static load testing is one of common experimental technologies applied for structural identification. In Goulet and Smith (2013) is presented the fact when system identification methodologies are used to interpret measurement data taken from structures, uncertainty dependencies are in many cases unknown due to model simplifications and omissions.
In this article, attention is paid to some errors of the preliminary measurement data analysis that may bring errors in the interpretation of the test results and their comparison to targeted values or values derived from a numerical model. Many of those kinds of errors are not dealt with in other publications.
The notion of measurements uncertainty is relatively well-known and often taken into account. All factors should be taken into consideration while analyzing the uncertainty of tests.
In the case of static tests, load application can last for long time periods and, therefore, the environmental effects with their inherent uncertainty should be considered in the analysis. For dynamic tests, although environmental, and other external effects will almost not affect the results of a particular test, due to the short time of application of the load, other uncertainties regarding the load level, load frequency,… must be considered. This is particularly true in the case that the excitation is achieved by means of vehicle passages or by ambient vibration (wind, ambient traffic,….). Of course, it should be noted that for the particular test at a defined point in time, the dynamic characteristics of the bridge have been determined under specific environmental conditions and may be different under different conditions of temperature and humidity. Therefore, appropriate corrections should be carried out when comparing dynamic parameters obtained in particular tests performed in different times of the year.
The execution of a numerical model to design the test and to analyse the results afterwards is also subject to several uncertainties regarding the mechanical properties of the materials as well as the inherent simplifications assumed in the modeling.
While selecting measurement methods for the static load testing it is important to consider not only the measurements uncertainty, but also the possibilities of making an analysis of the structure's displacements in on-line mode. The load is applied in accordance to a loading scheme and held for a certain time period. The duration of the test and the accuracy of the results will depend on the time the load should be held until stabilization of the outputs. The early removal of the load before the permanent or stationary value is reached can lead to important errors.
At the beginning it is necessary to mention one of the basic rules of metrology—completely accurate measurements do not exist—in practice their results are affected by errors whose sources are of numerous characters. Taylor (1997) points out that errors in scientific measurements are not mistakes, you cannot eliminate them by being very careful. The best you can hope to do is to ensure that errors are as small as reasonably possible and to have a reliable estimate of how large they are.
A measurement makes sense only when the inaccuracy of its result can be determined. It is possible to assess the uncertainty of individual measurements on the basis of recognized sources of errors, and this is widely known and applied (Guide, 2010). Basic error categories related to measurement equipment include:
- assembly errors–resulting from the inaccuracies in assembly of transducers, for example: shifting of measurement points in relation to theoretical ones or non-parallel transducer positioning to the measuring direction;
- instrument adjusting errors (the process of instrument adjusting is often determined as a pre-adjustment calibration)-resulting from application of inaccurate standards (calibrators) or adjusting in the points of measuring range different from real measuring points;
- non-linearity errors–resulting from the deviation of the sensor output curve from straight line specified during adjustment process; that error can be decreased by applying adjustment curve instead of straight line;
- environmental errors–resulting from the uncontrolled influence of the temperature, sunshine or wind to measurement equipment.
The authors' own experience leads to the conclusion that the errors directly related to the measurement equipment are not the basic measurement-related reason of possible inappropriate assessment of a bridge. Other reasons might be more significant, for example those related to environmental conditions or, in the case of displacement measurements, to the selected point of reference (considered as of null displacement).
There are various systems of transmitting the displacements of the examined girder to the point of the sensor location which are used in case of the measurement of displacements and application of mechanical sensors located in the area under the tested span. The most popular ones include:
- a wire attached at one end to a girder and the other end to a spring fixed at the sensor location point,
- a wire attached at on end to a girder, while the other end is loaded with a weight hung at the sensor,
- special scaffolding erected under the bridge where a sensor reaching the girder is mounted.
In the first system, errors were observed resulting from not taking into account the change in the force pulling the wire from the stretched spring and the change in the wire length resulting from that. The errors related to not taking into account the change in the wire length height—all resulting from the changes in temperature—can be observed in all the systems.
In case of the measurement of displacements by geodetic methods considerable errors can result from taking only a tripod (of a total station or a leveling instrument) as a reference point, without control readout of prisms or reference level staff.
Environmental errors are connected with the state of surrounding conditions during the tests. In case of static load tests temperature can have a particular impact on the measurement system as well as on the measured levels. In case of dynamic load tests, any errors caused by temperature changes during the tests can be ignored due to basically short time of the performed tests. However, it should be analyzed carefully the comparison of results from dynamic tests carried out at different times during the year. Temperature and humidity may affect the value of the dynamic parameters that are usually taking for damage detection.
In case of static load testing considerable errors might be also related to an error in determining the bridge stabilization time while identifying the permanent and elastic values (it will be discussed in detail on the example of static tests in chapter 4).
Other errors include the use of simplifications such as determining the deflection of girders only on the basis of the measurement of their displacements without any correction taking into account the displacement of the bearing points. This is important when conducting tests with a considerable level of load (proof loading tests) and comparing the deflection values obtained during the measurements with the calculated values.
In case of dynamic load testing the reasons of possible inappropriate bridge structure assessment are more complex. They result from two sources: one related to the incorrect or simplified method of research/measurements and the other related to the incorrect or simplified analysis of the measurements results. In addition, it should be noted that considerable errors might also be caused by difficulties in distinguishing the global and local responses of the bridge structure. This applies to both methods of research/measurements and methods of measurements results analysis.
The authors' experience shows that in case of measuring the accelerations by means of accelerometers the errors related to wrong selection of filters as well as the influence of local elements vibrations might be of dominating character, as discussed in detail on the first example of dynamic tests in chapter 4).
The last 30 years have been the time of intensive development of digital measurement methods and digital signal processing, which especially contributed to the development of dynamic load testing. The application of the digital measurement methods as well as the digital signal processing can have both positive and negative influence on the results of assessing a bridge structure.
The positive influence can be observed mainly in:
- eliminating the excessive errors connected with “manual” readout of analog devices;
- easier control of the measurement system correctness in order to assess the influence of other factors on the measurement results,
- possibility of applying the digital signal processing methods in order to:
- eliminate the influence of the noise on the registered measurement signals,
- use digital filtration,
- make spectral analysis of the measured signals,
- possibility of applying the innovative measurement methods which make it possible to measure the qualities which were practically unmeasurable by means of analog methods (visual, interference, inertial methods, etc.).
Negative influence, i.e., increased measurement error uncertainty, of applying the digital measurement methods and digital signal processing can be observed, for example, in:
- applying wrong sampling and initial filtration of the measured signals especially in the case of acceleration records,
- creating innovative methods to measure displacements which do not take into account the errors resulting from the location of the point of reference, based only on a device tripod; which is for example essential in case of vision methods (Olaszek, 1999),
- estimation of the quasi-static value on the basis of the displacements registered during vehicle rides at the speeds close to the maximum ones in-stead of the speed of approximately 10 km/h, (crawl test) can result in significant errors, as will be discussed in detail in the second example of dynamic tests in chapter 4.
The presented examples concern practical cases where the use of improper test methods could lead to significant errors in bridge evaluation if not properly detected. The first case concerns static load testing in a highway bridge and shows how significant errors in the bridge evaluation may appear when analyzing the bridge deflection stabilization time while identifying the permanent and elastic values. The next two cases concern dynamic load testing of two railway bridges. The second example shows that in case of measuring the accelerations by means of accelerometers the errors related to wrong selection of filters as well as the influence of local elements vibrations might be of dominating character in the comparison to the results of the analytical calculation. The third example shows how significant errors in the bridge evaluation could appear when estimating the quasi-static value of the displacements registered during train rides at speeds close to the maximum ones instead of the speed of approximately 10 km/h.
The tested bridge consists of three simply supported spans with span length of 29.00 + 21.20 + 29.00 m. It had to undergo repair because of its poor technical condition with destroyed wooden deck and limitation of carrying capacity to 3.5 tones. The structure of the bridge after its repair is shown in Figure 3. The presented case took place at the extreme spans. Each of the spans consist of three steel double-tie girders to which the bottom flanges and cross bars making a grate are added. During repair a composite-reinforced concrete deck slab was made on the steel span girders. All steel joints were designed as friction joints with high strength friction grip bolts (Figure 4).
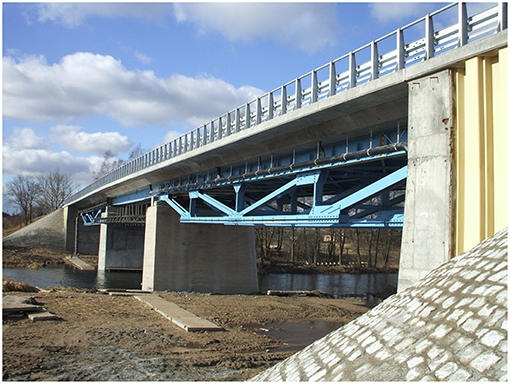
Figure 3. The road bridge view—the extreme span at the foreground; from Olaszek (2015) permission was granted by The Committee on Civil Engineering and Hydroengineering of the Polish Academy of Sciences.
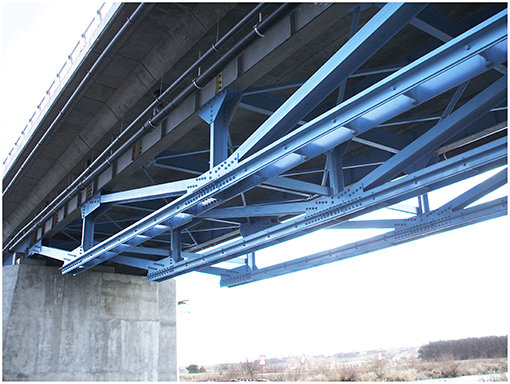
Figure 4. Bottom view of the extreme span–visible details of the added structure during the renovation; from Olaszek (2015) permission was granted by The Committee on Civil Engineering and Hydroengineering of the Polish Academy of Sciences.
During the first static test in the original repaired bridge, significant deflection values were observed at the end span right after two trucks entered the bridge. However, since the registered measured deflection values were considerably lower in relation to the calculated ones, two more trucks were introduced. Because of the registered increment deflection values (Figure 5A), the test was stopped before these values got stabilized. It was possible to determine only the permanent value of the displacement dpv; which attained a very large value.
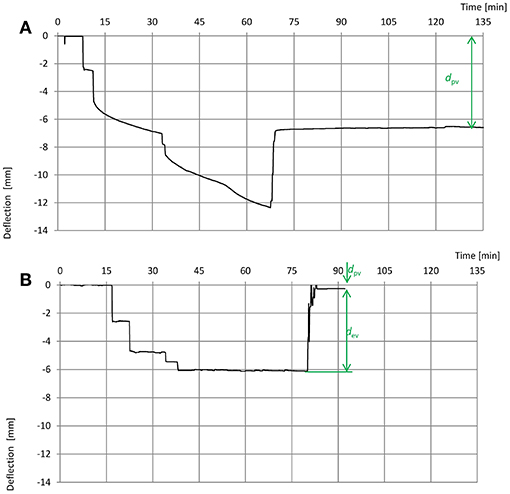
Figure 5. Registered extreme beam deflections in time history: (A) during the first test load; (B) during the test load conducted after the repair. Elastic dev and permanent dpv deflection values are marked.
The correct diagnosis of the observed bridge behavior and the stop of the load test before an irreversible damage was made in the bridge, was given on the basis of continuous and on-line observation of the deflections– time history. Summing up the results from the measurements and the information provided by the Contractor, it could be stated that the Contractor made compression joints with incomplete carrying capacity. Fortunately, the test was stopped and the spans were unloaded. If the process of loading had been continued, clearances between the bolts of friction joints and the holes in structure elements could have disappeared. On the basis of the above analysis the repair of the joints was made—independent welded joints were introduced between structure elements which until that moment had been connected with frictional joints. More details about the load testing and the analysis of inappropriate behavior of the structure are presented in Olaszek et al. (2014b).
A second load test was conducted after the joints had been repaired. Test results proved that after the repair the structure worked properly. Exemplary deflection time history during test load of an extreme span is presented in Figure 5B and it is characterized by a fast stabilization of displacements both after applying a load and after removing it. It was possible to determine the elastic values of the displacement dev and the permanent values of the displacement dpv. In this case, the permanent value of the displacement dpv was very small, close to zero.
In the presented case (the first test loading), we can see an exceptional behavior where significant deflection increments and no tendency of displacements stabilization after the application of the load were observed. On the contrary during the test after repair we can see very fast stabilization of displacements both after applying a load and after removing it. During execution of the static load testing on different type of bridges different speeds of stabilization can be observed. This is a very important factor to take into account in the execution of a static diagnostic load test and the duration of the test and the accuracy of the results will depend on the time the load should be hold until stabilization of the outputs. The early removal of the load before the permanent or stationary value is reached is a common error that can lead to important errors of the test results and adoption of wrong decisions. A more detailed presentation of different speeds of stabilization for different types of concrete and steel bridges is available in Olaszek and Casas (2019).
The first example of the dynamic load testing is a bridge that consists of two structures each one for a single railway line. Each bridge was designed as a steel free-ends truss with parallel chords (Figure 6). Bottom chords consist of two plate girders with composite reinforced concrete ballast pan. The truss structure was welded and riveted. The span length is 93.00 m. Railway track is the characteristic feature of this viaduct, because the track is curved over the whole length of the span with a radius of curvature R = 2,600 m (Figure 7). The problem of modeling dynamic analysis of high-speed trains running over curved in-plan bridges was presented in literature (Xia et al., 2008; Dimitrakopoulos and Zeng, 2015). The presented here example is related to the issue of comparing the measured acceleration values with the values determined analytically. The reliability of this comparison can be assumed if the measured acceleration values correspond only to the vibrations of the structure elements that are included in the calculations. As a rule, dynamic structure calculations do not take into account elements such as railway tracks, barriers, rails, etc. Even if an acceleration transducer is located very carefully, undesired vibrations of the elements excluded from the calculations can be registered. The main vibration frequencies of these elements are as a rule higher than the fundamental frequencies of girders, and reliable comparison to the calculated values can be possible only after using proper filtration of the registered acceleration time history.
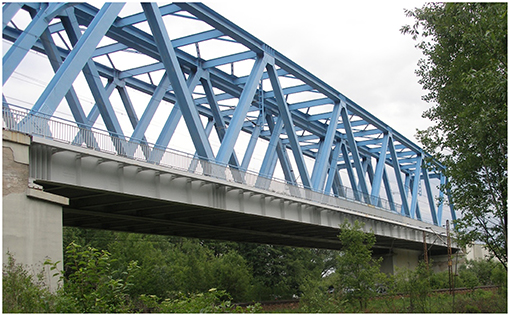
Figure 6. Lateral view of the first presented railway bridge; from Olaszek (2015) permission was granted by The Committee on Civil Engineering and Hydroengineering of the Polish Academy of Sciences.
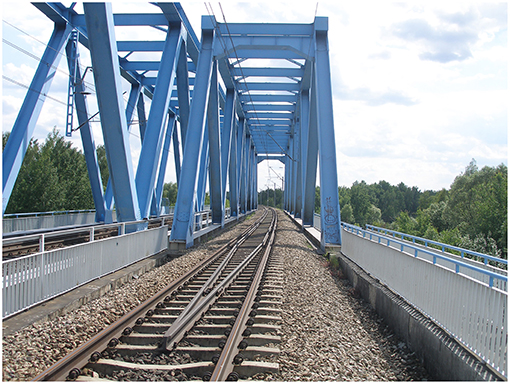
Figure 7. View of the bridge from the railroad level-visible curved railway track; from Olaszek (2015) permission was granted by The Committee on Civil Engineering and Hydroengineering of the Polish Academy of Sciences.
The numerical model of the bridge (Figure 8) was a three-dimensional frame comprised of elements with 6 degrees of freedom in node (Olaszek et al., 2013). All elements of truss and the cross beams of the deck were modeled as 1-D beam elements. The composite reinforced concrete deck was also modeled as a grid of beam elements. The model consists of 249 nodes and 526 elements. The weight of additional components such as ballast, sleepers, track and balustrades was estimated and distributed between the elements of deck model.
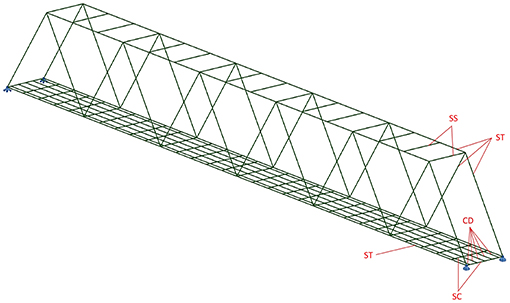
Figure 8. Geometry of the numerical model of the bridge, marked the elements of bridge structure modeled with a 1-D beam elements: ST-element of steel truss, SS-steel strut beam, SC-steel cross beam, CD-element of reinforced concrete deck; (Olaszek et al., 2013) permission was granted by Waldemar Szaniec (author of the model).
The mobile load (inertial, sprung) was modeled as concentrated forces moving on the structure. Due to the fact that horizontal forces should always be combined with vertical railway traffic load, the calculations were executed in two steps. In the first case the calculation was executed for a straight track, and in the second case for curved track with given radius. In the second case the components involved in the action of horizontal forces were added to the vector of vertical action.
The bridge model was calibrated to deflection time histories and later on the accelerations were computed with the calibrated model. It was necessary to predict acceleration time histories to check the maximally acceptable value of the acceleration of the bridge at different speeds of a train (EN, 2003, 2005).
The comparative analysis of the displacement time history measured during a train ride at 200 km/h and determined analytically with the numerical model explained above, shows high compliance of the measurement results with the calculation results–about 99%. The example of measured and calculated time histories of vertical displacements for drive of a special train (two locomotives and four passenger railcars placed between them) with the speed of 200 km/h are shown in Figure 9.
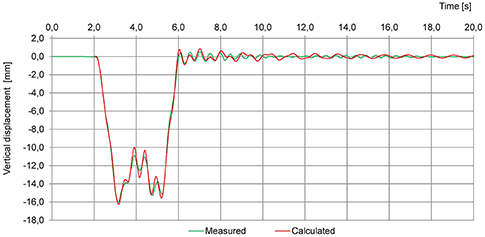
Figure 9. Measured and calculated time histories of vertical displacement for the passage of a special train (two locomotives and four passenger railcars placed between them) at 200 km/h.
Significantly, different compliance appears when comparing the acceleration time history registered and determined with the theoretical model at the same point of the tested structure girder during the same train ride. The ratio of the extreme measured positive and negative acceleration amplitudes to the calculated ones was between 131 and 288% in case of using a 20 Hz Bessel filter signal measurement during the test (Figure 10A). This important difference resulted from the high frequency vibrations in the measured time history (Figure 10B). The most probable reason of the lack of the high frequency content in the calculated acceleration time history is the non-modeling of tracks and barriers. After using a 10 Hz Bessel filter a ratio close to the displacement compliance was obtained—in the range from 103 to 112% (Figure 10C). This example is a proof of the importance of using proper filters while measuring and analyzing the bridge vibration accelerations and also about the need of accurate theoretical models to obtain the predicted values, or, the importance of knowing perfectly the main limitations of the models due to the adopted hypotheses and simplifications of the reality. A more detailed presentation of the importance of using proper filters while measuring and analyzing the bridge vibration accelerations is presented in Olaszek (2015).
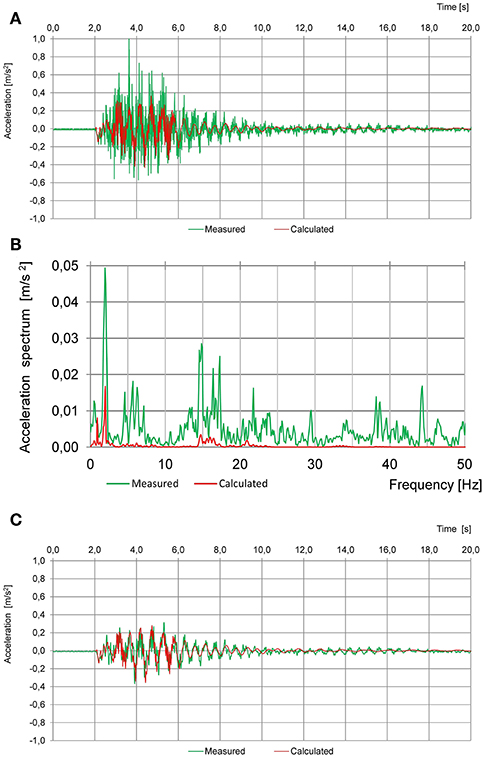
Figure 10. Comparison of the acceleration time history measured during train passage at 200 km/h (the same as in Figure 9) and determined analytically: (A) acceleration measured using 20 Hz Bessel low-pass filter and acceleration calculated without any filters; (B) frequency spectrum from the measured and calculated time history from (A); (C) measured and calculated accelerations after using 10 Hz Bessel low-pass filter.
The second example of the dynamic load testing is also a bridge with two parallel structures each for a single railway line. Each structure is a steel arch bridge with reinforced concrete bridge deck. The span length is 75 m and the height of the arch is 15 m (Figure 11). The hangers are made from steel bars and welded to the arch and tie of the arch (Figure 12). During the acceptance diagnostic load test high values of the dynamic amplification factor were observed, which resulted from the bridge's dynamic susceptibility. The bridge shows a high level of vibration in the hangers both for forced and free vibration cases. An example of the recorded time-histories of the horizontal accelerations of hangers for two passages (10 and 200 km/h) of a special train are shown in Figure 13. We can see there how accelerations largely increase with the speed and also different behavior is observed between along and crosswise accelerations depending on the train speed. Similar excessive vibrations of the hangers caused by resonance during train passages are presented in Andersson and Karoumi (2012).
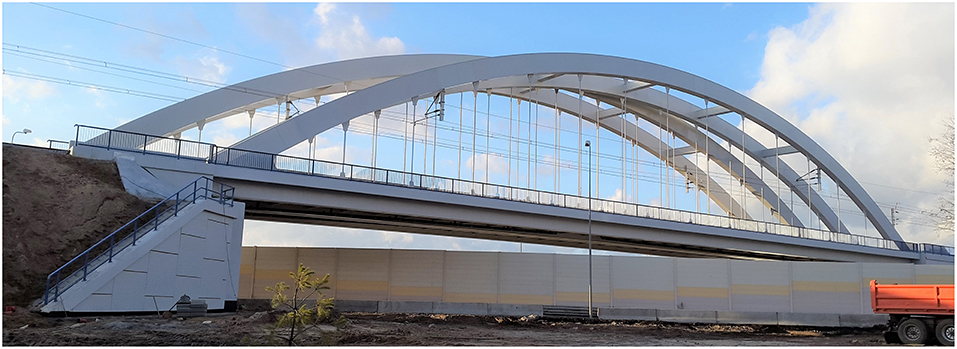
Figure 11. Lateral view of the second railway bridge.
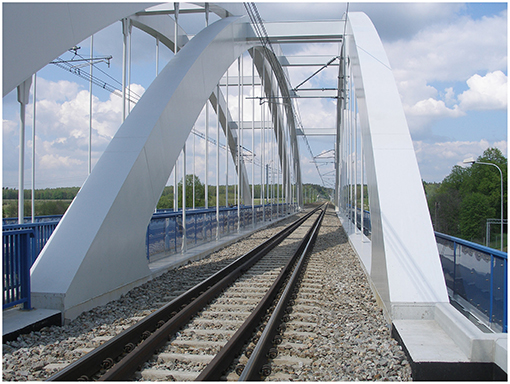
Figure 12. View of the bridge from the railroad level–visible hangers made from steel bars.
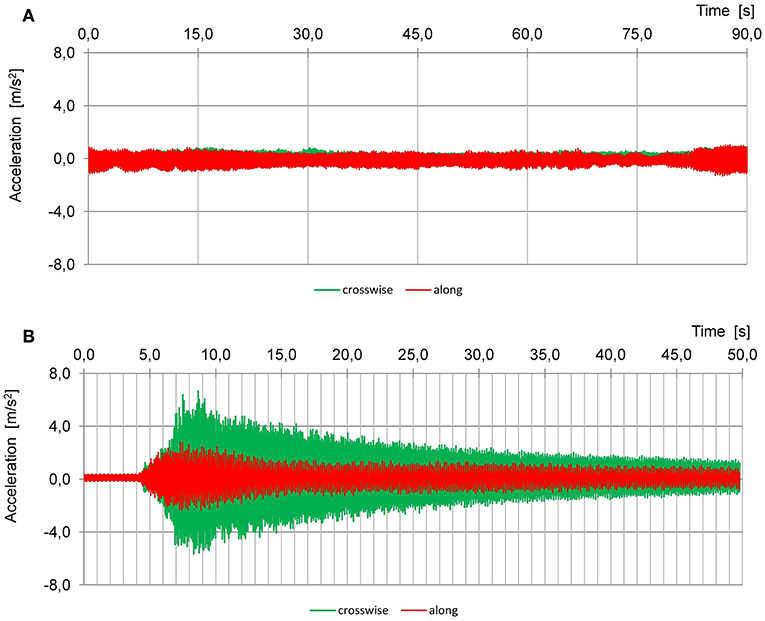
Figure 13. Measured time-histories of the horizontal accelerations of hangers for passage of a special train (two locomotives and four passenger railcars placed between them): (A) at the speed v = 10 km/h, (B) at the speed v = 200 km/h; the directions of horizontal accelerations: crosswise and along are given relative to the track direction.
This example presents a possible application of digital signal processing techniques for extrapolation of measurement results during dynamic testing of high-speed railway bridges. Different methods were tested to estimate the quasi-static value of the displacement on the basis of the displacements registered during the train rides at the speeds close to the maximum ones instead of the speed of approximately 10 km/h. The error of using different alternatives was investigated.
The real values of the dynamic amplification factors dav should be calculated as:
where dvmax is extreme deflection value at speed of vmax and dvsta is extreme deflection value at speed of vsta.
The dynamic tests were conducted using a special train consisting of two locomotives and four passenger railcars placed between them. The train rides were at speeds from vsta = 10 km/h to vmax = 200 km/h, with intermediate speeds of vi = 80, 120, 160, and 180 km/h. The examples of measured time-histories of the vertical displacement at ¼ span length (the point with the maximum deflections) during the train passage with speeds v10 and v200 are presented in Figure 14A.
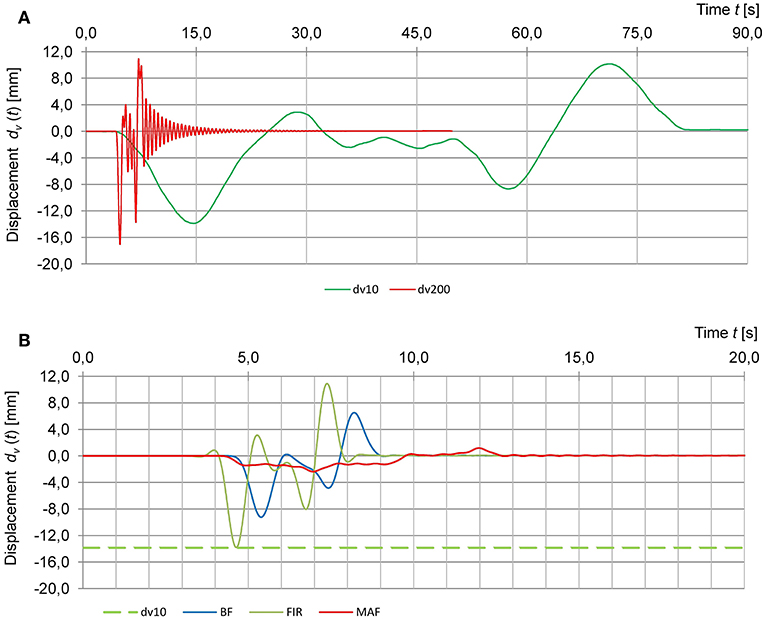
Figure 14. Measured and extrapolated time-histories of the vertical displacements for train passages (the same as in Figure 13): (A) measured vertical displacements at the speed v = 10 km/h and v = 200 km/h; (B) the quasi-static value estimation using the low-pass BF, Bessel filter; FIR, FIR filter; and MAF, moving average filter.
The quasi-static displacement time-history d(vsta,t) was made on the basis of the displacements time-history d(vmax,t) registered during the train ride at the maximum permissible speed vmax = 200 km/h.
In case of road bridges, the method of obtaining quasi static displacements history by means of filtering was presented in Paultre et al. (1992). According to this publication, a low pass digital filter, applied to the recorded data, is used to smooth out the dynamic frequencies in the signal. The filtering can be done with a moving average filter or finite-impulse response filters. The applied filter must have a passband of f pb frequency:
where v is the vehicle speed, L is the span length. The stopband with a cut-off frequency f co must be below the bridge's first fundamental frequency f F1:
In order to analyse the effectiveness of the filtering method in the case of railway bridges, three types of low pass filters, significantly different in frequency characteristics, were tested (Smith, 2003; Lyons, 2011):
- Bessel filter (BF),
- Finite Impulse Response (FIR) filter,
- Moving average filter (MAF).
The results in case of the Bessel Filter, FIR filter and Moving Average Filter were analyzed using the method of successive approximations (filtering using variable cut-off frequency) in order to get no free vibration in the filtered signal. Figure 14B present examples of train passage results obtained after using Bessel, FIR filters and Moving average filter with the cut-off frequencies to get no free vibration in the filtered signal. The extreme level of displacements registered during the train ride at 10 km/h is also shown. The best result (≈0% relative deviation) was obtained by using the FIR filtration and the worst result (−83% relative deviation) was obtained after using the moving average. The dynamic amplification factor determined on the basis of train rides at 10 and 200 km/h was 1.23. After the filtration used to estimate the quasi-static value two filters gave overvalued values of the dynamic amplification factor equal to 1.85 and 7.19 and one estimated value is close to the real value. A more detailed presentation of different methods of extrapolation for dynamic tests in railway bridges is presented in Olaszek and Casas (2019).
As shown in the previous chapters, uncertainty and errors are inherent to the execution and analysis of results from bridge load tests. If this is not taken appropriately, it may derive in wrong decisions regarding the bridge safety (lack of stiffness,….) and/or serviceability (excess of vibration, permanent deflections, dynamic amplification factor,….). The first step to avoid such errors is by knowing them. In this sense, the experience given by a large number executed tests provides a valuable background. The experiences shown in the present paper and others, are of extreme value regarding the adoption of measures in particular tests and finally they may be the basis for the adoption of a Guideline for correct tests execution and analysis. Of course, the final objective would be the derivation of Standards and Codes.
Standardization is an essential element of the tests. Standard (ISO/IEC 17025, 2017), used by research laboratories, specifies the general requirements for the competence, impartiality and consistent operation of laboratories. Research laboratories which want to have their competences confirmed by accreditation issued by an authorized accreditation unit in a given country must apply this norm. Currently, its version of 2005 is in force, and from 2020 its version of 2017 will become effective—which is regulated internationally by ILAC [International Laboratory Accreditation Cooperation (ILAC, 2018)].
Important elements of the Standard (ISO/IEC 17025, 2017) are, among others, related to:
- Personnel;
- Facilities and environmental conditions;
- Equipment;
- Metrological traceability;
- Selection, verification and validation of methods;
- Handling of test or calibration items;
- Evaluation of measurement uncertainty;
- Ensuring the validity of results;
- Reporting of results.
Interlaboratory comparisons are carried out as an important check for assuring the quality of tests and the avoidance of errors. Olaszek et al. (2014a) presented interlaboratory comparisons which enabled to verify the methods of measuring bridge deflections used by laboratories. The examination proved that the system of transmission of displacements of the tested girder to the transducer location point by means of a wire and a weight is appropriate for both static and dynamic load tests, but only in the case of low frequency vibrations. The system does not work in case of higher frequencies of vibrations and strong impulse functions.
The norm was elaborated in order to guarantee the quality of research in all kinds of laboratories. It does not take into account the specifics of bridge load testing. Because of that, a document (Polish Centre for Accreditation, 2017) was developed in Poland which includes specific requirements related to bridge tests, such as:
- scope and requirements for research methods applied to test bridge structures under test loading;
- limit values of measurements uncertainty and required components of a measurements uncertainty budget;
- requirements related to the quality assurance program for laboratory research results;
- standard scope of accreditation in case of tests of railway bridges, road bridges and footbridges;
- required minimal research program in case of railway bridges, road bridges and footbridges.
The document was developed in cooperation with the Accreditation Expert Group for laboratories which carry out tests of engineering structures, especially bridges. The document was reviewed by the Ministry of Infrastructure and Construction, General Directorate for National Roads and Highways and Polish State Railways S.A. Similar initiatives would be of interest in order to eliminate sources of errors both in the acquisition, analysis and comparison of results in bridge load tests carried out by different laboratories worldwide.
The paper presents the practical considerations regarding several sources of error in the execution and analysis of results from static and dynamic load testing of bridges. Attention was paid to different reasons of uncertainty of bridge evaluation during load testing. At the case of measurements, it is possible to assess the uncertainty of individual measurements based on recognized sources of error. The main causes of errors related to different measurement methods are presented.
The use of improper test methods could lead to significant errors in bridge evaluation. This is shown in the three examples of load testing described in the paper. The first case from static load testing shows how significant errors in the bridge evaluation may appear when analyzing the bridge deflection stabilization time while identifying the permanent and elastic values. The next examples are from dynamic load testing. The second one shows how in the case of measuring the accelerations by means of accelerometers significant errors in the bridge evaluation may appear due to wrong selection of filters. The third example shows how significant errors in the bridge evaluation could appear during determination dynamic amplification factor by estimating the quasi-static value of the displacements from records obtained at high speeds.
The application of appropriate international standards or national regulations, based on compendium of experiences as the ones shown in the paper, becomes necessary to correctly manage the uncertainties and errors in bridge load testing and to compare results provided by different agents or laboratories. In fact, the same experimental records can derive on very different testing results due to the application of different techniques. These techniques should, therefore, be properly calibrated to avoid any presence of errors.
Not all aspects from load testing are adequate for standardization. But at least, the standardization should primarily include the load levels, the range and the accuracy of measurements and the methods of preliminary data analysis. Because of different types, situations and state of tested bridges, the standardization is difficult to apply and in some cases could not go beyond the application of sound engineering judgement rules based on the background built after many years of experience.
PO and JC prepared the conception of the paper. PO prepared examples of bridge testing and wrote the first draft of the manuscript. JC wrote sections of the manuscript and edited final revision. Both authors read and approved the submitted version.
The authors declare that the research was conducted in the absence of any commercial or financial relationships that could be construed as a potential conflict of interest.
Many thanks to all colleagues from the Bridge Structure Research Laboratory at Road and Bridge Research Institute for their active participation in the research work and to Waldemar Szaniec from the Kielce University of Technology for providing the results of calculations of the second railway bridge.
Andersson, A., and Karoumi, R. (2012). “Attenuating resonant behavior of a tied arch railway bridge using increased hanger damping,” in 6th International Conference on Bridge Maintenance, Safety and Management (Stresa: Taylor & Francis Group).
Casas, J. R. (2006). “Bridge management: actual and future trends,” in Bridge Management, Life Cycle Performance and Cost, ed. P. J. S. Cruz, D. M. Frangopol, and L. C. Neves (Taylor & Francis), 21–30. doi: 10.1201/b18175-6
Casas, J. R., and Gomez, J. D. (2010). “Bridge capacity assessment by combined proof-loading and WIM data,” in Proceedings of IABMAS'10 (Philadelphia, PA).
Casas, J. R., and Gómez, J. D. (2013). Load rating of highway bridges by proof-loading. KSCE J. Civil Eng. 17, 556–567. doi: 10.1007/s12205-013-0007-8
Dimitrakopoulos, E. G., and Zeng, Q. (2015). A three-dimensional dynamic analysis scheme for the interaction between trains and curved railway bridges. Comput. Struct. 149, 43–60. doi: 10.1016/j.compstruc.2014.12.002
EN 1990:2002/A1 (2005). Eurocode - Basis of structural design. European Committee for Standardization, Brussels.
EN 1991-2 (2003). Eurocode 1: Actions on Structures-Part 2: Traffic Loads on Bridges. Brussels: European Committee for Standardization.
Faber, M. H., Val, D. V., and Stewart, M. G. (2000). Proof load testing for bridge assessment and upgrading. Eng. Struct. 22, 1677–1689. doi: 10.1016/S0141-0296(99)00111-X
Goulet, J. A., and Smith, I. F. (2013). Structural identification with systematic errors and unknown uncertainty dependencies. Comput. Struct. 128, 251–258. doi: 10.1016/j.compstruc.2013.07.009
Guide (2010). Evaluation of Measurement Data-Guide to the Expression of Uncertainty in Measurement. Paris: Joint Committee for Guides in Metrology; International Organization of Legal Metrology.
ILAC (2018). Available online at: https://ilac.org/
Institution of Civil Engineers and National Steering Committee for the Load Testing of Bridges. (1998). Guidelines for the Supplementary Load Testing of Bridges. London: Thomas Telford Ltd.
ISO 18649 (2004). Mechanical Vibration-Evaluation of Measurement Results from Dynamic Tests and Investigations on Bridges. Geneva: International Organization for Standardization.
ISO/IEC 17025 (2017). General Requirements for the Competence of Testing and Calibration Laboratories. Geneva: International Organization for Standardization.
Lyons, R. G. (2011). Understanding Digital Signal Processing. 3rd Edn. Upper Saddle River, NJ: Pearson, Prentice Hall.
Moon, F. L., and Aktan, A. E. (2006). Impacts of epistemic (bias) uncertainty on structural identification of constructed (civil) systems. Shock Vibrat. Digest. 38, 399–422. doi: 10.1177/0583102406068068
Olaszek, P. (1999). Investigation of the dynamic characteristic of bridge structures using a computer vision method. Measurement 25, 227–236. doi: 10.1016/S0263-2241(99)00006-8
Olaszek, P. (2015). Application of Digital Measurement Methods to Bridge Research (in Polish - Cyfrowe Metody Pomiarowe w Zastosowaniu do Badan Mostów). Warszawa, Polska Akademia Nauk Komitet Inzynierii Ladowej i Wodnej.
Olaszek, P., and Casas, J. R. (2019). “Diagnostic load testing of bridges – Background and examples of application,” in Load Testing of Bridges (Structures and Infrastructures) ed E. Lantsoght (CRC Press, Taylor & Francis Group).
Olaszek, P., Cieśla, J., and Szaniec, W. (2013). Investigation of horizontal forces result in railway viaduct with curved truck (in Polish - Badanie skutków oddziaływan bocznych na wiadukcie kolejowym lezacym na łuku). Budown. Arch. 12, 47–54.
Olaszek, P., Łagoda, M., and Casas, J. R. (2014b). Diagnostic load testing and assessment of existing bridges: examples of application. Struct. Infrastruct. Eng. 10, 834–842. doi: 10.1080/15732479.2013.772212
Olaszek, P., Mazanek, M., Janas, L., Salamak, M., and Matysek, A. (2014a). The essence of interlaboratory comparisons - quality of the load tests (in Polish:Istota porównan miedzylaboratoryjnych–jakość badan pod próbnym obciazeniem). Mosty 2, 32–35.
Paultre, P., Chaallal, O., and Proulx, J. (1992). Bridge dynamics and dynamic amplification factors-a review of analytical and experimental findings. Can. J. Civil Eng. 19, 260–278. doi: 10.1139/l,92-032
Polish Centre for Accreditation (PCA) (2017). Accreditation of Research Laboratories Performing Load Testing of Bridges DAB-15. Available online at: https://www.pca.gov.pl/publikacje/dokumenty/pca/dokumenty-dotyczace-laboratoriow-badawczych/ (in Polish).
Smith, S. W. (2003). Digital Signal Processing: A Practical Guide for Engineers and Scientists. Amsterdam: Newnes, Elsevier Inc.
Taylor, J. (1997). Introduction to Error Analysis, the Study of Uncertainties in Physical Measurements. Sausalito, CA: University Science Books.
Wang, N., O'Malley, C., Ellingwood, B., and Zureick, A. (2011). Bridge rating using system reliability assessment. I: assessment and verification by load testing. J. Bridge Eng. 16, 854–862. doi: 10.1061/(ASCE)BE.1943-5592.0000172
Wiśniewski, D., Casas, J. R., and Ghosn, M. (2012). Codes for Safety assessment of existing bridges- current state and further development. Struct. Eng. Int. 22:2. doi: 10.2749/101686612X13363929517857
Keywords: bridges, diagnostic, proof, static, dynamic, load testing, errors, uncertainty
Citation: Olaszek P and Casas JR (2019) Practical Considerations Regarding Results From Static and Dynamic Load Testing of Bridges. Front. Built Environ. 5:11. doi: 10.3389/fbuil.2019.00011
Received: 13 November 2018; Accepted: 24 January 2019;
Published: 11 February 2019.
Edited by:
Eva Lantsoght, Universidad San Francisco de Quito, EcuadorReviewed by:
Pavel Ryjáček, Czech Technical University, CzechiaCopyright © 2019 Olaszek and Casas. This is an open-access article distributed under the terms of the Creative Commons Attribution License (CC BY). The use, distribution or reproduction in other forums is permitted, provided the original author(s) and the copyright owner(s) are credited and that the original publication in this journal is cited, in accordance with accepted academic practice. No use, distribution or reproduction is permitted which does not comply with these terms.
*Correspondence: Piotr Olaszek, cG9sYXN6ZWtAaWJkaW0uZWR1LnBs
Disclaimer: All claims expressed in this article are solely those of the authors and do not necessarily represent those of their affiliated organizations, or those of the publisher, the editors and the reviewers. Any product that may be evaluated in this article or claim that may be made by its manufacturer is not guaranteed or endorsed by the publisher.
Research integrity at Frontiers
Learn more about the work of our research integrity team to safeguard the quality of each article we publish.