- 1College of Engineering, Mathematics and Physical Sciences, University of Exeter, Exeter, United Kingdom
- 2School of Natural and Built Environment, Queen's University Belfast, Belfast, United Kingdom
- 3Department of Civil and Environmental Engineering, Sejong University, Seoul, South Korea
Time synchronization for wireless sensors is important for a proper interpretation of measurements, particularly for acceleration measurements to estimate mode-shapes. This paper presents a new time synchronization method working independently on each node without exchanging time-sync packets among nodes. This stand-alone operation can make field measurement campaigns very time-efficient without constructing and validating the wireless sensor network. The proposed method firstly time-stamps measurements using the accurate time-source from a GPS module on each node, and secondly re-samples the time-stamped data to get time-synchronized data. The time-stamping method proposed in the study utilizes Pulse-Per-Second (PPS) signals and NMEA (National Marine Electronics Association) sentences generated by a low-cost GPS module, and the internal timer/counter unit of Arduino. Error analysis on the proposed time-stamping method was carried out and derived an analytical expression for the maximum variance of time-stamping error of the proposed method. Four experiments have been carried out to observe (1) the long-term operational stability of the GPS module, (2) the accuracy of the PPS signals, (3) the accuracy of the proposed time-stamping method, and (4) the validity of the proposed time-synchronization method for output-only modal analysis on a laboratory floor structure. The GPS module was found to operate or to resume operating stably for the entire test period of 7 days even with the limited field of view to the sky. The relative time errors of two PPS signals from four GPS modules were found to be within ±400 ns. The time-stamping error measured by two identical time-stamping Arduinos for common trigger signals was found to have a standard deviation of 40.8 ns, which agreed well with the maximum value of 42.0 ns predicted by the error analysis. From the output-only modal analysis, the estimated modal parameters were found to agree well with that from the wired acceleration sensors. The phase angle of the cross spectral density of the two wireless accelerations showed that there was no apparent time-synchronization error observable. These observations indicated a successful operation of the proposed time-synchronization method.
1. Introduction
Wireless sensors are highly necessary for a field measurement of a civil infrastructure, to avoid the expensive, time consuming and labor intensive installation of wired sensors. An extensive review on the developmental history of wireless sensors is found (Lynch and Loh, 2006). While wireless sensors have their advantages, they have brought a technical problem during the transition from the wired to the wireless, i.e., time-synchronization among sensors. Time synchronization for wireless sensors is important especially when using high sampling-frequency sensors such as acceleration sensors or dynamic strain sensors to get mode shapes or strain mode shapes correctly (Krishnamurthy et al., 2008; Abdaoui et al., 2017).
Possible time-synchronization methods known to be available are (not limited to): (1) time-sync packet based methods, (2) terrestrial time broadcasting radio based method, and (3) GPS modules based method.
The first approach has been one of the important research topics in the computer science research community (Sundararaman et al., 2005; Sadler and Swami, 2006; Lasassmeh and Conrad, 2010). Notable time synchronization algorithms are Reference Broadcasting Synchronization (RBS) (Elson et al., 2002; Sim et al., 2010), Timing-sync Protocol for Sensor Networks (TPSN) (Kumar and Srivastava, 2003), and Flooding Time Synchronization Protocol (FTSP) (Maróti et al., 2004).
Time synchronization errors of RBS, FTSP, and TPSN were reported to be within 20 μs. However, with the root-based or tree-based topology, their accumulative errors can be up to 5 ms in a period of 6 s (Krishnamurthy et al., 2008). To overcome such accumulation, the consensus-based time synchronization protocols were introduced (Olfati-Saber et al., 2007; Maggs et al., 2012). Compared to the root-based or tree-based time-synchronization, the consensus-based time-synchronization doesn't require a single time reference.
In civil engineering research community, a notable development with a proven time-sync capability is the imote2-based HW/SW system developed by the Illinois SHM Project (http://www.shm.cs.illinois.edu) which implemented FTSP for clock time-synchronization with accuracy of 80 μs and developed the resampling technique for data synchronization (Nagayama and Spencer, 2007; Nagayama et al., 2007). Their research has formed Embedor Technologies (http://embedortech.com) and developed Xnode smart sensors with a real-time operating system (FreeRTOS) on NXP's LPC4357 micro-controller (Spencer et al., 2017). Time-sync performance specification is not available yet, but it is reasonable to expect the same accuracy of 80 μs or better due to the real-time OS reducing uncertainty of task execution timings.
The second approach uses the radio signals sent from time broadcasting radio stations scattered all over the world (Ikram et al., 2010). This approach consumes less power than GPS modules and is not limited to line-of-sight range, but the accuracy is around a few tens of milliseconds, which may be not good enough for acceleration sensor nodes.
The third approach is to use the GPS module's accurate time source, which is a byproduct of the GPS technology. It has been known that the GPS modules can perform time-synchronization with a resolution of 100 ns or smaller (Sazonov et al., 2010). The GPS modules has been commonly used for time-synchronization on wired Ethernet networks, using Network Time Protocol (NTP), or Precision Time Protocol (PTP) (Volgyesi et al., 2017). In the Illinois SHM Project, a GPS module were used on the gateway node for time-synchronization of leaf nodes in the sub-network (Kim et al., 2016). This research is similar with the contents of this paper in terms of using a GPS module and its PPS signals, but only on gateway nodes not each node. This paper uses an Oven Controlled Crystal Oscillator (OCXO) to avoid problems related to the clock frequency fluctuation and achieved an extreme time-stamping accuracy. The direct use of a GPS module on each leaf node has been largely ignored by the research communities due to having a relatively high power-consumption and cost. However, for a short-term vibration measurement campaign on a civil infrastructure, this approach can be a sound option, since power consumption can be deal with using a large capacity battery pack, and a low-cost GPS module, retailing at around 40 USD (as of 2018) which is worth investing in as opposed to expensive and labor intensive wired sensor systems. However, the GPS module based method has a clear limitation that it needs a clear view to the sky for receiving GPS signals. However, this requirement is often satisfied for many field measurement campaigns of civil infrastructures.
Time-synchronization using a GPS module on each node brings a possibility of a highly time-efficient field measurement campaign on an operational bridge under constrains in access time and area. As the proposed time-synchronization occurs independently without sending/receiving time-sync packets among nodes, this approach doesn't require the wireless network to be formed and validated before starting measurement. For long-span bridges, creating and validating the wireless network can be challenging and time-consuming, due to long distances or steel obstacles. This approach provides the place and measure strategy where a sensor node is started to measure just after placement at a designated location. Proper operation of the sensor node can be confirmed by real-time graphs on the screen of the node. By repeating the place and measure strategy for all the sensor nodes, the installation process can be very time-efficient.
In this study, a new standalone time-synchronization method using a low-cost GPS module on each node was proposed. Error analysis on the proposed time-stamping method was carried out, followed by four experiments to validate the proposed time-synchronization method.
2. Theory
2.1. GPS: Accurate Time Source
A GPS receiver apparently estimates the current position of the receiver in Latitude, Longitude, and Height on Earth. However, in the background, the GPS receiver actually tries to estimate not only the three position variables, but also the variable for the time offset between the receiver's internal clock-source and the atomic clocks in the GPS satellites. After a successful estimation, the GPS receiver has an extremely accurate internal clock, synchronized with the atomic clocks in the GPS satellites. This accurate time-source can be used for time-synchronization of wireless sensors installed anywhere with a clear view to the sky.
Each GPS satellite has an atomic clock and all atomic clocks in the GPS satellites are synchronized periodically by the control segment of the GPS, which monitors clock errors and updates them to maintain the accuracy of the GPS system. Each GPS satellite transmits its own unique PRN (Pseudo Random Number) which identifies the satellite itself at the exact start of each millisecond. A GPS receiver on the surface of Earth needs at least four PRNs to fix its position. For more details of GPS theory and operation can be found (Guochang, 2003; Kaplan and Hegarty, 2005).
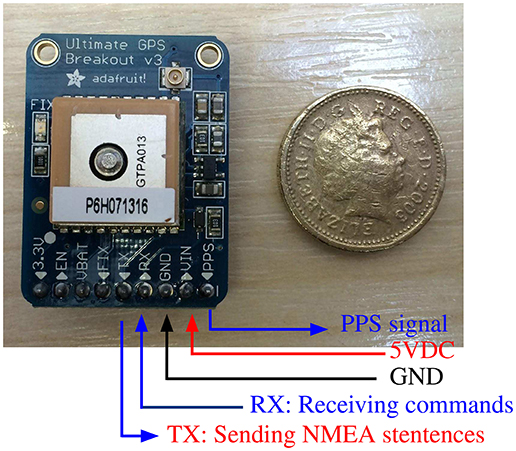
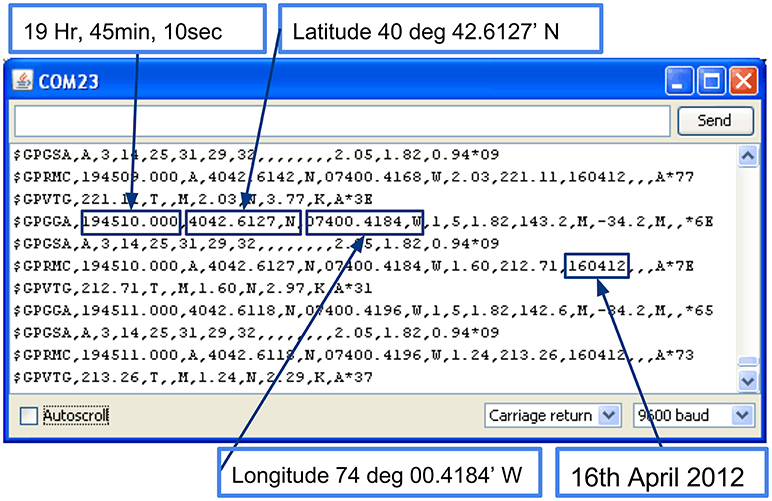
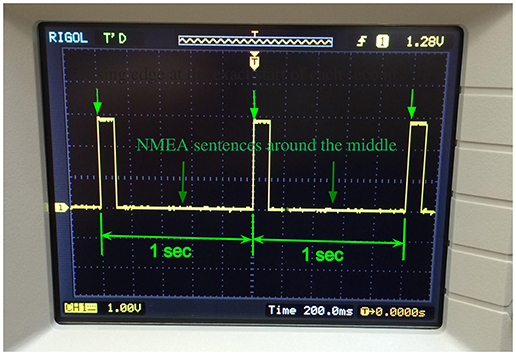
Figure 1 shows the input/output pins of the Adafruit Ultimate GPS v3 module. The RX pin is where the module receives configuration commands from a Micro Processor Unit (MPU): Arduino Mega 2560 in this study. The TX pin is for outputting NMEA (National Marine Electronics Association) sentences from the module to the MPU. NMEA sentences are the standard format for GPS to output results about receiver locations and accurate time as shown in Figure 2. The PPS (Pulse Per Second) pin is where a square wave comes out at the exact start of each second as shown in Figure 3. The square-wave has a high signal for the first 100 ms after the exact start of each second and is repeated every second. NMEA sentences are received roughly in the middle of two adjacent PPS signals, which provides the absolute timing information showing the year, month, day, hour, minute, and second of the current time. By combining the absolute time information from NMEA sentences and the precise relative timing of the PPS signals, it is possible to get a very accurate time-source for time-stamping.
2.2. Arduino: Open-Source Electronic Prototyping Platform
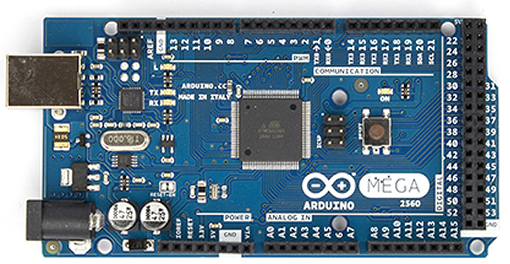
Arduino (http://www.arduino.cc) is an open-source electronics prototyping platform providing several board variants from the simplest Arduino UNO, to the enhanced Arduino Mega 2560 and the Internet of Things YUN. Arduino Mega 2560 is shown in Figure 4. Arduino has advantages over other platforms in terms of its ease of use for beginners. Arduino does not require special hardware for programming, but simply a USB port in a PC. Arduino is cheap (Arduino Mega 2560 board costs around 43 USD as of 2018). Arduino is available with easy-to-use recipe-like instructions on what to buy, what to wire with Arduino, and how to program Arduino for enormous parts and devices including sensors and actuators as well as computer IO devices such as Ethernet, Wifi, and SD memory. Arduino has a large user community where people share their own developments freely, which helps the wide usage and rapid growth of Arduino. The low-cost GPS module used in this study (40 USD as of 2018) also has a recipe-like instruction. Arudino makes it possible for non-electronic engineers to build their own sensor systems by assembling sensors, DAQ, and wireless communication to meet their special needs.
Arduino Mega 2560 has an Atmel ATmega2560 Micro-Processor-Unit (MPU) at its core. A MPU is conceptually a small computer on a single chip with a small programming space, memory space, and special hardware components to enable connection with other integrated circuit (IC) chips of various tasks. ATmega2560 has 256kB Flash Memory for programming, 8kB SRAM for RAM, 16 Analog Input Pins, 54 Digital Input/Output Pins in the clock-speed of 16 MHz. ATmega2560 MPU is limited in computational capability in comparison with modern PCs, but capable enough in many electronics applications such as the time-synchronized acceleration sensors used in this study.
Three useful hardware components in ATmega2560 for this study are UART (Universal Asynchronous Receiver-Transmitter) RX/TX pins, four 16-bit timers/counters, and their input capture units. The UART RX/TX pins are used to communicate with the GPS module. ATmega2560 MPU sends control commands to the GPS module through TX pin and receives NMEA sentences through the RX pin.
The 16-bit timer/counter is an internal memory of ATmega2560 to store a value which starts from zero and increases by one per single oscillation of the crystal oscillator (XO) attached to ATmega2560. As the Arduino Mega 2560 has a 16 MHz crystal oscillator, the value increases by 16 × 106 per second in theory. However, there is a maximum value to be stored for the timer/counter 216 − 1, which is a typical value for a 16-bit timer. Whenever it reaches the maximum, it resets and starts from zero again. By reading a timer/counter value at different times, relative timing information becomes available.
Each 16-bit timer/counter has an input capture unit which has its own internal memory to store the timer/counter value when a pulse signal arrives on the input capture pin. By wiring the PPS output pin of the GPS module to the input capture pin of the timer/counter, a relative timing measurement of the PPS signal becomes available.
3. Proposed Time-stamping Method
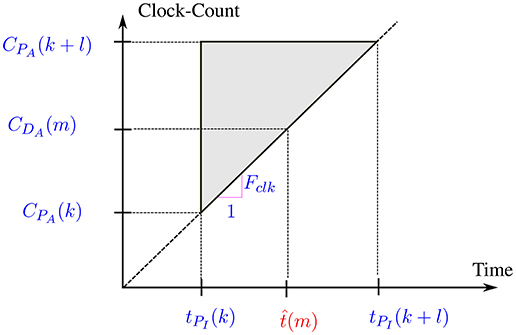
Figure 5 shows the proposed time-stamping method in a simplified way. tPI(k) and tPI(k + l) denote the times of the two ideal PPS signals arriving at the k-th and (k + l)-th second, respectively. Here tPI(k + l) − tPI(k) = l (sec). As discussed in the previous section, tPI(k) and tPI(k + l) can be identified from the NMEA sentences that arrived just before arrival of the PPS signals. In addition, CPA(k) and CPA(k + l) are the timer/counter values captured at the arrivals of the two PPS signals through the input capture unit connected to the PPS output pin of the GPS module. CDA(m) denotes the timer/counter value read at the time of the m-th measurement. Fclk is the clock-frequency of the crystal oscillator. Then the time of the m-th measurement is estimated by the linear interpolation on the two points (tPI(k), CPA(k)) and (tPI(k + l), CPA(k + l)) for CDA(m) as shown in Equation (1).
The procedure for the proposed time-stamping method is summarized as follows.
1. Read the timer/counter value of the input capture unit captured when the k-th PPS signal arrives and store it into CPA(k).
2. Identify the time tPI(k) as 1 s later from the time shown in the NMEA sentence received just before the k-th PPS.
3. Read the timer/counter CDA(m) when the m-th measurement is made.
4. Repeat Steps (1)–(2) when the (k + l)-th PPS signal arrives.
5. Calculate the time of the m-th measurement by linear-interpolation on the two points (tPI(k), CPA(k)) and (tPI(k+l), CPA(k+l)) for CDA(m) as shown in Equation (1).
4. Error Analysis on Proposed Time-stamping Method
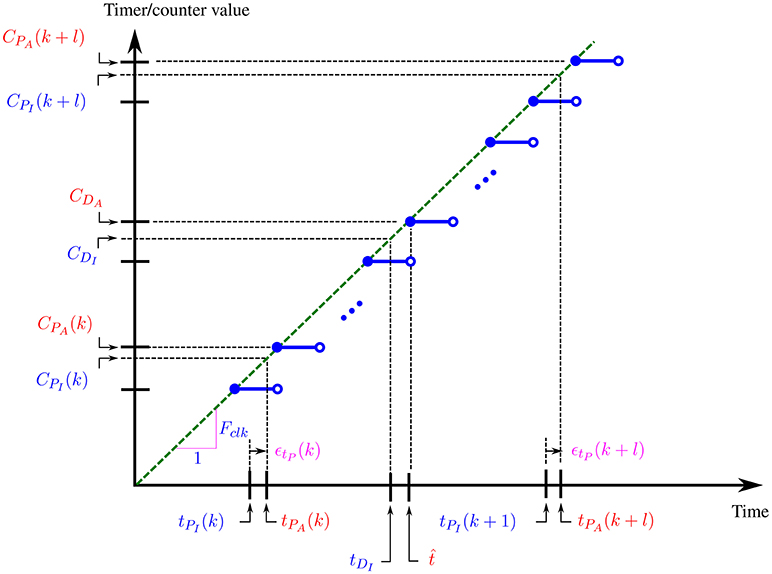
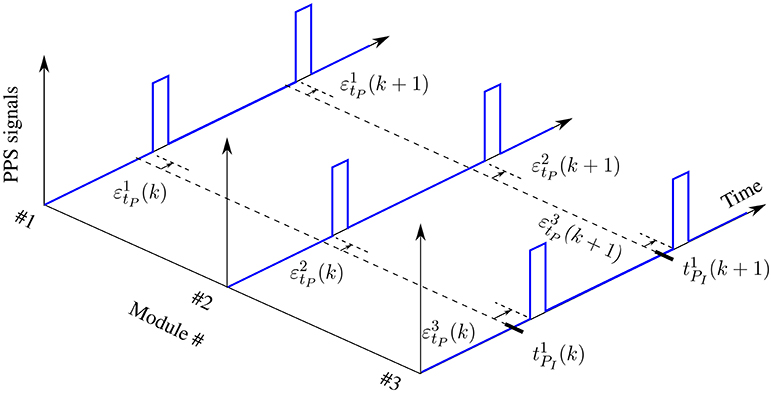
The error of the proposed time-stamping method by Equation (1) is investigated analytically. An ideal GPS receiver produces a PPS signal at the exact start of each second. However, the actual time of the PPS signal at the k-th second tPA(k) can be different from the ideal time tPI(k) by time error εtP(k) as shown in Figure 6 and Equation (2). εtP(k) is assumed to be a random variable having the mean value μtP = 0 and the standard deviation σtP. According to the datasheet of the GPS module used in the study, σtP is known to typically be 10 ns (GlobalTop Technology Inc, 2012).
The timer/counter value of the Arduino is an integer and a discontinuous step function of time as shown in Figure 6. The exact timer/counter value corresponding to tPA(k) needs to be represented in a real value CPI(k) ideally, but in an integer CPA(k) resulting in the timer/counter error εCP(k) as shown in Figure 6 and Equation (3).
where εCP(k) is assumed to be a random variable having a uniform distribution on [0, 1).
For the (k + l)-th time-step, the ideal and actual PPS times, and the timer/counter values have following relationships.
where tPI(k + l) − tPA(k) = l. εCP(k) and εCP(k + l) are assumed to be independent and identically distributed (i.i.d.) random variables and so are εtP(k) and εtP(k + l).
The timer/counter value of the m-th data acquisition ideally needs to be represented in a real value CDI(m), but in an integer CDA(m) resulting in the timer/counter error εCD(m) as follows.
where εCD(m) is assumed to be an i.i.d. random variable with εCP(k).
The detailed error analysis of the proposed method is presented in the Appendix and the main result of the time-stamping error on the m-th measurement is given below.
where A is a constant in the range of (0, 1) as defined in the Appendix.
One assumption of the analysis is that the clock frequency Fclk of the MPU is a constant. It is well-known that the clock frequency fluctuates with ambient temperature change which requires a post-processing to reduce time-synchronization error (Li et al., 2016). However, in this study, this problem was tackled by an Oven Controlled Crystal Oscillator (OCXO) which is a XO in a temperature controlled miniature oven. With a cost of the additional hardware, an excellent time-synchronization performance is achieved without the post-processing.
The mean value of is obtained using μεtP(k) = μεtP(k+l) = 0, and μεCP(k) = μεCP(k+l) = 0.5 as following.
The variance of is
The maximum variance is obtained using (1 − A)2 + A2 ⩽ 1 for 0 ⩽ A < 1, and .
The variance has two sources of uncertainty: the variance of the PPS signals and the variance related to the clock-period 1/Fclk. The standard deviation is known to be 10 (ns) from the datasheet and the standard deviation related to the clock-period is ns based on a 10 MHz OCXO. The maximum standard deviation of combined by the two uncertainties was predicted to be 42.0 ns. This value was compared with an experimental estimation in section 6.3.
5. Resampling Technique and Implementation
In wireless sensor nodes, it is challenging to start and repeat to sample data at the exact times simultaneously among all the sensor nodes, due to deviations of the XO clock frequencies under changing ambient temperature. Alternatively, it may be simpler to allow the wireless sensor nodes to have different starting times with deviations in the sampling intervals, but to resample data on regular time points from accurately time-stamped data. Resampling technique was proposed by Nagayama and Spencer (2007) and Figure 7 shows an illustrative example before and after resampling. In Figure 7A data-sampling starts in different times among the sensor nodes, and data-sampling intervals may have deviations due to that of the XOs. But, resampling can be carried out to have data points at the regular time points, starting from the exact start of a second, repeated with the exact original sampling time-interval. More detail of resampling technique can be found in Nagayama and Spencer (2007).
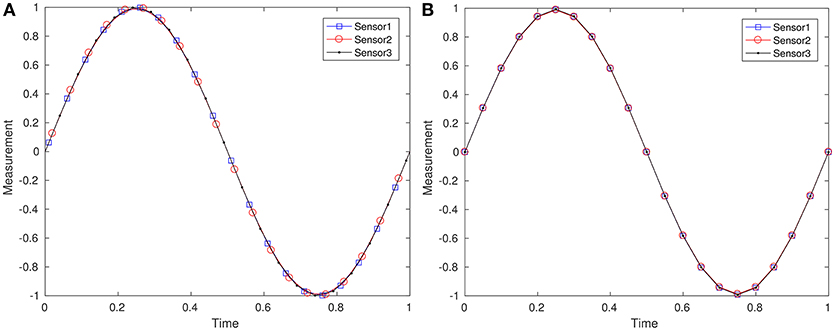
Figure 7. Re-sampling on time-stamped data: (A) before re-sampling with irregular starting times, and (B) after re-sampling.
Implementation of the proposed time-stamping method involves challenges on the resource limited ATmega2560 MPU as well as a high programming complexity. The first challenge was the multitasking to parse NMEA sentences together with reading data from the MEMS accelerometer. If a measured acceleration value is not read by ATmega2560 from the sensor on time, it will be overwritten by the next measured value on the sensor. However, it turned out parsing NMEA sentences takes a long time causing such data-overwritings. This problem was overcome by parsing NMEA sentences only once at the boot time of ATmega2560 and incrementing TPI(k) by 1 s whenever a PPS arrives. The second challenge was the multitasking to read data from the accelerometer together with time-stamping measurements by Equation (1). In the proposed time-stamping method, the time-stamping can be carried out only after the arrival of tPI(k + l). This means all the measurements between tPI(k) and tPI(k + l) need to be stored and time-stamped after the arrival of tPI(k + l) as a block of data for the last l seconds. This involves a relatively complex data management operations as well as a long operation time. To simplify this, the term l/(CPA(k + l) − CPA(k)) in Equation (1) which has the meaning of the inverse of the clock frequency is equivalently estimated by p/(CPA(k) − CPA(k − p)) where CPA(k − p) is the timer/counter value captured at the arrival of the PPS at tPI(k − p). This alternative expression allows the time-stamping immediately after a measurement.
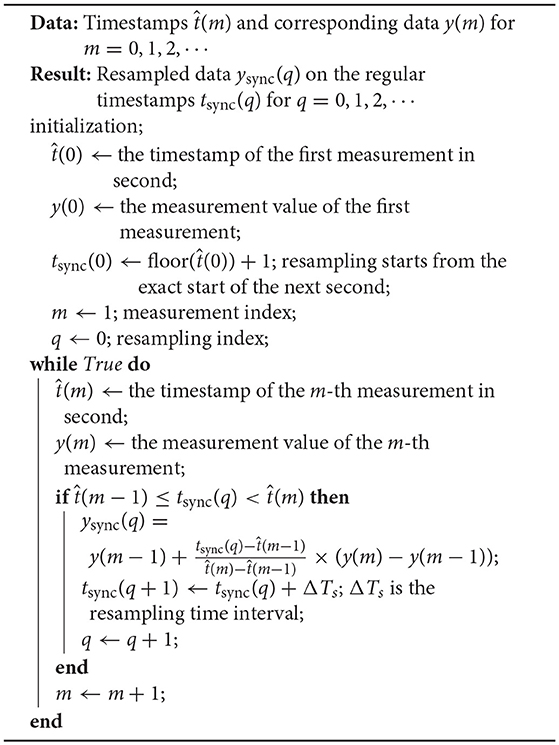
Implementation of the resampling technique was carried out as shown in the pseudocode in Algorithm 1. The inputs were the time-stamped data y(m) on the timestamps for m = 0, 1, 2, · · ·, and the outputs were the resampled data ysync(q) on the regular time-stamps tsync(q) for q = 0, 1, 2, · · ·. An efficient resampling strategy was used by linear interpolation on the most recent two measurements only.
In this study, ATmega2560 was programmed to transmit tPI(0), CPA(k), CDA(m), and y(m) for k, m = 0, 1, 2, · · ·, through the UART TX port wired to a Raspberry Pi and a Python code in the Raspberry Pi receiving UART data was used to perform timestamping and resampling.
This implementation assumes that the sensor nodes have different starting times. After completing a measurement campaign, the resampled timestamps common in all the sensor nodes are identified. Then, the data corresponding to the common timestamps in each node are copied into a single data file to complete the time-synchronized data acquisition. This process can be done over the wireless network if available.
6. Experiments
Four experiments were carried out. The first two experiments were to validate the two fundamental assumptions of the proposed method that (1) GPS modules successfully operates stably to output NMEA sentences and PPS signals during the operation of wireless sensors, and (2) PPS signals are highly accurate. The third experiment was carried out as an attempt to measure time-stamping error. The last experiment was for an output-only modal analysis with the four acceleration sensors where the proposed time-stamping method and their modal parameters were compared with that from the wired counterpart.
6.1. Experiment #1: Long-Term Stability of GPS Module
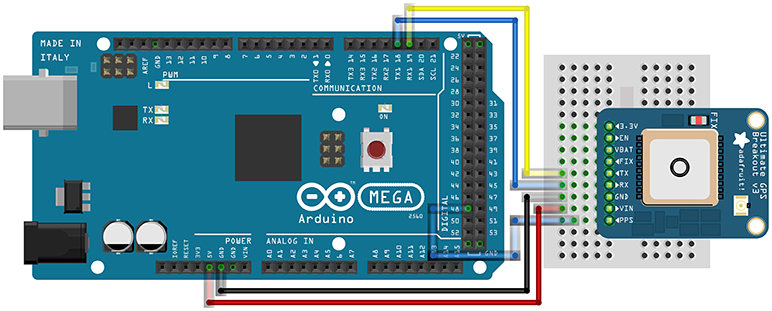
The operation of the GPS module was observed for a week, using an Arduino Mega 2560 connected to the GPS module as shown in Figure 8. The UART TX/RX pins of the GPS modules were connected to the RX/TX pins of the Arduino Mega 2560, while the PPS output pin was connected to an input capture unit of the Arduino. The antenna of the GPS module was installed in such a way that it saw only the southern half of the sky, in order to create a limited visibility which may be encountered in a field measurement campaign. The Arduino was connected to a PC through a USB cable and NMEA sentences from the GPS module were recorded on the PC.
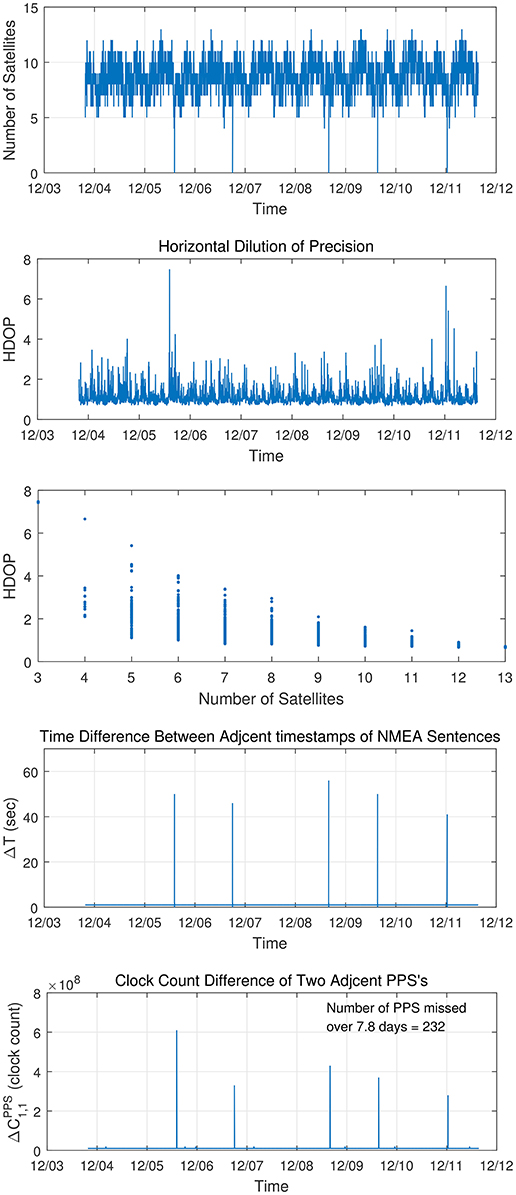
Figure 9 showed various outputs found in the NMEA sentences. The number of satellites visible to the GPS module varied mostly from 4 to 13. There were five occasions where the number of satellites dropped to 0, which may have happened due to the limited visibility. The Horizontal Dilution Of Precision (HDOP) indicates the magnitude of uncertainty about fixing the position and time. A large HDOP indicates large errors in position and time estimates when the number of satellites visible at the time decreases or satellites are densely located in a certain region of sky rather than spread out across the whole sky. The measured HDOP was clearly shown to be inversely proportional to the number of satellites. On the occasions where there were no visible satellites, the GPS failed to fix the location and time, resulting in a rebooting of the module. Then, the GPS module resumed to work properly in about 40–60 s as seen in ΔT and . This observation indicates the importance of having a clear line of sight to the sky for the successful operation of time-stamping by the GPS. However, with the given half visibility to the sky, the GPS module had operated successfully for the entire week, either working or resuming work after a few down-times. In summary, the GPS module showed a relatively robust and reliable operation for the test period even under the limited visibility.
6.2. Experiment #2: Accuracy of PPS Signals
Figure 10 shows the definitions of time errors in PPS signals coming from multiple GPS modules. denotes the time error of the PPS signal from the i-th GPS module at k-th second. Direct measurement of requires an accurate clock source such as an atomic clock. However, in this study, an indirect way of measuring its accuracy was carried out measuring the relative timer/counter differences of PPS signals coming from a single GPS module or multiple GPS modules, as shown in Equations (8)–(9).
where and are the timer/counter values of the i-th GPS module at the (k + 1)-th and k-th time-steps, respectively. is the timer/counter value of the j-th GPS module at the k-th time-step. For ideal error-free GPS modules, and , i≠j, are close to Fclk and zero, respectively.
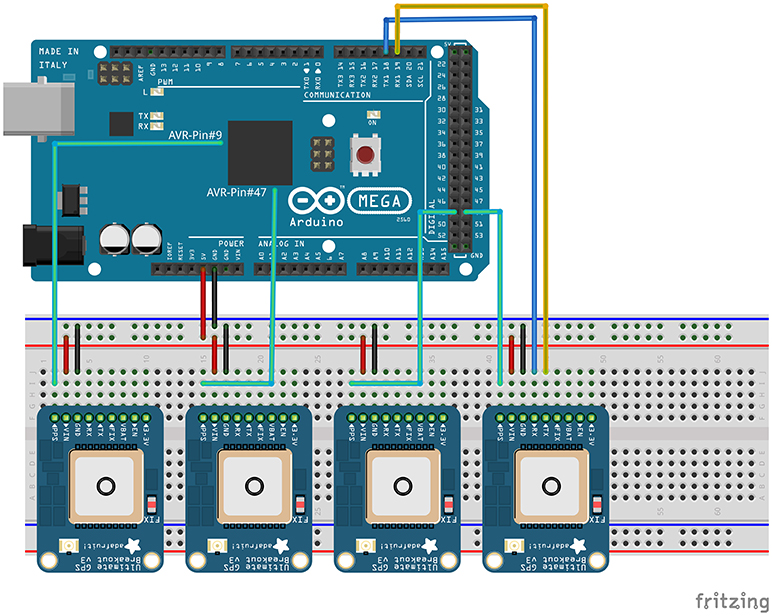
Figure 11 shows the experimental setup. Four GPS modules were attached to a modified Arduino Mega 2560, where the crystal oscillator was replaced by an 10 MHz OCXO which cost was 37 USD as of 2018. This was to minimize measurement inaccuracy due to a clock frequency fluctuation of the XO under ambient temperature change.
Four PPS signal pins were wired to four 16-bit timers/counters of the Arduino to capture the timer/counter value whenever a PPS signal arrives. Figure 12 shows , , and their distributions. The average value was 9,999,927. It was very close to the nominal frequency of the OCXO 10 MHz. As shown in Figure 12, the maximum deviation was found to be 2 clock counts, which corresponds to 200 ns (1 clock count corresponds to 100 ns = 1/10 MHz). Figure 13 showed , and their distributions. It was found that the maximum differences varied from −4 to 2 clock-counts, which corresponds to −400 to +200 ns. These observations showed promising accuracy in the PPS signals.
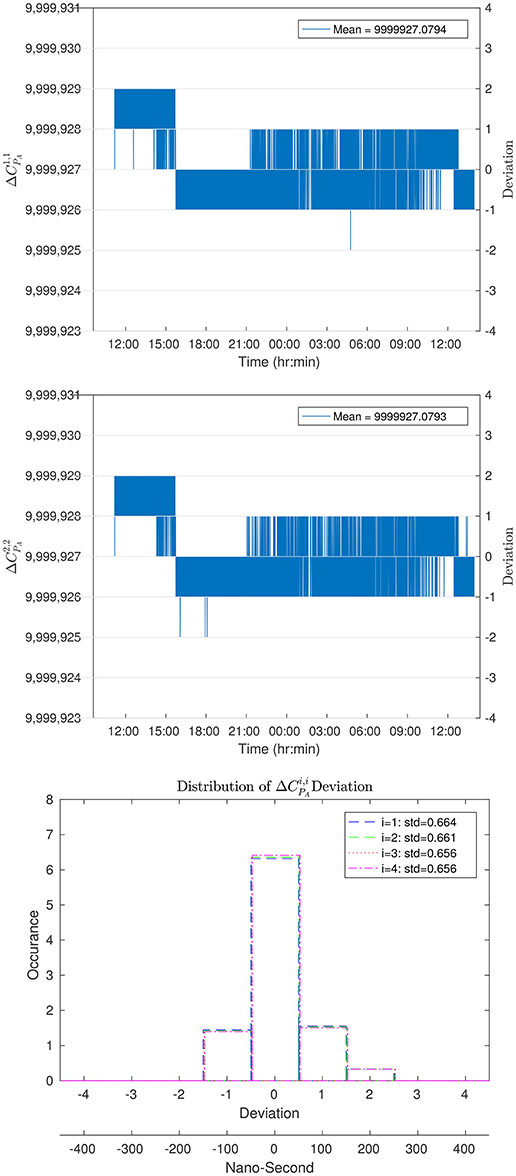
Figure 12. Accuracy of PPS signals from a single GPS module: (top) , (middle) , and (bottom) distribution of deviation for i = 1, 2, 3, 4.
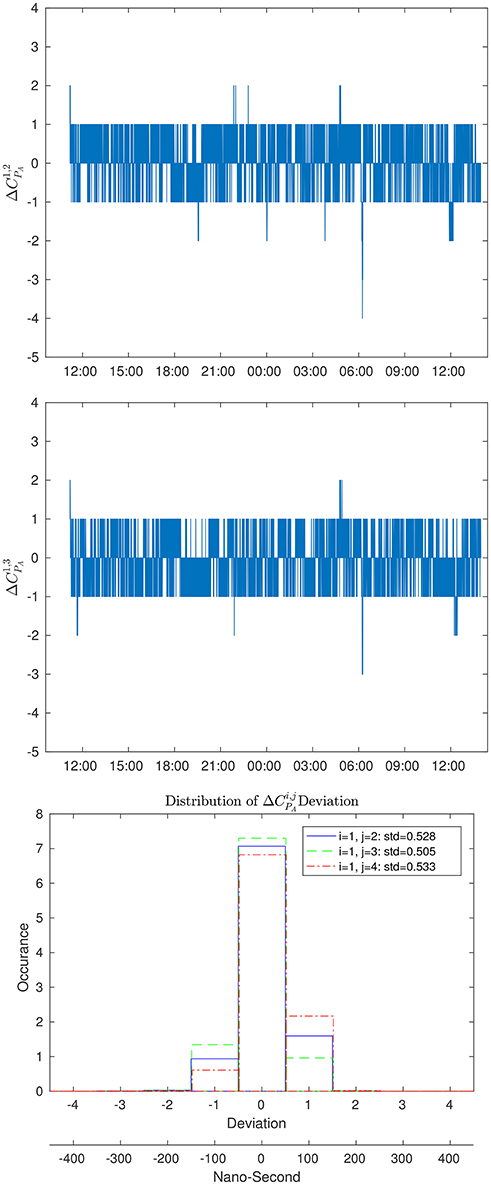
Figure 13. Accuracy of PPS signals between two GPS modules: (top) , (middle) , and (bottom) distribution of deviation for j = 2, 3, 4.
6.3. Experiment #3: Accuracy of Proposed Method on Trigger Signals
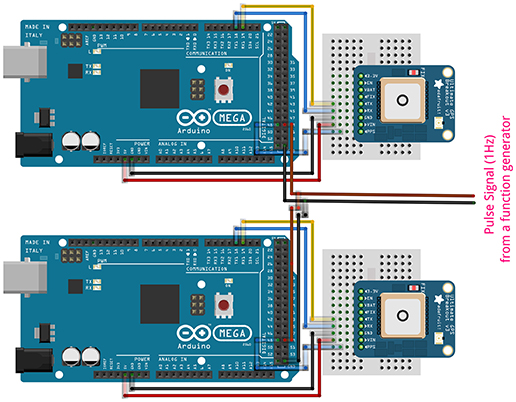
This experiment was an attempt to measure the accuracy of the proposed time-stamping method, in an indirect way. Two identical time-stamping Arduinos were built, each using a GPS module and an OCXO, and common trigger signals generated from a function generator were fed to the two Arduinos, as shown in Figure 14. The function generator produced a trigger signal every second for 30 hours. The time-stamps made for a common trigger signal were compared to estimate the error of the proposed time-stamping method.
The two time-stamps made by the two Arduinos for the m-th trigger signal are denoted by and , and are represented as follows.
The difference between them was the quantity measured in the experiment.
The variance of is represented as follows, based on the assumption that and are i.i.d. with .
The standard deviation of the proposed time-stamping method is estimated as follows.
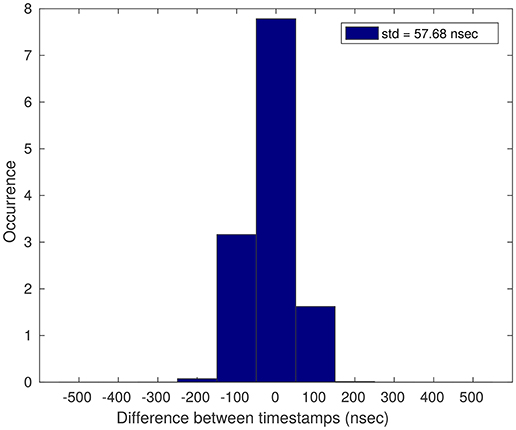
The difference between the two time-stamps was calculated and shown in Figure 15. The standard deviation of was 57.68 ns. Using Equation (12), the standard deviation of the proposed time-stamping method was found to be 40.8 ns. It is worth noting that this value agrees well with the predicted maximum of 42.0 ns by Equation (7) with 3% error.
6.4. Experiment #4: Output-Only Modal Analysis
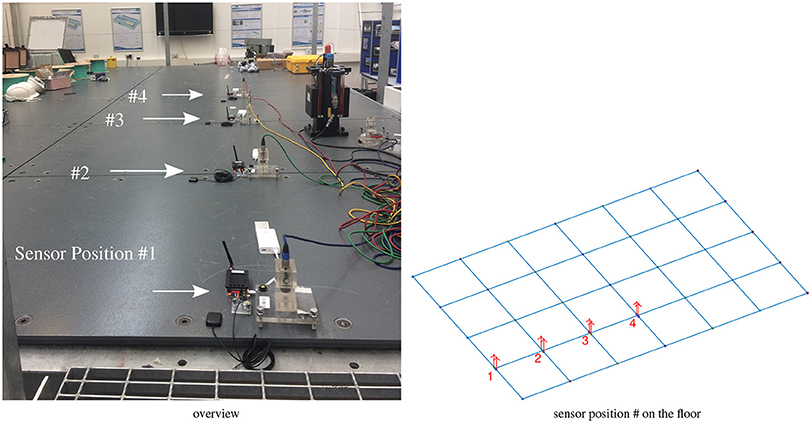
Output-only modal analysis was carried out on a laboratory floor structure (Figure 16) using four wireless acceleration sensors built with the proposed time-stamping method and the re-sampling technique.
Each wireless acceleration sensor uses an ADXL362 MEMS accelerometer as shown in Figure 17. An Arduino Mega 2560 compatible board was developed to integrate the ADXL362 sensor, the GPS module, and the ATmega2560 MPU in a single printed circuit board. The ADXL362 sensor was connected to the Atmel ATmega2560 MPU through SPI (Serial Peripheral Interface). The Arduino Mega 2560 compatible board was sitting on top of a Raspberry Pi 3 Model B (RPI) powered by and communicated through GPIO (General Purpose Input/Output) pins of the RPI. A GPS antenna was connected to the GPS module and a USB battery pack was connected to power the RPI. The battery pack of 20 Ah with 3.85V was able to support more than 10 hours of the system operation consuming roughly 700 mA. For the wired counterpart, four QA700 servo-type accelerometers were used with the Data-Physics Signal Mobilizer DAQ system.
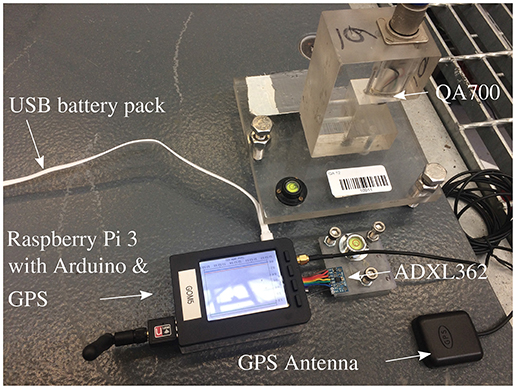
Figure 17. Wireless and Wired sensor: (top-right) wired QA700 accelerometer, and (bottom-middle) wireless ADXL362 MEMS sensor.
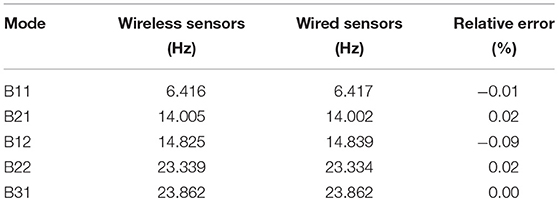
Acceleration response under ambient vibration of human walking was measured for 10 min, using 100 Hz sampling frequency for both wireless and wired sensors as shown in Figure 18. The covariance-driven SSI (Stochastic Subspace Identification) (Peeters and De Roeck, 2001) was used for output-only modal analysis. The results were shown in Table 1 and Figure 19. Table 1 showed that both frequencies were very close to each other. The maximum frequency error was −0.09%. Figure 19 showed that the first four mode shapes agreed well each other, confirming successful operation of the proposed time-stamping method and re-sampling technique.
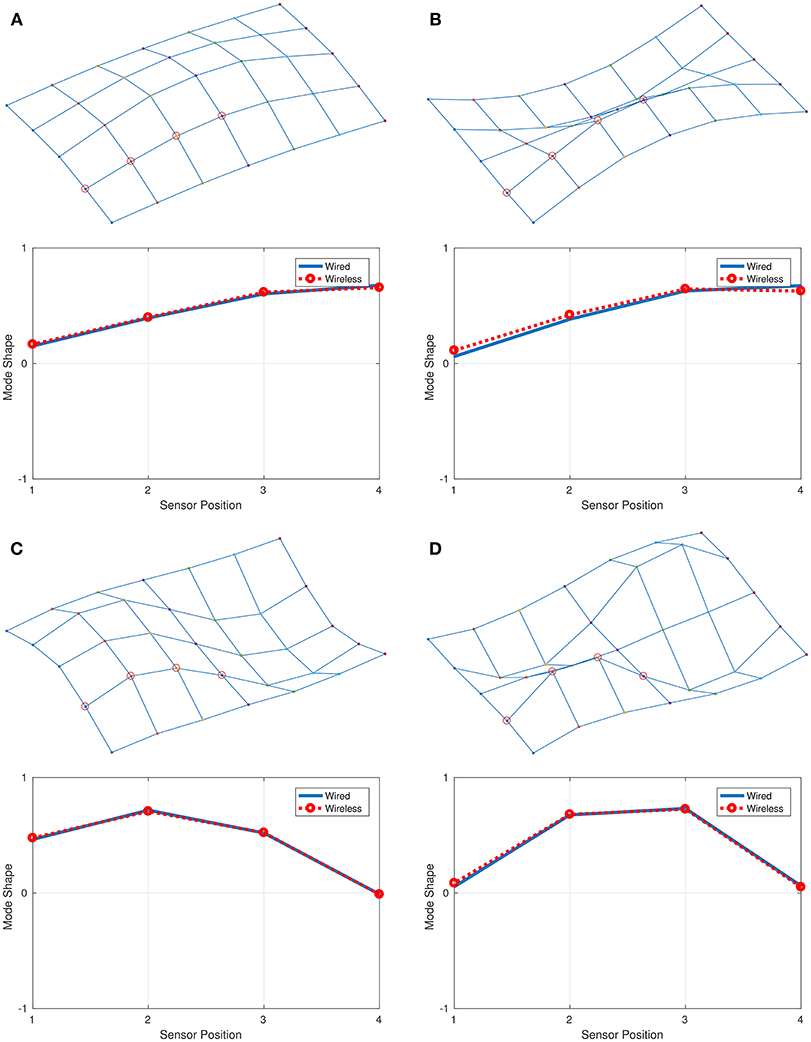
Figure 19. Mode shapes from Wireless sensors and Wired sensors: (A) Mode B11, (B) Mode B12, (C) Mode B21, and (D) Mode B22.
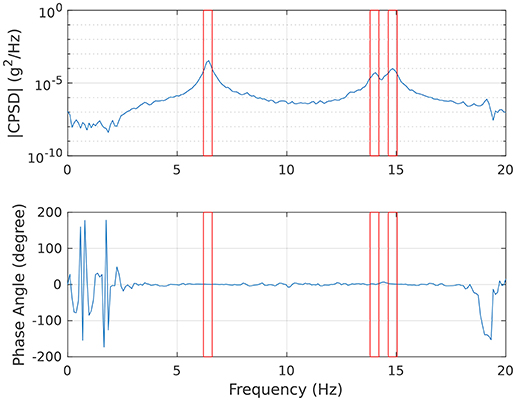
The phase angle of the cross spectral density of two acceleration signals can be used to estimate the time-synchronization error in the signals. A slope in the phase angle is proportional to the time-synchronization error and can be converted to a time-sync error estimation in seconds (Nagayama and Spencer, 2007). This approach requires that the two signals were measured from a common reference clock. However, in this study, the wired and wireless systems were completely independent measurement systems with no common reference clock. Instead, the cross spectral density of the two wireless accelerations from Position #2 and #3 was shown in Figure 20. As shown in Figure 20 there was no linear trend observable, indicating no apparent time-synchronization error between the nodes. The sensors at position #2 and #3 were chosen as they had moderate mode-shape amplitudes away from zero. Fluctuations of the phase angle below 3 Hz and over 18 Hz might be due to the small magnitude of the signals causing a low signal-to-noise ratio.
7. Conclusion
The time-synchronization method for wireless acceleration sensors highly optimal for field measurement campaigns was proposed using the accurate time-stamping built on the GPS technology and the re-sampling technique working independently on each node. Analytical and experimental investigations revealed the following.
• The GPS module was found to be operating reliably, or to resume doing so for the entire seven days of the test-period, even though there was only half the visibility to the sky. However, to minimize down-times, it is recommended to ensure a clear visibility to the sky as much as possible.
• The PPS signals were found to be accurate, with maximum relative time errors of 300 ns for two adjacent PPS signals from a single module and 400 ns for two PPS signals from two different GPS modules.
• The analytical investigation on the proposed time-stamping method derived the expression of the standard deviation of the time-stamping error. The expression revealed two sources of uncertainties: one from PPS signal errors and the other related to the magnitude of the clock-period. The expression predicted the maximum standard deviation of the time stamping error to be 42.0 ns.
• The time-stamping error was measured by comparing two time-stamps made by the two identical time-stamping Arduinos for common trigger signals. The standard deviation of the proposed time-stamping method was estimated to be 40.2 ns which agreed well with the analytical prediction of 42.0 ns with 3% error.
• Output only modal analysis was carried out on a laboratory floor structure, using wireless acceleration sensors equipped with the proposed time-stamping method and the re-sampling technique. Identified natural frequencies and mode shapes agreed well with those from wired acceleration sensors.
• The phase angle of the two wireless accelerations showed that there was no apparent time-synchronization error observable, indicating a successful time synchronization by the proposed method.
Data Access Statement
The research data supporting this publication are openly available from the University of Exeter's institutional repository at https://dio.org/10.24378/exe.1063
Author Contributions
KK: algorithm development, HW development, experimental validation; DH: algorithm development; SK: HW development.
Funding
This work was supported by the National Research Foundation of Korea Grant funded by the Korean Government NRF-2009-352-D00291.
Conflict of Interest Statement
The authors declare that the research was conducted in the absence of any commercial or financial relationships that could be construed as a potential conflict of interest.
References
Abdaoui, A., El Fouly, T. M., and Ahmed, M. H. (2017). Impact of time synchronization error on the mode-shape identification and damage detection/localization in WSNs for structural health monitoring. J. Netw. Comput. Appl. 83, 181–189. doi: 10.1016/j.jnca.2017.01.004
Elson, J., Girod, L., and Estrin, D. (2002). “Fine-grained network time synchronization using reference broadcasts,” in The Fifth Symposium on Operating Systems Design and Implementation (OSDI) (New York, NY), 147–163.
Ikram, W., Stoianov, I., and Thornhill, N. F. (2010). “Towards a radio-controlled time synchronized wireless ensor network: a work in-progress paper,” in Proceedings of the 15th IEEE International Conference on Emerging Technologies and Factory Automation, ETFA 2010 (Bilbao).
Kim, R. E., Li, J., Spencer, B. F. J., Nagayama, T., and Mechitov, K. A. (2016). Synchronized sensing for wireless monitoring of large structures. Smart Struct. Syst. 18, 885–909. doi: 10.12989/sss.2016.18.5.88
Krishnamurthy, V., Fowler, K., and Sazonov, E. (2008). The effect of time synchronization of wireless sensors on the modal analysis of structures. Smart Mater. Struct. 17, 55018–55113. doi: 10.1088/0964-1726/17/5/055018
Kumar, R., and Srivastava, M. B. (2003). Timing-sync protocol for sensor networks categories and subject descriptors. Work.
Lasassmeh, S. M., and Conrad, J. M. (2010). “Time synchronization in wireless sensor networks: a survey,” in Proceedings of the IEEE SoutheastCon 2010 (SoutheastCon) (Concord, NC), 242–245.
Li, J., Mechitov, K. A., Kim, R. E., and Spencer, B. F. (2016). Efficient time synchronization for structural health monitoring using wireless smart sensor networks. Struct. Control Health Monit. 23, 470–486. doi: 10.1002/stc.1782
Lynch, J. P., and Loh, K. J. (2006). A summary review of wireless sensors and sensor networks for structural health monitoring. Shock Vibrat. Digest 38, 91–128. doi: 10.1177/0583102406061499
Maggs, M. K., O'Keefe, S. G., and Thiel, D. V. (2012). Consensus clock synchronization for wireless sensor networks. IEEE Sens. J. 12, 2269–2277. doi: 10.1109/JSEN.2011.2182045
Maróti, M., Kusy, B., Simon, G., and Lédeczi, K. (2004). “The flooding time synchronization protocol,” in Proceedings of the 2nd International Conference on Embedded Networked Sensor Systems - SenSys '04 (Baltimore, MD), 39–49.
Nagayama, T., Sim, S., Miyamori, Y., and Spencer, B. J. (2007). Issues in structural health monitoring employing smart sensors. Smart Struct. Syst. 3, 299–320. doi: 10.12989/sss.2007.3.3.299
Nagayama, T., and Spencer, B. F. (2007). Structural Health Monitoring Using Smart Sensors, Report No. Urbana-Champaign: NSEL.
Olfati-Saber, R., Fax, J. A., and Murray, R. M. (2007). Consensus and cooperation in networked multi-agent systems. Proc. IEEE 95, 215–233. doi: 10.1109/JPROC.2006.887293
Peeters, B., and De Roeck, G. (2001). Stochastic system identification for operational modal analysis: a review. J. Dyn. Syst. Meas. Control 123:659. doi: 10.1115/1.1410370
Sadler, B., and Swami, A. (2006). “Synchronization in sensor networks: an overview,” in Milcom 2006 (Washington, DC: IEEE), 1–6. doi: 10.1109/MILCOM.2006.302459
Sazonov, E., Krishnamurthy, V., and Schilling, R. (2010). Wireless intelligent sensor and actuator network - A scalable platform for time-synchronous applications of structural health monitoring. Struct. Health Monit. 9, 465–476. doi: 10.1177/1475921710370003
Sim, S. H., Spencer, B. F., Zhang, M., and Xie, H. (2010). Automated decentralized modal analysis using smart sensors. Struct. Control Health Monit. 17, 872–894. doi: 10.1002/stc.348
Spencer, B. F., Park, J. W., Mechitov, K. A., Jo, H., and Agha, G. (2017). Next generation wireless smart sensors toward sustainable civil infrastructure. Proc. Eng. 171, 5–13. doi: 10.1016/j.proeng.2017.01.304
Sundararaman, B., Buy, U., and Kshemkalyani, A. D. (2005). Clock synchronization for wireless sensor networks: a survey. Ad Hoc Netw. 3, 281–323. doi: 10.1016/j.adhoc.2005.01.002
Volgyesi, P., Dubey, A., Krentz, T., Madari, I., Metelko, M., and Karsai, G. (2017). “Time synchronization services for low-cost fog computing applications,” in Proceedings of the 28th International Symposium on Rapid System Prototyping: Shortening the Path from Specification to Prototype (Seoul), 57–63.
A. Appendix: Expression of Time-stamping Error of Proposed Method
The time difference between tPA(k + l) and tPA(k) is expressed as
The difference between the timer/counter values CPI(k + l) and CPI(k) is expressed in terms of the clock frequency Fclk of the MPU as follows.
The true time-stamp of the m-th data acquisition CDI(m) is
Note that the term A above is a constant in the range of [0, 1) (see Figure 6).
The proposed time-stamp of the m-th data acquisition in Equation (1) is re-written for convenience.
The term B in the above equation is expressed as
By using the definitions of A and , and the approximation for a small x,
By expanding the above equation and ignoring the 2nd order term negligible w.r.t. the other terms,
The term B is further modified using the approximation on ,
By expanding the above equation and ignoring the cross-terms of εC(·)(·) × εtP(·) negligible to the other terms,
The error of the proposed time-stamping method is
By using tPA(k) − tPI(k) = εtP(k),
Keywords: time-synchronization, wireless sensors, GPS module, Arduino, pulse-per-second signal, NMEA sentence, field measurement system
Citation: Koo KY, Hester D and Kim S (2019) Time Synchronization for Wireless Sensors Using Low-Cost GPS Module and Arduino. Front. Built Environ. 4:82. doi: 10.3389/fbuil.2018.00082
Received: 28 August 2018; Accepted: 14 December 2018;
Published: 23 January 2019.
Edited by:
Ehsan Noroozinejad Farsangi, Graduate University of Advanced Technology, IranReviewed by:
Jian Li, University of Kansas, United StatesBillie Spencer, University of Illinois at Urbana-Champaign, United States
Copyright © 2019 Koo, Hester and Kim. This is an open-access article distributed under the terms of the Creative Commons Attribution License (CC BY). The use, distribution or reproduction in other forums is permitted, provided the original author(s) and the copyright owner(s) are credited and that the original publication in this journal is cited, in accordance with accepted academic practice. No use, distribution or reproduction is permitted which does not comply with these terms.
*Correspondence: Ki Young Koo, ay55Lmtvb0BleGV0ZXIuYWMudWs=
 Ki Young Koo
 David Hester
 Sehoon Kim