 Florin Pavel
- Technical University of Civil Engineering Bucharest, Bucharest, Romania
In this study, two RC frame structures having five stories and nine stories, respectively, are designed using the current Romanian seismic code. The seismic performance is evaluated by integrating the site-specific seismic hazard with the structural fragility. The results show, as expected, a large scatter in the values of the collapse annual rates. The smallest annual collapse rates correspond to sites under the influence of shallow crustal seismic sources, while the largest ones are observed in sites under the influence of the Vrancea intermediate-depth seismic source. In addition, based on the results obtained, a larger seismic risk can be associated to the five-story structure. The study also shows that it is vital to develop a seismic hazard model that captures the long-period spectral amplifications observed at sites in southern and eastern Romania.
Introduction
The recent results obtained within the recently finalized RINTC project in Italy (Iervolino et al., 2017) show annual collapse rates of code-conforming structures which can reach values in excess of 10−3 for L'Aquila which has the highest seismic hazard level among the five considered sites and can be lower than 10−5 for the least hazardous site among the ones considered (Milano).
On the other hand, Luco et al. (2007) have proposed an annual collapse probability of 10% for the ground motion parameter with a mean return period of 2,475 years (e.g., a 10% collapse probability for the code-conforming structures). Liel et al. (2009) have highlighted the influence of the modeling uncertainties and of the height on the resulting annual collapse risk. In another study, Ulrich et al. (2014) have obtained annual failure probabilities of the order 10−5…10−7 for France, depending on the seismic zone in which the structure is situated (lower failure probabilities are assigned to the buildings built in the zones with the lower seismic hazard). On the other hand, Fajfar and Dolsek (2012) computed much smaller collapse probabilities (e.g., 2·10−4) for structures situated in areas characterized by larger seismicity as compared to France.
The seismic hazard of southern and eastern Romania is dominated by the Vrancea intermediate-depth seismic source, while the sites situated in the western part of the country are mostly influence by the local shallow seismic sources. The ground motion amplitudes of the Vrancea intermediate-depth earthquakes appear to decrease much more rapidly with the distance toward the western part of the country (back-arc region), as opposed to the sites situated to the south and east of this source (fore-arc region). Consequently, the slope of the seismic hazard curves is much larger for the sites influenced mainly by the Vrancea intermediate-depth seismic source. A detailed map of the slopes of the seismic hazard curves for various sites in Romania is given in the paper of Pavel et al. (2016). An example of seismic hazard curves for peak ground accelerations for sites situated in the fore-arc region (southern and eastern Romania) and for three sites (situated in the central or western part of Romania) are illustrated in Figure 1. One can easily notice the different slope of the seismic hazard curve, in the sense that the slope for sites situated in the eastern and southern Romania (which are under the direct influence of the Vrancea intermediate-depth seismic source) is much larger, as compared with the other three sites.
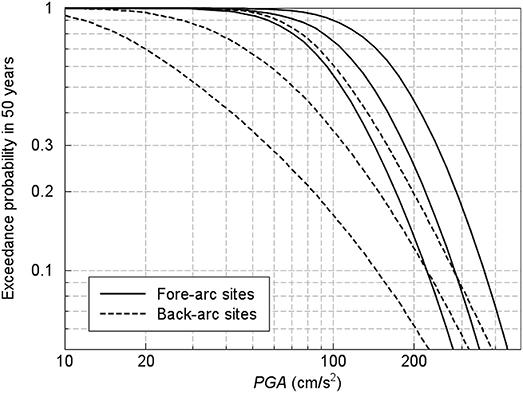
Figure 1. Comparison of hazard curves for PGA for three fore-arc sites and three back-arc sites.
Thus, one might expect different annual rates of exceeding various damage states for a structure situated in the western part of Romania, as opposed to a structure from the eastern part of Romania even though the base shear coefficients (and implicitly the design peak ground acceleration) are similar. Another important observation to be made regarding the seismic hazard of Romania is that the level of uncertainty is much larger (more than two times) for the sites which are influenced by the local shallow crustal seismic source (Pavel et al., 2016).
The computation procedure of the annual collapse rate involves the convolution of the seismic hazard curve with the seismic fragility defined in most of the case through a logarithmic curve. It is obvious that besides the median value of the fragility curve, its standard deviation (slope) which takes into account both epistemic uncertainty and aleatory variability can have a considerable influence of the results.
Consequently, in order to assess the annual collapse rate of code-conforming structures in Romania and in order to further develop the uniform risk approach, recently proposed for Romania by Vacareanu et al. (2018), it was decided to perform an assessment of the annual rates of collapse for two typical RC frame structures designed for the seismic conditions in Romania. Moreover, the impact on the seismic risk metrics of considering the long-period spectral amplifications in the seismic hazard assessment is another focus of this study.
As mentioned before, this paper focuses on the evaluation of seismic performance for two reinforced concrete (RC) frame structures designed for the seismic conditions of Romania. The two RC frame structures have five stories, and respectively nine stories. Since both considered RC structures are doubly-symmetrical, the analyses are performed on a planar frame, which represents an approach commonly used in the literature. It has to be highlighted the fact that this study does not refer to irregular structures, even though Jeong et al. (2012) note that even this type of structures will behave satisfactorily during future earthquakes if they respect the design code provisions.
The seismic zonation of the Romanian territory according to the map shown in the design code P100-1/2013 (2013) consists of seven zones characterized by a peak ground acceleration in the range 0.10–0.40 g (with an increment of 0.05 g between zones) with a mean return period of 225 years (exceedance probability of 20% in 50 years). The design response spectrum is anchored at the design peak ground acceleration and consists of a constant spectral acceleration plateau between the control periods TB (defined as a function of the control period TC) and TC. The soil conditions are taken into account through the values of the control period TC = 0.7 s (hard soil conditions), 1.0 s or 1.6 s (soft soil conditions). The control period TC represents the border between the constant acceleration and the constant velocity domain part of the response spectrum. The largest design peak ground acceleration for sites under the influence of local shallow seismic sources is 0.25 g. A total of 16 combinations of design peak ground acceleration and control period TC were used in the design of each of the two analyzed RC frame structure.
A total of 50 sites from Romania characterized by various combinations of design peak ground acceleration and soil conditions (among the 16 possible combinations) are considered in the analysis. Most of the sites are either under the influence of the Vrancea intermediate-depth seismic source or under the influence of local shallow seismic source, but there are some cases in which both types of seismic sources have significant influence.
Structural Models
The Romanian seismic design code P100-1/2013 (2013) follows to a great extent the Eurocode 8 format (CEN, 2004). The Romanian seismic design code imposes a performance-based approach with two limit states: damage control (SLS – serviceability limit state) and life safety (ULS – ultimate limit state). The strength checks are performed for ULS, while the relative displacement checks are performed for both SLS and ULS. The maximum story drift for the ULS check is limited by the code at 2.5% of the story height irrespective of the chosen structural system. P100-1/2013 (2013) allows the design for three ductility classes, namely high (DCH), medium (DCM) and low (DCL). The new structures are classified into four classes as a function of their importance-exposure. A 40% increase of the design spectral ordinates is required for structures having class I of importance, while for class II of importance structures, the increase of the design spectral ordinates is of 20%.
A behavior factor q of 6.75 (the maximum allowed value) corresponding to ductility class high (DCH) was considered for all the analyzed structures. As such, the only parameter controlling the design seismic force is the site-specific peak ground acceleration. The sizing of the structures takes also into account the limitation of story drifts for both the serviceability limit state (SLS) and for the ultimate limit state (ULS), as well. The mean return period of the seismic action associated to the two limit states is 40 years (probability of exceedance of 72% in 50 years) for SLS and 225 years (probability of exceedance of 20% in 50 years) for ULS. In addition, all the structures must exhibit a ductile failure mechanism, with a strong column-weak beam mechanism and without any shear failures of the elements. The maximum normalized axial force in the columns in the seismic load combination is limited at 0.45. Consequently, the cross-sectional dimensions of the structural elements were dictated by the above-mentioned criteria for all the buildings designed for small peak ground acceleration levels. The drift limit check was particularly relevant for the structures designed in areas characterized by values of the control period TC of 1.0 s and especially of 1.6 s (for which the inelastic spectral displacement amplification factor given in the seismic design code is larger than unity). It is also highlighted the fact that the base shear coefficients used for design range between 3.2 and 12.6% of the building total weight. However, due to the above-mentioned strength and stiffness conditions, the resulting strength of the analyzed structures is larger (as can be observed from the pushover curves).
The two considered RC frame structure have a constant story height of 3.0 m and four spans of 6.0 m. The total height is 15.0 m for the five-story structure and 27.0 m for the nine-story model. The concrete class is C25/30 for the five-story structure and C30/37 for the nine-story structure, while the steel grade is S500 in both cases. The fundamental eigenperiods (computed using half of the stiffness of the RC elements) of the five-story models are in the range 0.71 – 0.97 s, while for the nine-story mode they range from 0.97 to 1.23 s. The cross-sections of the structural elements are reported in Table 1. The cross-sectional dimensions are kept constant throughout the elevation of the structures. Two reinforcement patterns were used for the longitudinal beam reinforcement in the case of the five-story models, while for the nine-story models, three longitudinal beam reinforcement patterns were employed. The percentage of column longitudinal reinforcement varies from the minimum code-prescribed value of 1% and up to about 1.6 % for the structures designed for the largest peak ground accelerations (0.35 g and 0.40 g) and for control periods TC of 1.0 s and 1.6 s. The height of the slab is taken as 15 cm for all the models. The geometry of the structures is shown in Figure 2. The design peak ground acceleration, design spectral acceleration, control period TC and fundamental period of each structure are given for each both the five-story and nine-story models in Table 2.
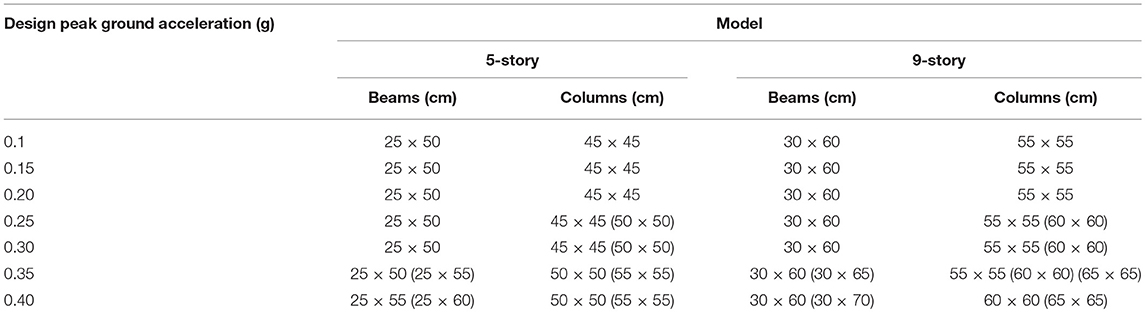
Table 1. Cross sections of the structural elements (the cross-sectional dimensions outside the brackets correspond to sites with control period TC = 0.7 s, while the values in brackets correspond to sites with longer control periods).
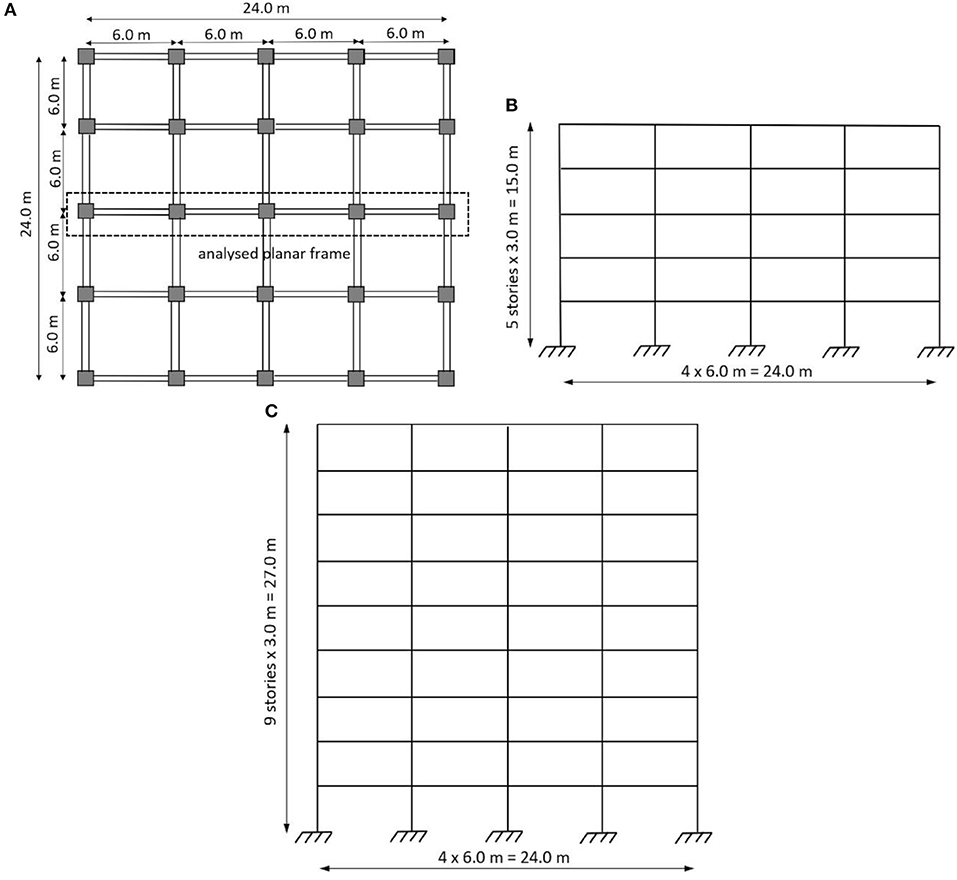
Figure 2. Geomery of the analyzed structures (A) planar view; (B) elevation of the five-story structure and (C) elevation of the nine-story structure.
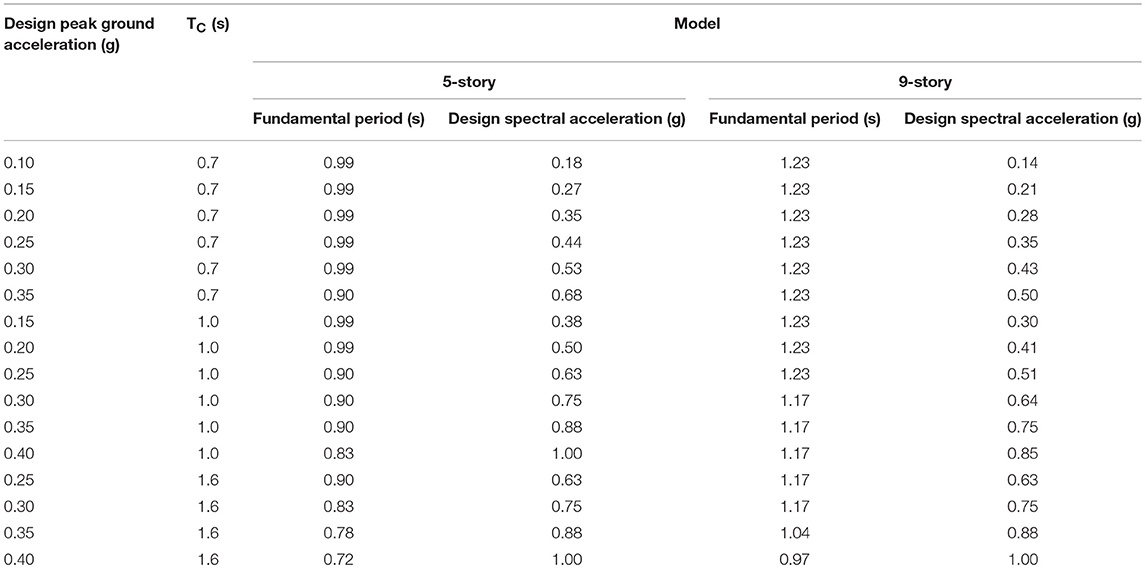
Table 2. Design peak ground acceleration, design spectral acceleration, fundamental eigenperiod, and control period TC for the analyzed structural models.
The fragility functions are constructed using the simplified SPO2FRAG approach proposed by Baltzopoulos et al. (2017) and which is based on the results of the pushover analyses performed on all the structural models. The base shear force—top displacement curve is estimated in an approximate manner using the SPO2IDA algorithm developed by Vamvatsikos and Cornell (2006). Subsequently, the SPO2FRAG tool estimates the logarithmic seismic fragility functions according to the IM (intensity measure)-based procedure by simulating dynamic analysis results via the SPO2IDA algorithm. The IM-based procedure is applied only for the supplied limit states (e.g., in this case the collapse limit state). The parameters defining the lognormal fragility functions (median value and logarithmic standard deviation) were computed for the spectral acceleration associated with the eigenperiod of the equivalent single degree of freedom system.
The pushover analyses were conducted in the Seismosoft (2016) using a load pattern proportional with the deformed shape of the fundamental eigenmode and considering geometric nonlinearity, as well. Inelastic force-based plastic hinges (concentrating the inelasticity at the elements' ends) are assigned for all the structural elements and which were automatically generated from the used-defined material characteristics. The Mander et al. (1988) model was applied for the concrete fibers, while the reinforcement is modeled through a bilinear law. Mean strengths for both the concrete and the reinforcement are considered in the analysis and a load pattern proportional with the first eigenmode. The pushover curves obtained for all the 32 models are shown in Figure 3. The curves which have the largest base shear force capacity correspond to the sites characterized by the largest values of the design peak ground acceleration (i.e., 0.4 g) and control period TC (i.e., 1.6 s).
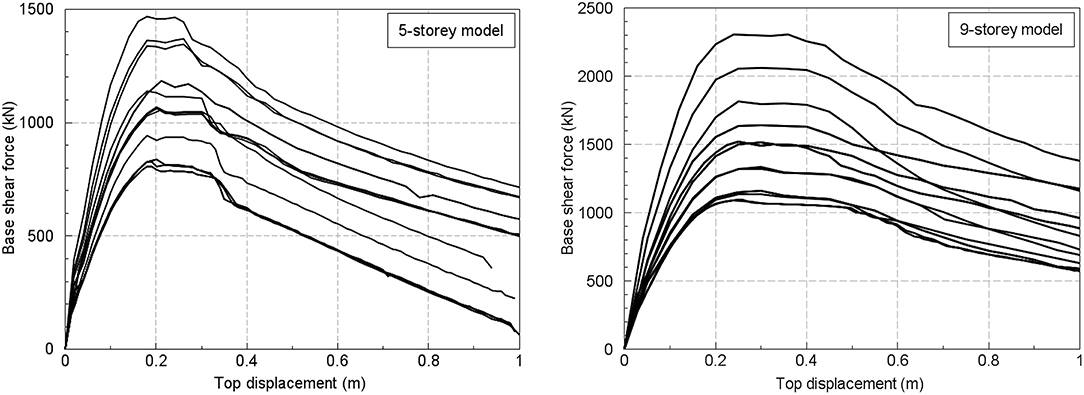
Figure 3. Comparison of the pushover curves for the five-story model (Left) and nine-story model (Right).
One can notice that the ratio between the maximum base shear force and the minimum one is around two for both the five-story and the nine-story models. However, the ratio between the maximum and the minimum base shear coefficient used for the design is much larger (around 6) in both cases. This fact highlights again the previous observation with regard to the sizing of the elements due to minimum requirements given in the seismic design code and which dictate the elements' size (strength and stiffness requirements). In the collapse fragility assessment, the model uncertainty is taken into account by considering it as a normal random variable characterized by a mean value (obtained from pushover analysis) and a corresponding standard deviation. The record-to-record variability can also be taken into account in SPO2FRAG approach, as well (e.g., a value of 0.3 was used as logarithmic standard deviation for the collapse limit state).
Results and Comments
The collapse criterion is defined based on the results of the pushover analysis. In this case, the approach suggested by Camata et al. (2017) is used, namely the collapse drift corresponds to a 50% drop in the pushover curve. It is worth mentioning the fact that these values were in the region of 7–8% for the five-story structure and about 4–5% for the nine-story structure. The deformed shape, as well as the position of plastic hinges for two structural models (one five-story model and one nine-story model) for the considered collapse criterion (described above) is shown in Figure 4. It is worth noting that these values are somewhat larger to the ones given by Federal Emergency Management Agency (2012), namely 5.33% for the first structure and 4% for the second model mainly due to the fact that the displacement drift demands and the overall structural design leads to stiffer buildings in the case of the Romanian practice as compared to US practice. The annual collapse rate is simply obtained as the convolution between the fragility and the seismic hazard, which is the approach used in many studies in the literature (e.g., Jalayer et al., 2007; Douglas et al., 2013).
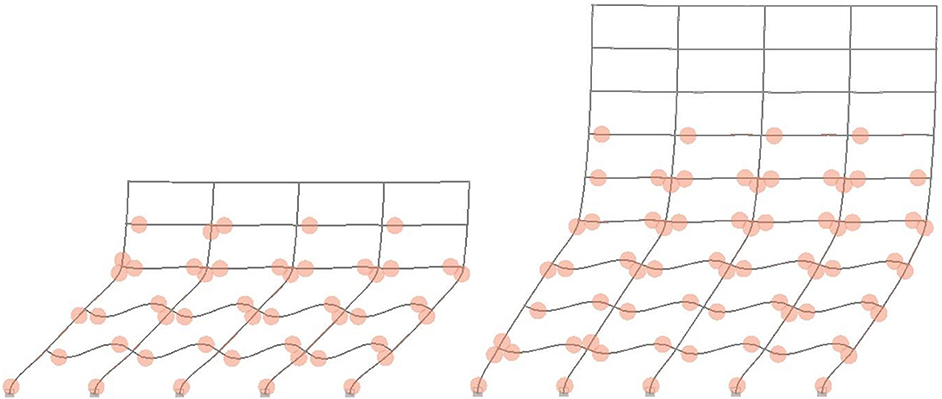
Figure 4. Deformed shaped and plastic hinge formation for the five-story model (Left) and for the nine-story model (Right) for the considered collapse limit state (50% drop in the pushover curve).
The site-specific seismic hazard was evaluated using the results of the probabilistic seismic hazard model developed by Pavel et al. (2016). The sites for which the computations are performed are differentiated into three categories: sites influenced mainly by the Vrancea intermediate-depth seismic source, sites influenced mainly by crustal seismic sources and sites with a combined influence from both types of seismic sources. The results are summarized in Figures 5, 6 as a function of the control period TC and the design peak ground acceleration (values ranging from 0.1 to 0.4 g, as stated in the first section).
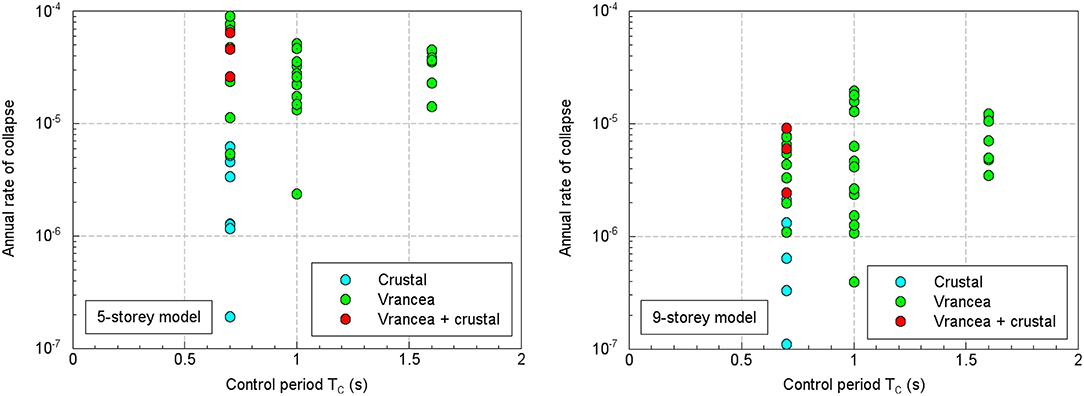
Figure 5. Comparison of annual rate of collapse for the five-story model (Left) and nine-story model (Right) as a function of the control period TC.
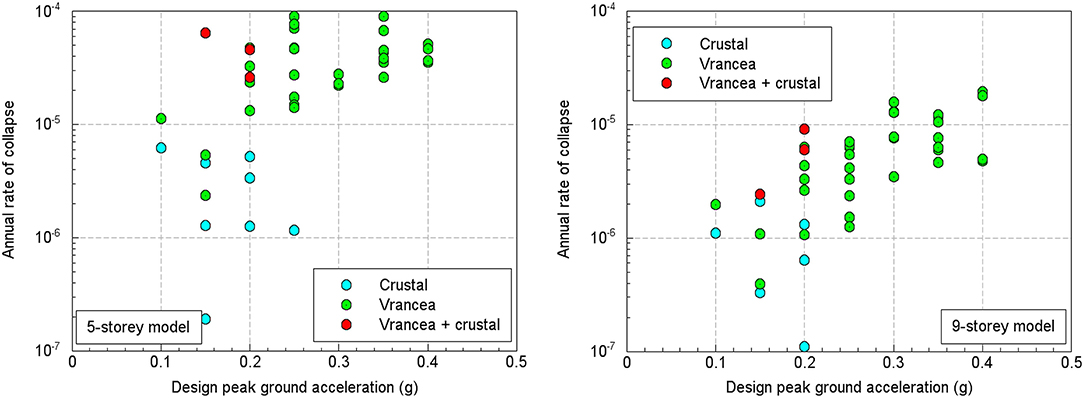
Figure 6. Comparison of annual rate of collapse for the five-story model (Left) and nine-story model (Right) as a function of the design peak ground acceleration.
The results show that the collapse rates are smaller for the nine-story structure as compared to the five-story models, which is basically what one might expect taking into consideration that the spectral ordinates from the uniform hazard spectra decrease with the period. The annual collapse rates appear to show a more consistent trend in the case of the nine-story frame model in the sense that the collapse rates increase with the control period and with the design peak ground acceleration [as also observed for Italy by Iervolino et al. (2017)]. The smallest annual collapse rates correspond to sites dominated by the local crustal seismic sources, while the largest values are found in sites whose seismic hazard is dominated by the Vrancea intermediate-depth seismic source.
Another observation to be made regarding the results obtained is related to the site-specific seismic hazard which does not contain any long-period spectral amplifications (a phenomenon observed from the ground motions recorded in several sites in southern Romania during the Vrancea seismic events of August 1986 and May 1990). In order to overcome this serious shortcoming, Pavel et al. (2018) have developed a ground motion model specifically for Bucharest, derived from both natural and simulated ground motion recordings. A comparison of the uniform hazard response spectra obtained in two studies (Pavel et al., 2016) vs. Pavel et al., 2018) is shown in Figure 6. The latter approach employs the previously discussed ground motion model which is able to take into account long-period spectral amplifications.
The annual collapse rates for the five-story and nine-story model obtained for the seismic hazard computed with the above-mentioned ground motion model are given in Table 3. One can notice the much-larger annual collapse rates and the larger annual collapse rate for the nine-story model as compared to the five-story structure, which represents a result contrary to the one obtained using the seismic hazard model from Pavel et al. (2016). The reason for this issue is clearly visible from Figure 7—the five-story model is much stiffer (and thus it has a larger median capacity) than the nine-story one and in case of almost equal seismic hazard levels for both models (as shown by the uniform hazard response spectrum from Pavel et al., 2018) the parameter controlling the collapse rate is the fragility. In the case of the results based on the seismic hazard from Pavel et al. (2016), the decrease of the seismic hazard levels from one structure to the other is so large that the resulting collapse rate is much smaller for the nine-story model (even though, as noted before, its median collapse fragility is smaller).
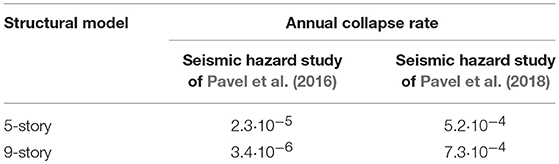
Table 3. Comparison of annual collapse rates for Bucharest using two approaches for seismic hazard assessment.
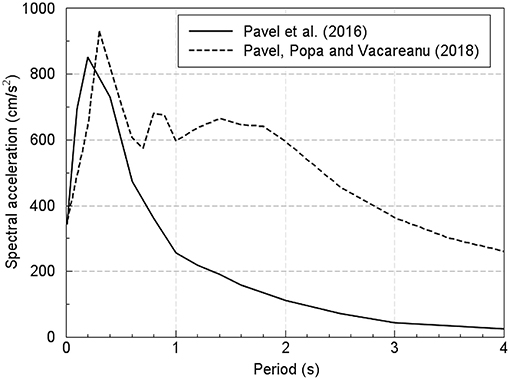
Figure 7. Comparison of uniform hazard response spectra for Bucharest obtained in two studies (mean return period = 475 years).
Consequently, the development of ground motion models and of a seismic hazard model able to capture the long-period spectral amplifications for sites in southern Romania is of paramount importance for the correct assessment of the seismic performance of structures situated in this area. Nevertheless, it should be also noted that the results obtained in this study are based on a very limited database of structural models and they should be confirmed by further analyses performed in the future.
Conclusions
In this study, the seismic performance of two RC frame structures with five stories and nine stories, respectively, and which were designed for the seismic conditions of Romania is evaluated. A total of 32 structures (16 for each height regime) were designed considering all the combinations of design peak ground acceleration and control period TC which represents the upper limit of the constant acceleration plateau of the acceleration design spectrum. The structural fragility is evaluated using a simplified procedure based on the results of the pushover analyses. The results show non-uniform annual collapse rates in the range 10−6-10−4, with values smaller for the nine-story model as compared to the five-story one. Moreover, the smallest annual collapse rates correspond to sites dominated by the local crustal seismic sources, while the largest values are found in sites whose seismic hazard is dominated by the Vrancea intermediate-depth seismic source.
However, if the seismic hazard can consider the long-period spectral amplifications observed at sites in southern Romania during large-magnitude Vrancea intermediate-depth seismic events, the annual collapse rates are much larger and, as expected, the seismic risk is larger for the nine-story model as compared to the five-story structure (in the case of almost similar seismic hazard curves, the fragility dictates the seismic risk metric). Thus, a seismic hazard model able to capture the long-period spectral amplifications for all the sites situated in southern and eastern Romania must be developed in order to make a correct assessment of the seismic performance of structures situated in this area. Also, it appears as evident the fact that the largest uncertainties related to the seismic performance assessment are mainly due to the evaluation of seismic hazard and not to the structural modeling itself. Another limitation of the study is of course related to the small sample of structural models used in the analyses. Nevertheless, an extension of this study is expected in the near future.
Author Contributions
The author confirms being the sole contributor of this work and approved it for publication.
Conflict of Interest Statement
The author declares that the research was conducted in the absence of any commercial or financial relationships that could be construed as a potential conflict of interest.
Acknowledgments
The constructive feedback from two reviewers is highly appreciated as it has led to a much-improved version of the manuscript.
References
Baltzopoulos, G., Baraschino, R., Iervolino, I., and Vamvatsikos, D. (2017). SPO2FRAG: software for seismic fragility assessment based on static pushover. Bull. Earthq. Eng. 15, 4399–4425. doi: 10.1007/s10518-017-0145-3
Camata, G., Celano, F., De Risi, M. T., Franchin, P., Magliulo, G., Manfredi, V., et al. (2017). “RINTC project: nonlinear dynamic analyses of Italian code-conforming reinforced concrete buildings for risk of collapse assessment,” in COMPDYN 2017 - 6th ECCOMAS Thematic Conference on Computational Methods in Structural Dynamics and Earthquake Engineering, eds M. Papadrakakis and M. Fragiadakis (Rhodes: Institute of Structural Analysis and Antiseismic Research; School of Civil Engineering; NationalTechnical University of Athens (NTUA)), 1474–1485.
CEN (2004). Eurocode 8: Design of Structures for Earthquake Resistance - Part 1: General Rules, Seismic Actions and Rules for Buildings. European Standard EN 1998-1, Brussels.
Douglas, J., Ulrich, T., and Negulescu, C. (2013). Risk-targeted seismic design maps for mainland France. Nat. Haz. 65, 1999–2013. doi: 10.1007/s11069-012-0460-6
Fajfar, P., and Dolsek, M. (2012). A practice-oriented estimation of the failure probability of building structures. Earthq. Eng. Struct. Dyn. 41, 531–547. doi: 10.1002/eqe.1143
Federal Emergency Management Agency (2012). Multi-Hazard Loss Estimation Methodology. Earthquake Model–HAZUS MH 2.1. Technical Manual. Washington, DC.
Iervolino, I., Spillatura, A., and Bazzurro, P. (2017). “RINTC project: assessing the (implicit) seismic risk of code-conforming structures in Italy,” in COMPDYN 2017 - 6th ECCOMAS Thematic Conference on Computational Methods in Structural Dynamics and Earthquake Engineering, eds M. Papadrakakis and M. Fragiadakis (Rhodes: Institute of Structural Analysis and Antiseismic Research; School of Civil Engineering; NationalTechnical University of Athens (NTUA)), 1545–1557.
Jalayer, F., Franchin, P., and Pinto, P. E. (2007). A scalar damage measure for seismic reliability analysis of RC frames. Earthq. Eng. Struct. Dyn. 36, 2059–2079. doi: 10.1002/eqe.704
Jeong, S. H., Mwafy, A. M., and Elnashai, A. S. (2012). Probabilistic seismic performance assessment of code-compliant multi-story RC buildings. Eng. Struct. 34, 527–537. doi: 10.1016/j.engstruct.2011.10.019
Liel, A. B., Haselton, C. B., Deierlein, G. C., and Baker, J. W. (2009). Incorporating modeling uncertainties in the assessment of seismic collapse risk of buildings. Struct. Saf. 31, 197–211. doi: 10.1016/j.strusafe.2008.06.002
Luco, N., Ellingwood, B., Hamburger, R. O., Hopper, J. D., Kimball, J. K., and Kircher, C. A. (2007). “Risk-targeted versus currents seismic design maps for the conterminous United States,” in Proceedings of the 2007 Structural Engineers Association of California (SEAOC) Convention (Lake Tahoe, CA).
Mander, J. B, Priestley, M. J. N, and Park, R. (1988). Theoretical stress-strain model for confined concrete. J. Struct. Eng. 114, 1804–1826.
P100-1/2013 (2013). Code for Seismic Design – Part I – Design Prescriptions for Buildings. Ministry of Regional Development and Public Administration, Bucharest.
Pavel, F., Popa, V., and Vacareanu, R. (2018). Impact of Long-Period Ground Motions on Structural Design: a Case Study for Bucharest, Romania. Cham: Springer International Publishing.
Pavel, F., Vacareanu, R., Douglas, J., Radulian, M., Cioflan, C., and Barbat, A. (2016). An updated probabilistic seismic hazard assessment for Romania and comparison with the approach and of the SHARE project. Pure App. Geophys. 173, 1881–1905. doi: 10.1007/s00024-015-1223-6
Seismosoft (2016). SeismoStruct – A Computer Program for Static and Dynamic Nonlinear Analysis of Framed Structures; 2016. Available online at: http://www.seismosoft.com
Ulrich, T., Negulescu, C., and Douglas, J. (2014). Fragility curves for risk targeted seismic design maps. Bull. Earthq. Eng. 12, 1479–1491. doi: 10.1007/s10518-013-9572-y
Vacareanu, R., Pavel, F., Craciun, I., Coliba, V., Arion, C., Aldea, A., et al. (2018). Risk-targeted maps for Romania. J. Seismol. 22, 407–417. doi: 10.1007/s10950-017-9713-x
Keywords: control period, fragility function, seismic hazard, Vrancea intermediate-depth seismic source, annual rate of exceedance
Citation: Pavel F (2018) Collapse Assessment for Code-Conforming Reinforced Concrete Frame Structures in Romania. Front. Built Environ. 4:50. doi: 10.3389/fbuil.2018.00050
Received: 29 March 2018; Accepted: 30 August 2018;
Published: 19 September 2018.
Edited by:
Luigi Di Sarno, University of Sannio, ItalyReviewed by:
Mario D'Aniello, Università degli Studi di Napoli Federico II, ItalyConstantinos Repapis, University of West Attica, Greece
Copyright © 2018 Pavel. This is an open-access article distributed under the terms of the Creative Commons Attribution License (CC BY). The use, distribution or reproduction in other forums is permitted, provided the original author(s) and the copyright owner(s) are credited and that the original publication in this journal is cited, in accordance with accepted academic practice. No use, distribution or reproduction is permitted which does not comply with these terms.
*Correspondence: Florin Pavel, ZmxvcmluLnBhdmVsQHV0Y2Iucm8=