- 1Department of Architecture and Architectural Engineering, Graduate School of Engineering, Kyoto University, Kyoto, Japan
- 2Laboratory for Future Interdisciplinary Research of Science and Technology, Institute of Innovative Research, Tokyo Institute of Technology, Yokohama, Japan
A new method of robustness evaluation is proposed for an elastoplastic base-isolated high-rise building considering simultaneous uncertainties of structural parameters. Since it is difficult to evaluate the robustness of elastoplastic structures due to heavy computational load on the time-history response analysis including elastoplastic response, a double impulse input is used to provide a closed-form solution of the critical response of a single-degree-of-freedom (SDOF) elastic–perfectly plastic structure under a near-field ground motion. Introducing an equivalent elastoplastic SDOF model of a base-isolated high-rise building, the worst combination of uncertain structural parameters, i.e., the stiffness and yield deformation at the base-isolation story and the stiffness of the superstructure, can be derived which leads to the upper bound of the critical elastoplastic response. It is shown that, by using the derived upper bound of the critical response, the robustness function, a measure of the robustness, of elastoplastic structures can be evaluated efficiently. In numerical examples, the robustness of a 30-story base-isolated high-rise building is compared with those of other models with different yield deformations at the base-isolation story to find a preferable design with larger robustness.
Introduction
To enhance the structural safety of buildings, the variation of their structural performances with respect to various uncertainties should be evaluated from the view point of robustness. Uncertainties of design ground motions and structural parameters resulting from various sources, e.g., unpredictability of natural phenomena, material-property variability, initial manufacturing error, aging deterioration of performance, are of great concern in assessing the structural performances. In particular, the isolators, e.g., natural rubber bearing (NRB), used for base-isolated buildings have large variations of structural properties and should be used with careful attention. It is therefore desired to evaluate these variations of structural performances efficiently.
The interval evaluation methods of structural performances based on a probabilistic or non-probabilistic approach have been studied extensively (Ben-Haim and Elishakoff, 1990; Ben-Haim et al., 1996; Qiu and Wang, 2003; Elishakoff and Ohsaki, 2010; Fujita and Takewaki, 2011; Roy et al., 2012; Guo and Li, 2013; Han et al., 2014; Yang et al., 2015, 2017). Furthermore, the robustness evaluation methods have been proposed as advanced methods for evaluating the toughness of structures under various uncertain circumstances. A number of studies on the robustness evaluation methods and its application to the robust design have been discussed for various building models (Kanno and Takewaki, 2006; Matsuda and Kanno, 2008; Takewaki, 2008; Tsompanakis et al., 2008; Fujita and Takewaki, 2012).
A non-probabilistic robustness index, called the robustness function, was introduced by Ben-Haim (2006) based on the so-called info-gap model to evaluate the structural robustness as a quantitative index. The robustness function can be defined as the maximum allowable uncertainty level in parameters to satisfy the specified structural performance demand. In this formulation, the interval parameter is one of the non-probabilistic uncertain-but-bounded parameters based on the info-gap model. By using the abovementioned structural uncertainties and the robustness function, the robustness with respect to various structural performances in various structural models has been investigated so far (Takewaki and Ben-Haim, 2005; Kanno and Takewaki, 2006; Matsuda and Kanno, 2008; Fujita and Takewaki, 2011). Although the robustness using the robustness function has been studied extensively, most object structures were modeled as elastic structures. Since the evaluation of the maximum elastoplastic deformation of structures using time-history response analysis is too time-consuming, a few references can be found in this field.
To take into account the uncertainty of earthquake ground motions in a reliable manner, it may be important to find the critical excitation which maximizes the structural responses. As a simplified pulse-type model of near-fault ground motions, Kojima and Takewaki (2015) introduced the double impulse input and derived the critical input interval, which maximizes the peak elastoplastic response. In the theory of critical double impulse input, a closed-form solution of the critical response, i.e., the maximum elastoplastic displacement, to this critical double impulse input has been formulated for an undamped elastoplastic single-degree-of-freedom (SDOF) model. By using this closed-form solution of the critical elastoplastic response, Kanno and Takewaki (2016) and Kanno et al. (2017) investigated the robustness evaluation method for elastoplastic structures under the simultaneous structural uncertainties. However, since the closed-form solution of the elastoplastic displacement proposed by Kojima and Takewaki (2015) is applicable only to SDOF models, the structural uncertainties are limited to two parameters, i.e., only the fundamental natural frequency and yield deformation.
In this paper, the robustness evaluation method for base-isolated high-rise buildings is presented where simultaneous uncertainties are considered for both the elastoplastic property, i.e., stiffness and yield deformation, of the base-isolation story and the stiffness of the superstructure. The base-isolated high-rise building is treated first as a two DOF model. To apply the closed-form solution of the elastoplastic displacement of an SDOF model, the two DOF model is transformed first into an equivalent elastoplastic SDOF model. The upper bounds of the critical elastoplastic response of the base-isolation story and the elastic response of the superstructure are derived where the worst case scenario of the uncertain structural parameters are investigated in detail. Finally, by applying the derived supremum value of the upper bound of the critical elastoplastic responses to the objective function of the robustness function, the robustness of the base-isolated building is evaluated for several yield deformations at the base-isolation story. It is shown through numerical examples that a preferable design of the nominal yield deformation at the base-isolation story exists in base-isolated high-rise buildings to make the robustness in terms of elastoplastic structural responses larger.
Maximum Elastoplastic Response Under Critical Double Impulse Input
In this section, a simplified response evaluation method used for the robustness evaluation is briefly explained where the maximum elastoplastic response of an SDOF elastic–perfectly plastic structure under the critical double impulse is expressed in closed form.
Kojima and Takewaki (2015) introduced the double impulse to represent the principal part of a pulse-type near-fault ground motion and derived the closed-form maximum elastoplastic response of an SDOF structure by considering the energy balance and the critical timing of the double impulse. Figure 1 shows an example of the double impulse compared with one-cycle sine wave. Let us consider an undamped elastic–perfectly plastic SDOF system with ω and dy as the undamped natural circular frequency and the yield deformation, respectively. The double impulse can be described by the following equation:
where V, t0, and δ(t) denote the amplitude (velocity level) of impulse, the time interval between the first and second impulses, and the Dirac delta function, respectively. It has been shown that there exists the critical time interval for a given input level V, which maximizes the elastoplastic deformation of the SDOF system. In the past study, it was made clear that is the time when the restoring force of the SDOF system after the first impulse becomes 0. Let w(1) and w(2) denote the absolute value of the maximum deformation after the first and second impulses, respectively. Then, the maximum elastoplastic deformation of the SDOF system can be obtained as max {w(1), w(2)}. This maximum deformation is defined as the critical response wc. By specifying and V, uc can be derived from the energy balance as follows:
where Vy is defined as the velocity at which the structure just yields after the first impulse and ω denotes the natural circular frequency of the SDOF system using initial elastic stiffness. Therefore, Vy represents the strength of the SDOF system given by Vy = ωdy with dy being the yield deformation. In Eq. 2, wc is categorized by the input level V. This is because the energy balance equation of the elastoplastic deformation exhibits different situations according to the amplitude of V. By substituting Vy = ωdy in Eq. 2, the inequality equations can be described in terms of either ω or dy. From the observation of the variation of wc, Kanno et al. (2017) showed the monotonicity of wc with respect to ω and the non-monotonicity of wc with respect to dy. Figure 2 shows the variation of wc with respect to dy for a fixed ω. It has been shown that wc can be minimized at w(1) = w(2).

Figure 1. One-cycle sine wave as representative of principal part of near-fault ground motion and double impulse (Rinaldi station fault-normal component, Northridge 1994) (A) acceleration, (B) velocity.
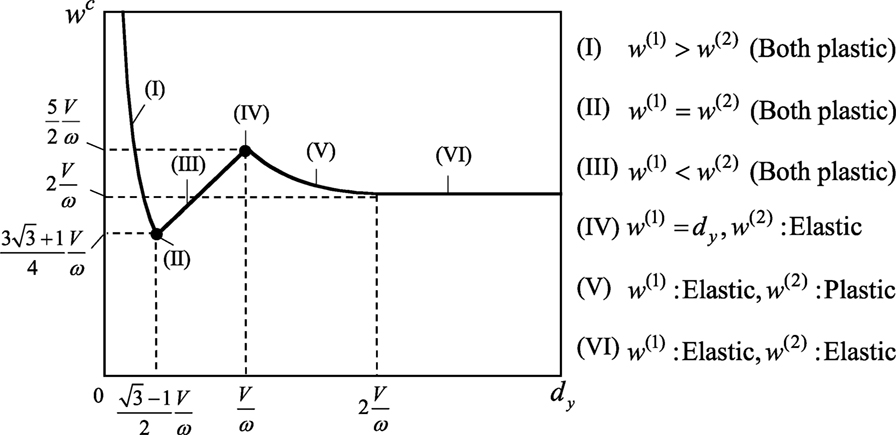
Figure 2. Non-monotonicity property of critical elastoplastic response with respect to yield deformation.
Upper Bound of Displacement of Elastoplastic Base-Isolated High-Rise Building Under Simultaneous Uncertainties in Structural Parameters
To evaluate the robustness of elastoplastic base-isolated high-rise buildings for various uncertainties, it is desired to obtain the maximum structural response without large computational load. Kanno et al. (2017) presented the robustness evaluation method using an SDOF model subjected to the critical double impulse. It was shown that, by using the closed-form solution of the maximum elastoplastic displacement derived by Kojima and Takewaki (2015), the robustness of the SDOF model exhibiting elastoplastic responses can be derived efficiently. However, in the previous study, only two parameters, i.e., the yield deformation and the natural frequency of the SDOF model, were treated as uncertain parameters. To apply the robustness evaluation method using the critical double impulse to a practical building model, a base-isolated high-rise building is considered in this paper.
Relationship between Equivalent SDOF Model and 2DOF Base-Isolated Building Model
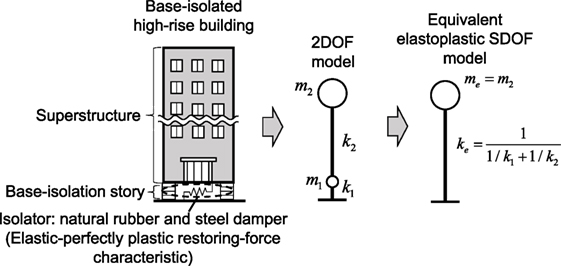
As a simplified structural model of a base-isolated building, a 2DOF model is often used in the seismic analysis where the masses of the superstructure are reduced to a single mass (Naeim and Kelly, 1999). Furthermore, to apply the closed-form solution of the critical elastoplastic displacement as shown in Eq. 2, it is necessary that a 2DOF model is further reduced to an equivalent SDOF model (Figure 3).
Let m1, k1, and dy1 denote the mass, elastic stiffness, and yield deformation of the base-isolation story, respectively. In addition, let m2 and k2 denote the mass and stiffness of the superstructure, respectively. The restoring-force characteristic of the base-isolation story is assumed to be elastic–perfectly plastic. This is a simple model of the combination of natural rubbers and steel dampers. The elastic–perfectly plastic structure model can be regarded as a simplified model with safer margin. This is because the seismic response of the elastic–perfectly plastic model may often be larger than that of the bilinear model considering secondary stiffness. On the other hand, the superstructure is regarded to be elastic due to the seismic response reduction by base-isolation. Since the mass of the base-isolation story is relatively small compared with that of the high-rise superstructure, the mass me of the equivalent SDOF model can be given by m2, i.e., m1 is neglected. The equivalent stiffness ke of the SDOF model can be given as the series model of k1 and k2 by the following equation:
Then, the equivalent natural circular frequency ωe can be obtained as . Therefore, ωe is a function of k1 and k2. A closed-form solution, Eq. 2, for the SDOF model was derived by ignoring the inherent damping. It seems that this approximation provides a larger response than that of the model with the inherent damping. Therefore, the inherent damping is neglected here.
Figure 4 shows the restoring-force relation of the 2DOF model and the equivalent SDOF model. Since the yield forces of those models are the same due to the simplification using a series model, the equivalent yield deformation dye can be derived by the following equation:
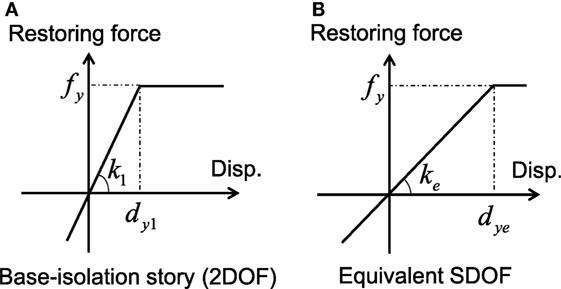
Figure 4. Restoring force–displacement relations of simplified structural models: (A) 2DOF model, (B) single-degree-of-freedom (SDOF) model.
Finally, by substituting ωe and dye of the equivalent SDOF model into Eq. 2, the maximum elastoplastic displacement of the base-isolated high-rise building model subjected to the critical double impulse can be obtained in the closed-form.
In base-isolated high-rise buildings, the investigation on higher-mode effects and overturning effects may be necessary. It should be noted that, while the story shear forces are highly influenced by higher-modes, their effects on the building top displacement and the isolation-story displacement are rather limited. These will be discussed in the future. Because the principal purpose of the present paper is to focus on the robustness analysis of base-isolated high-rise buildings with plastic deformation, a rather simplified model enabling the derivation of closed-form expression of the maximum response is used. The relationship between the 2DOF model and the SDOF model is discussed in Appendix (Taniguchi et al., 2016a,b).
Closed-Form Expression of Upper Bound of Maximum Critical Elastoplastic Response
In this section, the upper bound of the maximum critical elastoplastic displacement wc(ωe; dye; V) of the equivalent SDOF model is investigated with respect to simultaneous uncertainties of k1, k2, and dy1. In the following formulations, the maximum critical elastoplastic displacement for a fixed input level V is treated as a function of k1, k2, and dy1. Therefore, we redefine it as uc(k1; k2; dy1) instead of wc(ωe;dye; V) in Eq. 2. While the maximum displacement uc means the maximum value with respect to time, the upper bound of uc represents the maximum value of uc in the structural uncertainties.
The uncertain parameters k1, k2, and dy1 are given by the interval parameters based on the info-gap model (Ben-Haim, 2006). The interval parameters k1, k2, and dy1 are bounded in terms of the upper and lower bounds of each parameter as follows:
where the upper and lower bar symbols denote the upper and lower limits, respectively, of the interval parameters.
To derive the upper bound of uc with respect to simultaneous uncertainties of k1, k2, and dy1, it is important to understand first the property of uc with respect to the variation of k1 and k2. In Eq. 2, wc (uc in this section) can be regarded as an increasing function of 1/ω in all categories. Therefore, if dye is fixed as a constant value during the variation of k1 and k2 in Eq. 2, it is evident that uc decreases with respect to the increase of ω. Furthermore, since ∂ke/∂k1 = (k2/k1 + k2)2 > 0, ∂ke/∂k2 = (k1/k1 + k2)2 > 0 are derived from Eq. 3, the monotonicity of ωe with respect to k1 and k2 can be obtained as ∂ωe/∂k1 > 0, ∂ωe/∂k2 > 0. From above investigations on the monotonic properties of uc with respect to ω(=ωe) and ωe with respect to k1 and k2, the relationship between uc and k1, k2 for fixed dye can be derived as follows:
Although dye defined by Eq. 4 can be regarded as a function of k1 and k1, dye can be understood as a constant value by choosing dy1 appropriately within the interval in Eq. 5c. From Eq. 6a, b, it can be observed that uc increases when k1 and k2 decrease for any fixed value of dye. This monotonicity of uc can be used to derive the upper bound of uc with respect to the variation of uncertain parameters k1, k2, and dy1. It should be noted that this monotonicity of uc is not applicable to actual ground motions with randomness.
Consider the interval of the equivalent yield deformation dye. This is because uc may be non-monotonic function of dye and it is useful to deal with dye directly in the uncertainty analysis. The upper and lower bounds of dye with respect to the interval parameters k1, k2, and dy1 can be derived from the interval arithmetic well known in the interval analysis as follows:
In Eq. 7, the variation of dye is limited by the upper and lower bounds. We suppose that three intervals of the interval of dye, called the intervals I–III, can be categorized as follows:
where the lower bound of interval I coincides with that of the whole interval of dye in Eq. 7 and the upper bound of interval III coincides with that of interval of dye.
First, we consider the upper bound of uc in interval II. Since the upper and lower bounds of dye are determined only by the difference of dy1 in the interval II, k1 and k2 can be given by the lower bounds as , for any dye when dy1 is determined by the following equation:
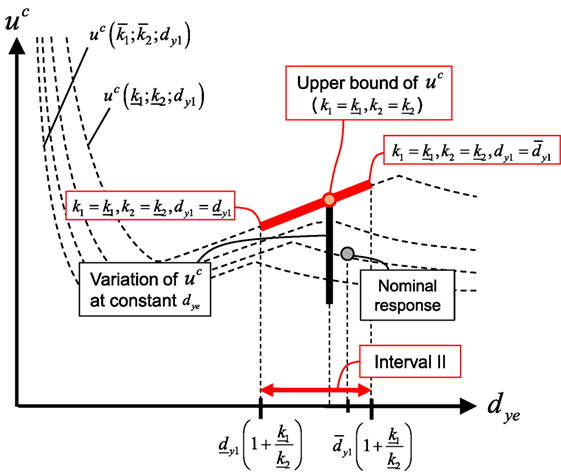
Since uc is maximized at , for fixed dye as explained in Eq. 6, it can be concluded that the upper bound of uc in the interval II is derived by the combination of uncertain parameters in , , and dy1 in Eq. 9. Figure 5 shows the conceptual diagram for determination of the upper bound of uc in the interval II. The categorized interval of dye in the intervals I–III is not related with the categorization of the interval due to the non-monotonicity property of uc as shown in Figure 2. Therefore, the variation of the upper bound is varied according to the nominal design.
Secondly, the upper bounds of uc in the interval I and III are investigated. In the interval I and III, k1 and k2 cannot be given by the lower bounds , . This is because the upper and lower bounds of dye in the interval I are determined so that dy1 reaches the lower bound of itself and those in the interval III are also calculated so that dy1 reaches the upper bound of itself. For example, when the upper bound of dye in the interval I is given by , , and , k2 is needed to be increased to decrease dye. This can be easily understood from the definition of dye in Eq. 4. In this case, k2 for a fixed value of dye can be described as follows:
In a similar way, the upper bound of uc in the interval III can be derived by , , and k1 is given by the following equation:
Finally, the upper bound of uc(k1;k2;dy1), defined as , can be summarized as follows:
Figure 6 shows the diagram for determination of with respect to the variation of k1, k2, and dy1. The supremum value of the maximum critical elastoplastic displacement can be derived from the maximum value of .
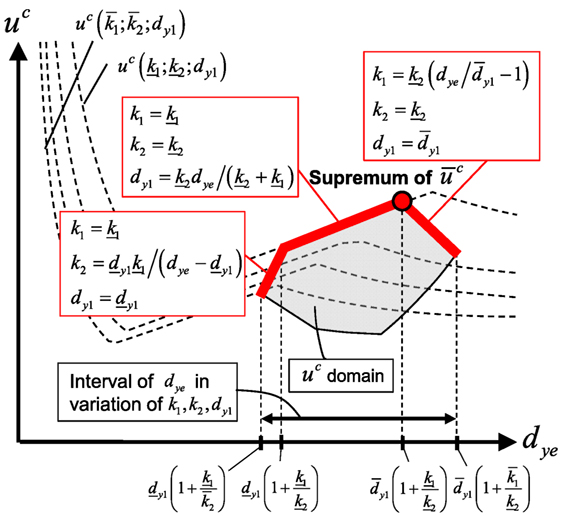
Figure 6. Determination of upper bounds and supremum value of maximum elastoplastic displacement for critical double impulse.
Evaluation of Upper Bound of Maximum Elastoplastic Displacement at Base-Isolation Story
The supremum value of the upper bound of the maximum displacement derived in the previous section corresponds to the maximum displacement of the superstructure including the deformation of the base-isolation story. However, the maximum deformation at the base-isolation story may be needed in the practical design. To apply the proposed method to evaluate the response of the base-isolation story, the maximum displacement at the base-isolation story is obtained in this section by using uc derived for the equivalent SDOF model.
Figure 7 shows the comparison of the restoring-force characteristics of the 2DOF model and the SDOF model. In the case where the base-isolation story yields after the first or second impulse, the plastic deformations of the 2DOF model and the equivalent SDOF model is the same. This is because the superstructure in the 2DOF model is assumed to be elastic. In this case, can be estimated as shown in Figure 7A. In Figure 7A, u(1) and denote the maximum deformation of the equivalent SDOF model after the first impulse and that at the base-isolation story of the 2DOF model, respectively, and u(2) and represent those after the second impulse. Furthermore, and denote the maximum plastic deformation of the equivalent SDOF model after the first impulse and that at the base-isolation story of the 2DOF model, respectively, and and represent those after the second impulse. On the other hand, in the case where the base-isolation story is elastic even after the impulse input, can be determined as shown in Figure 7B. Therefore, can be evaluated by using Eq. 2 as follows:
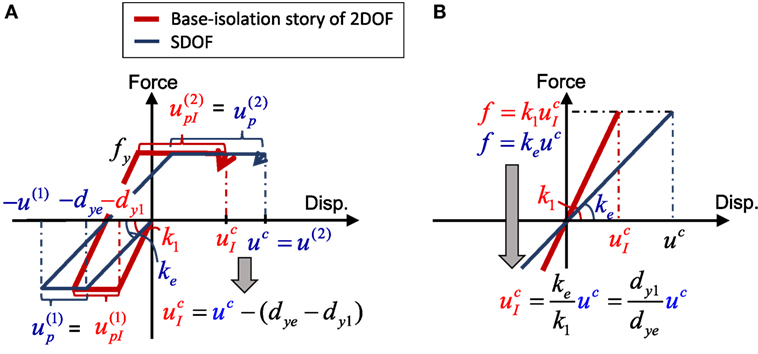
Figure 7. Estimation of maximum elastoplastic deformation at base-isolation story through comparison of restoring force–displacement relations: (A) case: u(1) < u(2): both plastic, (B) case: u(1), u(2): both elastic.
Consider the upper bound of , defined as , with respect to the variation of k1, k2, and dy1. As a similar formulation to derive in Eq. 12, the monotonicity of with respect to k1 and k2 cannot be introduced under the constraint that dye is constant. This is because it is needed to use dy1 and dye in the estimation of from uc and dy1 is a function of k1 and k2 to keep dye constant. Therefore, is derived approximately by substituting the critical combination of k1, k2, and dy1 in Eq. 12 into the relation of with uc in Eq. 13.
Robustness Evaluation Using Robustness Function Based on Info-Gap Model
In this section, the robustness function (Ben-Haim, 2006) is introduced to evaluate the robustness of a base-isolated high-rise building by using the supremum response of and derived in the previous section. The robustness in this paper is defined as the ability to keep the structural performance within a certain range under uncertainty of structural parameters. As shown in Figure 8, if the variation of performance is relatively small for the variation of design parameters X, the robustness of the structure is evaluated as high. However, in the case where the nominal responses are different in various nominal designs, it is difficult to compare the robustness of each nominal design.
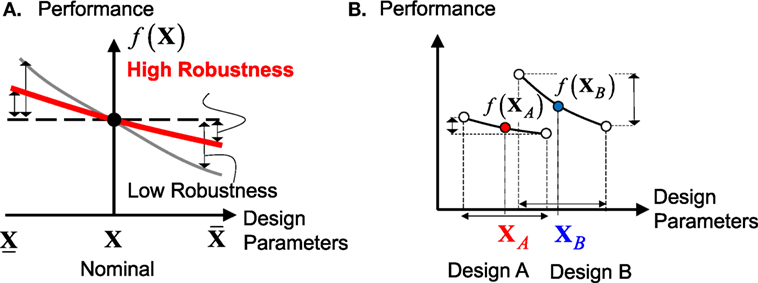
Figure 8. Comparison of robustness for different nominal designs: (A) difference of robustness for the same nominal design, (B) difference of nominal design.
To evaluate the robustness of a structure, Ben-Haim (2006) proposed the robustness function as a quantitative index. By applying the info-gap model to the uncertain parameters in the 2DOF model, the non-probabilistic interval parameters of k1, k2, and dy1 can be defined in the real coordinate space R as follows:
where α ≥ 0 denotes the variable range level, i.e., amplitude, of an interval parameter. The upper tilde symbol indicates the nominal value and the variations Δk1, Δk2, Δdy1 are normalized at α = 1.
The robustness function is defined as the maximum value of α with which the performance requirement is satisfied for uncertain parameters X(α) described as follows:
where f and fc denote a function of structural performance, e.g., the maximum interstory drift, and the performance criterion of f, respectively. Figure 9 shows the concept of determining the robustness function. As shown in Figure 9B, when the supremum of the maximum response caused by the variation of the seismic response due to the uncertainty of K1(α), K2(α), and D(α) reaches the performance criterion fc, the robustness function can be determined. In the case for , fc can be regarded to correspond to the nominal response . The larger value of means that the current nominal structural design has a larger robustness to uncertainties for satisfying the constraint given by the specified value of fc.
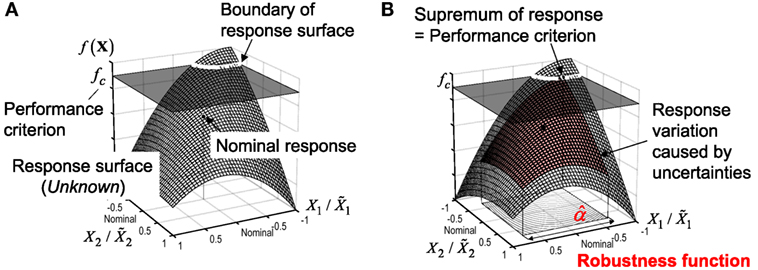
Figure 9. Concept of robustness function: (A) nominal design and performance criterion, (B) determination of robustness function.
For the practical computation of the robustness function , it is known that the direct computation of for given value of fc is difficult due to the need of iterative calculation as shown in Figure 10A. On the other hand, by regarding the maximum value of f, i.e., the supremum of the objective function, for a given value of α as fc in relation, the robustness function can be obtained as shown in Figure 10B. In this practical procedure of computing the robustness function, the supremum value of the structural response, e.g., the maximum elastoplastic displacement, can be evaluated as shown in the Section “Evaluation of Upper Bound of Maximum Elastoplastic Displacement at Base-Isolation Story.”
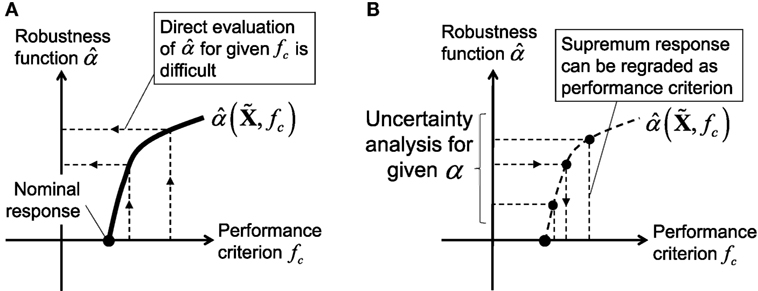
Figure 10. Practical computation of robustness function: (A) original procedure of specifying performance criterion and (B) inverse procedure of specifying robustness function.
Numerical Examples
Numerical examples are presented for a 30-story base-isolated building model to evaluate the robustness concerned with the maximum elastoplastic displacement. To show the accuracy of the upper bound derived in Eq. 12, the upper and lower bounds of the maximum elastoplastic displacement derived in the proposed formulations are compared with the maximum elastoplastic displacements generated by the Monte Carlo simulation (MCS) where the stiffness and yield deformation at the base-isolation story and the stiffness of the superstructure are randomly generated as uncertain parameters. Then, the robustness functions in terms of the supremum value of the maximum elastoplastic displacements of the overall structure and that of the base-isolation story are evaluated for various yield deformations. In particular, the robustness evaluation for different nominal designs with different yield deformations at the base-isolation story is performed to derive a preferable robust design for the base-isolated high-rise building model.
Consider a 30-story base-isolated building and introduce a 2DOF model as shown in Figure 3. The mass of each story in the superstructure is 2.0 × 10⁶ kg, i.e., m2 = 6.0 × 10⁷ kg. The stiffness k2 of the superstructure is given so that the fundamental natural period of the superstructure with fixed base is 3.0 s, i.e., k2 = 2.63 × 10⁸ N/m. The mass of the base-isolation story is m1 = 6.0 × 10⁶ kg. It is assumed that NRBs and U-shaped steel dampers are installed at the base-isolation story. The restoring-force characteristic of the combination of the natural rubber isolators and the U-shaped steel dampers is assumed to be elastic–perfectly plastic and this modeling enables the application of the critical response of an elastic–perfectly plastic model to the double impulse (Kojima and Takewaki, 2015). The yield deformation at the base-isolation story is treated as the target design parameter and given by . The initial stiffness k1 of the base-isolation story is given so that the fundamental natural period of the model with a rigid superstructure is 1.0 s, i.e., k1 = 2.61 × 10⁹ N/m. The reference uncertainties of Δk1, Δk1, and Δdy1 are determined as , , and .
Figure 11 shows examples of the variation of the upper and lower bounds of the critical elastoplastic deformation for and V = 1.0 m/s with respect to the equivalent yield deformation. The dotted two lines represent the variation of the relation uc–dye for , (upper dotted line) and , (lower dotted line), respectively. It can be observed from this figure that the variation of uc is different for different , i.e., the variation ratio to the nominal response for is , and that for is .
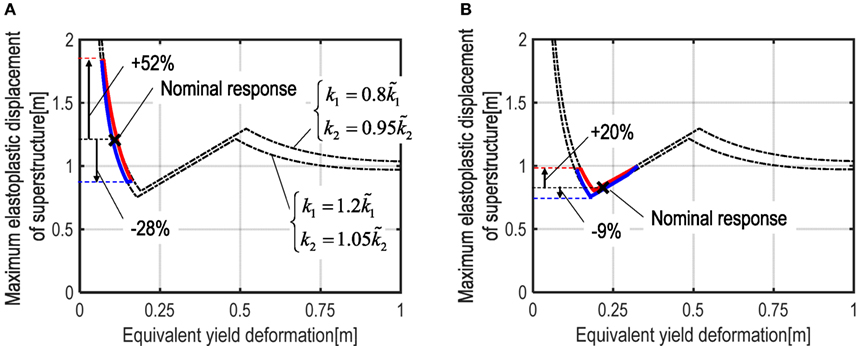
Figure 11. Upper and lower bounds of critical elastoplastic displacement of superstructure: (A) and (B) .
To examine the accuracy of the upper bounds of uc and derived in this paper, Figure 12 shows the comparison of the variation of uc and for randomly selected uncertain models with the upper and lower bounds of uc and . The random models are generated by the MCS, where k1, k2, and dy1 are produced randomly by using the probabilistic density function based on the normal distribution. As shown in these figures, the maximum elastoplastic displacements uc and of any models in the interval of dye are enveloped by and .
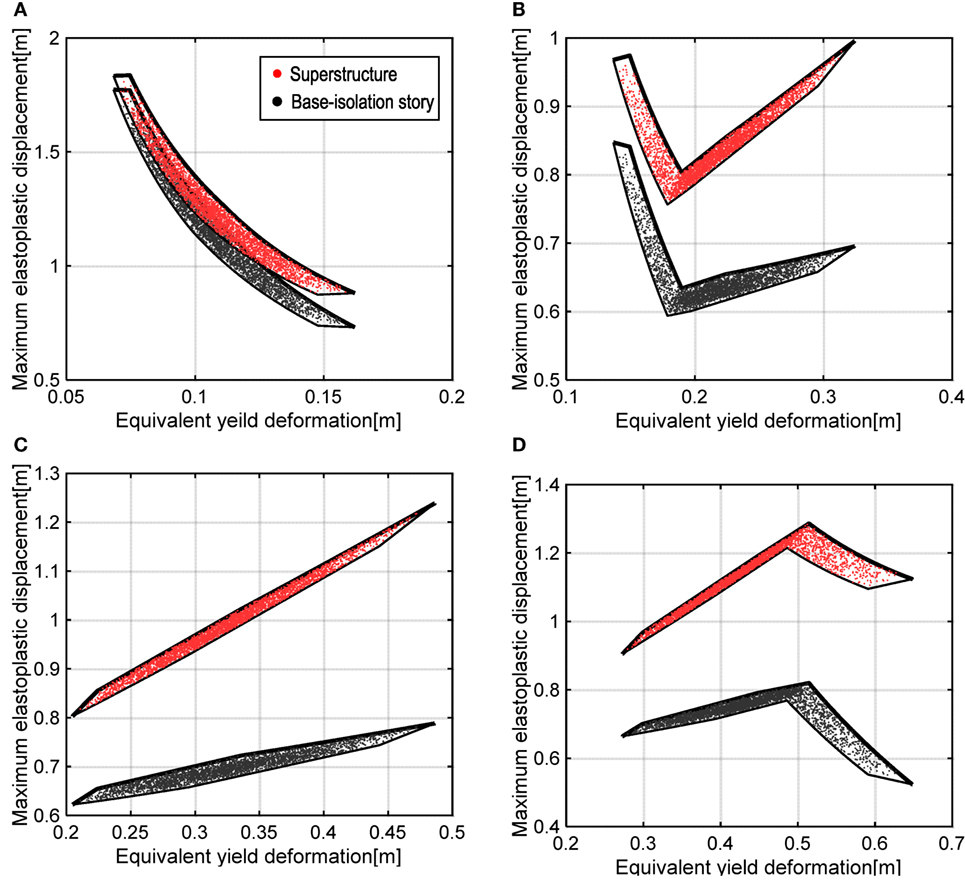
Figure 12. Comparison of variations of maximum elastoplastic displacement: (A) , (B) , (C) , and (D) .
Figure 13 shows the comparison of the robustness functions of and for different and V = 1.0 m/s. To evaluate the robustness of the structure, we focused on the specified performance criterion. For example, if the limit maximum displacement of the superstructure is 1.0 m and the limit maximum elastoplastic deformation of the base-isolation story is 0.7 m, the robustness function for is the largest in these models. This is because, as shown in Figure 12, the non-monotonic variation of uc is included in the range of variation of dye for where the maximum elastoplastic deformations of the overall structure after the first and second impulses coincide. From these observations, it can be concluded that there exists a preferable design of the yield deformation dy1 at the base-isolation story from the view point of the robust design.

Figure 13. Comparison of robustness functions for maximum displacement of models with various nominal yield deformations: (A) superstructure and (B) base-isolation story.
Conclusion
A new method for evaluating the structural robustness of an elastoplastic base-isolated high-rise building has been proposed where the closed-form expression (Kojima and Takewaki, 2015) on the maximum elastoplastic deformation of an SDOF system under the critical double impulse is used. Since this closed-form expression on the critical response is based on the SDOF model, a 2DOF model with simultaneous uncertainties of the structural parameters has been transformed into an equivalent elastoplastic SDOF model. The elastic stiffness and yield deformation of the base-isolation story and the stiffness of the superstructure have been chosen as uncertain parameters.
In the closed-form formulation of the maximum elastoplastic deformation, there exists a non-monotonicity property of the critical elastoplastic deformation with respect to the yield deformation. The robustness function based on the info-gap model (Ben-Haim, 2006) has been introduced to measure the robustness quantitatively. The equivalent yield deformation in the SDOF model has been selected as a key uncertain parameter in the info-gap model. To find the worst scenario of the elastoplastic response, we have proposed the classified three different domains in this interval of the equivalent yield deformation. In each domain of the equivalent yield deformation, the upper bound of the maximum elastoplastic response has been derived by investigating the combination of the structural uncertain parameters where the two parameters can be fixed at the edges of interval, i.e., an upper or lower bound of the interval parameter, and another one parameter is varied according to the fixed equivalent yield deformation.
The robustness function has been evaluated by using the supremum value of the maximum elastoplastic displacement. In addition to the evaluation of the maximum displacement of the equivalent SDOF model, i.e., the displacement of the overall structure, the robustness of the displacement at the base-isolation story has been studied. Although the robustness evaluation considering the elastoplastic structural responses seems to be difficult due to the large amount of computational load by the time-history response analysis, this was overcome by using the closed-form expression explained above.
A 30-story base-isolated building model has been investigated as a numerical example where the yield deformation at the base-isolation story was treated as the principal design parameter. The robustness functions for the supremum value of the elastoplastic displacement at the overall structure and the base-isolation story have been evaluated in these building models with different yield deformations at the base-isolation story. It has been shown that a preferable nominal yield deformation design exists in the base-isolated high-rise building to make the robustness in terms of the elastoplastic structural response larger. This is because the variation of the structural response due to the simultaneous uncertainties may be small in the domain where the maximum displacement after the first impulse and that after the second impulse coincide at the specified equivalent yield deformation. It may be concluded that the proposed method is useful for finding preferable design parameters leading to higher robustness of elastoplastic base-isolated high-rise buildings.
Author Contributions
KF carried out the theoretical and numerical analysis. KY carried out the numerical investigation. YK suggested theoretical formulation. IT supervised the theoretical analysis.
Funding
Part of the present work is supported by the Grant-in-Aid for Scientific Research (KAKENHI) of Japan Society for the Promotion of Science (No. 15H04079, 16K18184, and 26420545). This support is greatly appreciated.
Conflict of Interest Statement
The authors declare that the research was conducted in the absence of any commercial or financial relationships that could be construed as a potential conflict of interest.
References
Ben-Haim, Y. (2006). Information-Gap Decision Theory: Decisions under Severe Uncertainty, 2nd Edn. London: Academic Press.
Ben-Haim, Y., Chen, G., and Soong, T. T. (1996). Maximum structural response using convex models. J. Eng. Mech. 122, 325–333. doi: 10.1061/(ASCE)0733-9399(1996)122:4(325)
Ben-Haim, Y., and Elishakoff, I. (1990). Convex Models of Uncertainty in Applied Mechanics. Amsterdam: Elsevier.
Elishakoff, I., and Ohsaki, M. (2010). Optimization and Anti-Optimization of Structures under Uncertainty. London: Imperial College Press.
Fujita, K., and Takewaki, I. (2011). An efficient methodology for robustness evaluation by advanced interval analysis using updated second-order Taylor series expansion. Eng. Struct. 33, 3299–3310. doi:10.1016/j.engstruct.2011.08.029
Fujita, K., and Takewaki, I. (2012). Robustness evaluation on earthquake response of base-isolated buildings with uncertain structural properties under long-period ground motions. Architectoni.ca J. 1, 46–59. doi:10.5618/arch.2012.v1.n1.5
Guo, S. X., and Li, Y. (2013). Non-probabilistic reliability method and reliability-based optimal LQR design for vibration control of structures with uncertain-but-bounded parameters. Acta Mech. Sinica 29, 864–874. doi:10.1007/s10409-013-0068-4
Han, R., Li, Y., and Lindt, J. (2014). Seismic risk of base isolated non-ductile reinforced concrete buildings considering uncertainties and mainshock-aftershock sequences. Struct. Saf. 50, 39–56. doi:10.1016/j.strusafe.2014.03.010
Kanno, Y., and Takewaki, I. (2006). Robustness analysis of trusses with separable load and structural uncertainties. Int. J. Solids Struct. 43, 2646–2669. doi:10.1016/j.ijsolstr.2005.06.088
Kanno, Y., and Takewaki, I. (2016). Robustness analysis of elastoplastic structure subjected to double impulse. J. Sound Vib. 383, 309–323. doi:10.1016/j.jsv.2016.07.023
Kanno, Y., Yasuda, K., Fujita, K., and Takewaki, I. (2017). Robustness of SDOF elastoplastic structure subjected to double-impulse input under simultaneous uncertainties of yield deformation and stiffness. Int. J. Non Linear Mech. 91, 151–162. doi:10.1016/j.ijnonlinmec.2017.02.013
Kojima, K., and Takewaki, I. (2015). Critical earthquake response of elastic-plastic structures under near-fault ground motions (part 1: fling-step input). Front. Built Env. 1:12. doi:10.3389/fbuil.2015.00012
Matsuda, Y., and Kanno, Y. (2008). Robustness analysis of structures based on plastic limit analysis with uncertain loads. J. Mech. Mate. Struct. 3, 213–242. doi:10.2140/jomms.2008.3.213
Qiu, Z., and Wang, X. (2003). Comparison of dynamic response of structures with uncertain but bounded parameters using non probabilistic interval analysis method and probabilistic approach. Int. J. Solids Struct. 40, 5423–5439. doi:10.1016/S0020-7683(03)00282-8
Roy, B. K., Chakraborty, S., and Mihsra, S. K. (2012). Robust optimum design of base isolation system in seismic vibration control of structures under uncertain bounded system parameters. J. Vib. Cont. 20, 786–800. doi:10.1177/1077546312466577
Takewaki, I. (2008). Robustness of base-isolated high-rise buildings under code-specified ground motions. Struct. Design Tall Spec. Build. 17, 257–271. doi:10.1002/tal.350
Takewaki, I., and Ben-Haim, Y. (2005). Info-gap robust design with load and model uncertainties. J. Sound Vib. 288, 551–570. doi:10.1016/j.jsv.2005.07.005
Taniguchi, R., Kojima, K., and Takewaki, I. (2016a). Critical response of 2DOF elastic-plastic building structures under double impulse as substitute of near-fault ground motion. Front. Built Environ. 2:2. doi:10.3389/fbuil.2016.00002
Taniguchi, R., Kojima, K., and Takewaki, I. (2016b). “Critical response of 2DOF elastic-plastic building structures under double impulse,” in The Summaries of Technical Papers of Annual Meeting of Architectural Institute of Japan, Structures I (Tokyo: Architectural Institute of Japan (AIJ)), 407–408. (in Japanese).
Tsompanakis, Y., Lagaros, N. D., and Papadrakakis, M. (2008). Structural Design Optimization Considering Uncertainties. London: Taylor & Francis.
Yang, C., Tangaramvong, S., Gao, W., and Tin-Loi, F. (2015). Interval elastoplastic analysis of structures. Comp. Struct. 151, 1–10. doi:10.1016/j.compstruc.2014.12.004
Yang, C., Tangaramvong, S., Tin-Loi, F., and Gao, W. (2017). Influence of interval uncertainty on the behavior of geometrically nonlinear elastoplastic structures. J. Struct. Eng. 143. doi:10.1061/(ASCE)ST.1943-541X.0001618
Appendix
Relationship between 2DOF Model and SDOF Model
Consider a base-isolated building structure as shown in Figure A1 (the same as the model in Figure 3). It is often the case that base-isolated building structures are modeled into a simplified model. A 2DOF model is a good simplified model. However further simplification into an SDOF model is desirable because a closed-form solution (Kojima and Takewaki, 2015) can be used for the SDOF model under the double impulse.
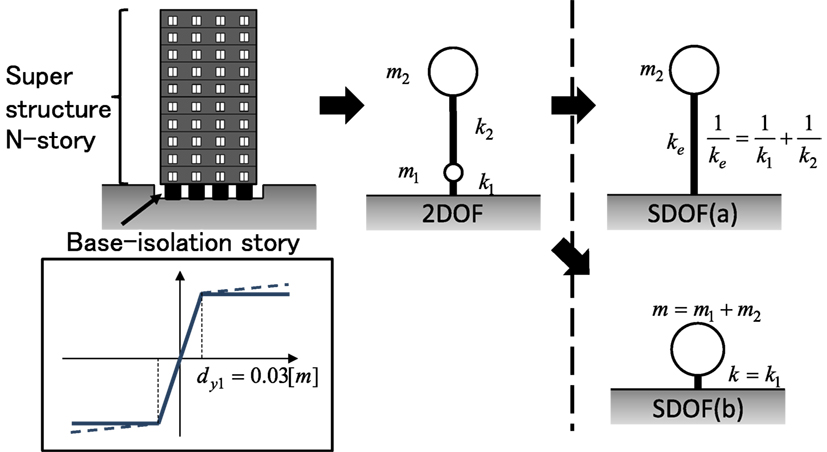
Figure A1. Modeling of base-isolated building into single-degree-of-freedom (SDOF) model with series springs and ignored base-isolation story mass and SDOF model with rigid superstructure.
Consider two SDOF models, i.e., SDOF (a) model (the same as the model in Figure 3) and SDOF (b) model under the double impulse. SDOF (a) model is a model with series springs and ignored base-isolation story mass and SDOF (b) model is a model with rigid superstructure (Figure A1). For the SDOF (a) model, those equivalent quantities can be expressed as follows:
On the other hand, for the SDOF (b) model, those equivalent quantities can be expressed as follows:
Another possibility of modeling by modifying me = m2 into me = m1 + m2 in the SDOF (a) model may be considered. However, this modification seems to influence the result slightly (smaller than 10% in high-rise base-isolated buildings as treated here). Furthermore, the series spring modeling in the SDOF (a) model appears compatible with the neglect of m1.
For numerical simulations, consider a base-isolated N-story shear building model. The fundamental natural period of the superstructure with fixed base is given by 0.1 × N (s). The stiffness k2 is obtained from this condition. The floor mass per story is assumed to be 200 × 103 kg. Then m2 = 200 × 103 × N (kg).
The yield displacement of the base-isolation story is dy1 = 0.03 m. The fundamental natural period of the base-isolated building with rigid superstructure is given by 1.0 s (the stiffness is the sum of the isolators and steel dampers). The stiffness k1 is obtained by this condition. The mass of the base-isolation story is m1 = 600 × 103 kg.
Figure A2 shows the comparison of the critical plastic deformation in the base-isolation story after the second impulse among the 2DOF model (time-history response analysis), the SDOF (a) model (series spring model and ignored base-isolation story mass) and the SODF (b) model (rigid superstructure model). The critical plastic deformation of the SDOF model after the second impulse was derived in the reference (Kojima and Takewaki, 2015). It can be observed that, while the SDOF (b) model with rigid superstructure is a better model for a low-rise building model (N = 5, 10), the SDOF (a) model with series springs and ignored base-isolation story mass is a better model for a high-rise building model (N = 30). It can also be observed that, for N = 20, the SDOF (a) model can simulate the response of the 2DOF model in the lower input level up to V/Vy = 3 and the response of SODF (b) model is more close to the actual response in the range of V/Vy = 4–5.
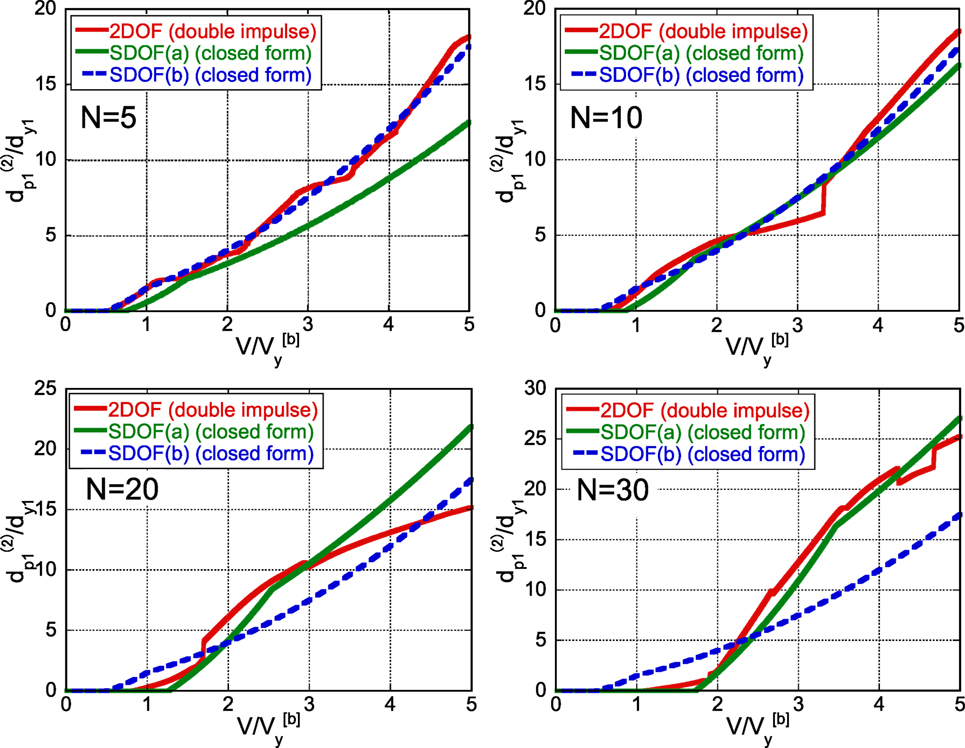
Figure A2. Plastic deformation in base-isolation story in 5, 10, 20, and 30-story base-isolated buildings after the second impulse under double impulse with respect to input level (2DOF model, single-degree-of-freedom (SDOF) model (a) with series springs and SDOF model (b) with rigid superstructure).
Keywords: robustness evaluation, critical response, double impulse, base-isolated building, elastoplastic response, robust design
Citation: Fujita K, Yasuda K, Kanno Y and Takewaki I (2017) Robustness Evaluation of Elastoplastic Base-Isolated High-Rise Buildings Subjected to Critical Double Impulse. Front. Built Environ. 3:31. doi: 10.3389/fbuil.2017.00031
Received: 23 March 2017; Accepted: 05 May 2017;
Published: 26 May 2017
Edited by:
Fabio Mazza, University of Calabria, ItalyReviewed by:
Tao Wang, China Earthquake Administration, ChinaNaohiro Nakamura, Hiroshima University, Japan
Iolanda-Gabriela Craifaleanu, Technical University of Civil Engineering of Bucharest, Romania
Copyright: © 2017 Fujita, Yasuda, Kanno and Takewaki. This is an open-access article distributed under the terms of the Creative Commons Attribution License (CC BY). The use, distribution or reproduction in other forums is permitted, provided the original author(s) or licensor are credited and that the original publication in this journal is cited, in accordance with accepted academic practice. No use, distribution or reproduction is permitted which does not comply with these terms.
*Correspondence: Izuru Takewaki, takewaki@archi.kyoto-u.ac.jp
 Kohei Fujita
 Keisuke Yasuda1
 Yoshihiro Kanno
 Izuru Takewaki