
94% of researchers rate our articles as excellent or good
Learn more about the work of our research integrity team to safeguard the quality of each article we publish.
Find out more
ORIGINAL RESEARCH article
Front. Built Environ., 19 April 2017
Sec. Structural Sensing, Control and Asset Management
Volume 3 - 2017 | https://doi.org/10.3389/fbuil.2017.00023
Optics-based tracking of civil structures is not new, due to historical application in surveying, but automated applications capable of tracking at rates that capture dynamic effects are now a hot research topic in structural health monitoring. Recent innovations show promise of true non-contacting monitoring capability avoiding the need for physically attached sensor arrays. The paper reviews recent experience using the Imetrum Dynamic Monitoring Station (DMS) commercial optics-based tracking system on Humber Bridge and Tamar Bridge, aiming to show both the potential and limitations. In particular, the paper focuses on the challenges to field application of such a system resulting from camera instability, nature of the target (artificial or structural feature), and illumination. The paper ends with evaluation of a non-proprietary system using a consumer-grade camera for cable vibration monitoring to emphasize the potential for lower cost systems where if performance specifications can be relaxed.
Bridge performance can be characterized via a number of metrics such as internal forces or reaction forces, stresses, strains, and accelerations but perhaps the most useful of all is deformation, since practically all the other metrics can be derived from it via differentiation in space (giving strain) or time (giving velocity and acceleration).
Serviceability is also reflected through deformation, since extreme values and ranges indicate problems that may limit operational use, e.g., as excessive vibrations or movement across expansion joints. Measurements of deformation also provide direct calibration of physical or numerical simulations of load/response relationships via controlled vehicle load tests and monitoring of performance in strong winds. Deformation measurements also provide a powerful diagnostic tool, for example, for the investigation of the truss-end link that closed the Forth Road Bridge in late 2015 (BBC News, 2016).
Optics-based systems are widely used for surveying structural configuration but tend to be limited to long sample intervals to capture quasi-static response due to wind and vehicles. Robotic total stations (RTS) provide some capability for automated multi-point deformation tracking but struggle to capture dynamic response due to wind and seismic effects. There are only a few examples of RTS used in bridge monitoring system, e.g., at Jiangyin Suspension Bridge (Ko and Ni, 2005) and Tamar Bridge (Brownjohn et al., 2015) although some studies have targeted RTS on a single point to track low-frequency bridge vibration modes, e.g., on the Bosporus Bridge, Istanbul (Erdoğan and Gülal, 2011).
One of the earliest examples of optics-based monitoring at dynamic rates was Tacoma Narrows Bridge (University of Washington, 1954) using a movie camera, and there have been a few examples of optics-based dynamic tracking, e.g., Humber Bridge (Stephen et al., 1993; Brownjohn et al., 1994) and Second Severn Crossing (Macdonald et al., 1997), both of which were operated by University of Bristol researchers. The Bristol “Vision System” used parallel processing hardware and a predictive search algorithm to track an artificial target at dynamic rates in real time (at Second Severn Crossing) or by post-processing (Humber Bridge). The Vision System was commercialized by University of Bristol spin-out Imetrum Ltd. and now uses a patented algorithm for tracking multiple natural or artificial targets using standard high specification industrial cameras to achieve resolution to a small fraction of a pixel. Other commercial products include the Noptel PSM system (Ahola and Tervaskanto, 1991) that measures deviations transverse to a LED beam at ranges up to several 100 m and the Polytec laser Doppler vibrometer that measures both displacement and velocity along line of sight to high resolution in time and space (Ozbek et al., 2009). Meanwhile, research into and application of camera-based tracking systems for multiple static and dynamic targets continue to be a growth area.
During the past few years, such systems have improved in hardware, tracking techniques, and application ranges. For example, with affordable high-quality digital imaging sensors, cheaper cameras with high resolution have been shown to be a feasible option for structural monitoring and system identification (Yoon et al., 2016). Artificial targets required in systems such as the Bristol Vision System are very cumbersome and can be avoided by using advanced feature-based tracking algorithms (Feng et al., 2015; Khuc and Necati Catbas, 2016; Yoon et al., 2016). In addition to measurement of two-dimensional structural displacement, monitoring three-dimensional dynamic vibration responses of structures is now also feasible by adopting calibration principals of stereoscopic vision (Schreier, 2004; Chang and Ji, 2007; Oh et al., 2015; Santos et al., 2016). This involves coordinate transformations that in turn require the information of camera-to-structure distance known structure dimensions.
The problem with such systems is that they mostly remain in the research domain and while they may have been evaluated on full-scale structures, instrumentation, and monitoring contractors geared up for commercial application and support are unlikely to risk using non-mature technology.
Hence, after a brief review of optics-based deformation tracking technology, this paper concentrates on application of the commercial Imetrum system on bridges in the UK, specifically Humber Bridge (1,410 m main span) and Tamar Bridge (335 m main span). The aim is to show the capabilities of such a tracking system, how it should be used and what are the limitations and issues that apply equally to bespoke systems developed and used by researchers.
The implementation of optical monitoring is the process of setting up a camera or multiple cameras in stable locations looking at a “target” contained in the structure and deriving the structural motion information through tracking the target motions in image sequences. “Target” here could be either artificial feature (pre-installed marker, LED lamp, or planar panel with special patterns) or existing structural feature (e.g., bolts or holes).
The implementation comprises hardware and video-processing components. The hardware comprises camera(s), a computer with video-processing package, and accessories such as camera mount, camera lens, and optional artificial targets. The role of the video-processing package is acquiring the video frames covering the target regions, tracking the target locations in image sequences, and finally transforming the target location information in image into the time history of structural displacement.
For various vision-based systems in the literature, the hardware is almost the same [except the mixed systems, e.g., combing the camera system with total station (Ehrhart and Lienhart, 2015)] while the main difference is in the video-processing packages. A typical video-processing package can be decomposed into three components according to the procedures of measurement goal realization.
The first step is camera calibration to obtain transformation metrics using methods such as “scaling factor,” “planar homography,” and “full projection matrix.” It is aimed at determining the transformation metric between the image natural units (pixels) and the real world units (e.g., millimeters).
The scaling factor method (Stephen et al., 1993) is the simplest. It links the image motion to the structural displacement via a coefficient estimated by camera-to-target distance or one dimension correspondence in the image plane and in the structural coordinate system. This method, however, is based on the assumption that the camera principal axis is perpendicular to the target surface plane, which sets constraints on the camera-to-target geometry relation on site. The planar homography method (Xu et al., 2016) calculates the transformation relationship between the 2D image plane and the 2D target surface plane in the structure. This method considers projection distortion under non-perpendicularity of the camera principal axis but neglects out-of-plane motion of the target. The planar homography matrix could be determined by direct linear transformation (2D DLT) based on at least four sets of 2D-to-2D point correspondences (Hartley and Zisserman, 2003). The full projection matrix (Chang and Ji, 2007) is the general form to build the projection from the 3D structural coordinate system to the 2D image plane with no assumption, and supports the reconstruction of 3D structural displacement. The full projection matrix is usually calculated from multiplication of the two camera matrices that are determined separately (Chang and Ji, 2007; Martins et al., 2015): (i) laboratory calibration to determine the camera intrinsic matrix and (ii) site calibration to determine the camera extrinsic matrix.
The second step of target tracking is aimed at determining the target locations in a frame sequence in a video record using target matching or motion estimation techniques in computer vision. Template matching (Stephen et al., 1993) is a classical technique for target tracking through matching a rectangular subset region between two images using a similarity metric. Optical flow estimation detects motion or flows of each pixel within the target region based on one temporal constraint about image properties [e.g., brightness constancy in Lucas–Kanade method (Tomasi and Kanade, 1991) or local phase constancy in phase-based method (Fleet and Jepson, 1990)]. Feature point matching involves matching salient feature points in two images based on their local appearance [i.e., local feature descriptor (Szeliski, 2010)], e.g., Fast Retina Keypoint matching (Khuc and Necati Catbas, 2016).
The last step of structural displacement calculation delivers the structural displacement sequence using single or multiple cameras. It aims to derive the structural displacement given the image location sequences of the targets (which are the output of the target tracking step) and a transformation metric (the output of the camera calibration step).
For single camera applications using scaling factor or planar homography matrix as the transformation metric, the 2D structural displacement is derived uniquely, whereas for multiple camera applications using full projection matrix as the transformation metric, a least squares estimate is required to extract the 3D structural displacement by solving the underdetermined linear equations. Some researchers attempted to extract more information about target motion (up to 6 DOF) from single camera using the pose estimation technique (Chang and Xiao, 2010; Greenbaum et al., 2016) in which target position and orientation in structure is estimated by tracking multiple target points (at least four) in a rigid target.
The Vision System originating from research at the University of Bristol (Stephen et al., 1993; Macdonald et al., 1997) led to the “Video Gauge” software that was commercialized via the university spin-out Imetrum formed in 2003. The implementation of the Video Gauge in a hardware platform is called the Dynamic Monitoring Station (DMS) which includes one or more GigE high performance cameras.
A typical implementation of the DMS for bridge monitoring is shown in Figure 1. High-resolution cameras equipped with long focal length lens are connected to the controller (computer) via Ethernet cables and a group of up to four cameras are available for time-synchronized recording and real-time video processing. Cameras used for case studies in this paper have a resolution of 2,048 × 1,088 pixels and sensor size of 11.26 mm × 5.98 mm.
In the video-processing package, target tracking algorithms used are correlation-based template matching and super resolution techniques (Potter and Setchell, 2014) which enable better than 1/100 pixel resolution at sample rates beyond 100 Hz in field applications. The tracking objects could be either artificial targets or an existing feature (i.e., bolts or holes) on the bridge surface. The system supports either 2D structural displacement measurement by single camera or 3D structural displacement measurement by multiple cameras. In this study, single camera configuration was used to extract the 2D bridge displacement along the vertical and transverse directions at bridge mid-span and planar homography method based on coplanar dimension correspondences as used in camera calibration.
The system used by University of Exeter has been trialed in several 1-day field campaigns on a number of bridges in the UK, particularly Humber and Tamar Bridges. Such a 1-day field campaign on the Humber Bridge is described in the next section.
Before deploying on the Humber Bridge, trials on displacements of a short-span bridge with assumed “known” displacements obtained by direct measurement as obtained by other sensors (e.g., LVDT) were used to check requirements of target size in terms of camera pixels. These studies are described in the context in a later section of this paper and showed that to obtain an accurate and stable measurement, the ideal image size of the target is near 80 × 80 pixels and suggested to be not less than 40 × 40 pixels. If a custom-made target panel is required, the dimension of the panel could be estimated from the required image size and the camera-target distance using the scaling factor method (Feng et al., 2015).
The Humber Bridge (Brownjohn et al., 2015), opened in 1981, has a main span of 1410 m and is known to experience mid-span deformations around 1 m in strong winds (Brownjohn et al., 2015).
A long-term monitoring system has been operating at Humber Bridge since 2010 (Brownjohn et al., 2015) and includes a base station at the bridge tower, two GPS rover receivers (Leica GMX902) mounted on the main cables at mid-span and three QA750 accelerometers mounted inside the steel box girder at mid-span (two vertical and one lateral/horizontal) (Brownjohn et al., 2015). The sample rates of GPS and QA accelerometers in the monitoring system are 1 and 20 Hz, respectively.
A single day of field testing using the DMS was performed to measure the lateral and vertical displacement at mid-span on a clear mid-summer day with low winds and normal traffic load. The DMS performance was evaluated in time and frequency domains by comparing with a GPS “reference sensor.”
In the field test, the camera and controller along with battery power supply were located near the foundation of the North (Hessle) tower shown in Figure 2A, to the East of the pylon. A concrete plinth built between the pylons for the 1990s Vision System deployment (Stephen et al., 1993) was not used due to poor sightline to the target attached to the bridge parapet. A 300 mm f/2.8 lens was attached to both camera and tripod via a rigid double-support translation stage (described in a later section of the paper). A custom-made 1 m square steel frame holding an artificial target was mounted on the parapet at the mid-span 710 m from the lens as shown in Figure 2B. The pattern of the target is a set of concentric rings with a gradual blend from black to white at the edges.
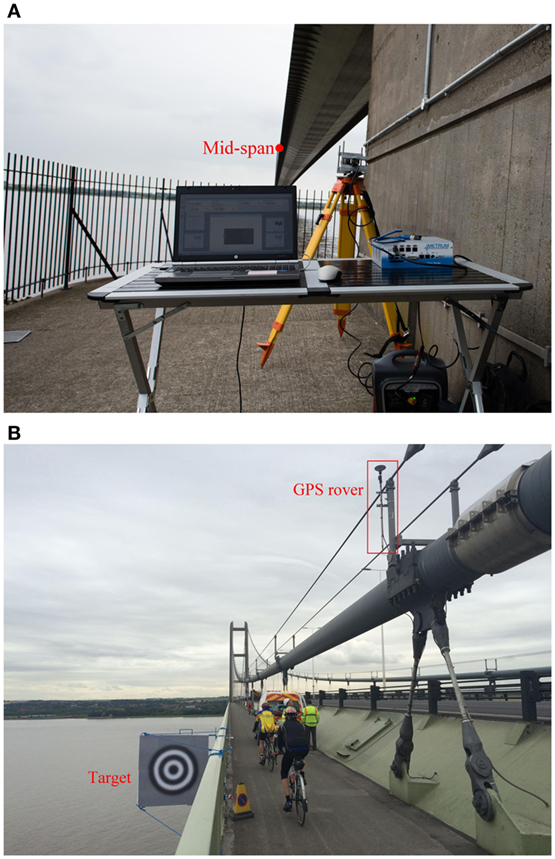
Figure 2. Camera system configuration in the Humber Bridge test: (A) DMS near tower foundation and (B) custom-made target installed at mid-span.
The frequency range of interest containing the majority of significant vibration modes was less than 1 Hz, so the frame rate of the DMS system was chosen as 10 Hz. To save storage space, the image size of each frame was saved as 850 × 400 pixels although the default image size is 2,048 × 1,088 pixels.
Both the custom-made target and a natural feature target at mid-span were tracked. Figure 3 shows a single captured video frame. The red dashed boxes in the figure include the custom-made target and the natural target. The latter comprises ribs of the box deck on the bridge soffit and while it is judged to be close to the artificial target it could be at a spanwise location differing by a few meters. To transform the image natural units (pixels) to the real world units (e.g., millimeters), a transformation metric reflecting the geometric relation between the 2D image plane and the 3D structural coordinate system is required, and planar homography method for camera calibration is used in this application. With the knowledge (Brownjohn et al., 2015) that the out-of-plane motion along the longitudinal direction of the bridge is negligible, the planar homogrpahy matrix was estimated based on four coplanar line correspondences between the 2D image plane and the 2D target surface plane. The lines with known dimensions came from the edge and diagonal of the installed artificial target frame.
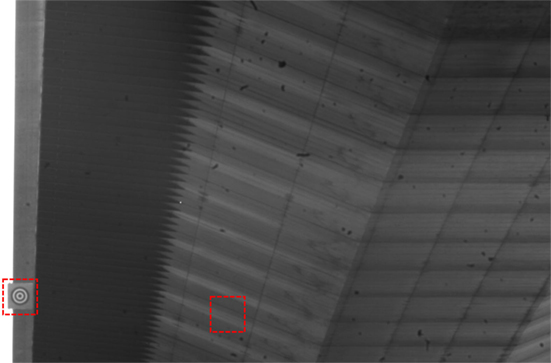
Figure 3. Captured frame from DMS video records with marked custom-made target and natural feature target.
During the test, a D-SLR camera was adapted to video-record traffic on the bridge. Figure 4A shows one captured frame from the video recorded when two heavy good vehicles (trucks) approached each other at mid-span from opposite directions. Figure 4B shows the corresponding measurement using the DMS in the vertical direction, with vertical deflection at mid-span caused by the two vehicles reaching 221 mm. In general, the measurements from tracking each of the two targets agree well; the DMS demonstrates similar performance for tracking either target.
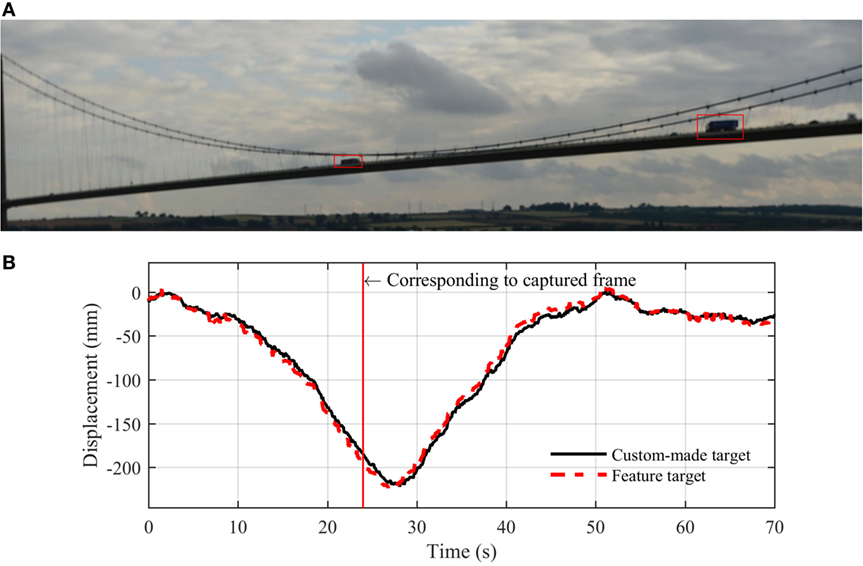
Figure 4. DMS measurement with two heavy vehicles approaching mid-span from opposite directions: (A) captured frame from video file by D-SLR camera and (B) vertical displacement measured by DMS.
Displacement from tracking the custom-made target was used for comparison with the displacement data from one of the mid-span GPS receivers. Figure 5A shows the vertical displacement measurement by DMS and the GPS receiver; the cross correlation coefficient of two signals is calculated to be 98.8%. Figure 5B shows a zoom-in view of 1-min of data. Consistent with reported GPS standard accuracy of 35 mm in vertical direction (Nickitopoulou et al., 2006), the accuracy of the GPS observation at Humber was at the centimeter level. For vision-based systems, it is hard to quantify the measurement accuracy on site since the true bridge motion is unknown. One approximate way to estimate the measurement accuracy is from target tracking accuracy using the scaling factor method
where Idisp and Sdisp are the target motions in the image plane (e.g., pixel) and structural system (e.g., millimeter); fpixel is the focal length of camera lens in terms of pixel units corresponding the focal length in terms of millimeters scaled by the camera sensor resolution; and D denotes the distance between the camera optical center and the target surface plane.
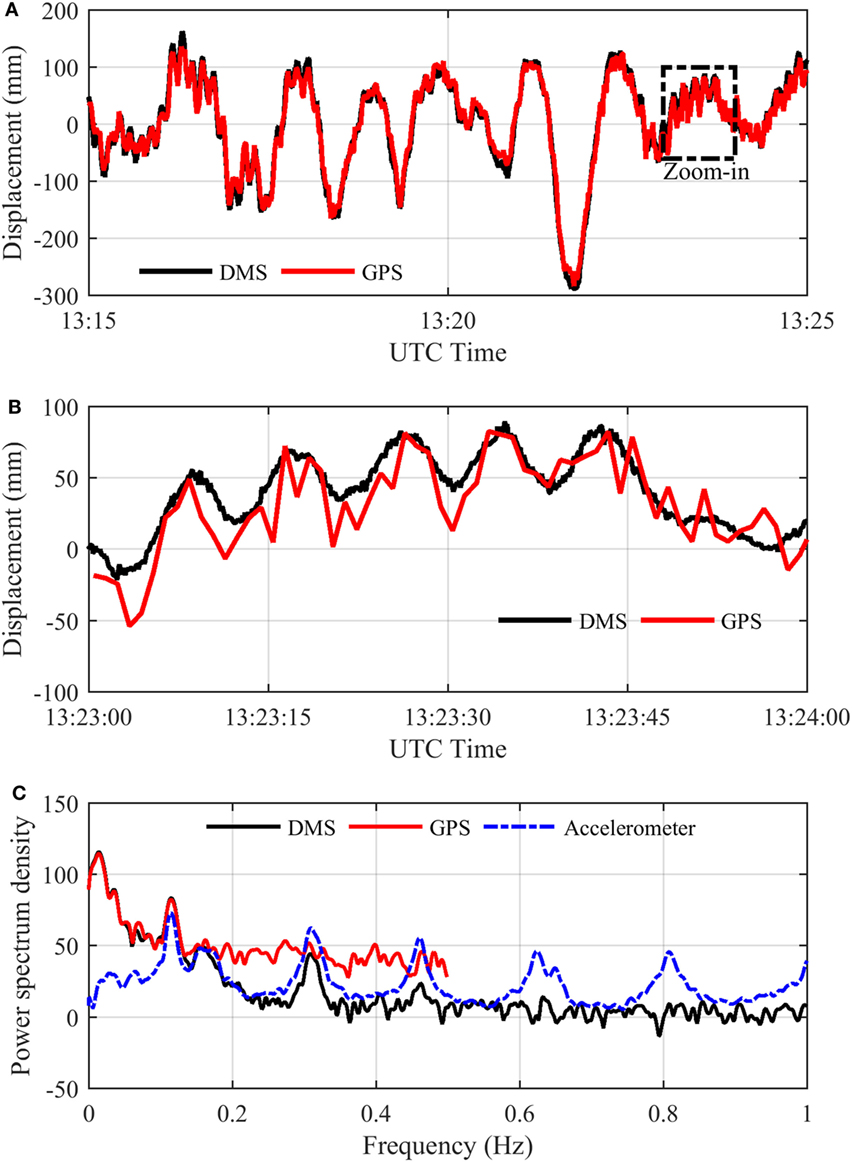
Figure 5. Comparison of vertical displacement by DMS and GPS: (A) 10-min signals of vertical displacement; (B) zoom of the area marked by rectangle in panel (A); and (C) power spectral density of displacement measurement signals.
The nominal resolution of Idisp in target tracking can be better than 0.01 pixel while the reported accuracy varies from 0.5 to 0.01 pixel (Bing et al., 2006) which is related to target pattern (texture contrast) (Busca et al., 2013) and illumination condition (reported in Section “Change of Target Pattern Due to Shadow and Illumination”). In this application, given the focal length of 300 mm, the camera sensor resolution at 0.0055 mm/pixel, and the camera-to-target distance at approximately 710 m, the accuracy of 0.1 pixel (artificial target of high-contrast pattern) in image plane corresponds to an accuracy (or rather resolution) of 1.3 mm in the structural system.
The power spectral densities of the DMS displacement signal, the GPS displacement signal, and the acceleration data were obtained by Welch’s method as shown in Figure 5C. From the previous studies on the bridge, it is known that (vertical) modal frequencies exist at 0.117, 0.31, and 0.46 Hz (Rahbari et al., 2015). The DMS captured the first and second vertical modal frequencies while the GPS captured only the first one. In theory, the DMS and GPS measurement sampled at 10 and 1 Hz, respectively, have the chance to capture modal frequencies in the range 0–0.5 Hz, but in fact they have failed. This is because the displacement induced by vehicle loads is always dominated by the static and quasi-static components while the dynamic component of displacement is relatively small (i.e., the root mean square of de-trended acceleration signal during this time interval is only 0.0016 g) and easily contaminated by the measurement noise. It indicates that the displacement sensor (either DMS or GPS) has the capacity to capture the dominant frequency component but might fail to capture some frequency components lower than the Nyquist frequency.
The challenges and performance limits using the DMS were investigated using four bridges including Humber Bridge, along with two short-span bridges in Exeter (the Exe North Bridge and the Station Road Bridge), and Tamar Bridge (Plymouth). The first issue to be explored was stability of the camera resulting in its movement and the consequent effect on apparent target position. The second issue was the effect of varying lighting conditions and shadows on the target.
In vision-based monitoring, structural displacement is derived from the difference in spatial location of structure target(s) relative to the camera center. As the reference, the camera pose (position and orientation) must remain unchanged during the test since very small rotations of the camera can translate to large errors in target position estimation. However, it is very challenging to guarantee this condition with full-scale applications. In the field, cameras might be shaken by the wind and the support might deflect due to movement of the ground, which could be due to people walking nearby. All these lead to errors in extracted structural displacement.
One solution is to provide a more rigid camera mounting. Figure 6A shows the original mounting of a 300 mm lens that is in effect a cantilever, and Figure 6B shows an improved and more substantial mounting. Although wind is still an issue, more robust results could be obtained with the new mounting (Brownjohn et al., 2016).
Improvement of the camera mounting could mitigate camera shake, but is not a direct solution to deal with the camera motion issue. Two methods are feasible to remove the error induced by camera motion:
(i) supplementary measurement of camera motion (Ehrhart and Lienhart, 2015) and
(ii) estimation of camera motion by tracking another target which is fixed in reality (Yoneyama and Ueda, 2012).
The first method requires additional sensors and data acquisition system as well as data fusion with the direct optical monitoring results. Ehrhart and Lienhart (2015) proposed a mixed system combing the camera with the total station. The total station provides angle measurement along the horizontal and vertical directions used to correct the camera motion influence. The second method is more promising and uses the same optical system. In the next section, the necessity and effectiveness of camera motion correction will be demonstrated through a mid-span deformation test on Tamar Bridge.
Tamar Bridge spans the River Tamar between Plymouth (Devon) on the East bank and Saltash (Cornwall) on the West bank. A single day of field testing using the DMS was intended to measure the lateral and vertical displacement at mid-span of the bridge. The system performance was evaluated by comparing with measurements by GPS.
As at Humber Bridge, the hardware included a GigE camera equipped with a 300-mm lens, data acquisition system, and a (smaller) artificial target. The camera was installed at the top of a steel tower shown in Figure 7A, 380 m away from mid-span. The data acquisition system including the controller and a monitor in Figure 7C was set at the nearby office of the bridge maintenance team. A custom-made 750 mm square target frame was mounted on the parapet at mid-span indicated in Figure 7B. Figure 7D shows one frame captured from the video files recorded on the test day. The derived output was the mid-span displacement in the vertical and lateral directions.
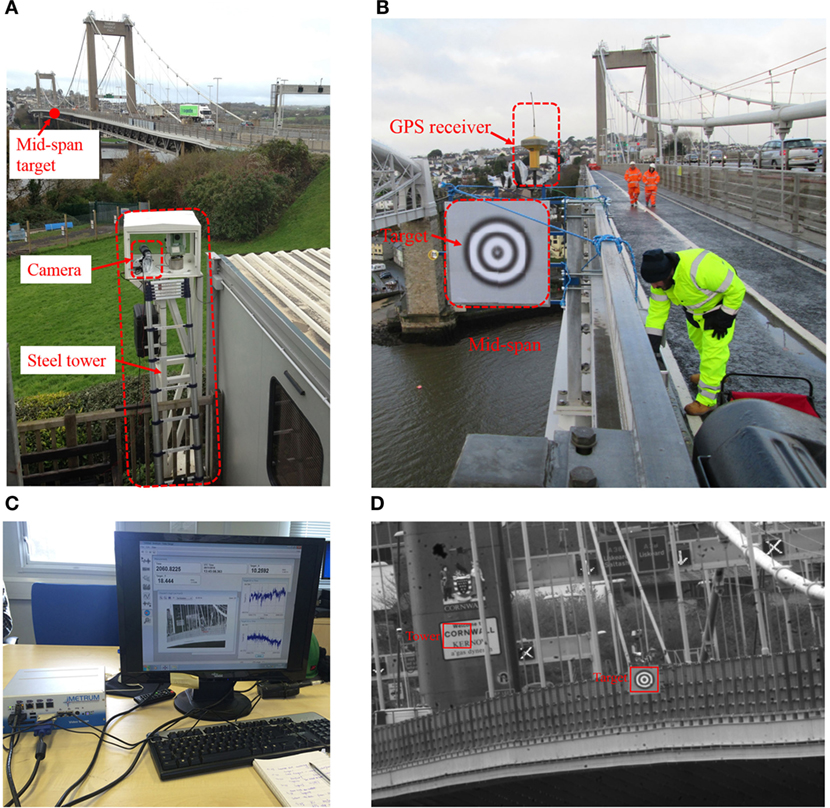
Figure 7. Camera system configurations in the Tamar Bridge test: (A) camera mounting location; (B) artificial target installed at mid-span; (C) data acquisition system for camera system; and (D) one captured video frame.
To evaluate the performance of the optical system, an independent GPS system (TOPCON GR-5 RTK) was used in the test. The base station was mounted on a sheltered and stable surveying tripod near the Tamar Bridge office while the GPS rover was attached to the top of the target frame at mid-span in Figure 7B. Sample rates for vision-based system and GPS were 10 and 2 Hz, respectively.
First, the direct measurement by the vision-based system is evaluated by comparing with the GPS measurement and the possible reasons for differences are discussed. Next, the direct measurement by the vision-based system is corrected according to the tracked “motion” of bridge tower and the corrected result is again compared with the GPS measurement. Note that GPS is not assumed to provide the true displacement signal, but rather a means of comparison.
Ten-min signals of the DMS and GPS measurement (between 11:20 a.m. and 11:30 a.m.) in vertical direction are shown with label “DMS (Target)” and “GPS” in Figure 9A. The signals are artificially offset in the vertical direction by 35 mm to provide a clear view. It is expected that the two measurement signals have the exact same movement shape and amplitude; however, the DMS measurement includes what appear to be high-frequency “vibrations” (e.g., from 11:22 to 11:24) and sharp peaks (e.g., 11.26) that do not appear in the GPS measurement.
The main working principle of vision-based system is by tracking the location of target projection in image and transforming the target locations in image to the true locations in structure via a transformation metric. Thus the error of displacement measurement is mainly induced by the error of the target tracking results and the estimated transformation metric. The target tracking accuracy varies from 0.5 to 0.01 pixel (Bing et al., 2006) which is related to target pattern (texture contrast) (Busca et al., 2013) and illumination condition. The target region in the recorded video file keeps in high-contrast pattern and experiences no sharp lighting change.
The transformation metric from the image plane to the structure system is dependent on camera internal features as well as camera-to-structure position and orientation. Since the camera is fixed in a stable location, the transformation metric is usually determined according to the initial condition without updating as time varies. Figure 8 gives a demonstration of estimation error in measured displacement induced by one-directional camera translation in a simplified camera-to-target configuration (when the target is initially in the principal axis). If the camera center has a translational movement due to environment or human intervention, the projection of a fixed target (Os) is moved from OI to PI in image. The predicted target location in structure according to the pre-determined transformation metric will be shifted to PS, leading to displacement estimate error |OsPs|.
The camera was mounted at the top of a very stiff steel tower, although a ladder had to be used for setup adjustment. The camera had consistent motion together with the steel tower, leading to error in the DMS measurement when the ladder was used. As a result, the raw measurement using the DMS could not be trusted and it was necessary to use correction techniques to compensate for the error induced by the camera motion.
A feasible approach for camera motion correction is through tracking a reference region that is physically fixed; in this case the far (Saltash) bridge tower. The towers were constructed from reinforced concrete and sit on caisson foundations founded on rock (Koo et al., 2013) so are extremely stiff and experience only minute vertical deformations induced by extreme traffic loads (Westgate et al., 2013) and temperature variation (Koo et al., 2013). Hence, the true tower deformation would be dominated by low-frequency components small in amplitude compared with the mid-span displacement. The natural feature target in bridge tower was a rectangular region of a sign (“Welcome to CORNWALL”) on the tower surface shown as a red box in Figure 7D and tracked simultaneously with the mid-span target. The estimated displacement of the bridge tower shown as a dashed line in Figure 9A is not constant but includes the same high-frequency “vibrations” (e.g., from 11:22 to 11:24) and sharp peaks (e.g., 11.26) observed in the target displacement obtained using the DMS. This proved the assumption that the main DMS error was due to the camera motion. The correction to the directly tracked target location in the image plane is deduced using the tower “motion” in the image plane and then transformed to structural displacement via a transformation metric (planar homography matrix here).
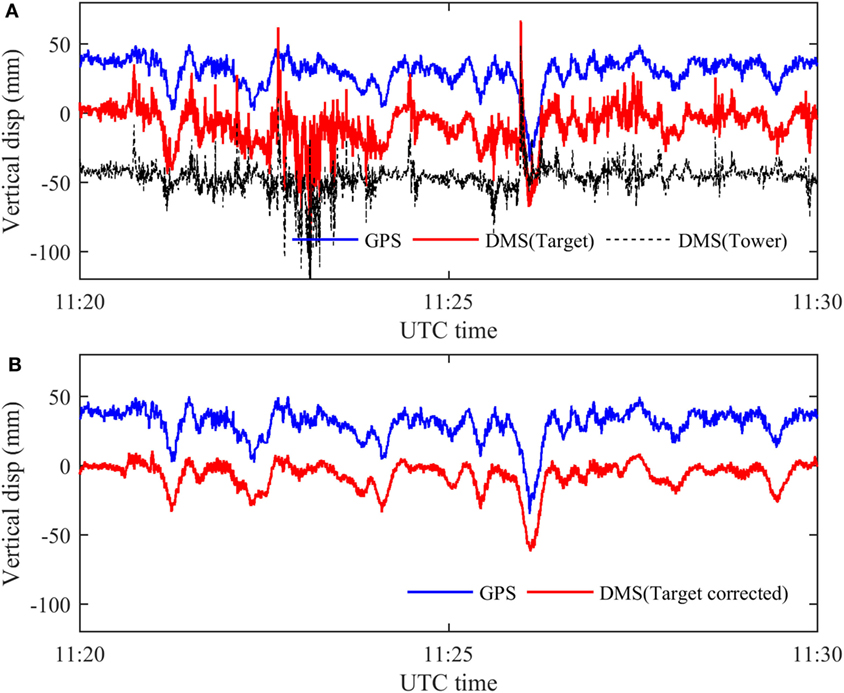
Figure 9. Measurement of Tamar Bridge vertical displacement by GPS and DMS: (A) GPS measurement and DMS raw measurement and (B) GPS measurement and DMS corrected measurement.
The corrected result of structural displacement is shown as the lower line in Figure 9B together with the GPS measurement. The two signals resemble each other, and the cross correlation coefficient of two signals is calculated to be 95%. Different GPS units were used at Humber Bridge and Tamar Bridge and it seems that the temporary system used at Tamar Bridge provided a more reliable reference than the (older) system used at Humber Bridge.
Sometimes the target pattern changes due to the shadow of adjacent structures, leading to tracking failure. In the Humber Bridge test, about half an hour before sunset (which in July is around 8 p.m. UTC, 9 p.m. British Summer Time), the target panel on the east side was in the shadow of the bridge railings shown in Figure 10. Due to the low sun elevation, the video frame flickered when tall vehicles passed briefly between the sun and the target and obstructed the sunlight. This flickering was observed by eye and was unrelated to camera setting. There is no similar effect on the natural feature target because it was only illuminated by the sun in the very early morning before the measurements started.
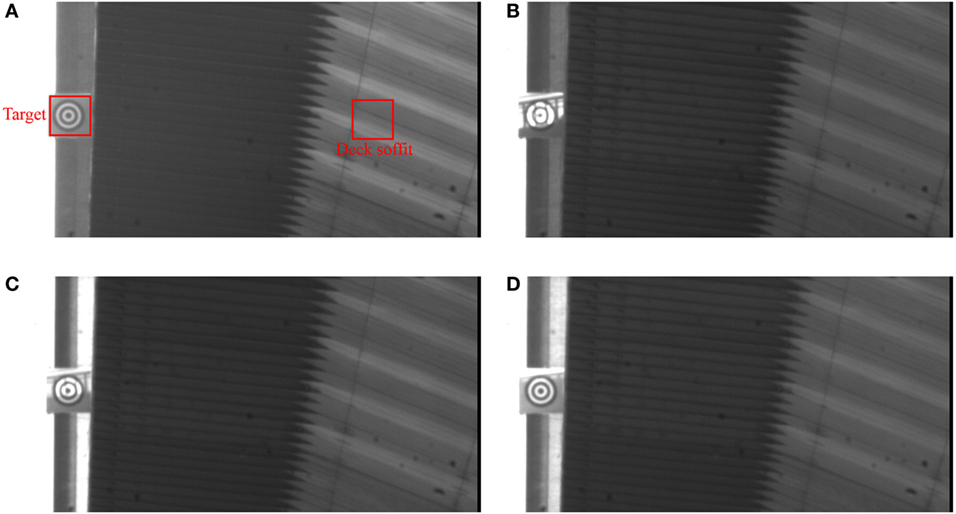
Figure 10. Captured frames from video file (UTC time): (A) video frame at 19:10; (B) video frame at 19:12; (C) video frame at 19:20; and (D) video frame at 19:29.
As described previously, an artificial target at mid-span and another feature pattern located at the deck soffit shown in the red box in Figure 10A and the measurement results are shown in Figure 11 for the period 19:10 to 19:30 UTC. Data are missing between 19:15 and 19:20 when the system failed to track the pattern of the artificial target, while the natural feature target in the soffit was not affected. Hence, the natural target in this case provided a second advantage in addition to not needing to access the structure.
Initial Testing and Results
The testing set up used in an early system trial in Exeter similar to that shown in Figure 1, but cameras positioned on the North and South sides of the 36 m span road bridge and using 85 and 180 mm lenses, respectively. As the bridge uses a painted (gray) steel girder there is very little natural texture in the image, so blurred concentric roundel artificial targets were stuck to North and South faces having dimension 150 mm square.
Dimension lines physically marked on the target were used as references to calibrate the planar homography matrix in the video-processing package.
The mid-span vertical displacement returned by the system for the South side of the bridge are shown in Figure 12 in the form of raw data and an overlaid “average” plot (using a moving average filter). The average plot shows displacement starting from 0, increasing to approximately 1 mm after 250 s and then falling back toward 0. In this time, only a few occasional light vehicles (cars) crossed the bridge providing no credible loading pattern that could have caused such vertical deflection.
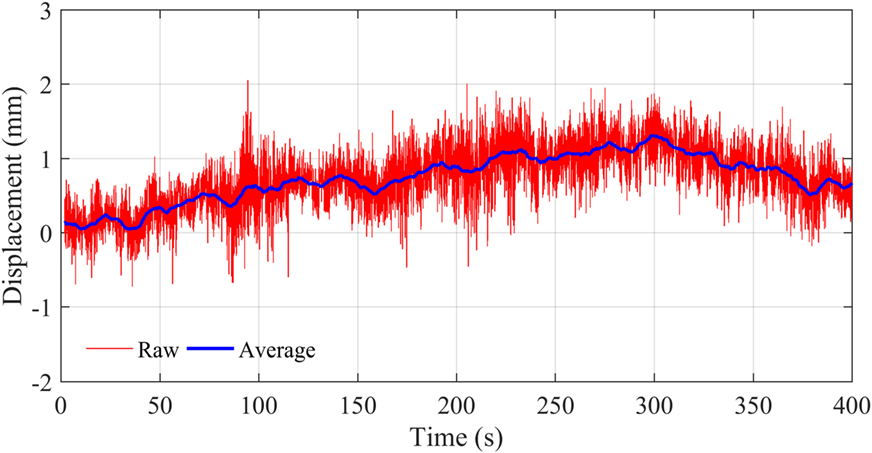
Figure 12. Vertical displacement (millimeters) using the DMS in the first 400 s of the test on the South side of bridge.
Previous modal testing of the bridge identified first bending and first torsion mode frequencies at 3.1 and 4.9 Hz, respectively. The high-frequency movement in the figure does not resemble dynamic bridge movements has no characteristic frequency content and the FFT shows no clear peaks at 3.1 or 4.9 Hz. So, as with the horizontal displacement, the vertical data obtained in this video gauge deployment are not usable. Discussion with Imetrum revealed that the noise/drift observed was very likely due to varying lighting conditions.
The target tracking algorithm used in the DMS is correlation-based template matching which uses the similarity level of image intensities between two subset frames as the matching metric. This method is widely used in structural monitoring (Stephen et al., 1993; Feng et al., 2015) due to the advantages, e.g., it is easy to use with little user intervention and has less requirement about saliency of target patterns compared to other methods. However, it is more sensitive to brightness changes compared with other tracking methods, e.g., phase-based optical flow estimation (Chen et al., 2015a) and descriptor-based feature matching (Khuc and Necati Catbas, 2016).
Modifications and Improved Results
Following the site work described in Section “Initial Testing and Results,” a software update with autoexposure feature was released. To check if the autoexposure feature improved results, the test described was repeated, providing much improved results. In the revised test setup, both cameras pointed at the same target on one side of the bridge. Figure 13 shows the mid-span vertical displacement measured during the test in which it is evident, by comparison to Figure 12, that autoexposure reduces the amount of noise and drift significantly. In this test, the displacement stays around 0 mm, except at 50, 60, 100, and 110 s where single or multiple cars or light trucks crossed the bridge resulting in credible displacements in the region of 0.2 mm. Such a value is consistent with deformation values estimated using structural properties of the bridge (material, section, and span) and the approximate weight of a cars and trucks.
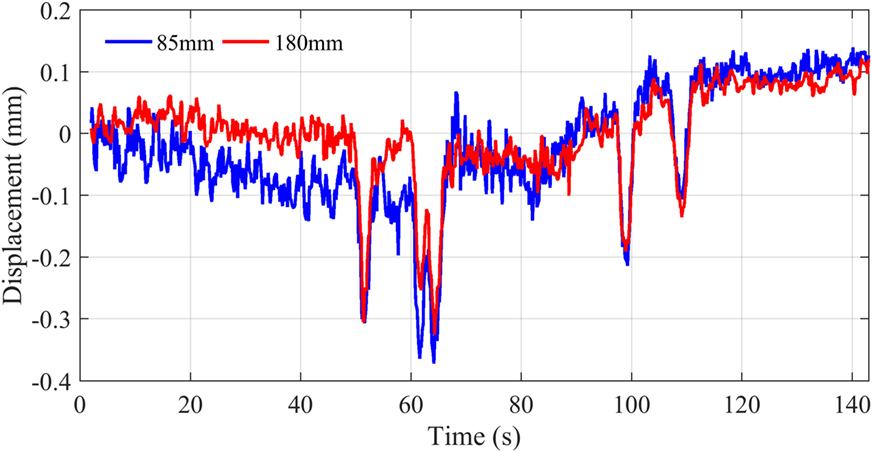
Figure 13. Repeat test configuration and results from test using autoexposure feature of the software.
Test at Night
No active illumination was provided for the targets in the two long san bridge tests. For Humber Bridge, as night fell, the steady exposure was reached at the expense of gradually declining sampling rate. The recording was stopped as darkness fell when displacement measurement sampling at less than 2 Hz was not able to provide a trackable sequence of images.
For monitoring campaigns in daytime especially on sunny days, the autoexposure setting in camera ensures tracking performance more robust to environmental illumination variation. For testing at night, additional illumination is suggested (Stephen et al., 1993; Macdonald et al., 1997).
The Imetrum DMS is validated to be a mature, accurate, and stable optical system for bridge deformation measurement over long ranges and over several hours within a day, but it is a proprietary solution and there remain open various research routes to wider applications and lower costs in non-contact sensing. This section considers these routes in terms of concept, procedures, and the potential for improvement.
In the field applications at Humber Bridge and Tamar Bridge, one single GigE camera with 300 mm lens was used for recording. During the video processing, correlation-based template matching (Potter and Setchell, 2014) was used for target tracking and planar homography method was used for camera calibration to determine the transform relation between the image plane and the structural system. The final output was the two-dimensional structural displacement along the vertical and transverse directions at bridge mid-span.
Regarding hardware component of an optical system:
1. Professional high-resolution cameras equipped with long focal length lens used in the DMS are necessary for long-range monitoring. For short-distance monitoring, consumer-grade cameras or smartphones could be alternatives reducing system cost. Consumer-grade cameras have been validated as feasible for displacement measurement and system identification in laboratory testing (Yoon et al., 2016), but reports of field implementations are hard to find.
2. Custom-made artificial targets were used in the study reported here, requiring direct access to the bridge for installation. The role of artificial targets here includes (i) providing dimensional information for calibrating transformation metric in camera calibration step and (ii) providing salient features to improve tracking accuracy. The target tracking algorithm used in the DMS is effective to track the feature target as validated by Figure 4 thus the second function could be ignored. The remaining obstacle of avoiding the need for a cumbersome artificial target is involved in camera calibration step.
Regarding the video-processing methodologies:
(1) Camera calibration is aimed at determining the transformation metric between the image natural units (pixels) and the real world units (e.g., millimeter). The scaling factor method using the camera-to-target distance (Khuc and Necati Catbas, 2016; Yoon et al., 2016) or merging optical system with a total station (Charalampous et al., 2015; Ehrhart and Lienhart, 2015) has no requirement about known geometric information. However, these applications are based on the prerequisite that the camera principal axis is perpendicular to the target surface plane and are thus not suggested. The general form of transformation metric (i.e., planar homography matrix or full projection matrix) is related to camera internal features (i.e., focal length, principal point locations, etc.) as well as the camera-to-target geometric relation (i.e., position and orientation of camera in structural coordinate system). Parameters describing camera internal features (i.e., camera intrinsic matrix) can be determined in the laboratory ahead of a field test, i.e., using the camera to observe a planar calibration object in a few different views (Zhang, 2000). However, determination of camera position and orientation (i.e., camera extrinsic matrix) requires some geometric information from the structure (at least four coplanar point locations). The points with known locations are usually provided by attached artificial targets, e.g., planar chessboard target (Chang and Ji, 2007), planar T-shape wand with active markers attached (Park et al., 2015), or 3D calibration object with four non-planar active targets (Martins et al., 2015). To achieve complete contactless sensing, efforts should be spent on alternative means to obtain dimension information in structure, e.g., through surveying or structural design drawings.
(2) Correlation-based template matching is used for target tracking in the DMS and is validated to provide good performance in either short-range or long-range monitoring campaigns. Correlation-based template matching is based on matching two subset images by similarity level. It assumes that each pixel within the selected rectangular region (target projection) in an image has identical image motion in two-dimensional translation. Thus, template matching is not the best choice to track slender structural components, e.g., cables in a cable-supported structure. This is because the target region bounded by a rectangle window might include some background pixels, e.g., clouds and tree branches. The background pixels with motion inconsistent with the true structural motion will contaminate the template matching results. In this case, the preferred choices of target tracking algorithms are optical flow estimation (Yoon et al., 2016) and feature point matching (Khuc and Necati Catbas, 2016) which are based on tracking sparse points within the target region and are supportive to remove outlier among point correspondences.
Based on optical system concepts, structural motion monitoring is possible with a single consumer-grade camera and a custom-developed video-processing package. This section shows a simple field implementation of a non-proprietary optical system for cable vibration monitoring to Miller’s Crossing cable-stayed footbridge in Exeter, UK (Figure 14).

Figure 14. Captured frame from Gopro video: (A) raw image and (B) image after distortion correction.
One of the shorter footbridge cables is known to vibrate due to pedestrian traffic, so pedestrian excitation (jumping at the 2.4 Hz vertical natural frequency) was used to obtain the dynamic parameters of the cable.
Contacting sensors for cable vibration measurement, e.g., accelerometers and strain gauges require troublesome direct access to the cable at height whereas a non-contact optical system offers the possibility of quick, easy, and economic measurement. In this application, a consumer-grade camera was used to record the video that was post-processed using video-processing code custom-developed in MATLAB. A Gopro Hero4 Session video camera was mounted on a tripod 30 m away from the bridge for recording; a sample frame is shown in Figure 14A. Since the monitoring purpose is only for system identification, specifically estimating modal parameters of cable vibration, and exact vibration values are not required (Kim and Kim, 2013; Chen et al., 2015b), the video-processing package includes only the target tracking step to extract the cable motion projected in image. The image includes salient distortion due to the wide angle lens, thus the distortion was removed ahead of target tracking using offline camera calibration (Chang and Ji, 2007) and the corrected image is shown in Figure 14B.
The target tracking algorithm is based on edge detection using the Sobel–Zernike moment operator (Ghosal and Mehrotra, 1993; Ying-Dong et al., 2005) with a region of interest including a small cable segment selected for tracking. An arbitrary direction, e.g., normal to an identified edge was assumed as the cable motion direction and the distance between identified edges within two frames corresponded to the cable motion projected in the image which inherently has subpixel resolution. Even if motion direction is not transverse to line of sight there is no influence on the identification of cable natural frequencies.
Figures 15A,B show time histories of cable motion, with the maximum motion in the image estimated to be 0.583 pixel. The corresponding power spectrum density is presented in Figure 15C identifying peak frequencies at 2.53, 5.03, and 7.6 Hz. These values could be used with known length and mass properties to estimate cable tension.
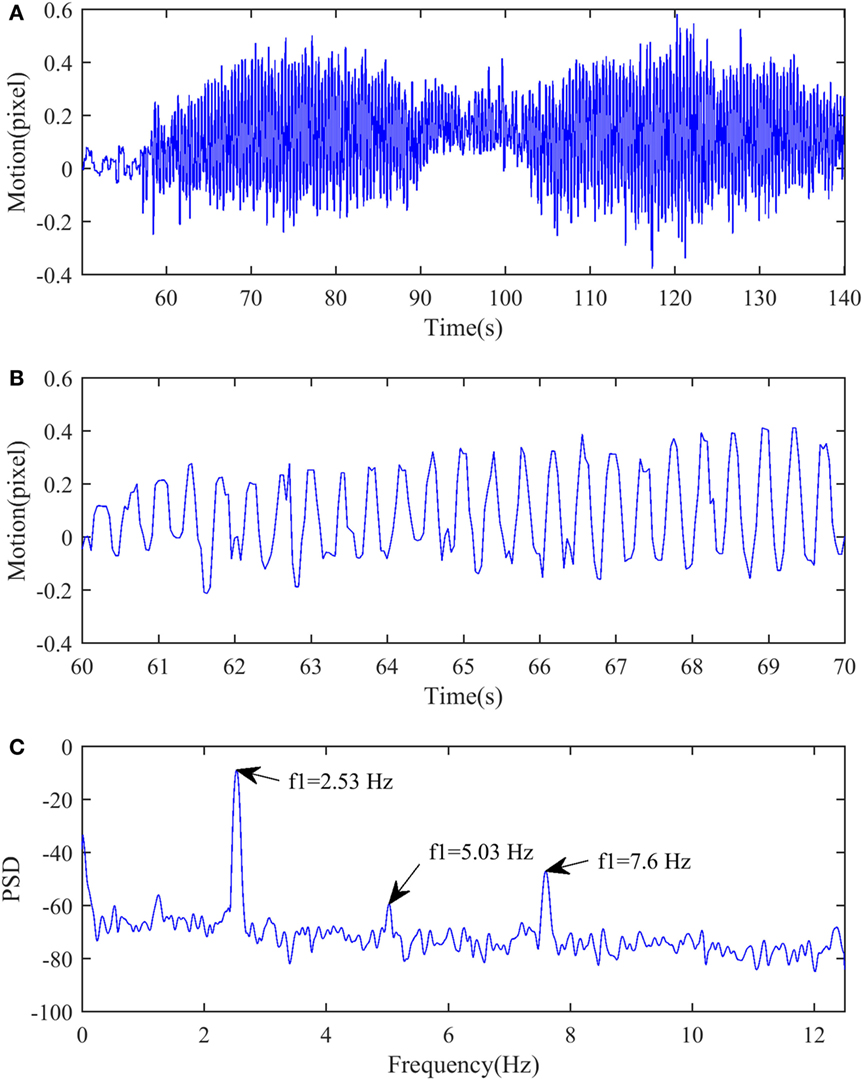
Figure 15. Tracking results of cable motion: (A) cable motion in time history, (B) zoom-in view of cable motion, and (C) power spectral density of cable motion.
This example of a simple non-contact optical system for cable vibration monitoring shows the potential for vibration measurement of other slender line-shape structural components, e.g., transmission towers using consumer-grade cameras.
The paper presents experiences using proprietary as well as “open source” optical systems for bridge deformation monitoring. The value of this technology is that it frees the user from the difficult and expensive task of attaching sensors to structural locations that are difficult to access and where use of signal cables presents additional problems.
There are difficulties in using optical systems, such as basic practical issues of rigid camera fixing and variable lighting conditions. Long-term applications require the type of safety and security taken for granted in CCTV systems, and fusion with other fast sampled data streams, e.g., accelerometers needs to be addressed. With these steps there can be significant capability enhancement in long-term monitoring.
DMS is a mature and stable system that provides necessary accuracy for measurements at long range using long-focus lens, but there are several lower cost open-source options which might be a better choice for less demanding applications.
These options can include consumer-grade camera (such as the currently popular GoPro) and are most effective where precise spatial measurements are not necessary, such as for system identification, e.g., of natural frequencies.
Where precise tracking is needed, a particular difficulty is provision of scaling for an accurate transformation from image to structure coordinates. Artificial targets can be used to provide dimensional information for direct calibration of the complete system and also enhance tracking but they lose the advantage of not needing to access the structure. Alternative approaches, e.g., using survey instruments or reading dimensional information from structural design drawings are promising.
As for target tracking, correlation-based template matching algorithms such as used in the DMS are not appropriate for certain types of structure, e.g., cables, particular since pixels within a selected template (a rectangular subset from a video frame) might cover structural components as well as some background (e.g., clouds and tree branches) and have inconsistent motions.
Tracking natural targets could reach similar accuracy as for artificial targets. Targets preferred in field are those with high contrast and having stable patterns over time.
The experience so far is encouraging and is leading to “full field” application that could potentially replace conventional wired sensor arrays and find greater application in commercial monitoring applications.
JB supervised and resourced the research and fully participated in the experimental work. YX did the processing. DH was in charge of the experimental work. All contributed to the writing.
The authors declare that the research was conducted in the absence of any commercial or financial relationships that could be construed as a potential conflict of interest.
The authors would like to thank Humber Bridge Board, Tamar Bridge, Torpoint Ferry Joint Committee, and Devon County Council for permission to use their bridges and for assistance they provided with the measurements. Also thanks to James Bassitt, Dr. Ki Koo, and staff at Imetrum for support in the field testing.
The GPS system at Humber was created by Dr. Ki Koo with support from EPSRC grant EP/F035403/1. DH was supported via the Marie Curie Fellowship programme and as such the research leading to these results has received funding from the People Programme (Marie Curie Actions) of the European Union’s Seventh Framework Programme (FP7/2007-2013) under grant agreement n° 330195.
Ahola, R., and Tervaskanto, M. (1991). “A position sensing laser system for analysing dynamic deflections in large structures,” in F. Meas. Geotech., ed. Sorum (Oslo: Norwegian Geotechnical Institute), 129–137.
BBC News. (2016). Seized Pin Caused Forth Road Bridge Fault, Engineer Tells Holyrood Inquiry. BBC News Web Site. Available at: http://www.bbc.co.uk/news/uk-scotland-scotland-politics-35354846
Bing, P., Hui-min, X., Bo-qin, X., and Fu-long, D. (2006). Performance of sub-pixel registration algorithms in digital image correlation. Meas. Sci. Technol. 17, 1615–1621. doi:10.1088/0957-0233/17/6/045
Brownjohn, J. M. W., Bocciolone, M., Curami, A., Falco, M., and Zasso, A. (1994). Humber Bridge full-scale measurements campaigns 1990-1991. J. Wind Eng. Ind. Aerodyn. 52, 185–218. doi:10.1016/0167-6105(94)90047-7
Brownjohn, J. M. W., Hester, D., Xu, Y., Bassitt, J., and Koo, K. (2016). “Viability of optical tracking systems for monitoring deformations of a long span bridge,” in 6th Eur. Conf. Struct. Control (Sheffield, UK: European Association for the Control of Structures).
Brownjohn, J. M. W., Koo, K.-Y., Scullion, A., and List, D. (2015). Operational deformations in long-span bridges. Struct. Infrastruct. Eng. 11, 556–574. doi:10.1080/15732479.2014.951857
Busca, G., Cigada, A., Mazzoleni, P., and Zappa, E. (2013). Vibration monitoring of multiple bridge points by means of a unique vision-based measuring system. Exp. Mech. 54, 255–271. doi:10.1007/s11340-013-9784-8
Chang, C. C., and Ji, Y. F. (2007). Flexible videogrammetric technique for three-dimensional structural vibration measurement. J. Eng. Mech. 133, 656–664. doi:10.1061/(ASCE)0733-9399(2007)133:6(656)
Chang, C. C., and Xiao, X. H. (2010). Three-dimensional structural translation and rotation measurement using monocular videogrammetry. J. Eng. Mech. 136, 840–848. doi:10.1061/(ASCE)EM.1943-7889.0000127
Charalampous, E., Psimoulis, P., Guillaume, S., Spiridonakos, M., Klis, R., Bürki, B., et al. (2015). Measuring sub-mm structural displacements using QDaedalus: a digital clip-on measuring system developed for total stations. Appl. Geomatics 7, 91–101. doi:10.1007/s12518-014-0150-z
Chen, J. G., Wadhwa, N., Cha, Y., Durand, F., and Freeman, W. T. (2015a). Modal identification of simple structures with high-speed video using motion magnification. J. Sound Vib. 345, 58–71. doi:10.1016/j.jsv.2015.01.024
Chen, C. C., Wu, W. H., Tseng, H. Z., Chen, C. H., and Lai, G. (2015b). Application of digital photogrammetry techniques in identifying the mode shape ratios of stay cables with multiple camcorders. Measurement 75, 134–146. doi:10.1016/j.measurement.2015.07.037
Ehrhart, M., and Lienhart, W. (2015). Monitoring of civil engineering structures using a state-of-the-art image assisted total station. J. Appl. Geodes. 9, 174–182. doi:10.1515/jag-2015-0005
Erdoğan, H., and Gülal, E. (2011). Ambient vibration measurements of the bosphorus suspension bridge by total station and GPS. Exp. Tech. 37, 16–23. doi:10.1111/j.1747-1567.2011.00723.x
Feng, D., Feng, M., Ozer, E., and Fukuda, Y. (2015). A vision-based sensor for noncontact structural displacement measurement. Sensors (Basel) 15, 16557–16575. doi:10.3390/s150716557
Fleet, D. J., and Jepson, A. D. (1990). Computation of component image velocity from local phase information. Int. J. Comput. Vis. 5, 77–104. doi:10.1007/BF00056772
Ghosal, S., and Mehrotra, R. (1993). Orthogonal moment operators for subpixel edge detection. Pattern Recognit. 26, 295–306. doi:10.1016/0031-3203(93)90038-X
Greenbaum, R. J. Y., Smyth, A. W., and Chatzis, M. N. (2016). Monocular computer vision method for the experimental study of three-dimensional rocking motion. J. Eng. Mech. 142, 1–20. doi:10.1061/(ASCE)EM.1943-7889.0000972
Hartley, R., and Zisserman, A. (2003). Multiple View Geometry in Computer Vision. Cambridge: Cambridge University Press.
Khuc, T., and Necati Catbas, F. (2016). Completely contactless structural health monitoring of real-life structures using cameras and computer vision. Struct. Contr. Health Monit. 24, e1852. doi:10.1002/stc.1852
Kim, S.-W., and Kim, N.-S. (2013). Dynamic characteristics of suspension bridge hanger cables using digital image processing. NDT E Int. 59, 25–33. doi:10.1016/j.ndteint.2013.05.002
Ko, J. M., and Ni, Y. Q. (2005). “Upgrade of a structural health monitoring system for the suspension Jiangyin Bridge,” in Proceeding 4th Int. Semin. Saf. Infrastruct, eds G.-H. Juhn, C.-B. Yun, and B. F. Spencer (Gyeongju).
Koo, K.-Y., Brownjohn, J. M. W., List, D. I., and Cole, R. (2013). Structural health monitoring of the Tamar suspension bridge. Struct. Contr. Health Monit. 20, 609–625. doi:10.1002/stc.1481
Macdonald, J. H. G., Dagless, E. L., Thomas, B. T., and Taylor, C. A. (1997). Dynamic measurements of the Second Severn Crossing. Proc. Inst. Civ. Eng. Transport 123, 241–248.
Martins, L. L., Rebordão, J. M., and Ribeiro, A. S. (2015). Structural observation of long-span suspension bridges for safety assessment: implementation of an optical displacement measurement system. J. Phys. Conf. Ser. 588, 012004. doi:10.1088/1742-6596/588/1/012004
Nickitopoulou, A., Protopsalti, K., and Stiros, S. C. (2006). Monitoring dynamic and quasi-static deformations of large flexible engineering structures with GPS: accuracy, limitations and promises. Eng. Struct. 28, 1471–1482. doi:10.1016/j.engstruct.2006.02.001
Oh, B. K., Hwang, J. W., Kim, Y., Cho, T., and Park, H. S. (2015). Vision-based system identification technique for building structures using a motion capture system. J. Sound Vib. 356, 72–85. doi:10.1016/j.jsv.2015.07.011
Ozbek, M., Rixen, D. J., and Verbruggen, T. W. (2009). “Remote monitoring of wind turbine dynamics by laser interferometry: phase1,” in Proc. IMAC-XXVII, Society for Experimental Mechanics (SEM) (Orlando, FL), 1–8.
Park, S. W., Park, H. S., Kim, J. H., and Adeli, H. (2015). 3D displacement measurement model for health monitoring of structures using a motion capture system. Measurement 59, 352–362. doi:10.1016/j.measurement.2014.09.063
Potter, K. D., and Setchell, C. (2014). Positional Measurement of a Feature within an Image. U.S. Patent 8,718,403.
Rahbari, R., Niu, J., Brownjohn, J. M. W., and Koo, K. Y. Y. (2015). Structural identification of Humber Bridge for performance prognosis. Smart Struct. Syst. 15, 665–682. doi:10.12989/sss.2015.15.3.665
Santos, C. A., Costa, C. O., and Batista, J. (2016). A vision-based system for measuring the displacements of large structures: simultaneous adaptive calibration and full motion estimation. Mech. Syst. Signal Process 72–73, 678–694. doi:10.1016/j.ymssp.2015.10.033
Schreier, H. W. (2004). Advances in light microscope stereo vision. Exp. Mech. 44, 278–288. doi:10.1177/0014485104041546
Stephen, G. A., Brownjohn, J. M. W., and Taylor, C. A. (1993). Measurements of static and dynamic displacement from visual monitoring of the Humber Bridge. Eng. Struct. 15, 197–208. doi:10.1016/0141-0296(93)90054-8
Szeliski, R. (2010). Computer Vision: Algorithms and Applications. London: Springer Science & Business Media.
Tomasi, C., and Kanade, T. (1991). Detection and Tracking of Point Features. Pittsburgh: School of Computer Science, Carnegie Mellon University.
University of Washington. (1954). Aerodynamic Stability of Suspension Bridges with Special Reference to the Tacoma Narrows Bridge. USA: University of Washington Engineering Experiment Station. Bulletin No. 116.
Westgate, R. J., Koo, K. Y., Brownjohn, J. M. W., and List, D. I. (2013). Suspension bridge response due to extreme vehicle loads. Struct. Infrastruct. Eng. 821–833. doi:10.1080/15732479.2013.767844
Xu, Y., Brownjohn, J., Hester, D., and Koo, K. (2016). “Dynamic displacement measurement of a long span bridge using vision-based system,” in 8th Eur. Work. Struct. Heal. Monit (Bilbao, Spain).
Ying-Dong, Q., Cheng-Song, C., San-Ben, C., and Jin-Quan, L. (2005). A fast subpixel edge detection method using Sobel-Zernike moments operator. Image Vis. Comput. 23, 11–17. doi:10.1016/j.imavis.2004.07.003
Yoneyama, S., and Ueda, H. (2012). Bridge deflection measurement using digital image correlation with camera movement correction. Mater. Trans. 53, 285–290. doi:10.2320/matertrans.I-M2011843
Yoon, H., Elanwar, H., Choi, H., Golparvar-Fard, M., and Spencer, B. F. (2016). Target-free approach for vision-based structural system identification using consumer-grade cameras. Struct. Contr. Health Monit. 23, 1405–1416. doi:10.1002/stc.1850
Keywords: vision-based system, camera calibration, template matching, optical flow, structural displacement
Citation: Brownjohn JMW, Xu Y and Hester D (2017) Vision-Based Bridge Deformation Monitoring. Front. Built Environ. 3:23. doi: 10.3389/fbuil.2017.00023
Received: 23 January 2017; Accepted: 30 March 2017;
Published: 19 April 2017
Edited by:
Branko Glisic, Princeton University, USAReviewed by:
Matthew Yarnold, Tennessee Technological University, USACopyright: © 2017 Brownjohn, Xu and Hester. This is an open-access article distributed under the terms of the Creative Commons Attribution License (CC BY). The use, distribution or reproduction in other forums is permitted, provided the original author(s) or licensor are credited and that the original publication in this journal is cited, in accordance with accepted academic practice. No use, distribution or reproduction is permitted which does not comply with these terms.
*Correspondence: James Mark William Brownjohn, ai5icm93bmpvaG5AZXhldGVyLmFjLnVr
Disclaimer: All claims expressed in this article are solely those of the authors and do not necessarily represent those of their affiliated organizations, or those of the publisher, the editors and the reviewers. Any product that may be evaluated in this article or claim that may be made by its manufacturer is not guaranteed or endorsed by the publisher.
Research integrity at Frontiers

Learn more about the work of our research integrity team to safeguard the quality of each article we publish.