- 1TNO, Delft, Netherlands
- 2Ingenieurburo Puthli, Schüttorf, Germany
An atmospheric boundary layer wind tunnel study was performed to determine the overall horizontal wind load on multi-span duo-pitch greenhouses. The results of this study are intended for the stability design of inflexible cladding system greenhouses (designated as Class A in EN 13031-1) with roof pitch angles of 23–24°and ridge heights of 7.5–8 m. Both static force and fluctuating pressure measurements were performed to determine the overall horizontal wind force. The results obtained with the static force measurements show that the overall horizontal wind force increases linearly with increasing number of spans. The overall horizontal wind load determined with the mean pressure coefficients derived from the fluctuating pressure measurements was found to be in good agreement with the static force measurements. An investigation into the correlation of the roof pressures showed that these pressures are relatively little correlated. The overall horizontal force on the roof of multi-span buildings reduces significantly because of this lack of correlation. Accounting for the lack of correlation between the roof pressures on a 30-span model resulted in a 65% reduction of the peak horizontal wind force on the roof. A comparison was made of the overall horizontal wind forces determined in the current study and calculated with European codes for wind load assessment on greenhouses. EN 13031-1 provides non-conservative outcomes for the overall horizontal wind force on the investigated duo-pitch greenhouse type with more than 30 spans. On the other hand, EN 1991-1-4 is increasingly conservative with larger number of spans.
Highlights
1. The finding that the overall horizontal wind force on multi-span duo-pitch greenhouses increases linearly with increasing number of spans.
2. The quantification of the lack of correlation between roof faces on multi-span duo-pitch buildings, demonstrating the importance of this effect for the overall horizontal wind force.
3. The identification of the need for positive values, besides negative values, for the pressure coefficients in EN 1991-1-4 and EN 13031-1 on wind-facing roof faces beyond the first roof span.
4. The conclusion that EN 13031-1 provides non-conservative outcomes for the overall horizontal wind force on duo-pitch greenhouses (with roof pitch angle 23–24°) larger than 30 spans, and that, beyond 10 spans, EN 1991-1-4 is increasingly conservative with larger number of spans.
Introduction
Greenhouses in Europe have grown in size over the last decades. For example, in the Netherlands between 2000 and 2014, the surface area of greenhouses per company has more than doubled, with an increase from 0.95 to 2.15 ha (LEI Wageningen UR, 2015). Greenhouses of 40 spans or more are common in the Netherlands.
For these large lightweight structures, structural failure can result in large financial losses. Wind loads are responsible for a large amount of the damage to greenhouses, and are therefore an important factor in the structural design of greenhouses. Previous wind load studies on greenhouses (Van Koten and Bos, 1974; Van Koten, 1977; Wells and Hoxey, 1980; Holmes, 1983, 1987; Hoxey and Moran, 1991; Stathopoulos and Saathoff, 1991; Cui, 2007) have investigated wind loads on the first nine roof spans only. No studies were found that provide results on subsequent roof spans. This lack of information, beyond nine roof spans, has had an impact on European codes which specify wind loads on greenhouses. After nine spans, EN 13031-1 (CEN, 2001) assumes the external pressure at the wind- and lee-facing surface of a roof span to be equal, so that no further horizontal forces arise. In the model of EN 1991-1-4 (CEN, 2010) for multi-span roofs, 60% of the wind loads on a single troughed duo-pitch roof are recommended on all roof spans beyond the second ridge. For greenhouses larger than 10 spans, these two approaches will result in different outcomes for the overall horizontal wind force. Moreover, with larger number of spans, the difference will be larger. Clarity about the horizontal wind force on large multi-span greenhouses is needed for safe and economic design.
This study investigates the overall wind load on a typical multi-span duo-pitch greenhouse. It mainly focuses on two topics particularly relevant for large multi-span buildings:
1. The influence of the number of roof spans on the overall horizontal wind force.
2. The influence of the non-simultaneous occurrence of pressure fluctuations over the roof on the overall horizontal wind force.
In the current study, static force measurements were performed to determine the overall horizontal force on a greenhouse with increasing number of spans. Additional pressure measurements were performed on a 30-span greenhouse model to verify the static force result, and to determine the distribution of the overall horizontal force over the greenhouse structure. Analysis of the extreme pressures allowed for assessment of the non-simultaneous occurrence of the peaks over the greenhouse.
The results of this study are applicable for the stability design of greenhouse structures. Therefore, the parameter definition in this study follows, where possible, the definition applied in EN 13031-1.
Section “Background” provides some background on previous studies and current European wind codes related to these two topics. Section “Experiment and Analysis” explains the setup of the experiments and the applied analysis methods. Results are presented and discussed in Section “Results and Discussion”; the relation of the obtained results with wind loading codes is discussed in Section “Comparison with EN 1991-1-4 and EN 13031-1.” Conclusions and recommendations are given in Section “Conclusion.”
Background
Multi-Span Duo-Pitch Load Coefficients
Wind Tunnel and Full-scale Studies
Various experimental studies have been performed to investigate pressure coefficients on multi-span duo-pitch buildings. Studies on greenhouses with more than five spans were performed by Van Koten (1977), Wells and Hoxey (1980), and Hoxey and Moran (1991). Van Koten and Bos (1974), Holmes (1987), and Stathopoulos and Saathoff (1991) performed studies on duo-pitch buildings with two to four spans. Wells and Hoxey (1980) performed in situ pressure measurements on three multi-span greenhouses, with the number of spans ranging between 6 and 8. Table 1 gives the area-averaged results of this study for each of the three greenhouses (specified with GH01, GH02, and GH03) for a wind direction perpendicular to the roof gable. Wells and Hoxey (1980) suggest that, although some roof pressures can be slightly more severe for wind directions other than perpendicular to one of the walls, the oblique wind directions are unlikely to justify consideration in design. This suggestion simplifies codification of results, as it limits relevant results to the main axes of the greenhouse. Stathopoulos and Saathoff (1991) assessed roof peak pressures on multi-span buildings with eaves height to span ratios h/s of 0.3 and roof angles α of 18°and 45°. They found that near the upper lee-facing roof corners on the first span, the largest pressures are observed at a 30°wind direction. Therefore, for local loads, the suggestion by Wells and Hoxey (1980) does not apply. In this case, one should also consider oblique wind directions, not only those perpendicular to the building walls.
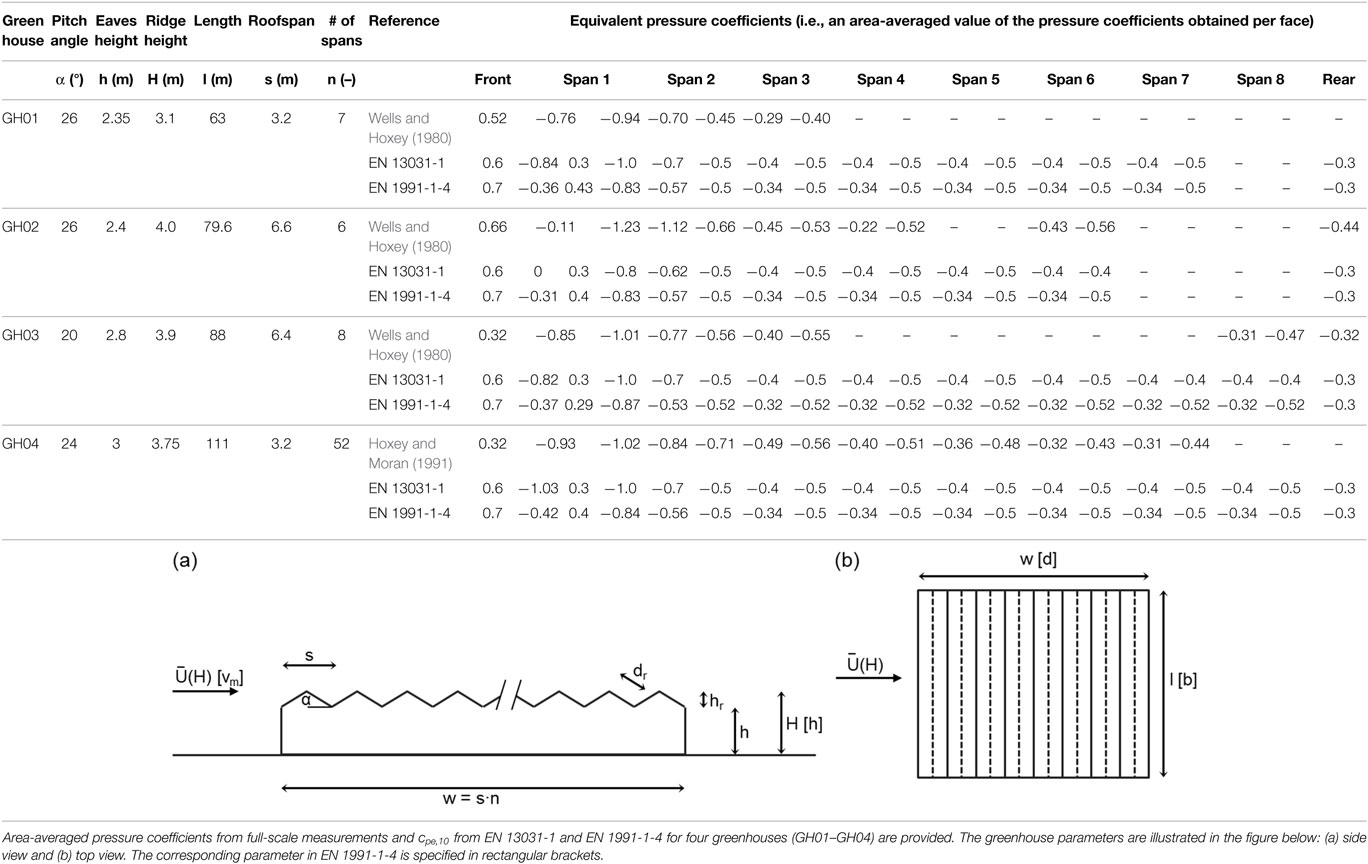
Table 1. Overview of pressure coefficients for multi-span greenhouses with more than five spans for wind perpendicular to the ridge.
For wind perpendicular to the ridge, Wells and Hoxey (1980) observed two effects on the roof of the two first spans:
1. An increase in roof angle α resulted in an increase in the pressure magnitude on the wind-facing surface of span 1.
2. A decrease in eaves height to span ratio h/s resulted in a decrease in the magnitude of the pressures on the lee-facing roof face of span 1 and the wind- and lee-facing roof face of span 2.
They furthermore propose that, for wind perpendicular to the ridge, the frictional drag on the roof can be ignored since an extensive part of the roof surfaces sees reversed flow.
Hoxey and Moran (1991) performed pressure measurements on a 111 m long and 167 m wide greenhouse of 52 spans. The measurements were performed on the front façade and the roofs of spans 1–8. Table 1 gives the area-averaged pressure coefficients determined for this greenhouse (specified with GH04) for a wind direction perpendicular to the roof gable. Their results in combination with the results by Wells and Hoxey (1980) indicate that the pressure on the windward roof face of the first span not only depends on the roof angle; this pressure is also influenced by eaves height to span ratio h/s. With an increase in h/s, the pressure on the windward roof face of the first span decreases, which they ascribed to a larger amount of flow separation at the windward roof edge.
Van Koten (1977) performed full-scale pressure measurements on a 25-span greenhouse with a length of 75 m, a width of 80 m, and a roof pitch angle of 26°. Pressures were measured on spans 1, 2, 5, 6, and 9. Only results of the measurements on the first span are presented. Van Koten makes generalized statements about the coefficients for subsequent spans, unfortunately the underlying measurement results are not provided. Based on the results of this study, as well as the results from Van Koten and Bos (1974), Van Koten (1977) presents a coefficient distribution for multi-span duo-pitch greenhouses, which is illustrated in Figure 1A. After the second ridge, Van Koten (1977) suggests a value of −0.4 for both wind- and lee-facing roof face.
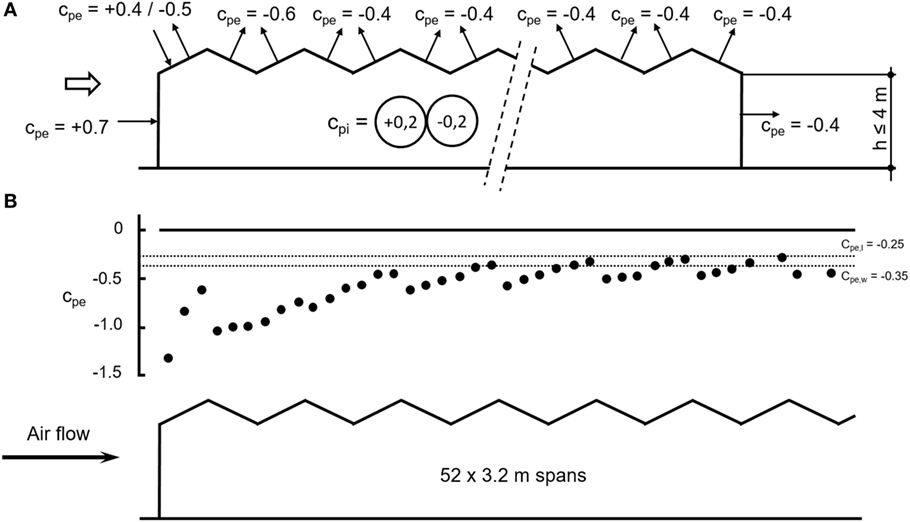
Figure 1. (A) Area-averaged pressure coefficients for a multi-span greenhouse, after Van Koten (1977). (B) External area-averaged pressure coefficients, with limit values of −0.25 and −0.35 indicated for the wind-facing and lee-facing roof face, adapted from Hoxey and Moran (1991).
The results by Hoxey and Moran (1991) for the external pressure coefficient distribution are illustrated in Figure 1B. They suggest the area-averaged coefficients on the roof of the 52-span greenhouse decays to limits of cp,w = −0.35 for the wind-facing, and cp,l = −0.25 for the lee-facing roof face. They determined an internal pressure close to the average of these two values, cp,int = −0.29. The net wind pressure coefficients are cp,w − cp,int = 0.06 and cp,l − cp,int = 0.04. Hoxey and Moran (1991) conclude that four spans downwind from the front face of the greenhouse the wind loads can be considered insignificant for design purposes. However, it is not stated explicitly whether they consider this conclusion also applicable for the (horizontal) wind load on the span as a whole, or for overall wind loads.
Multi-Span Duo-Pitch Coefficients in EN 13031-1 and EN 1991-1-4
Some of the findings by Wells and Hoxey (1980) and Hoxey and Moran (1991) are encountered in the European greenhouse construction standard EN 13031-1 (CEN, 2001), which considers the influence of
– roof angle, α, and eaves height to span ratio, h/s, on the pressure on the windward roof face of the first span.
– eaves height to span ratio on the three subsequent roof faces.
The values of the coefficients suggested in EN 13031-1 are based on different sources. For the first eight spans, the studies by Wells and Hoxey (1980) and Hoxey and Moran (1991) have had a large influence on the coefficients in EN 13031-1. The choice for the same pressure coefficient on the wind- and lee-facing roof faces after nine spans appears to have been based on Van Koten (1977) and the East German standard TGL 32274-7 (1976). Both suggest −0.4 on both faces of these roof spans, which is the same value as prescribed in EN 13031-1.
The coefficients provided in EN 1991-1-4 (CEN, 2010) for multi-span duo-pitch buildings are based on mono-pitch and troughed duo-pitch roof values. For the first windward roof face, the same coefficients as for the mono-pitch roof are advised. For the second and third roof face, the values specified for zone H and I of the troughed duo-pitch roof should be applied. The wind loads on subsequent roof faces are 60% of the troughed duo-pitch roof values specified for zone H and I.
EN 1991-1-4 (CEN, 2010) has a supplementary clause for multi-span buildings. When the pressure coefficients per roof span do not result in a horizontal force, an equivalent friction coefficient cfr,eq = 0.05 has to be taken into account. This friction coefficient is independent from the roof angle or the roughness of the surface. For multi-span duo-pitch buildings with 10 spans or more, the values specified in EN 1991-1-4 for troughed duo-pitch roof will never result in a zero horizontal force. Therefore, the equivalent friction coefficient cfr,eq is of no relevance for the large multi-span duo-pitch buildings studied here.
Part of these guidelines in EN 1991-1-4 (CEN, 2010) are derived from Cook (1990), who based them on common characteristics observed in wind tunnel results by Holmes (1983, 1984) on sawtooth roof buildings, and full-scale results by Moran and Westgate (1982) on a two-span duo-pitch building. Cook (1990) made the choice for troughed duo-pitch values, based on the idea that downwind spans, being in the wake of the previous span, will see flow patterns similar to that observed over a troughed duo-pitch roof. He further explained that the tendency to less onerous loading downwind of the first several spans is caused by the flow skipping from ridge to ridge. To capture this effect, Cook (1990) suggested a reduction factor of 0.8 for the second span and 0.6 for following spans.
No study was found that suggests to only use the zone values for H and I, without F and J, beyond the first windward roof face. The background of this design rule is unclear. It suggests that separation at the roof tops beyond the first roof span is so small, there is no need for a separate zone. The results by Wells and Hoxey (1980) and Hoxey and Moran (1991) do show there is little variation in the pressures on the lee-facing roof face after two roof spans. For example, the difference in pressure coefficient between roof top and eaves is 0.12 or less for the third and subsequent lee-facing roof faces.
The background of the equivalent friction coefficient cfr,eq is not clearly documented either. TGL 32274-7 (1976) prescribes an equivalent friction coefficient cfr,eq = cfr(0.05α + 1). In which α is the roof pitch angle (in degrees) and cfr is the surface friction coefficient. For a roof angle α = 30°and a surface friction coefficient cfr = 0.02, this formula results in cfr,eq = 0.05.
Table 1 gives equivalent pressure coefficients determined with EN 13031-1 (CEN, 2001) and EN 1991-1-4 (CEN, 2010) for the greenhouses GH01 to GH04. These equivalent coefficients were calculated as an area-average of the zonal pressure coefficients on a building face specified in both codes. A comparison of these values leads to the following observations:
– For the windward wall, EN 13031-1 specifies cpe,10 = 0.6 and EN 1991-1-4 gives cpe,10 = 0.7. For the leeward wall, both codes specify cpe,10 = −0.3.
– On the windward roof face of the first span, EN 1991-1-4 specifies smaller negative values than EN 13031-1, except for GH02. The difference in values is mostly the result of the different approaches, with which the influence of eaves height to span ratio is taken into account.
– For the same roof face, EN 1991-1-4 specifies larger positive values than EN 13031-1, with the exception of greenhouse GH03. The differences are smaller than those observed for the negative values.
– For the lee-facing roof face of the first span, the values given by EN 1991-1-4 range between −0.83 and −0.87, these values are only dependent on the roof angle α. The values of EN 13031-1 depend on α and h/s. For greenhouses GH01, GH03, and GH04, the eaves height to span ratio h/s > 0.4, which gives cpe,10 = −1.0. Only GH02 with a smaller h/s of 0.36 has a lower value of cpe,10 = −0.8.
– For the roof faces of spans 2–5, the values advised by both codes vary relatively little, with differences in pressure coefficient smaller than 0.1 for the assessed greenhouses. Only the wind-facing roof face of span 2 results in larger differences, with the values of EN 1991-1-4 smaller than those in EN 13031-1. The values in EN 1991-1-4 for this face are smaller, because the pressure coefficient is only based on zone I.
– For span 6 on GH02 and spans 7 and 8 in GH03, both codes provide different answers. EN 13031-1 specifies −0.4 on both wind- and lee-facing roof face resulting in a zero horizontal wind force per span. EN 1991-1-4 specifies pressure coefficients which result in a horizontal force coefficient per span in the range of 0.16 (for α = 26°) to 0.2 (for α = 20°). This can result in large differences between both codes for the calculated overall horizontal force on multi-span greenhouses larger than 10 spans.
Because of the lack of information beyond nine spans, research is needed to determine appropriate coefficients for these spans. This paper describes an experimental wind tunnel study carried out to determine the overall horizontal force on greenhouses with 10–90 spans, and performs a comparison with the overall loads calculated using EN 13031-1 and EN 1991-1-4.
Spatial Correlation Effect
With increasing distance between two points on a building envelope, the correlation of the wind pressure fluctuations at these points will decrease. This decrease in correlation is observed as a non-simultaneous occurrence of peak wind pressures on a building surface. The larger the size of the surface, the larger the decrease in correlation over that surface will be. The load on the surface is directly related to the correlation of the pressure fluctuations over the surface, so a larger surface is loaded by a smaller relative peak load. For large multi-span greenhouses, it is therefore worthwhile to investigate the influence of this effect on the overall wind load.
Size Factor (EN 1991-1-4) and Dynamic Coefficient (EN 13031-1)
EN 1991-1-4 (CEN, 2010) accounts for the lack of correlation over reference areas larger than 10 m2 with the size factor cs. This factor is only intended for in-plane correlation, it does not apply for the lack of correlation between pressures on different building faces. EN 1991-1-4 has an additional clause, i.e., EN 1991-1-4 5.3(5), which allows for the consideration of the lack of correlation between windward and leeward building walls. EN 1991-1-4 clause 7.2.2(3) suggests for buildings with H/w ≤ 1 that the resulting force on windward and leeward building wall can be multiplied by 0.85. The application of this factor is left to the National Annex, see EN 1991-1-4 5.3(5). Several studies support this additional factor, for example full-scale measurements by Geurts (1997) on the main building of TU Eindhoven showed that the coherence between the windward and the leeward side is small (<0.4) for the frequency range of interest for fluctuating loads (n = 0.1–2.0 Hz).
EN 13031-1 (CEN, 2001) applies a dynamic coefficient cd, in this article referred to as cdg to avoid misunderstanding. The value of cdg is dependent on the depth dw and width bw, perpendicular to the wind direction as illustrated in Figure 2. These are not necessarily the depth and width of the greenhouse, but depend on the size of the structure that is able to redistribute horizontal forces, i.e., expansion joints need to be taken into account. Figure 2 was derived from work by Geurts (1998), who combined both the lack of spatial correlation on a single building face (using Annex B of EN 1991-1-4) and the lack of correlation between windward and leeward wall in cdg. So, the dynamic coefficient cdg differs from cs in the sense that it also considers the lack of correlation between windward and leeward wall, and not only the in-plane correlation.
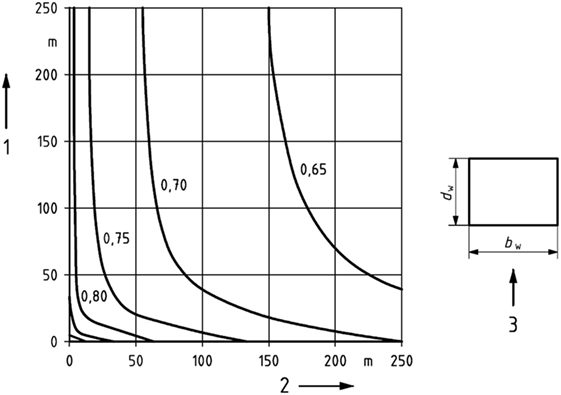
Figure 2. Dynamic coefficients for gust wind response of greenhouses, taken from EN 13031-1 (CEN, 2001). 1 = depth, dw; 2 = width, bw; 3 = wind direction.
Correlation Factor
The force coefficient which contains the lack of correlation can be obtained from the area-average of the pressure coefficient time series on the surface. First, time series of force coefficients are calculated with
where Ai is the area assigned to pressure coefficient time series cp,i(t) at position i and Aref is the reference area assigned to the resulting force coefficient time series cF(t). Secondly, using the force coefficient time series, the characteristic peak force coefficient, , can be determined. This procedure is described in Section “Pressure Measurements” (see Eqs 14 to 17).
If the pressure coefficient time series cp,i(t) are fully correlated, the peak force coefficient can also be expressed as the area-average of the characteristic peak pressure coefficients:
In Eq. 2, is the characteristic peak pressure coefficient at position i.
The lack of correlation can now be quantified with a factor which is defined as the ratio of the two peak force coefficients:
Experiment and Analysis
Boundary Layer
Wind tunnel experiments were carried out in the open-circuit atmospheric boundary layer wind tunnel of TNO in the Netherlands. The test section had a width of 3 m and height of 2 m. The boundary layer applied in this study was developed using six spires and a castellated barrier at the entrance, as well as rough carpet over the length of the test section (~13.5 m). The boundary layer characteristics were determined from velocity measurements with a hotwire anemometer.
Experiments were performed with two different roughness types on the turntable. One set of static force measurements was performed with a smooth turntable, illustrated in Figure 3A. In the second set of static force measurements and pressure measurements, the rough carpet was extended onto the turntable, illustrated in Figure 3B.
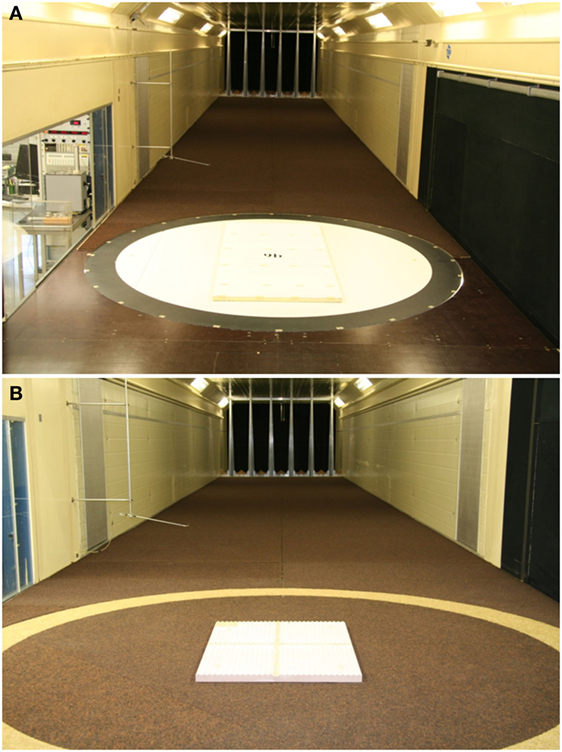
Figure 3. Experiment set up greenhouse measurements: (A) test without rough carpet on the turntable and (B) test with carpet on the turntable.
For the smooth turntable tests, the change in roughness at the edge of the turntable will probably result in an internal boundary layer (IBL). Because the wind tunnel does not exist anymore, it was unfortunately not possible to measure the smooth turntable boundary layer and assess whether an IBL was really present. Bronkhorst et al. (2016) give an analytical assessment of the IBL height based on the formula by Wood (1982). They showed that the relative thickness of the IBL for the investigated static force models varied between hIBL/H = 0.68 and hIBL/H = 1.54. The influence of the different boundary layer characteristics on the results of the static force measurements is discussed in Section “Results and Discussion.”
For heights smaller than hIBL, the boundary layer characteristics will approach those of the smooth floor. Therefore, Figure 4 provides the characteristics of this boundary layer as well as the rough carpet boundary layer. Figure 4A illustrates the velocity profiles of the smooth floor boundary layer, with z0,I = 4.3⋅10−4 mm (0.1 mm full scale) and the rough carpet boundary layer, with z0,II = 0.07 mm (17.5 mm full scale). The smooth floor boundary layer corresponds with a sea roughness, and the rough carpet with an open country boundary layer (low vegetation and isolated objects with separation distances of more than 50 obstacle heights). The velocity profile is referenced to the mean velocity at z = 0.24 m; the undisturbed velocity was monitored at this height during the balance and pressure measurements. The Jensen numbers of experiments in these two boundary layers are Je = H/z0,I = 75⋅103 and Je = H/z0,II = 463. Turbulence intensity profiles for Iu, Iv, and Iw are shown in Figures 4B–D; Figure 4E shows the integral length scale Lux.
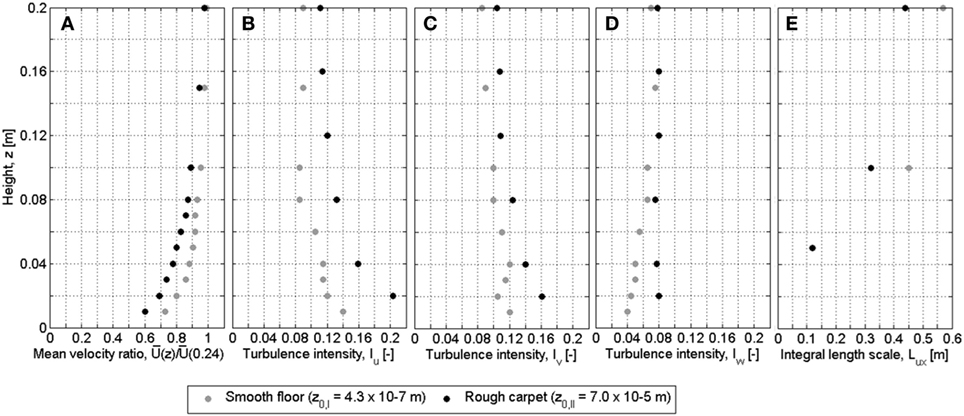
Figure 4. Boundary layer characteristics: (A) mean velocity ratio, (B) longitudinal turbulence intensity, (C) lateral turbulence intensity, (D) vertical turbulence intensity, and (E) integral length scale.
Static Force Measurements
Static force measurements were carried out on plastic models with duo-pitch multi-span roof, illustrated in Figure 5A. The geometric scale of the models is 250. Figures 5B,C give schematics of a greenhouse and greenhouse span with indication of various parameters. The length of all tested models is l = 0.8 m (200 m full scale). The greenhouse models have a ridge height of H = 32.4 mm (8.1 m full scale), an eaves height of h = 27.9 mm (7.0 m full scale), and a roof height of hr = 4.5 mm (1.1 m full scale). The roof span is s = 20 mm (5 m full scale), and the roof angle is α = 24.3°.
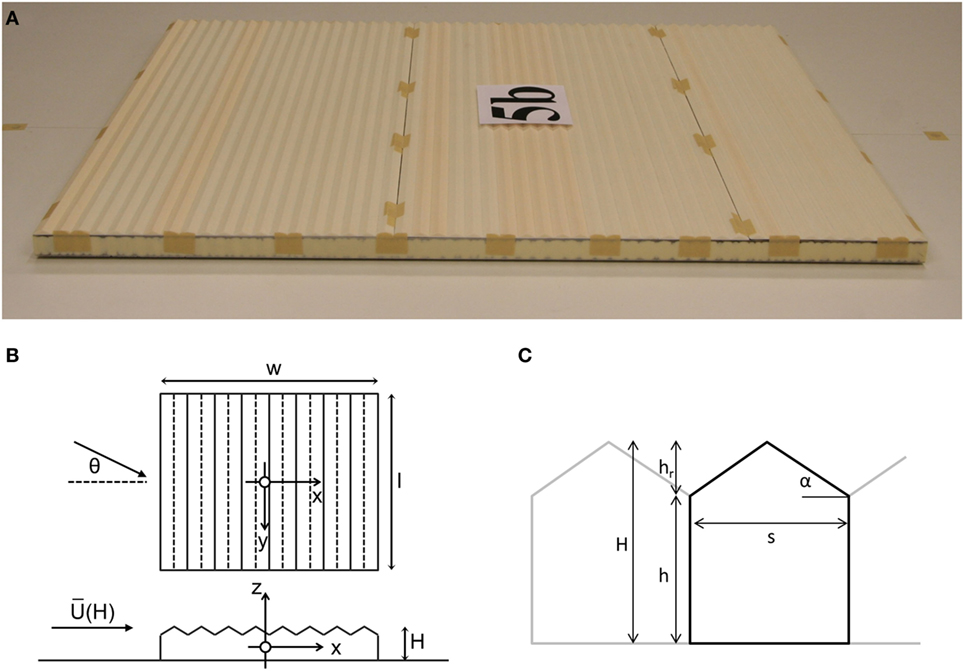
Figure 5. Static force test model: (A) picture of the 50-span model (w = 0.2 m), (B) schematic of a greenhouse with specification of some parameters, and (C) detail of a greenhouse span with parameters.
For the two measurement set ups, i.e., with smooth and rough carpet turntable, the following widths were tested:
– Nine models for the set up with smooth turntable (z0,I = 4.3⋅10−4 mm) with varying width between w = 0.2 m (50 m full scale) and w = 1.8 m (450 m full scale) in steps of 0.2 m.
– Four models with carpet on the turntable (z0,II = 0.07 mm) with widths w = 0.2 m (50 m full scale) to w = 0.8 m (200 m full scale) in steps of 0.2 m.
The static force measurements were performed at a frequency of 33 Hz for a total period of 62 s. Only mean values of the forces and moments were determined over this period. The velocity was measured with a pitot-static tube (see Figure 3), about 2 m in front of the model, at a height of 0.24 m (60 m full scale). The mean velocity at this position was , the velocity at height z can be determined with
The applied reference velocity was (with z0,II = 0.07 mm). The reference velocity corresponds with a full scale velocity of 23.9 m/s (see Section “Comparison with EN 1991-1-4 and EN 13031-1”), which gives a velocity scale . Combined with the geometric scale , this gives a time scale of . The Reynolds number corresponding to the smooth boundary layer is , which is larger than the minimum value of 2.5 specified by ASCE (1999). The smallest Reynolds number related to the building is the roof span based Reynolds number, , in which the kinematic viscosity ν = 1.45⋅10−5 m2/s.
For the greenhouse models, mean force coefficients were determined with
where the reference velocity is at ridge height , and is the measured mean force in x-direction in the reference frame indicated in Figure 5B.
For increasing number of spans, the main increase in the overall horizontal wind force is due to the roof. In Section “Introduction” it was explained that beyond nine spans EN 13031-1 and EN 1991-1-4 can result in very different outcomes for the overall horizontal force due to the pressure coefficient specification for the roof faces. To assess the forces on the roof spans, the mean horizontal force coefficients per roof span were determined with
In which is the mean forces measured on the multi-span models larger than 10 spans and is the mean force measured on the 10-span model. The velocity at ridge height is used as reference velocity . The reference area is obtained with lhr, which is the projected area of the roof on a plane perpendicular to the x-axis. The coefficient per span is obtained through division by the number of spans minus the spans from the 10-span model, i.e., n − 10.
Pressure Measurements
Surface pressure measurements were performed on a 30-span model, with slightly different dimensions compared to the models in the static force measurements but the same geometric scale. The roughness extended onto the turntable, as illustrated in Figure 3B. The model has a ridge height of H = 29.8 mm (7.5 m full scale), an eaves height of h = 25.5 mm (6.4 m full scale), and a roof height of hr = 4.3 mm (1.1 m full scale). The span of the bays is s = 20 mm (5 m full scale), and the roof pitch angle is α = 23.3°.
Figure 6A shows the general tap layout of the model, the current study only presents the results of the measurements performed on the taps in the indicated region. The positions of the taps are illustrated in Figure 6C.
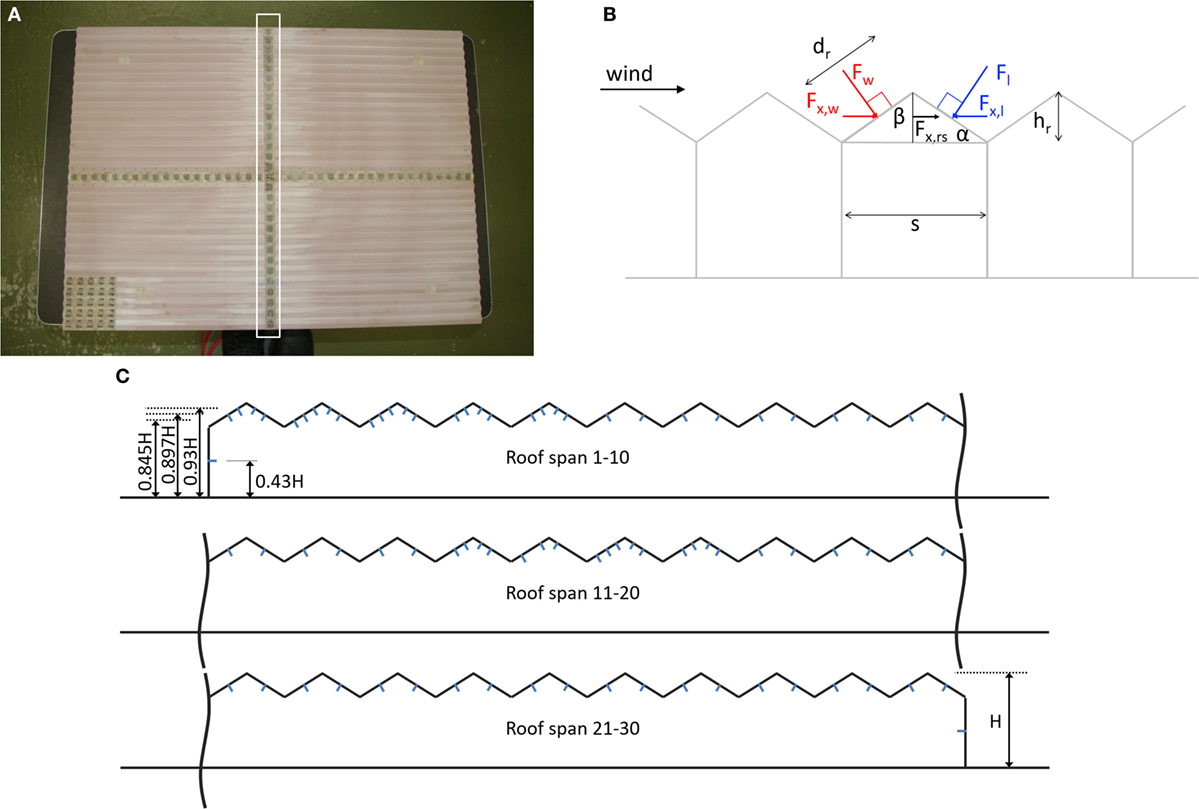
Figure 6. (A) Picture indicating the analyzed pressure taps, (B) schematic for the derivation of the longitudinal force per roof span, and (C) schematic drawing detailing the pressure tap positions.
Measurements were performed for wind directions between 0°and 360°in 24 increments of 15°. Pressures were sampled using Scanivalve ZOC 23B electronic pressure scanning modules at a frequency of 400 Hz for 20.48 s. The average velocity was measured at a height of 0.24 m (60 m full scale); at this height the velocity was 11.7 m/s. With Eq. 5 the velocity at ridge height was determined at (with z0,II = 0.07 mm).
Pressure coefficient time series were determined with
In which the reference velocity is at ridge height, . Force coefficient time series were determined with
The force time series F(t) is obtained through summation of the forces on the windward and leeward wall and the horizontal forces on the roof spans. The forces on the windward and leeward wall are assumed equal to the pressure coefficients at the center taps on these faces multiplied by their area .
The horizontal force per roof span, Fx,rs, has been determined from the measured pressures at the center taps on the wind- and lee-facing surface of a roof span, see Figure 6B:
In which pw and pl are the pressures on the wind- and lee-facing roof face, β is half the roof top angle, i.e., β = 90° − α. The length of a roof face, dr, can be expressed as
The horizontal force coefficient per roof span can now be obtained by implementation of Eqs 9 and 10 in Eq. 8 and taking equal to :
In which cp,w(t) and cp,l(t) are pressure coefficients on wind- and lee-facing roof face.
Mean load coefficients (i.e. either pressure or force coefficients) were determined by taking the time-average of the coefficient time series:
where cX(t) is a load coefficient time series and ts is the sampling time.
For determination of peak statistics, the sampling time was divided in 32 time series of 0.64 s (about 64 s in full scale). To obtain coefficients representative for a full scale surface area of 10 m2, the wind tunnel time series were smoothed from 0.0025 to 0.01 s (1 s in full scale). The minimum and maximum load coefficient of each smoothed time series were selected for extreme value analysis with the Gumbel distribution. Further processing was performed on minima and maxima separately. The selected peaks were ranked in order of magnitude from smallest to largest. The expected non-exceedance probability of each peak, i, was obtained with the Gringorten estimator (Gringorten, 1963):
where N is the total number of selected peaks, in this case N = 32. Using least-squares estimation, the Gumbel distribution was fitted on the ranked peaks with
In which is the i-th ranked peak load coefficient, UX,t and 1/aX are the mode and dispersion of the fitted Gumbel distribution, and yi = −ln(−ln(Pi)) is the reduced variate of the i-th ranked peak. Peak load coefficients were determined with
where is the characteristic peak load coefficient for an equivalent full-scale period t = 64 s and a 78% probability of non-exceedance. Characteristic peak load coefficients for an equivalent full-scale period of T = 10 min were calculated with
This conversion from 64 s to 10 min is based on the requirements specified in the Dutch wind tunnel guideline CUR (2005) for the minimum record length of 60 s. According to Cook and Mayne (1981), this record length results in a conservative estimate for 1 h characteristic peaks. Gavanski et al. (2016) further showed that 30 records of 1 min can be used to determine a 10 min characteristic peak load coefficient of sufficient accuracy.
Different horizontal force coefficient statistics for a roof span were determined from the measured pressure coefficients:
1. Mean of the horizontal force coefficient time series per roof span (see Eqs 11 and 12), this coefficient is called .
2. Summation of the roof wind-facing maximum and lee-facing minimum peak pressure coefficients , this coefficient is referred to as .
3. Characteristic peak of the horizontal force coefficient time series per roof span (following Eq. 11 and Eqs 13–16), this coefficient is referred to as .
The first method gives results which can be compared with the static force measurements. The second approach gives a conservative estimate of the roof span wind load, because it assumes full correlation between the peak wind pressures on wind- and lee-facing roof face. The third method considers the lack of correlation in the wind pressures on wind- and lee-facing roof face. It gives the most accurate estimate of the horizontal peak wind force on the roof span. The influence of the lack of correlation between the pressure peaks on the overall force is quantified with the correlation factor ccor, which is the ratio of and (see Section “Correlation Factor” for an explanation).
Results and Discussion
Mean Force Coefficients
Figure 7 shows mean force coefficients, , based on the static force measurements. The results for w = 0.6 m (30 spans) in Figure 7B deviate from the other results. This suggests the setup of the balance for these tests was corrupted. Therefore, the results of these tests are not used in further analysis.
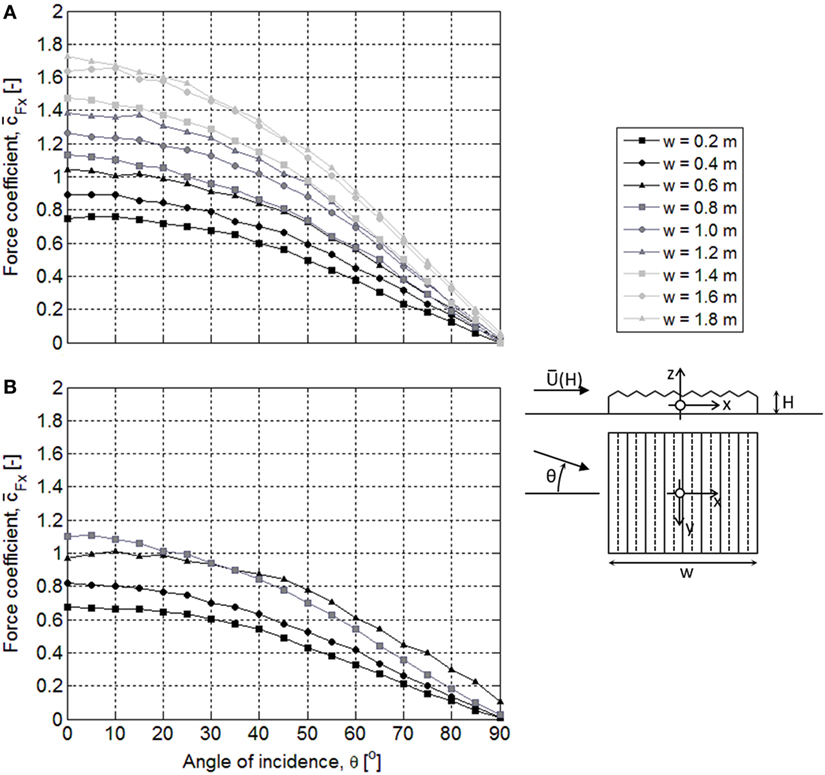
Figure 7. Force coefficient, , versus angle of incidence, , for: (A) nine models on a smooth turntable, (B) four models on a turntable with rough carpet. The width w = 0.2 m corresponds with 10 spans.
The coefficients obtained with the smooth turntable, illustrated in Figure 7A, are generally larger than the values obtained with the rough turntable, see Figure 7B. For the smallest models (w = 0.2 m), the difference is about 10%. With increasing model size the difference becomes smaller, for w = 0.8 m the difference is about 3%. This indicates the smooth turntable generates an IBL, as suggested in Section “Experiment and Analysis”. Figure 4A showed the longitudinal velocities in the smooth boundary layer are larger than the velocities in the rough carpet boundary layer. However, the applied reference velocity was the same, i.e., Uref = 8.8 m/s as determined for the rough boundary layer. The actual reference velocity for the tests performed with a smooth turntable is dependent on the height of the IBL. In a smooth boundary layer (z0 = 4.3⋅10−4 mm), the reference velocity would be 9.9 m/s. According to Högström et al. (1982), the smooth boundary layer characteristics can be applied to about 0.2hIBL. For 0.2hIBL < z < hIBL, the velocity can be estimated through linear interpolation between the two boundary layers. Applying this interpolation, the mean velocities in the nine smooth turntable tests at height H are between 8.8 m/s (for w = 1.8 m and hIBL = 22 mm) and 9.2 m/s (for w = 0.2 m and hIBL = 50 mm). For the smallest model with w = 0.2 m, the difference in reference velocity in the two boundary layers (0.4 m/s) results in a 9% difference in the related pressure coefficients. For w = 0.8 m, it results in 5% difference. These differences match quite well with the observed difference in Figure 7.
Finally, Figure 7 shows that the largest coefficients are observed at or near 0°angle of incidence. The coefficients decrease toward 0 at θ = 90°. Therefore, further analysis will focus on the results at an angle of incidence θ = 0°.
Figure 8A presents the mean force coefficient versus the width w at an angle of incidence θ = 0°. Van Bentum et al. (2013) already presented this result for the smooth turntable boundary layer only. Figure 8A shows that the rough carpet turntable has a slight influence for models with w < 1.0 m. For both boundary layers, the force coefficients for the multi-span roof models show a linear increase with increasing width w.
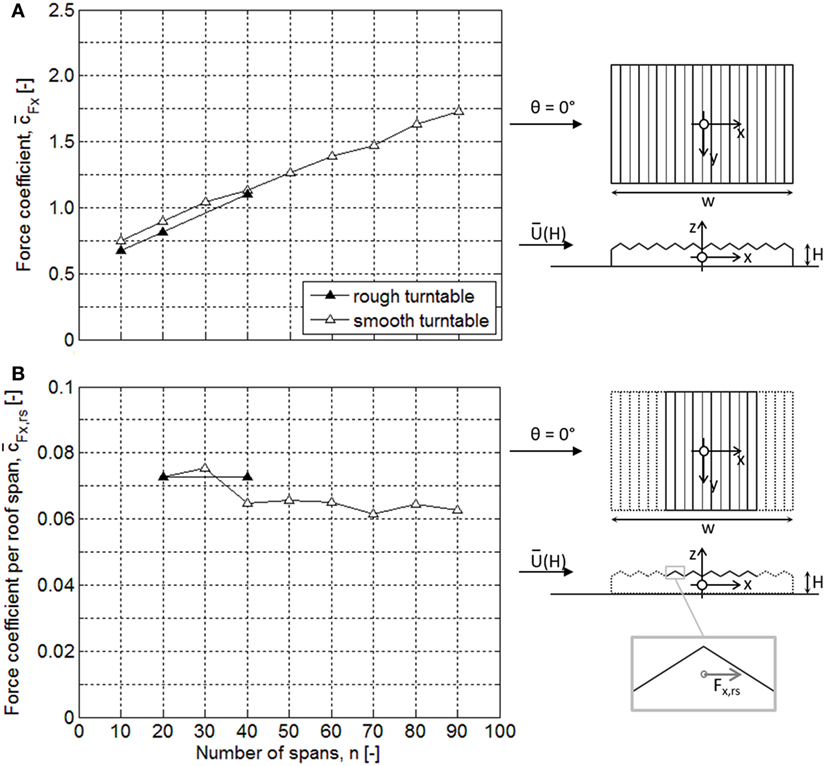
Figure 8. Force coefficients for a smooth turntable and a turntable with rough carpet: (A) force coefficient versus number of spans n and (B) force coefficient per roof span versus number of spans n.
Figure 8B illustrates the force coefficient per roof span , determined for the roof spans beyond the first seven roof spans. For these roof spans, the smooth and rough turntable boundary layer results in similar values. This suggests the turbulent properties of the boundary layer have no influence on the wind load on these roof spans. The wind load on these spans is determined by the turbulence induced by the windward roof spans.
Mean Pressure Coefficients
Figure 9A shows the mean pressure coefficients determined on the windward and leeward wall and at the center taps of the multi-span roofs. Results are presented for 0°and 180°angle of incidence, to illustrate the variability in the experiment. On the windward wall, the mean pressure coefficient has a value of 0.5. Similar values were observed by Holmes (1987) for a long four-span building, and by Kasperski (1996) and Kanda and Maruta (1993) for a long low-rise building with duo-pitch roof. The results of Kanda and Maruta (1993) indicate that with increasing length to eaves height ratio, in the range of 0.5 ≤ l/h ≤ 9.0, the windward wall pressure coefficient decreases asymptotically to values of approximately 0.5. The model in the current study had a length to eaves height ratio of l/h = 31.
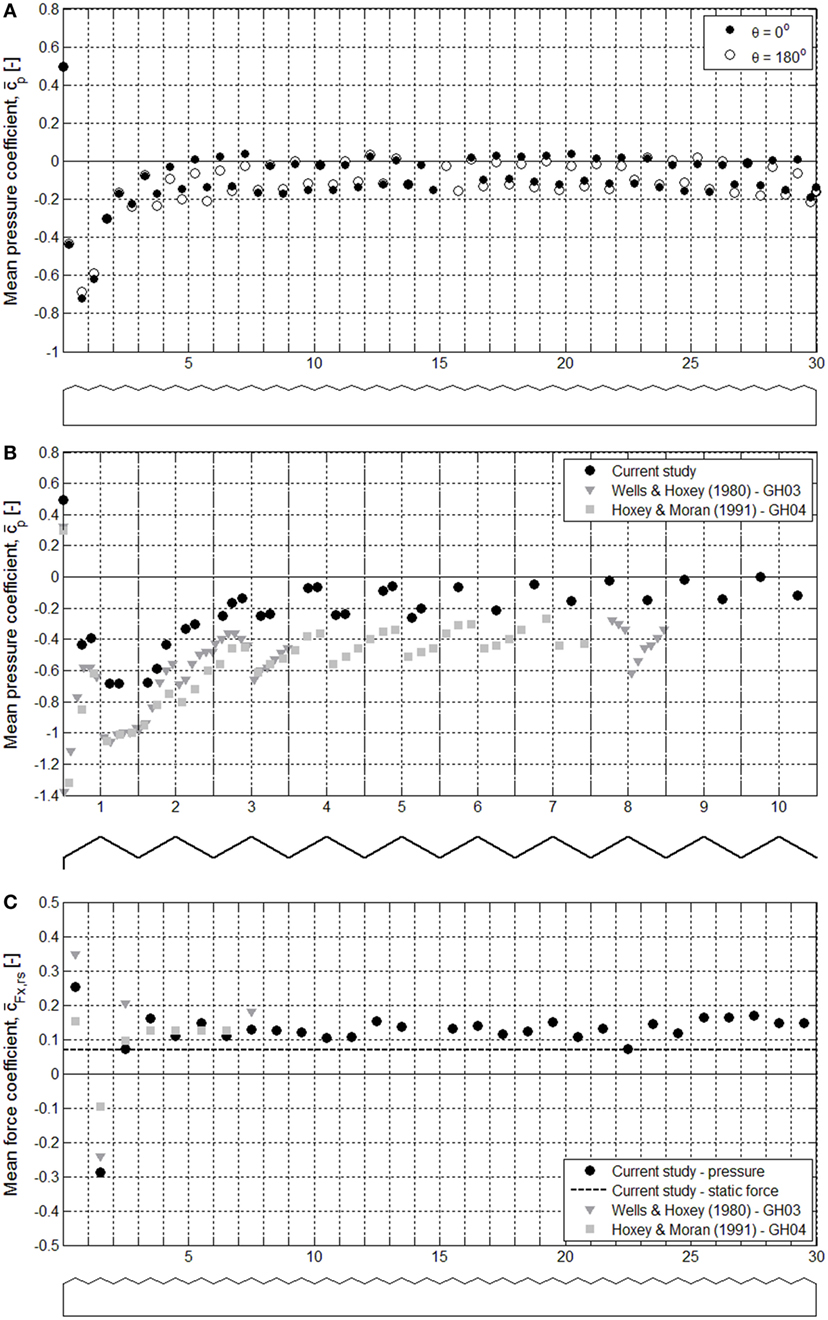
Figure 9. (A) Mean pressure coefficients determined at the center tap of the greenhouse faces, (B) mean pressure coefficients determined on the first 10 spans, and (C) mean horizontal force coefficient per roof span.
The largest negative mean pressure coefficients, due to the building separation bubble, are observed on the lee-facing roof face of the first roof span and the wind-facing roof face of the second roof span. The influence of the separation bubble stretches over the first four to five roof spans. After five roof spans, there is a constant difference in mean pressure coefficient of 0.15–0.2 between the center taps on the wind- and lee-facing roof face.
The pressure coefficient determined on the leeward wall has a value of −0.15. This is smaller than the values of −0.32 and −0.44 found by Wells and Hoxey (1980) in full-scale measurements. Wind tunnel measurements by Holmes (1987) and Kasperski (1996) resulted in values between −0.16 and −0.2 for the leeward wall, which fits better with the results in the current study.
Figure 9B shows the mean pressure coefficients determined for all taps on the first 10 spans. Also presented are results obtained by Wells and Hoxey (1980) for GH03 (α = 20°) and by Hoxey and Moran (1991) for GH04 (α = 24°). These roof angles are similar to that of the greenhouse investigated in the current study (α = 23.3°). The coefficients determined in the current study are consistently smaller (about 0.2–0.4) than the values that were determined for GH03 and GH04. On the windward façade, the mean pressure coefficient is 0.2 larger than the values for GH03 and GH04. Furthermore, the leeward wall pressure coefficient in Figure 9A is 0.15 smaller than the value of −0.32 specified in Table 1 for GH03. These approximately consistent differences suggest an offset in the pressure coefficients, which could be related to the reference pressure. If the load per roof span is assessed, the reference pressure is removed from the equation and no offset is observed, which can be seen in Figure 9C.
Figure 9C presents the mean horizontal force coefficient per roof span . This force coefficient was determined based on the pressures obtained at the center taps of the roof faces. The force on the first roof span is the largest in along-wind direction. The force on the second span is pointing in opposite direction to the wind. The pressure distribution in Figure 9A shows this is due to the influence of the recirculation bubble. The suction on the wind-facing roof face is more significant than on the lee-facing roof face.
After the first three spans, the results of the current study are similar to those by Wells and Hoxey (1980) and Hoxey and Moran (1991), with differences in the force coefficient smaller than 0.04. The forces on the first three spans are more sensitive to roof pitch angle α and eaves height to span ratio h/s, which to some extent explains the larger differences.
Beyond the first four spans, the force coefficient per roof span determined with the static force measurements is on average about 0.05 smaller than the values obtained with the pressure measurements. The assumption of a constant pressure distribution over a roof face explains part of this difference. Figure 10A shows the distribution on the roof faces, after the first five spans, which were equipped with multiple pressure taps (roof spans 14, 15, 16, and 17). Figure 10B shows the constant distribution, based on the results at the center taps, and a refined distribution, based on the results for the roof faces with multiple taps. The difference between these two distributions accounts for approximately 0.04 in the resulting mean horizontal force coefficient per roof span.
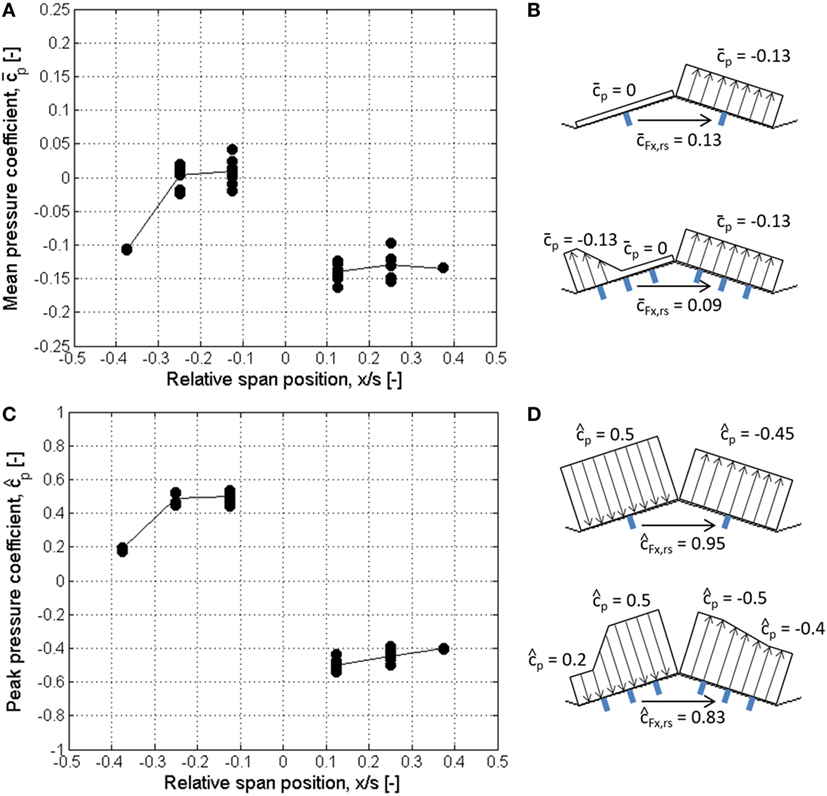
Figure 10. (A) Measured roof span mean pressure coefficient distributions over roof spans 14, 15, 16, and 17, and average mean pressure distribution (indicated with a line). (B) Schematic of a roof span illustrating the influence of a constant distribution (top) and a more refined distribution (bottom) on the force coefficient per roof span. (C) Measured roof span peak pressure coefficient distributions over roof spans 14, 15, 16, and 17, and average peak pressure distribution. (D) Schematic illustrating the influence of a constant distribution (top) and a refined distribution (bottom) on the peak force coefficient per roof span .
Peak Load Coefficients and Correlation Effect
Figure 11A shows the characteristic peak pressure coefficients determined at the center roof taps and at the taps on the wind- and lee-facing surface for wind perpendicular to the ridge. After the fifth span, the peak pressure coefficients remain constant at values of approximately −0.3 and +0.5 on the wind-facing roof face and −0.5 and +0.1 on the lee-facing roof face.
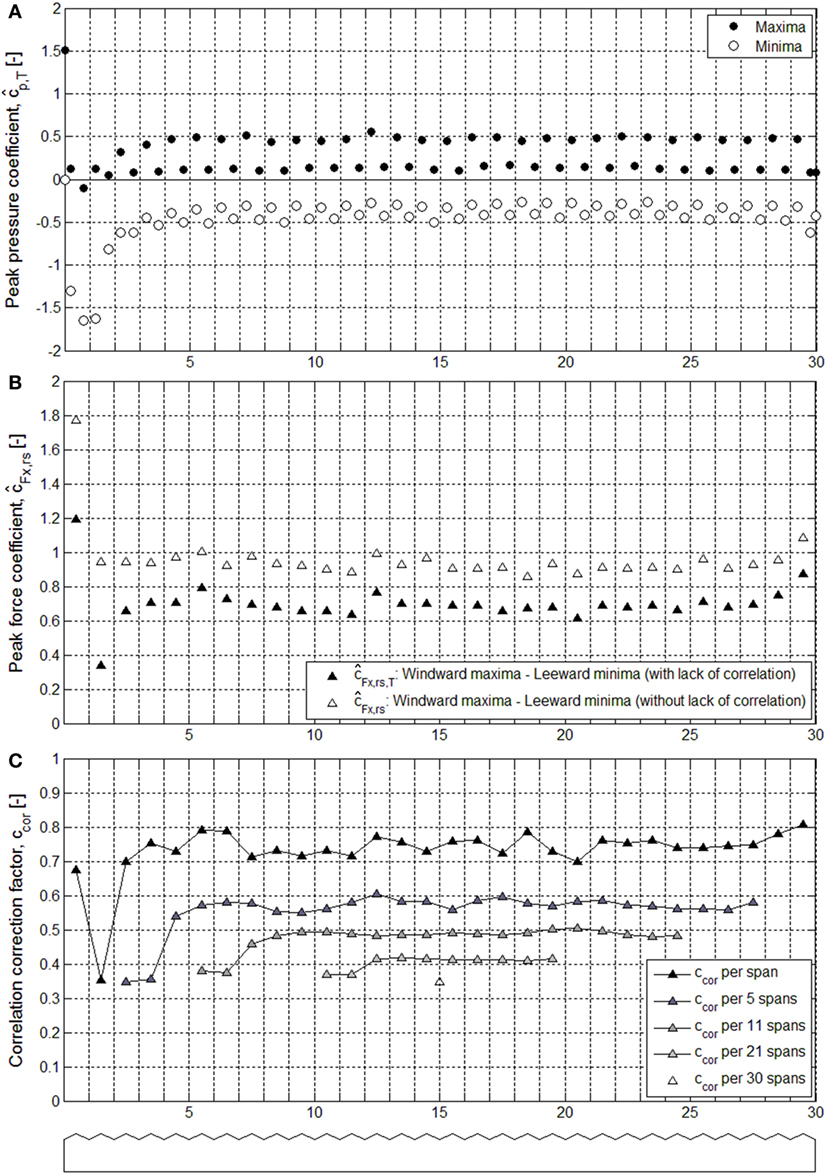
Figure 11. (A) Characteristic maximum and minimum peak pressure coefficients, (B) peak force coefficients and per roof span, and (C) correlation factor ccor for the peak force coefficients for increasing number of spans.
Figure 11B gives results for the two peak horizontal force coefficient per roof span based on the center roof taps:
– , which is obtained through summation of the roof wind-facing maximum and lee-facing minimum peak pressure coefficients .
– , which is determined via extreme value analysis of the horizontal force coefficient time series per roof span.
The difference in outcome between these two peak force coefficients is quite large, with for most roof spans about 0.7 times as small as . This difference is the result of the non-simultaneous occurrence of pressure fluctuations on the wind- and lee-facing roof face. The effect of this lack of correlation on the peak pressure coefficient is quantified with the correlation factor ccor, defined as the ratio of and .
Figure 11C presents the results for the correlation factor ccor. For single roof spans, ccor varies between 0.7 and 0.8, except for the second span. On the second roof span, maximum peak pressures on the wind-facing roof face rarely occur simultaneously with minimum peak pressures on the lee-facing roof face. Figure 11C also shows ccor decreases with increasing number of roof spans, with the smallest ccor values in the windward region of the greenhouse. For five roof spans, ccor = 0.35 over the first and second set of five roof spans, after which ccor increases to about 0.6 for the remaining sets of five roof spans. From 5 to 30 roof spans, ccor gradually goes to 0.35 for all roof spans.
For the lack of correlation between the pressures on the windward and leeward wall a factor ccor = 0.87 is found, which corresponds well with the factor 0.85 prescribed in CEN (2010) for this effect. Taking into account the lack in correlation between roof pressures, as well as windward and leeward wall pressures, the correlation factor for the overall greenhouse wind force amounts to ccor = 0.45.
For the calculation of the peak horizontal wind force, the peak pressure distribution over the wind- and lee-facing roof face was taken constant over the surface. Figure 10C shows that the peak distribution for downwind spans is not constant, similar to what was observed for the mean pressure coefficient distribution. The peak force coefficient derived from the maximum peak pressure on the wind-facing roof face and minimum peak pressure on the lee-facing roof face is smaller for the refined distribution, i.e., instead of as illustrated in Figure 10D.
Comparison with EN 1991-1-4 and EN 13031-1
This section compares the overall wind forces determined with the results obtained in the current study with EN 13031-1 and EN 1991-1-4, based on a calculation of wind loads on a typical large greenhouse structure. The wind load was determined for a typical greenhouse with a design working life of R = 15 years.
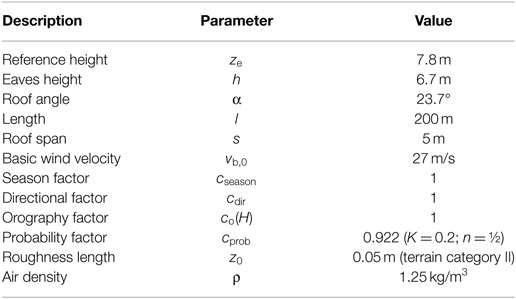
The full-scale dimensions are chosen as specified in Table 2, these dimensions are in between those of the greenhouse models studied in the static force and pressure measurements. Applying the settings in Table 2 gives a mean wind velocity and a peak velocity pressure at ridge height of vm(H) = 23.9 m/s and qp(H) = 0.84 kN/m2.
Overall Wind Force
EN 1991-1-4 and EN 13031-1
In EN 1991-1-4 (CEN, 2010), the overall longitudinal wind force is determined with
where cs is the size factor, cd is the dynamic factor, cf is the overall force coefficient, and Aref is a corresponding reference area. The notation cf is applied in EN 13031-1 and EN 1991-1-4 for the force coefficient. In this paper, the notation cF is used to indicate the experimentally obtained force coefficients. The reference height ze is equal to the building height H. This equation also applies for the calculation of wind actions using EN 13031-1.
For low-rise buildings like greenhouses, dynamic effects can be neglected, i.e., cd = 1. According to EN 1991-1-4, the size factor is calculated with
Here, Iv(zs) is the longitudinal turbulence intensity at height zs = 0.6H. EN 1991-1-4 specifies two procedures for the determination of the background response factor B2, i.e., Annex B and C. The National Annex of each European country specifies which procedure should be used. Here, the results from both procedures will be presented. The size factors calculated with these two procedures are cs = 0.72 (Annex B) and cs = 0.61 (Annex C).
For the lack of correlation in wind pressures between windward and leeward walls, EN 1991-1-4 allows for an additional reduction factor of 0.85 (independent of cs). This factor is also applied in the current calculation of the overall horizontal wind force.
In EN 13031-1 (CEN, 2001), the dynamic and size effect, as well as the lack of correlation between windward and leeward wall, are quantified with the dynamic coefficient, here indicated by cdg. The value of cdg is dependent on the depth dw and width bw perpendicular to the wind direction. The depth and width that should be applied, depend on the size of the structure that is able to redistribute horizontal forces. In the current study, it is assumed that these dimensions are equal to the depth w and width l of the greenhouse. The dynamic coefficients are obtained from Figure 2 and have values of 0.66 (w = 50 m) and 0.64 (w = 100–450 m).
Force coefficients cf are determined with the pressure coefficient values specified in EN 1991-1-4 and EN 13031-1. For the windward and leeward wall, the force coefficients are equal to the pressure coefficients. For the roof, the horizontal force coefficient is determined per roof span, as the combination of the zonal area-averaged pressure coefficients on the wind- and lee-facing roof face:
In which cpe,10,i is the pressure coefficient specified by EN 1991-1-4 for roof zone i, and Ai is the zonal area. EN 13031-1 specifies one pressure coefficient for each roof face, so one zone per face (i = 1).
Finally, the friction force on the gable ends is determined with
In which cfr is the friction coefficient of the greenhouse surface, which is here taken as 0.01 according to both EN 1991-1-4 and EN 13031-1. The corresponding area Afr is a part of the surface area of the gable ends outside the recirculation bubble, located between 4H from the upwind corner to the downwind corner.
Wind Tunnel
For the mean load coefficients the overall horizontal wind force is determined with
In which is the mean horizontal force coefficient determined from the static force measurements, or the summation of the mean pressure coefficients obtained from the pressure measurements. Aref is equal to the area of the windward face of the greenhouse.
To obtain the overall horizontal force from the peak pressure coefficients, first the determined characteristic peak pressure coefficients are calibrated to correspond with the cpe,10 values specified in EN 1991-1-4 and EN 13031-1:
Here, is the characteristic peak pressure coefficient determined with extreme value analysis of the measured pressure time series. Iu(H) is the longitudinal turbulence intensity determined in the wind tunnel at model ridge height. The same formula can be applied to determine code calibrated peak force coefficients:
The overall horizontal wind force is calculated with
In which cFx,10 is obtained through summation of the windward wall, leeward wall and roof calibrated peak pressure coefficients. The influence of the roof pressure distribution (see Figure 10) was accounted for, in the calculation from roof pressures to roof span forces. A value of 0.35 was applied for ccor to account for the lack of correlation on the roof faces, and a value of 0.87 for the lack of correlation between windward and leeward wall.
Results
Pressure Coefficients
Table 3 gives mean and calibrated peak pressure coefficients determined at the center taps on the faces of the 30-span greenhouse. The values specified in EN 1991-1-4 and EN 13031-1 for the complete face are also given. For spans 3–9 and 10–30, Table 3 gives the average value over all roof spans.

Table 3. Coefficients for the 30-span greenhouse: pressure coefficients and force coefficients per roof span (the values for spans 3–9 and spans 10–30 are ensemble averages over the spans).
On the front face of the greenhouse, the experimental pressure coefficients are in the same range as the code values. On the rear face, the difference between experimental and code values are larger, with the experimental calibrated peak coefficients about 30% and the mean coefficient 50% smaller than the code values. On the roof, even larger differences are found in the pressure coefficient. These differences can be explained by the influence of the static reference pressure discussed in Section “Mean Pressure Coefficients.”
Beyond the first span, both EN 13031-1 and EN 1991-1-4 specify only a negative value for the pressure coefficients on the wind-facing roof faces, they do not provide a positive value. This is not only the case for the roof pitch angles studied here, but applies to all roof pitch angles larger than 15°.
Force Coefficients
Table 3 gives the force coefficients per roof span obtained with the static force and pressure measurements, and with EN 1991-1-4 and EN 13031-1. The roof span force coefficients determined with the pressure measurements were corrected to account for the refined roof pressure distribution determined in Figure 10. The mean force coefficient determined with the static force measurements for spans beyond the first 10 spans is larger than the value from EN 13031-1 for these spans, but smaller than the value from EN 1991-1-4.
The mean roof span force coefficients from the pressure measurements match well with EN 13031-1 for spans 2–9. For these spans, the pressure coefficients in EN 13031-1 were for a large part based on the results from the studies by Wells and Hoxey (1980) and Hoxey and Moran (1991). Although these studies do not explicitly state the type of coefficients that were determined, this comparison suggests that they presented mean coefficients.
The cFx,rs,10 values are large compared to the other measured coefficients, as well as the values obtained with EN 1991-1-4 and EN 13031-1. The larger values for cFx,rs,10 are the result of considering the maximum peak pressures on the wind-facing roof faces. These coefficients are not considered in EN 13031-1 and EN 1991-1-4, i.e., they do not specify any positive values for the pressure coefficients on the wind-facing roof faces beyond the first span. For spans 10–30, EN 13031-1 specifies a zero horizontal force coefficient for the roof. Neither the static force measurements, nor the pressure measurements resulted in zero horizontal force coefficients for these roof spans. This indicates the coefficients specified by EN 13031-1 for these roof spans are not conservative when considering the horizontal force on the roof or on the greenhouse.
Overall Horizontal Forces
Figure 12A shows the overall horizontal forces determined with the static force measurement results on the smooth and rough turntable and with the pressure measurement results on the 30-span model. The force coefficients determined for the 30-span model mounted with pressure taps, provided in Table 3, were used to estimate the overall horizontal force for the other multi-span greenhouses in the range between 10 and 90 spans. The force coefficient determined for roof spans 10–30 in Table 3 was also applied to spans beyond the 30th span.
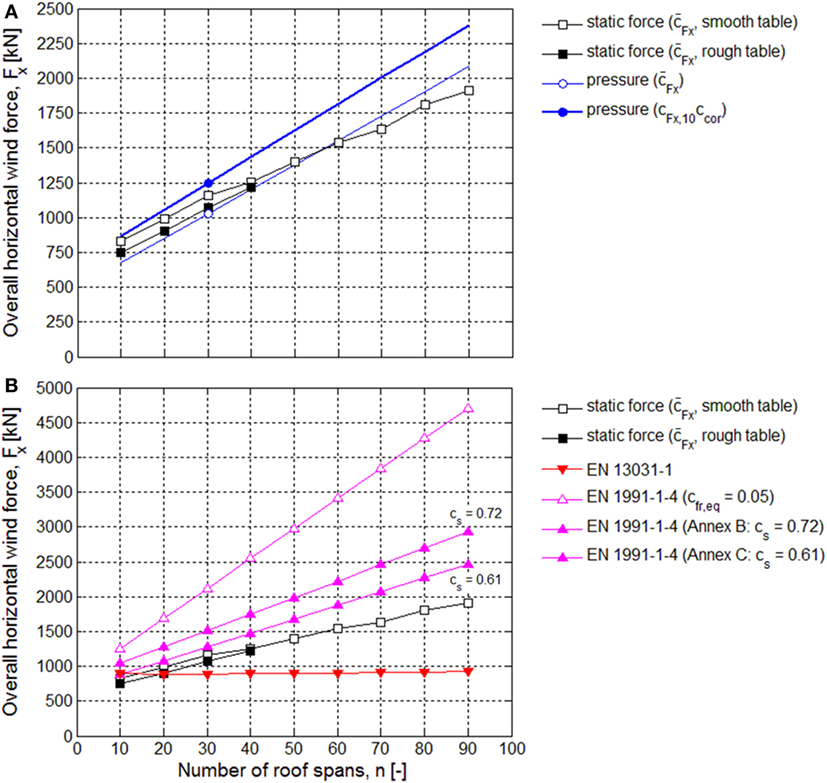
Figure 12. Overall horizontal wind force Fx on the greenhouse with increasing number of spans, calculated for: (A) the measurement results and (B) the codes EN 13031-1 and EN 1991-1-4 (static force results are also presented for comparison).
The forces determined with the mean pressure coefficients are in good agreement with the static force test results, considering these are extrapolated results of the 30-span model. The forces determined with cFx,10ccor are larger than the mean results; this difference increases with larger number of spans. Two reasons were identified for this difference:
1. The correlation factor was only determined over a single line of pressure taps across the ridges of the model, see Figure 6A. A smaller ccor value would result if the whole model was mounted with pressure taps.
2. The correlation factor was only determined for the 30-span model. However, Figure 11C shows that ccor is dependent on the number of spans; for 10 spans ccor ≈ 0.38 and for 20 spans ccor ≈ 0.37. For more than 30 spans, the correlation factor will be slightly smaller than the 30-span value of ccor = 0.35.
Considering these shortcomings in the assessment of the lack of correlation, the static force measurement results are the appropriate reference for comparison with EN 1991-1-4 and EN 13031-1.
Figure 12B presents results for the overall horizontal force obtained with EN 1991-1-4 and EN 13031-1. Comparison of these code results with the static force results leads to the following observations:
– For duo-pitch greenhouses larger than 20 spans, EN 13031-1 results in smaller overall forces than those obtained with the static force measurements. With increasing number of spans, EN 13031-1 becomes increasingly non-conservative.
– EN 1991-1-4 gives conservative results for any number of spans, but is increasingly conservative with larger number of spans. At 90 spans, the forces obtained with EN 1991-1-4 are 25% (Annex C) to 50% (Annex B) larger than the static force result. Although not applicable for multi-span duo-pitch buildings, Figure 12B shows that the equivalent friction coefficient cfr,eq = 0.05 would result in an even larger force, with at 90 spans a force more than twice as large as the static force result.
Discussion
The comparison of the results of this study with EN 1991-1-4 and EN 13031-1 has identified a number of issues in the assessment of the overall horizontal wind force on large multi-span greenhouses. This section discusses these issues in more detail.
Application of Positive Values for Wind-Facing Roof Faces
Cook (1990) states that typically where the mean coefficient is near 0, a maximum and minimum value of the pseudo-steady coefficient are required. The pressure measurements performed in this study show that the mean pressure coefficient on the wind-facing roof faces are near 0. Therefore, both a maximum and minimum values are required for the wind-facing roof faces, also beyond the first roof span. However, beyond the first roof span, EN 1991-1-4 and EN 13031-1 do not specify positive values for the pressure coefficients on the wind-facing roof faces.
The reason EN 1991-1-4 does not give positive values on the wind-facing roof faces beyond the first span, is that it applies troughed single-span values for multi-span buildings. For troughed duo-pitch roofs with roof pitch angles larger than 15°, EN 1991-1-4 does not specify positive values on the windward face. This is appropriate for single-span duo-pitch roofs, because the negative pressures on the windward face are so large that positive pressures do not occur. However, this is not appropriate for multi-span duo-pitch roofs, because positive pressures do occur on the wind-facing roof faces.
Beyond the first roof span, EN 13031-1 does not specify positive values on the wind-facing roof faces either. The pressure coefficients specified in EN 13031-1 for spans 2–9 were for a large part based on the results by Wells and Hoxey (1980) and Hoxey and Moran (1991). These studies do not clearly state whether they determined mean or peak coefficients. Figure 1B shows the pressure coefficients determined by Hoxey and Moran (1991). After three spans, the magnitude of these coefficients on the wind-facing roof face is cpe ≈ −0.3. Whether these coefficients are mean or minimum values do not really matter, in either case it is not likely that the maximum values are negative. The same reasoning can be applied for the roof coefficients specified in EN 13031-1 after nine spans.
This discussion shows that the reasons for the absence of positive values on the wind-facing roof faces of multi-span buildings in EN 1991-1-4 and EN 13031-1 are unsound. The results of the current study further show that these positive values are needed for appropriate assessment of the overall wind force on greenhouses. To solve this deficiency requires the implementation of positive values (besides the negative values) for the pressure coefficients on the wind-facing roof faces of multi-span buildings in EN 1991-1-4 and EN 13031-1.
Net Horizontal Wind Force per Roof Span
Beyond nine spans, EN 13031-1 specifies cpe = −0.4 on both wind-facing and lee-facing roof face, resulting in a zero horizontal wind force per roof span. The study by Van Koten (1977) and the East German standard TGL 32274-7 (1976) also specify this value for these roof faces. According to Van Koten (1977), at some distance of the windward wall the average internal pressure will equalize with the average external pressure on the roof. From this point, the roof will only be loaded by pressure fluctuations, which is why Van Koten (1977) specifies the same value for both wind-facing and lee-facing roof face. However, if these roof faces are only loaded by pressure fluctuations, as Van Koten (1977) suggests, the peak wind load on the roof span will not be 0. The results of the current study show that the peak force coefficient per roof span cFx,rs,10 = 0.3, and the mean force coefficient per roof span . The application of pressure coefficients of equal magnitude and sign on wind- and lee-facing roof faces, as suggested in EN 13031-1, results in an inaccurate and non-conservative outcome for the overall horizontal wind force on large multi-span greenhouses (i.e., larger than 20 spans). These issues can be solved with implementation of positive values for the pressure coefficients on the wind-facing roof faces, as suggested in the previous section.
Reduction Factors for Spatial Correlation
Both EN 1991-1-4 and EN 13031-1 give reduction factors for spatial correlation. For the greenhouse dimensions specified in Table 1, the values calculated for cs were 0.61 (EN 1991-1-4 Annex C) and 0.72 (EN 1991-1-4 Annex B), and the value for cdg (EN 13031-1) was 0.66 and 0.64. All these values are significantly larger than the values determined for ccor on the roof (ccor = 0.35) or on the whole greenhouse model (ccor = 0.45). This difference between measurements and codes would be even more significant if the correlation factor was determined for a greenhouse model that was completely mounted with pressure taps, as explained in Section “Overall Horizontal Forces.”
The size factor cs is larger than ccor, because it considers only the in-plane correlation. The size factor does not consider the lack of correlation between different faces. EN 1991-1-4 does allow for an additional factor, see EN 1991-1-4 5.3(5), for the lack of correlation between windward and leeward wall. EN 1991-1-4 does not specify a factor for lack of correlation between the roof faces.
The dynamic coefficient cdg (EN 13031-1) considers both the lack of in-plane correlation as well as the lack of correlation between windward and leeward wall. cdg does not account for the lack of correlation between the roof faces.
The current specifications of pressure coefficients for the roof faces in EN 1991-1-4 and EN 13031-1 do not allow for the implementation of a reduction factor for the lack of correlation between the roof faces. The introduction of such a reduction factor in either code should be accompanied with the implementation of positive values for the pressure coefficients on the wind-facing roof faces.
Conclusion
An atmospheric boundary layer wind tunnel study was performed to investigate the overall horizontal wind force on multi-span duo-pitch greenhouses. In engineering practice, this force is determined to assess the stability design, i.e., the load bearing capacity of the main bearing system. Static force measurements were made on nine models with multi-span duo-pitch roof. These measurements showed that the overall force increases linearly with increasing number of spans.
Additional pressure measurements were performed on a 30-span greenhouse model to (1) verify the static force result, (2) determine the distribution of the overall horizontal force over the greenhouse structure, and (3) assess the influence of the lack of correlation in the measured pressures on the overall horizontal wind force.
The horizontal forces determined with the mean pressure coefficients are in good agreement with the static force results. The mean and peak pressure coefficient results further showed that the influence of the separation bubble stretches up to the fifth span, after which no significant changes were observed in the roof span pressure distribution. The investigation into the correlation of the roof pressures showed that these pressures are relatively little correlated, especially if the pressures on multiple spans are considered. The overall horizontal force on the roof of multi-span buildings reduces significantly because of this lack of correlation. For the investigated 30-span model, accounting for the lack of correlation in the roof pressures resulted in a 65% reduction in the peak overall horizontal wind force on the roof.
A comparison was made between the measurements and European codes which specify wind loads on greenhouses, EN 1991-1-4 and EN 13031-1. This comparison showed:
– EN 13031-1 provides conservative outcomes for duo-pitch greenhouses smaller than 20 spans. Beyond 20 spans, the results become non-conservative; at 90 spans, the measured overall horizontal wind force is almost a factor 2 larger.
– Beyond 10 spans, EN 1991-1-4 is increasingly conservative with larger number of spans. At 90 spans, the forces obtained with EN 1991-1-4 are 25% (EN 1991-1-4 Annex C) to 50% (EN 1991-1-4 Annex B) larger than the static force result.
The assessment of the overall horizontal wind force with EN 1991-1-4 and EN 13031-1 has also identified a number of issues with both codes:
– Beyond the first roof span, EN 1991-1-4 and EN 13031-1 only specify negative values for the pressure coefficients on the wind-facing roof faces. This study shows specification of the positive values, besides the negative values, is needed for these faces.
– Beyond nine spans, EN 13031-1 specifies −0.4 on both wind- and lee-facing roof face, resulting in a zero horizontal wind force per span. This study shows the resulting net horizontal wind force per roof span is not 0. A modification of the pressure coefficients on these spans is needed. This issue could also be addressed with the implementation of positive and negative values on the wind-facing roof faces.
– The reduction factors in EN 1991-1-4 and EN 13031-1 for spatial correlations do not account for the lack of correlation between the roof faces. This study shows this lack of correlation is an important factor in the overall horizontal wind force on multi-span greenhouses. The introduction of a reduction factor for the lack of correlation between the roof faces in EN 1991-1-4 and EN 13031-1 should be accompanied with the implementation of positive values for the pressure coefficients on the wind-facing roof faces.
Notation
| LATIN SYMBOLS | ||
| A | Area | [m2] |
| Ai | Area assigned to position i | [m2] |
| Aref | Reference area | [m2] |
| aX | Dispersion of the Gumbel distribution | [–] |
| bw | Width | [m] |
| B2 | Background response factor | [–] |
| ccor | Correlation factor | [–] |
| cX | Load coefficient | [–] |
| cd | Dynamic factor | [–] |
| cdir | Directional factor | [–] |
| cdg | Dynamic coefficient | [–] |
| cf | Force coefficient notation in EN 13031-1 and EN 1991-1-4 | [–] |
| cF | Force coefficient notation applied for experimental results | [–] |
| cfr | Surface friction coefficient | [–] |
| cfr,eq | Equivalent friction coefficient | [–] |
| Characteristic peak force coefficient | [–] | |
| cFx | Horizontal force coefficient | [–] |
| cFx,rs | Horizontal force coefficient per roof span | [–] |
| cFx,10 | Code calibrated overall force coefficient | [–] |
| Hor. peak force coefficient per roof span without lack of correlation | [–] | |
| Hor. peak force coefficient per span with lack of correlation | [–] | |
| co | Orography factor | [–] |
| cp | Pressure coefficient | [–] |
| cpe | External pressure coefficient | [–] |
| cpe,10 | External pressure coefficient representative for an area of 10 m2 | [–] |
| cpi | Internal pressure coefficient | [–] |
| cprob | Probability factor | [–] |
| cp,i | Pressure coefficient at position i | [–] |
| cp,int | Internal pressure coefficient | [–] |
| cp,l | External pressure coefficient on the lee-facing roof face | [–] |
| Characteristic peak pressure coefficient at position i | [–] | |
| cp,w | External pressure coefficient on the wind-facing roof face | [–] |
| cs | Size factor | [–] |
| cseason | Seasonal factor | [–] |
| dr | Roof face length | [m] |
| dw | Depth | [m] |
| F | Force | [N] |
| Fx,ms | Force in longitudinal direction on the multi-span roof models | [N] |
| Fx,10s | Force in longitudinal direction on the 10-span model | [N] |
| h | Eaves height | [m] |
| hr | Roof height | [m] |
| hIBL | Internal boundary layer height | [m] |
| H | Ridge height | [m] |
| i | Instance of a series | [–] |
| I | Turbulence intensity | [–] |
| Iu | Turbulence intensity in longitudinal direction | [–] |
| Iv | Turbulence intensity in transverse direction parallel to the ground | [–] |
| Iw | Turbulence intensity in transverse dir. perpendicular to the ground | [–] |
| Je | Jensen number | [–] |
| l | Greenhouse length | [m] |
| Lux | Turbulent length scale | [m] |
| Lfs | Full-scale length dimension | [m] |
| Lwt | Wind tunnel length dimension | [m] |
| n | Total number of instances of a series | [–] |
| s | Greenhouse roof span | [m] |
| w | Greenhouse width | [m] |
| p | Pressure | [N/m2] |
| Pi | The expected non-exceedance probability of a peak | [–] |
| q | Dynamic pressure | [N/m2] |
| Re | Reynolds number | [–] |
| t | Time | [s] |
| ts | Sampling time | [s] |
| T | Reference period | [s] |
| U | Velocity in longitudinal direction | [m/s] |
| Ufs | Full-scale wind velocity | [m/s] |
| Uref | Reference wind velocity | [m/s] |
| Uwt | Wind tunnel velocity | [m/s] |
| UX | Mode of the Gumbel distribution | [–] |
| V | Velocity in lateral direction | [m/s] |
| vb,0 | Basic wind velocity | [m/s] |
| W | Velocity in vertical direction | [m/s] |
| x | Dimension along horizontal building axis | [m] |
| X | Load | [–] |
| y | Dimension along perpendicular building axis | [m] |
| yi | Reduced variate, yi=−ln(−ln(Pi)) | [–] |
| z | Dimension along vertical building axis | [m] |
| z0 | Aerodynamic roughness length | [m] |
| z0+ | The larger of two roughness lengths | [m] |
| z0,I | Roughness length in boundary layer I | [m] |
| z0,II | Roughness length in boundary layer II | [m] |
| ze | Reference height | [m] |
| zs | Height equal to 0.6H | [m] |
| GREEK SYMBOLS | ||
| α | Greenhouse roof pitch angle | [°] |
| β | Greenhouse half roof top angle | [°] |
| ρ | Air density | [kg/m3] |
| λG | Geometric scale | [–] |
| λT | Time scale | [–] |
| λU | Velocity scale | [–] |
| θ | Angle of incidence | [°] |
| ν | Kinematic viscosity | [m2/s] |
| ABBREVIATIONS | ||
| GH | Greenhouse | |
| IBL | Internal boundary layer | |
| l | Lee-facing | |
| ms | Multi-span | |
| ref | Reference | |
| rs | Roof span | |
| tot | Total | |
| w | Wind-facing | |
| ACCENTS | ||
| Mean value | [–] | |
| Standard deviation value | [–] | |
| Peak value | [–] | |
Author Contributions
AB, CG, CB, and LK are researchers at TNO (the Netherlands). AB has carried out most of the data analysis along with CG, CB, and LK. AB has written this paper in collaboration with the coauthors CG, CB, LK, and IP. IP is researcher at Ingenieurburo Puthli (Germany) and has checked the performed analysis and calculations and made significant contributions to the paper.
Conflict of Interest Statement
The authors declare that the research was conducted in the absence of any commercial or financial relationships that could be construed as a potential conflict of interest.
Funding
This work was funded by Topsector Tuinbouw & Uitgangsmaterialen through the program Development of Greenhouse structural design (KV 1310-300).
References
ASCE. (1999). Manual of Practice for Wind Tunnel Studies of Buildings and Structures, No. 67. Reston, VA: ASCE.
Bronkhorst, A. J., Geurts, C. P. W., van der Knaap, L. P. M., and ’t Hart, H. (2016). Wind Tunnel Measurements for the Assessment of Global Wind Loads on Large Multi-Span Duo-Pitch Greenhouses. The Netherlands: Delft. TNO 2016 R11075.
CEN. (2001). Greenhouses: Design and Construction – Part 1: Commercial Production Greenhouses. EN 13031-1. Brussel: European Committee for Standardization.
CEN. (2010). Eurocode 1: Actions on Structures – Part 1-4: General Actions – Wind Actions. EN 1991-1-4. Brussel: European Committee for Standardization.
Cook, N. J. (1990). The Designer’s Guide to Wind Loading of Building Structures – Part 2 Static Structures. London, UK: Butterworth Heinemann.
Cook, N. J., and Mayne, J. R. (1981). “Design methods for wind loading on class A structures,” in Wind Engineering in the Eighties, Proc. CIRIA Conf (London, UK).
Cui, B. (2007). Wind Effects on Monosloped and Sawtooth Roofs. Ph.D. thesis, Clemson University, USA.
CUR. (2005). Aanbeveling 103 – Windtunnelonderzoek voor de bepaling van ontwerp windbelastingen op (hoge) gebouwen en onderdelen ervan. Gouda: Stichting CUR.
Gavanski, E., Gurley, K. R., and Kopp, G. A. (2016). Uncertainties in the estimation of local peak pressures on low-rise buildings by using the Gumbel distribution fitting approach. J. Struct. Eng. 142, 1–14. doi:10.1061/(ASCE)ST.1943-541X.0001556
Geurts, C. P. W. (1997). Wind-Induced Pressure Fluctuations on Building Facades. Ph.D. thesis, TU Eindhoven, Faculty of Architecture.
Geurts, C. P. W. (1998). Achtergrond bij de bepaling van reductiefactoren voor afmetingen, voor de berekening van windbelasting op tuinbouwkassen. Rijswijk: TNO Bouw, 21. TNO Bouw, 98-CON-R0784.
Gringorten, I. I. (1963). A plotting rule for extreme probability paper. J. Geophys. Res. 68, 813–814. doi:10.1029/JZ068i003p00813
Högström, U., Bergström, H., and Alexandersson, H. (1982). Turbulence characteristics in a near neutrally stratified urban atmosphere. Boundary Layer Meteorol. 23, 449–472. doi:10.1007/BF00116272
Holmes, J. D. (1983). Wind Loads of Saw-Tooth Buildings, Part I – Point Pressures, Internal Report Number 83/17. Melbourne, VIC: Division of Building Research, CSIRO.
Holmes, J. D. (1984). Wind Loads of Saw-Tooth Buildings, Part II – Panel Pressures, Internal Report Number 84/1. Melbourne, VIC: Division of Building Research, CSIRO.
Holmes, J. D. (1987). “Wind loading of multi-span building,” in 1st Nat. Struct. Eng. Conf (Melbourne, VIC).
Hoxey, R. P., and Moran, P. (1991). Full Scale Wind Pressure and Load Experiments – Multispan 167 x 111 m Glasshouse (Venlo). Silsoe: AFRC Eng. Res. Div. Note DN.1594.
Kanda, M., and Maruta, E. (1993). Characteristics of fluctuating wind pressure on long low-rise buildings with gable roofs. J. Wind Eng. Ind. Aero. 50, 173–182. doi:10.1016/0167-6105(93)90072-V
Kasperski, M. (1996). Design wind loads for low-rise buildings: a critical review of wind load specification for industrial buildings. J. Wind Eng. Ind. Aero. 61, 169–179. doi:10.1016/0167-6105(96)00051-7
LEI Wageningen UR. (2015). Greenhouse Horticulture. Available from: http://www.agrimatie.nl/SectorResultaat.aspx?subpubID=2290§orID=2240
Moran, P., and Westgate, G. R. (1982). Wind Loads on Farm Buildings: (9) Full-Scale Measurements on 36.2 m Long Twin 20.6 m Span Ridged Roof Building of 4.8 m Eaves Height and 16 Roof Pitch. Silsoe: NIAE, 14. Div. Note DN. 1127.
Stathopoulos, T., and Saathoff, P. (1991). Wind pressure on roofs of various geometries. J. Wind Eng. Ind. Aero. 38, 273–284. doi:10.1016/0167-6105(91)90047-Z
TGL 32274-7. (1976). Lastannahmen für Bauwerke – Windlasten. DDR-Standard. Leipzig: Bauakademie der DDR, Institut für Projectierung und Standardisierung, 21.
Van Bentum, C., Koster, T., and Geurts, C. P. W. (2013). “Force coefficients of multi-span greenhouses,” in 6th European and African Conference on Wind Engineering (EACWE 2013) (Cambridge).
Van Koten, H. (1977). Verslag van winddrukmetingen aan tuinbouwkassen – verwerking van de meetresultaten ten behoeve van richtlijnen voor ontwerpen. TNO Rapport Nr. B-77-164. Rijswijk: TNO IBBC.
Van Koten, H., and Bos, C. A. M. (1974). Windbelasting op tuinbouwkassen. TNO Rapport Nr. B-73-51. Rijswijk: TNO IBBC.
Wells, D. A., and Hoxey, R. P. (1980). Measurements of wind loads on full-scale glasshouses. J. Wind Eng. Ind. Aero. 6, 139–167. doi:10.1016/0167-6105(80)90027-6
Keywords: static wind loads, multi-span duo-pitch greenhouses, stability design, wind tunnel measurements, force and pressure coefficients, correlation of wind pressures, size factor, dynamic coefficient
Citation: Bronkhorst AJ, Geurts CPW, van Bentum CA, van der Knaap LPM and Pertermann I (2017) Wind Loads for Stability Design of Large Multi-Span Duo-Pitch Greenhouses. Front. Built Environ. 3:18. doi: 10.3389/fbuil.2017.00018
Received: 06 December 2016; Accepted: 01 March 2017;
Published: 27 March 2017
Edited by:
Gregory Alan Kopp, University of Western Ontario, CanadaReviewed by:
Yukio Tamura, Beijing Jiaotong University, ChinaYan Han, Changsha University of Science and Technology, China
Copyright: © 2017 Bronkhorst, Geurts, van Bentum, van der Knaap and Pertermann. This is an open-access article distributed under the terms of the Creative Commons Attribution License (CC BY). The use, distribution or reproduction in other forums is permitted, provided the original author(s) or licensor are credited and that the original publication in this journal is cited, in accordance with accepted academic practice. No use, distribution or reproduction is permitted which does not comply with these terms.
*Correspondence: A. J. Bronkhorst, b2trZS5icm9ua2hvcnN0QHRuby5ubA==
 A. J. Bronkhorst
 C. P. W. Geurts
 C. A. van Bentum
 L. P. M. van der Knaap
 I. Pertermann