 Ian F. C. Smith1,2*
- 1Applied Computing and Mechanics Laboratory, Swiss Federal Institute of Technology (EPFL), School of Architecture, Civil and Environmental Engineering (ENAC), Lausanne, Switzerland
- 2Future Cities Laboratory, ETH Zurich, Singapore-ETH Centre (SEC), Singapore, Singapore
Sensing in the built environment has the potential to reduce asset management expenditure and contribute to extending useful service life. In the built environment, measurements are usually performed indirectly; effects are measured remote from their causes. Modeling approximations from many sources, such as boundary conditions, geometrical simplifications, and numerical assumptions, result in important systematic uncertainties that modify correlation values between measurement points. In addition, conservative behavior models that were employed – justifiably during the design stage, prior to construction – are generally inadequate when explaining measurements of real behavior. This paper summarizes the special context of sensor data interpretation for asset management in the built environment. Nearly 20 years of research results from several doctoral thesis and 14 full-scale case studies in 4 countries are summarized. Originally inspired from research into model-based diagnosis, work on multiple model identification evolved into a methodology for probabilistic model falsification. Throughout the research, parallel studies developed strategies for measurement system design. Recent comparisons with Bayesian model updating have shown that while traditional applications Bayesian methods are precise and accurate when all is known, they are not robust in the presence of approximate models. Finally, details of the full-scale case studies that have been used to develop model falsification are briefly described. The model-falsification strategy for data interpretation provides engineers with an easy-to-understand tool that is compatible with the context of the built environment.
Introduction
The wealth of nations is increasingly determined by the quality of human capital. High performers, while often forgoing monetary rewards to follow their passion, typically wish to live in places where the quality of life is high. For example, it is no coincidence that most of the best universities in the world are located in nice places to live.
The factors that provide a high quality of life are numerous and interdependent. A base condition for many factors is a high-performance built environment. A common reality affecting built-environment assets, such as roads, bridges, building, dams, tunnels, and towers, is that they deteriorate over time. Efficient management of aging assets is thus a necessary condition for high performance, and this contributes to quality of life.
A simple solution to aging-infrastructure-asset management is systematic replacement when performance is in doubt. However, replacement of all aging infrastructure is not sustainable, not cost-effective, not convenient (e.g., bridge construction causes traffic jams), not safe (e.g., traffic jams cause road accidents), and often not possible (e.g., in the USA). As construction costing trends move toward inclusion of factors other than capital cost, the true costs of replacement will become approximated more accurately than is currently the case. Replacement is destined to become the last option that engineers take in the majority of situations.
A future where infrastructure assets last indefinitely due to appropriate inspection, maintenance, repair, improvement, and extension is an attractive, and today, an attainable goal. To achieve this, it is essential to have an accurate knowledge of infrastructure behavior. Such knowledge supports activities such as use of quantitative methods for determining maintenance, improvement, and repair priorities as well as evaluations of retrofit designs when aspects such as loading and intended function change. Ultimately, when replacement is weighed against strengthening, extending, and improving, decision makers should have the best knowledge possible. This means that they must have accurate structural mechanics-based behavior models that are capable of providing good predictions, even when extrapolating to determine, e.g., the impact of retrofit solutions.
Fortunately, there is usually much reserve capacity in infrastructure. Behavior models used for design are inherently safe due to high risks and construction-stage uncertainties. A key challenge is that the amount of reserve capacity is unknown. Once a structure is built, appropriate sensing and unbiased data interpretation help to discover previously hidden reserve capacity. Sensing thus has the potential to unlock spending reductions and flexibility when finding the best measures for extending service life.
Sensor data interpretation has been carried out for decades. It is often included as a sub-field of structural health monitoring (SHM) and there are regular conferences [International Society for Structural Health Monitoring of Intelligent Infrastructure,1 International Workshop on Structural Health Monitoring,2 the World Conference on Structural Control and Monitoring (WCSCM), European Workshop on Structural Health Monitoring (EWSHM)], sessions at conferences of the American Society for Civil Engineers (ASCE-SEI, ASCE-EMI), journals (Structural Health Monitoring3 and Journal of Civil Structural Health Monitoring4), and entire books dedicated to SHM [e.g., Boller et al. (2009) and Çatbas et al. (2013a)]. However, many contributions were developed originally for applications that are not related to the built environment. Intrinsic assumptions in these proposals are often not compatible with the challenges of large infrastructure assets. This results in poor, and potentially bad, support for asset management.
This paper describes the unique context of sensing for asset management in the built environment. A specially developed strategy for data interpretation – that has been developed and refined specifically for this context through several doctoral theses over nearly 20 years – is reviewed. While this review includes comparisons with other methods that are currently proposed, there is no attempt to provide an exhaustive review of all data interpretation research into asset management. At the end of this paper, several full-scale case studies that have been used to illustrate and validate the strategy are summarized.
The Context of Sensor Data Interpretation in the Built Environment
Figure 1 shows a description of the context of using sensors for asset management in the built environment. This context is described according to three axes, proximity of measurement to cause, detail of physical principle behavior model, and degree of uncertainty. In spite of tremendous advances in sensor technology, in the built environment, it is usually impossible to perform direct measurements of all physical phenomena of interest in every direction on every element. Indirect measurements are used with physical principle models in order to determine causes. This is a common context for system identification.
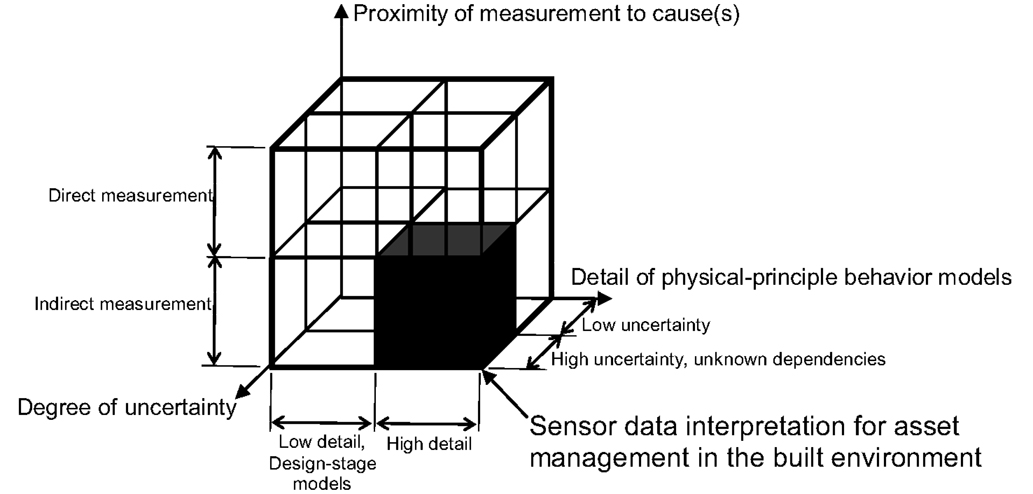
Figure 1. Sensor data interpretation for asset management in the built environment is performed with detailed physical-principle models that are improved through indirect measurements under conditions of high levels of uncertainty and unknown dependencies between measurement positions. The best data interpretation strategies in other contexts may differ from those that are the best in this context.
In some situations, it is possible and prudent to perform direct measurements. For example, Yao and Glisic (2015) have developed a crack detection plate that can detect and follow the growth of fatigue cracks in steel elements. Other studies have involved placing strain gages directly on reinforcing bars in bridge decks. These are relatively rare situations where the critical behavior, in these cases fatigue at a specific location, is known a priori. Also, subsequent analyses and asset management decision-making usually includes other measurements that are indirect.
Asset management benefits a great deal from high-detail physical-principle behavior models that are compatible with measurements. While design-stage models often do not need to be sophisticated, once a structure is built, determination of reserve capacity requires more enhanced models that are capable of representing aspects such as deterioration, real support conditions, and as-built geometry. As stated earlier, enhanced models help to improve the assessments of decision-making options, such as repair, retrofit, improvement, and replacement.
Much research has been performed on model-free, sometimes called output-only and data driven, methods using data interpretation strategies that have usually been developed for contexts such as signal analysis in electrical engineering and the field of computer vision [e.g., Posenato et al. (2010) and Laory et al. (2013a)]. While these methods may be of interest in some contexts for detecting damage, there is weak support for subsequent decision-making. Often, damage is visible by inspectors prior to model-free detection, and there is usually poor support for minimizing false positives and negatives. The best context for model-free methods may be a low-cost option for special high-visibility structures where detection of anomalies in behavior is important for political and social reasons. This is not the case for the majority of the built environment and therefore, this type of application falls outside of the sub-cube in Figure 1.
The built environment involves many sources of uncertainty that are related to measurements, model-parameter values, and model discrepancy. Modeling uncertainties are often many times greater than measurement uncertainties. Most of these sources cannot be described using Gaussian distributions at measurement locations. Many sources create significant levels of systematic uncertainty. A common property of any system is that predicted values at a given location are correlated with values at other locations. Most subtly, correlations are dependent upon the magnitude of systematic uncertainty. These aspects create a difficult context for application of traditional probabilistic concepts to asset management in the built environment. Consequences of such a situation are discussed further in this paper. This last distinction, reflected by the axis in Figure 1 that is labeled “degree of uncertainty” is an important factor for selecting good data interpretation strategies for asset management in the built environment.
Multiple-Model Diagnosis
Effective asset management is supported by knowledge of real behavior. Even without uncertainty, attempting to find the cause(s) of an observed effect (e.g., find a behavior model that explains measurements) in a complex system is a fundamentally ambiguous exercise. While this has long been recognized in medicine, most diagnostic work in engineering has attempted to identify a single behavior model, usually using curve fitting techniques of various levels of sophistication. Such a strategy results in, at best, poor support for asset management and, at worst, dangerous estimations of reserve capacity.
In ambiguous situations, population approaches are most appropriate because they can explicitly represent multiple explanations for values of measurements. In structural engineering, the concept of a “candidate model” was first introduced by Raphael and Smith (1998). Inspired by model-based diagnosis and compositional modeling work in the field of artificial intelligence (Falkenhainer and Forbus, 1991), they proposed a strategy to provide multiple explanations for measurements by means of multiple instances of behavior models that were composed through retrieving model fragments from a case base. From this early work, it was decided that once a model was determined to be a candidate model, there was no candidate model that was better than another. The amount and quality of knowledge available regarding uncertainties was not able to justify a more refined discrimination than a uniform distribution; either a model is a candidate model or it is not.
Robert-Nicoud et al. (2005a) extended this approach through an attempt to quantify modeling and measurement errors and through the definition of thresholds. Thresholds were calculated to be the sum of three sources of modeling errors as well as measurement error. These thresholds were used as stopping criteria for a stochastic search algorithm that minimized the residual between measurements and model predictions. Once a threshold was obtained, the algorithm generated new model instances to test whether other behavior models provided predictions that gave residuals below the threshold levels. The set of all models that satisfied the threshold conditions became candidate models.
The interpretation task is described as follows. Identify unknown model-parameter values θ = [θ1, θ2, …, θN] using measurement data yi. Equation 1 connects measurements, model-parameter values, errors and model predictions.
where nm is the number of measurements, i denotes the ith measurement location, gi(θ) is the model-prediction value at measurement location i, R is the real value (unknown), εmeasure and εmodel are the measurement and modeling errors.
For threshold bounds, Ti,low and Ti,high, which are defined by measuring and modeling errors, the following condition must be satisfied by a candidate model instance at all measurement locations:
Since error values were approximations, all candidate models were considered to be equivalently likely. It was a deliberate decision at this stage not to assign greater likelihood to candidate models that were, e.g., furthest from the threshold values. This view has held for all studies since.
In order to manage sets of models and their predictions, Saitta et al. (2008) proposed strategies from the field of data mining to improve knowledge of candidate model sets (CMS) through principle components analysis and clustering of eigenvalues. Further work (Saitta et al., 2010) involved feature selection through a combination of stochastic search and support vector machine strategies. Feature sets were revealed that had fewer components than using other methods, thereby providing extra support for large CMS. Following this research, other groups began investigations using multiple models [e.g., Gokce et al. (2013) and Catbas et al. (2013b)].
Ravindran et al. (2007) began research into a probabilistic approach to multiple-model system identification. In this work, it was assumed that all uncertainties were of Gaussian form, and that there were no sources of systematic uncertainty. Furthermore, it was assumed that there was no correlation between measurement points. This was the first attempt to define thresholds according to a target reliability of identification. This small study was the precursor to a much more comprehensive set of probability-based studies that are described in the next section.
Probabilistic Model Falsification
The use of thresholds to identify a CMS is a strategy where measurements reduce the size of the initial model set. This process can also be thought of using thresholds to falsify (or refute) models that do not provide adequate explanations for measurements. This is equivalent to a strategy promoted by Popper (2002) in the philosophy of science. Popper proposed that measurements can only falsify theories; validation by measurement is, at best, weak science. Others, such as Tarantola (2005, 2006) in physics and Beven (2002) in the environmental sciences have also adopted this approach.
Recognizing this connection, Goulet sought to put the multiple-model strategy on a firmer probabilistic foundation while more realistically representing the nature of uncertainties that are common in the built environment (Goulet et al., 2013a, 2014). Rather than using scalar values for errors, they are described as distributions of uncertainty (U), as follows in Eq. 3:
Starting with a target reliability of identification, which is often fixed at 95% for engineering purposes, model instances that result in predictions falling outside threshold bounds on measurements on-site are falsified. Threshold bounds are determined through combining modeling and measurement uncertainties. These uncertainties may have any type of distribution and may include a systematic bias. Importantly, falsification results are often not sensitive to changes in correlations between measurement locations and therefore, exact knowledge of correlations is not necessary.
Typical behavior models of built infrastructure are very conservative. Systematic bias originates from sources such as boundary conditions and many types of other model discrepancies. Components of this uncertainty are not necessarily related only to parameter uncertainties; the entire model formulation usually has a significant uncertainty. Modeling uncertainty is often much more than measurement uncertainty. Systematic uncertainty levels change the values of correlation between measurement locations. Therefore, this implementation of model falsification is compatible with the characteristics of asset management in the built environment.
Goulet and Smith (2013) employed the Sidak (1967) correction to link thresholds values with the number of measurements. In this way, the target reliability of identification remains constant for varying numbers of comparisons of predictions with measurements. This correction also helped to define the point of over-instrumentation when configuring measurement systems. This aspect is discussed in more detail in the following section. The methodology was named Error-Doman Model Falsification (EDMF).
A new metric, called expected identifiability, which was used to quantify the usefulness of a given monitoring intervention was also proposed (Goulet and Smith, 2013). This metric provided a convenient way to examine the effects of parameters such as model assumptions, measurement system configuration, sensor type, and uncertainty level on falsification results. While the obvious use of this metric was sensor-system configuration (next section), subsequent theses, see below, described other useful applications of this metric.
Pasquier extended the work of Goulet to develop an iterative structural identification framework (Pasquier and Smith, 2016) that included the following six tasks: monitoring, modeling, in situ inspection, model falsification, assessment of performance, and prognosis. No task sequence was prescribed; engineers, placed at the center of this framework, opportunistically selected the task that is the best at the time.
Depending on results, several iterations of task groups were necessary to converge to acceptable results. For example, when initial model classes (model parameterizations) were not close enough to observations, this results in complete model-class falsification (every model instance is falsified). This situation led to definition of a new model class, perhaps after a site inspection and then, another round of measurements and model falsification. In this way, model falsification provided unique support for model-class selection.
Pasquier also proposed two prognosis methodologies for the evaluation of fatigue-life reserve capacity (Pasquier et al., 2014, 2015). They were successfully shown to out-perform current conservative estimations of fatigue life for a hollow-section steel-truss bridge in Switzerland. Propagation of uncertainty from many sources provided support for potential structural-management decisions related to repair, retrofit, and replacement.
A more complete and mathematically rigorous mathematic representation of model falsification has been developed as follows (Pasquier and Smith, 2016). Let Ω be the initial model set composed of the initial parameter values, θ. The CMS is defined as:
with threshold bounds [ui,low, ui,high] being defined such that
where ϕ is the target reliability of identification and, Uc,i, the combined uncertainty. Based on Eq. 4, all model instances that are falsified are assigned a probability
while all model instances that belong to the candidate-model set are assigned a constant probability:
The prediction of a quantity Qj at nq can be defined according to Eq. 3 and the improved knowledge of parameter values:
In another study, Vernay et al. (2014, 2015a,b) used model falsification to improve models of airflow around buildings. Information provided by measurements was used to approximate simulation parameter value ranges. Measurements, model predictions, and uncertainties varied with respect to time, and this led to a dynamic implementation of model falsification. Uncertainties related to turbulence and those associated with convection were approximated using unique strategies. Three full-scale case studies tested various aspects of the approach. The ranges of prediction were significantly reduced after measurements, and predictions have been reliable at measurement locations where data were not used for falsification.
Following preliminary simulation work by Robert-Nicoud et al. (2005b) and Goulet et al. (2013b), model falsification was applied to a study of the performance of pressurized water distribution networks. Leak regions were detected through falsification of leak locations that did not explain flow measurements at sensor locations. Network reduction strategies were compared according to falsification efficiency and computation-time reduction using a Pareto analysis (Moser et al., 2015). Using simulated leaks (opening of hydrants) of full-scale networks, network demand as well as total uncertainty were approximated. Using a case study that involved part of the network of the city of Lausanne, it was found that demand estimation decreased the systematic bias of the uncertainties in the system (Moser, 2015).
An electrical network analogy was shown to be reliable for model falsification using Goulet’s reliability of identification metric (Moser, 2015). This led to use of two low-cost case studies involving electrical networks where the usefulness for developing and testing model-falsification strategies for water-distribution networks was demonstrated.
For example, electrical networks provide upper-bound performance indications since they contain lower-bound degrees of uncertainties when compared with water distribution networks. Therefore, owners and operators can be shown, quickly and inexpensively, the best possible performance of a particular flow-sensor configuration. Such physical demonstrations are useful, e.g., for convincing decision makers to make additional sensing investments when the performance using electrical networks is shown to be unsatisfactory.
Sensor Configuration
Falsification of multiple models in order to find discrete populations of candidate models provides unique opportunities to determine good sensor configurations. For example, those sensor configurations that have a high probability of significantly reducing the size of the CMS from the initial model set are preferable to those configurations that are not likely to falsify as many models. This has been a starting point for several studies since 2002.
Robert-Nicoud et al. (2005b) used multiple-model predictions to calculate information entropy values at potential sensor locations. Those places where entropy was highest were chosen for sensor locations, and the criterion of the number of non-identified models versus the number of sensors was used to select sensors for a laboratory structure and a water-supply network. The strategy employed a greedy algorithm, which does not revise previous sensor-position allocations when subsequent positions are selected.
Since the greedy algorithm performs a type of local search and this may lead to a sensor configuration that is sub-optimal, Kripakaran et al. (2007) studied a global search algorithm using the example of a historical bridge in Switzerland. The global search algorithm out-performed the greedy algorithm for this example when placing sensors 4–14. Nevertheless, it was concluded that a greedy algorithm is useful when extra sensors need to be added to an existing system.
A backward greedy algorithm was investigated by Goulet et al. (2013b). This involved starting with sensors at all possible locations and removing them according the least useful. At each step, expected identifiability was calculated. This process was repeated until a single sensor was left. This procedure led to a plot of the expected number of candidate models versus the number of measurements. Since the Sidak correction often led to a minimum number of candidate models when its effects stopped overpowering the increase in the number of candidate models as sensors are removed, a point of over-instrumentation was established where an optimal number of sensors was identified.
Sensor configuration for model falsification was applied to improve wind predictions around buildings in work carried out in Singapore (Papadopoulou et al., 2014, 2015). In this application, the forward greedy algorithm was observed to do better than the backward application. More importantly, a new hierarchical placement strategy was efficiently combined with the concept of joint entropy to ensure that mutual information provided by sensors was accounted for efficiently when determining optimal placement. Also, a multi-criteria strategy was proposed that included user preferences (Papadopoulou et al., 2016).
Another recent research project involved sensor configuration for performance assessment of pressurized fluid-distribution networks (Moser, 2015). The criterion of maximum joint entropy was combined with expected identifiability to result in good performance and low computation time. This provided further evidence of the performance of joint entropy.
A final study of sensor configuration was based on expected utility (Pasquier, 2015). Here, a multi-model prognosis is used to compare present values of future repair with monitoring costs. A backward greedy algorithm was employed to obtain a curve expressing expected utility in terms of monitoring cost. When this curve was observed to have a maximum value, an optimal monitoring configuration was identified.
Comparisons with Bayesian Model Updating
Model falsification has a clear advantage over Bayesian model updating since it is easier to explain to asset owners and managers. This is an important aspect since they may need to modify decisions when conditions change, and this requires a clear understanding of how data are interpreted. Black-box proposals, such as those including Bayesian inference, are not attractive in such situations. Also, there are more subtle advantages to model falsification when comparing traditional implementations of Bayesian inference. Details are provided below.
A first comparison of Bayesian model updating with model falsification on a simple cantilever beam was carried out by Goulet and Smith (2013). A common assumption of independence within the standard definition of uncertainties in Bayesian model updating resulted in biased posterior distributions of parameter values. Biased results were also observed by Simoen et al. (2013). On the other hand, error domain model falsification (EDMF) led to robust identification of parameter values when systematic errors were significant and without an exact knowledge of the dependencies between modeling errors.
While traditional implementations of Bayesian model updating are accurate and reliable when precise information of uncertainties is known, it is fragile in the presence of incomplete knowledge. EDMF sacrifices precision for accuracy. EDMF is most useful in situations where the magnitudes of systematic errors influence the values of correlations between measurement systems. Since by definition, systems contain elements that are correlated, and since systematic modeling errors have a multitude of sources in full-scale engineering contexts, EDMF appears to be a better practical choice than current implementations of Bayesian model updating for system identification.
A second study built on the first study by comparing Bayesian model updating with EDMF in terms of their ability to make predictions (Pasquier and Smith, 2015). Using a simply supported beam where once again, the true value is known, Bayesian model updating was compared with EDMF. In addition to the task of parameter-value identification, interpolation and extrapolation accuracy is studied for four model classes (parameterizations), one of which is the correct class. Three scenarios of modeling errors are studied where one scenario involved a parameterization of the combined modeling and measurement uncertainty.
Out of 30 combinations of model class, scenario, and task, Bayesian model updating failed to provide accurate results in 16 cases. EDMF succeeded in all 30 combinations. For the scenario that included a parameterization of the modeling uncertainty, while identification was incorrect, interpolation succeeded since the identification discrepancy in the inverse solution was compensated in the forward prediction. However, extrapolation failed. This is a common difficulty associated with curve-fitting techniques; when interpolation is only tested, results can be deceiving. Extrapolation tests are intrinsically more demanding.
Model-class selection was also compared. Using a metric called relative plausibility (Mackay, 2003), Bayesian inference was performed at the model-class level. It was found that this approach may not be able to uncover wrong model classes and bad modeling-error estimations in situations when EDMF rejected the model class through falsification of all model instances. Therefore, use of Bayesian inference at the model-class level may result in biased predictions due to an incorrect selection of the model class.
In spite of a high number of publications in well-known journals, few proposals of Bayesian updating have been verified on full-scale structures. While several studies have used full-scale structures to illustrate the use of Bayesian updating, none known to the author have used a model that has been identified by Bayesian updating to predict, e.g., measurements at locations that were not used for structural identification.
Case Studies
Full-scale case studies are essential for testing data interpretation methods for asset management since it is only at this scale that all uncertainties are present at realistic magnitudes. Table 1 contains descriptions of fourteen full-scale case studies that were used between 1998 and 2015 to evaluate, test, and improve the data interpretation methodologies that are described in the preceding sections.
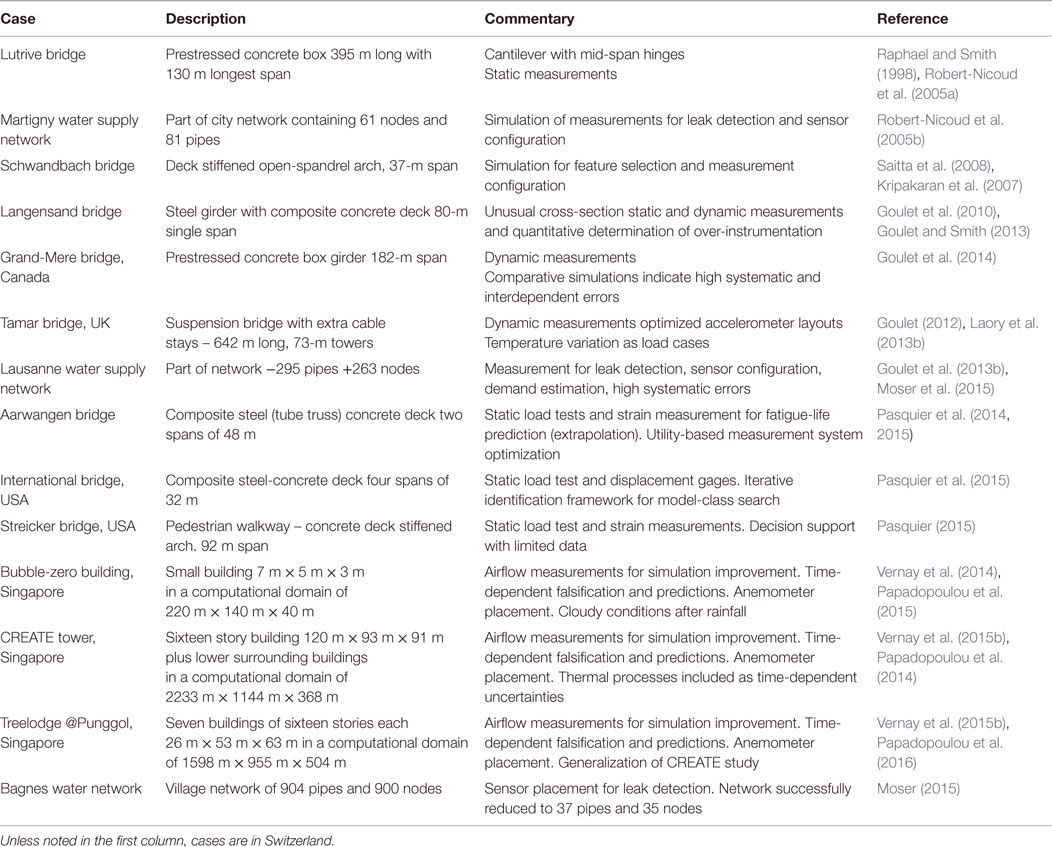
Table 1. Fourteen full-scale case studies that were used to evaluate test and improve multiple-model structural identification and later, probabilistic model falsification.
In addition to these case studies, three laboratory beams and two electrical analogies of water supply networks have been used to study and evaluate methodologies under situations of reduced uncertainty. For example, results provide useful optimistic bounds on the performance of sensor configurations.
Although the primary goal of these case studies was to evaluate and test the model falsification methodology, some of these studies have revealed significant reserve capacity that is helping asset managers improve decision-making. For example, the Langesand bridge has 30% reserve capacity with respect to its critical limit state of deflection. If loading on that bridge increases, reinforcement (if needed) will be cheaper thanks to measurement and good data interpretation. Another example is the Aarwangen bridge where the fatigue life of critical joints has been doubled following data interpretation of measurements. Further work on reserve-capacity estimation is underway using case studies in several countries, particularly in Singapore.
Conclusion
When sensor data are interpreted appropriately, asset management for the built environment becomes more quantitative and more efficiently focused on performance-based decision-making than current practice. Population-based approaches, such as EDMF, are able to accommodate explicit representation of realistic modeling and measurement uncertainties for reliable prognosis of scenarios that are typically considered as infrastructure ages. Since previously unknown reserve capacity can be revealed, significant spending reductions, such as replacement avoidance, becomes possible. In the future, the contribution of sensing to sustainability in the built environment will increase as a greater number of aging structures are repaired, improved and extended rather than suffer the current practice of replacement.
Author Contributions
The author confirms being the sole contributor of this work and approved it for publication.
Conflict of Interest Statement
The author declares that the research was conducted in the absence of any commercial or financial relationships that could be construed as a potential conflict of interest.
Acknowledgments
Funding has been provided by the Swiss National Science Foundation (Project number 200020_155972), the Future Cities Laboratory at the Singapore-ETH Centre, which was established collaboratively between ETH Zurich and Singapore’s National Research Foundation (FI 370074016) under its Campus for Research Excellence and Technological Enterprise (CREATE), and finally, EPFL Middle East. The author is grateful to the following PhDs students and researchers who, for nearly 20 years, contributed to the results presented in this paper: Yvan Robert-Nicoud, Sandro Saitta, Suraj Ravindran, James-Alexandre Goulet, Romain Pasquier, Didier Vernay, Maria Papadopoulou, and Gaudenz Moser. During this time, valuable postdoctoral support was provided by Benny Raphael, Prakash Kripakaran, Clotaire Michel, and Stephanie German Paal. As an Assistant Professor at NUS Singapore and later as an Associate Professor at IIT Madras, Benny Raphael provided input as a Co-Supervisor for Sandro Saitta, Didier Vernay, and Maria Papdopoulou. Also James Goulet, as a postdoc at UC Berkeley and later as an Assistant Professor at the Ecole Polytechnique de Montreal provided support to Romain Pasquier. The papers that are cited in this paper contain many details that could not be included in this paper.
Footnotes
References
Beck, J. L., and Katafygiotis, L. S. (1998). Updating models and their uncertainties: Bayesian statistical framework. J. Eng. Mech. 124, 455–461. doi:10.1061/(ASCE)0733-9399(1998)124:4(455)
Beven, K. J. (2002). Towards a coherent philosophy for modelling the environment. Proc. Math. Phys. Eng. Sci. 458, 1–20. doi:10.1098/rspa.2002.0986
Boller, C., Chang, F. K., and Fujino, Y. (eds) (2009). Encyclopedia of Structural Health Monitoring. Oxford: Wiley.
Çatbas, F. N., Kijewski-Correa, T., and Aktan, A. E. (eds) (2013a). Structural Identification of Constructed Systems. Reston, VA: American Society of Civil Engineers, 248.
Catbas, N., Gokce, H. B., and Frangopol, D. M. (2013b). Predictive analysis by incorporating uncertainty through a family of models calibrated with structural health-monitoring data. J. Eng. Mech. 139, 712–723. doi:10.1061/(ASCE)EM.1943-7889.0000342
Efron, B. (2013). ‘Bayes’ theorem in the 21st century. Science 340, 117–118. doi:10.1126/science.1236536
Falkenhainer, B., and Forbus, K. D. (1991). Compositional modeling: finding the right model for the job. Artif. Intell. 51, 95–143. doi:10.1016/0004-3702(91)90109-W
Gokce, H. B., Catbas, F. N., Gul, M., and Frangopol, D. M. (2013). Structural identification for performance prediction considering uncertainties: case study of a movable bridge. J. Struct. Eng. 139, 1703–1715. doi:10.1061/(ASCE)ST.1943-541X.0000601
Goulet, J. A. (2012). Probabilistic Model Falsification for Infrastructure Diagnosis. EPFL Thesis No 5417. Lausanne: Swiss Federal Institute of Technology (EPFL).
Goulet, J. A., Kripakaran, P., and Smith, I. F. C. (2010). Multimodel structural performance monitoring. J. Struct. Eng. 10, 1309–1318. doi:10.1061/(ASCE)ST.1943-541X.0000232
Goulet, J.-A., Michel, C., and Smith, I. F. C. (2013a). Hybrid probabilities and error-domain structural identification using ambient vibration monitoring. Mech. Syst. Signal Process. 37, 199–212. doi:10.1016/j.ymssp.2012.05.017
Goulet, J.-A., Coutu, S., and Smith, I. F. C. (2013b). Model falsification and sensor placement for leak detection in pressurized pipe networks. Adv. Eng. Inform. 27, 261–269. doi:10.1016/j.aei.2013.01.001
Goulet, J.-A., and Smith, I. F. C. (2013). Structural identification with systematic errors and unknown uncertainty dependencies. Comput. Struct. 128, 251–258. doi:10.1016/j.compstruc.2013.07.009
Goulet, J.-A., Texier, M., Michel, C., Smith, I. F. C., and Chouinard, L. (2014). Quantifying the effects of modeling simplifications for structural identification of bridges. J. Bridge Eng. 19, 59–71. doi:10.1061/(ASCE)BE.1943-5592.0000510
Kripakaran, P., Saitta, S., Ravindran, S., and Smith, I. F. C. (2007). “Optimal sensor placement for damage detection: role of global search,” in 1st International Workshop on Decision Support in Structural Health Monitoring, Proceedings of the 18th International Conference on Database and Expert System Applications (DEXA) (Regensburg: Lecture Notes in Computer Science 4653, Springer), 302–306.
Laory, I., Trinh, T. N., Posenato, D., and Smith, I. F. C. (2013a). Combined model-free data-interpretation methodologies for damage detection during continuous monitoring of structures. J. Comput. Civ. Eng. 27, 657–666. doi:10.1061/(ASCE)CP.1943-5487.0000289
Laory, I., Westgate, R. J., Brownjohn, J. M. W., and Smith, I. F. C. (2013b). “Temperature variations as loads cases for structural identification,” in Proceedings of 6th International Conference on Structural Health Monitoring of Intelligent Infrastructure (SHMII) (Hong-Kong).
Mackay, D. (2003). Information Theory, Inference and Learning Algorithms. Cambridge: Cambridge University Press.
Moser, G. (2015). Performance Assessment of Pressurized Fluid-Distribution Networks. EPFL Thesis No.6858. Lausanne: Swiss Federal Institute of Technology (EPFL).
Moser, G., Paal, S. G., and Smith, I. F. C. (2015). Performance comparison of reduced models for leak detection in water distribution networks. Adv. Eng. Inform. 29, 714–726. doi:10.1016/j.aei.2015.07.003
Papadopoulou, M., Raphael, B., Smith, I. F. C., and Sekhar, C. (2014). Hierarchical sensor placement using joint entropy and the effect of modeling error. Entropy 16, 5078–5101. doi:10.3390/e16095078
Papadopoulou, M., Raphael, B., Smith, I. F. C., and Sekhar, C. (2016). Optimal sensor placement for time-dependent systems: application to wind studies around buildings. J. Comput. Civ. Eng. 30. doi:10.1061/(ASCE)CP.1943-5487.0000497
Papadopoulou, M., Raphael, B., Smith, I. F. C., and Sekhar, C. (2016). Evaluating predictive performance of sensor configurations in wind studies around buildings. Adv. Eng. Inform. 30, 127–142. doi:10.1016/j.aei.2016.02.004
Pasquier, R. (2015). Performance Assessment and Prognosis for Civil Infrastructure Based on Model Falsification Reasoning. EPFL Thesis No 6756. Lausanne: Swiss Federal Institute of Technology (EPFL).
Pasquier, R., D’Angelo, L., Goulet, J.-A., Acevedo, C., Nussbaumer, A., and Smith, I. F. C. (2016). Measurement, data interpretation and uncertainty propagation for fatigue assessments of structures. J. Bridge Eng. doi:10.1061/(ASCE)BE.1943-5592.0000861
Pasquier, R., Goulet, J., Acevedo, C., and Smith, I. F. C. (2014). Improving fatigue evaluations of structures using in-service behavior measurement data. J. Bridge Eng. 19, 04014045. doi:10.1061/(ASCE)BE.1943-5592.0000619
Pasquier, R., and Smith, I. F. C. (2015). Robust system identification and model predictions in the presence of systematic uncertainty. Adv. Eng. Inform. 29, 1096–1109. doi:10.1016/j.aei.2015.07.007
Pasquier, R., and Smith, I. F. C. (2016). Iterative structural identification framework for evaluation of existing structures. Eng. Struct. 106, 179–194. doi:10.1016/j.engstruct.2015.09.039
Posenato, D., Kripakaran, P., Inaudi, D., and Smith, I. F. C. (2010). Methodologies for model-free data interpretation of civil engineering structures. Comput. Struct. 88, 467–482. doi:10.1016/j.compstruc.2010.01.001
Raphael, B., and Smith, I. (1998). “Finding the right model for bridge diagnosis,” in Artificial Intelligence in Structural Engineering, ed. I. Smith (Heidelberg: Springer), 308–319. LNAI.
Raphael, B., and Smith, I. F. C. (2013). Engineering Informatics: Fundamentals of Computer-Aided Engineering, 2nd Edn. (Oxford: John Wiley & Sons), 333.
Ravindran, S., Kripakaran, P., and Smith, I. F. C. (2007). “Evaluating reliability of multiple-model system identification,” in Bringing ITC Knowledge to Work, ed. D. Rebolj (Maribor: CIB), 643–652.
Robert-Nicoud, Y., Raphael, B., and Smith, I. F. C. (2005a). System identification through model composition and stochastic search. J. Comput. Civ. Eng. 19, 239–247. doi:10.1061/(ASCE)0887-3801(2005)19:3(239)
Robert-Nicoud, Y., Raphael, B., and Smith, I. F. C. (2005b). Configuration of measurement systems using Shannon’s entropy function. Comput. Struct. 83, 599–612. doi:10.1016/j.compstruc.2004.11.007
Saitta, S., Kripakaran, P., Raphael, B., and Smith, I. F. C. (2008). Improving system identification using clustering. J. Comput. Civ. Eng. 22, 292–302. doi:10.1061/(ASCE)0887-3801(2008)22:5(292)
Saitta, S., Kripakaran, P., Raphael, B., and Smith, I. F. C. (2010). Feature selection using stochastic search: an application to system identification. J. Comput. Civ. Eng. 24, 3–10. doi:10.1061/(ASCE)CP.1943-5487.0000003
Sidak, Z. (1967). Rectangular confidence regions for the means of multivariate normal distributions. J. Am. Stat. Assoc. 62, 626–633. doi:10.2307/2283989
Simoen, E., Papadimitriou, C., and Lombaert, G. (2013). On prediction error correlation in Bayesian model updating. J. Sound Vib. 332, 4136–4152. doi:10.1016/j.jsv.2013.03.019
Sweeney, R. A. P. (1990). “Update on fatigue issues at Canadian National Railways,” in IABSE Workshop Lausanne (Zurich: International Association for Bridge and Structural Engineering), 111–116.
Tarantola, A. (2005). Inverse Problem Theory and Methods for Model Parameter Estimation. Philadelphia, PA: SIAM.
Tarantola, A. (2006). Popper, Bayes and the inverse problem. Nat. Phys. 2, 492–494. doi:10.1038/nphys375
Vernay, D. G., Raphael, B., and Smith, I. F. C. (2014). Augmenting simulations of airflow around buildings using field measurements. Adv. Eng. Inform. 28, 412–424. doi:10.1016/j.aei.2014.06.003
Vernay, D. G., Raphael, B., and Smith, I. F. C. (2015a). A model-based data-interpretation framework for improving wind predictions around buildings. J. Wind Eng. Indust. Aerodyn. 145, 219–228. doi:10.1016/j.jweia.2015.06.016
Vernay, D. G., Raphael, B., and Smith, I. F. C. (2015b). Improving simulation predictions of wind around buildings using measurements through system identification techniques. Build. Environ. 94(2), 620–631. doi:10.1016/j.buildenv.2015.10.018
Keywords: asset management, modeling approximations, Bayesian models, model-falsification, sensor data interpretation
Citation: Smith IFC (2016) Studies of Sensor Data Interpretation for Asset Management of the Built Environment. Front. Built Environ. 2:8. doi: 10.3389/fbuil.2016.00008
Received: 26 January 2016; Accepted: 10 March 2016;
Published: 24 March 2016
Edited by:
Fikret Necati Catbas, University of Central Florida, USAReviewed by:
Nathaniel Dubbs, Intelligent Infrastructure Systems, USADevin K. Harris, University of Virginia, USA
Copyright: © 2016 Smith. This is an open-access article distributed under the terms of the Creative Commons Attribution License (CC BY). The use, distribution or reproduction in other forums is permitted, provided the original author(s) or licensor are credited and that the original publication in this journal is cited, in accordance with accepted academic practice. No use, distribution or reproduction is permitted which does not comply with these terms.
*Correspondence: Ian F. C. Smith, aWFuLnNtaXRoQGVwZmwuY2g=