 Zhenbang Feng
 Hardhik Mohanty
 Bhaskar Krishnamachari
95% of researchers rate our articles as excellent or good
Learn more about the work of our research integrity team to safeguard the quality of each article we publish.
Find out more
ORIGINAL RESEARCH article
Front. Blockchain , 23 July 2024
Sec. Blockchain Technologies
Volume 7 - 2024 | https://doi.org/10.3389/fbloc.2024.1392812
This article is part of the Research Topic DAO, Governance and Fairness View all 3 articles
In decentralized finance (DeFi), stablecoins like DAI are designed to offer a stable value amidst the fluctuating nature of cryptocurrencies. We examine the class of crypto-backed stable derivatives, focusing on mechanisms for price stabilization and exemplified by the well-known stablecoin DAI from MakerDAO. For simplicity, we consider a single-collateral setting. We introduce a belief parameter to the simulation model of DAI in a previous work (DAISIM), reflecting market sentiments about the value and stability of DAI, and show that it better matches the expected behavior when this parameter is set within a particular range of values. Our methods include comparing simulated data with real-world data, focusing on monthly correlations between ETH and DAI prices and scatter plots illustrating the relationship of their price trends over time. We also propose a simple mathematical model of DAI price to explain its stability and dependency on ETH price. Finally, we analyze possible risk factors associated with these stable derivatives to provide valuable insights for stakeholders in the DeFi ecosystem.
In the modern decentralized finance (DeFi) ecosystem, stablecoins have emerged to counter the volatility inherent to cryptocurrencies like Bitcoin or Ethereum Kołodziejczyk and Jarno (2020). Pegged to stable reserves such as fiat currencies, precious metals, or a diversified portfolio of assets, stablecoins try to maintain a consistent value. These stable derivatives are mechanisms for hedging risks, speculating on future price movements, and improving capital efficiency Ante et al. (2021). The stability of these tokens is maintained using a range of strategies, such as backing by fiat currencies, crypto-assets, or the use of algorithmic techniques that drop the need for conventional asset collateral. Such innovations in stabilization techniques highlight the versatility and adaptability of stablecoins in the digital age, reflecting a significant step forward in the quest for stability in the dynamic landscape of DeFi.
Among the plethora of stablecoins, DAI from MakerDAO stands out as a flagship stable derivative designed to maintain a steady value relative to $1 (USD). Initially released as a single-collateral derivative known as SAI, it has evolved into a more sophisticated multi-collateral format to enhance stability and resilience. Expanding upon this secure foundation, the transition from SAI to DAI brought about the capacity to accept multiple types of cryptocurrency as collateral, not just Ethereum (ETH). This diversification of backing assets significantly enhances the stability of DAI. The MakerDAO protocol allows users to mint SAI by creating collateralized debt positions (CDPs), which are essential components of the system Team (2020). In these smart contract-driven constructs, users must deposit ETH as collateral, over-collateralizing to accommodate for volatility in order to produce SAI and maintain its peg to $1.
Once minted, DAI serves as a versatile tool, functioning as a medium of exchange, a store of value, and a unit of account. The protocol also provides users an opportunity to earn interest on their DAI holdings through the DAI Savings Rate. DAI’s transparent and decentralized governance exercised by MKR token holders ensures that it remains stable. MKR token holders cast votes on vital protocol decisions, such as which assets qualify as collateral and the risk parameters for these assets. Furthermore, the transparent recording of every transaction, voting on the blockchain, and DAI’s adoption in over 400 different apps and services spanning wallets, DeFi platforms, and games reinforce its position as a reliable and integral component of the modern cryptocurrency landscape.
Research on stablecoins is still emerging, with a few key studies paving the way for our investigation. Lyons and Viswanath-Natraj (2023) provided a foundational understanding of the functional efficiency of stablecoins by scrutinizing the mechanisms through which they maintain their peg in the digital economy. Building on this, Mita et al. (2019) categorized the stablecoins based on the nature of their collateral and analyzed them through the lens of traditional economic models such as Hayek money and Tobin tax. Furthermore, Klages-Mundt et al. (2020) studied noncustodial stablecoins, revealing how liquidation protocols and investor behavior shape their stability, particularly in tumultuous market conditions. Complementing these theoretical perspectives, Gudgeon et al. (2020) critically assessed the security of governance in platforms like MakerDAO, a key aspect of stablecoin infrastructure. On a more practical note, Kothari and Gu (2018) utilized simulations to offer insight into the demand dynamics for asset-backed stablecoins amidst external price shocks, a crucial factor for understanding market resilience. Finally, Clark et al. (2020) provided a broad survey that contextualizes the stablecoin landscape, setting the context for more detailed analysis. Drawing from these insights, our work aims to add to the understanding of DAI within DeFi, especially how it maintains its value in various economic conditions.
On the contrasting end of the DeFi spectrum lie memecoins, which primarily rely on the dynamism of community enthusiasm and cultural narratives rather than asset collateralization. Unlike stablecoins that derive their stability from tangible reserves or algorithmic methods, memecoins like Dogecoin and Shiba Inu thrive on collective belief Vasishth et al. (2023). The value of memecoins is largely driven by speculative sentiment, with their price movements heavily influenced by community activities like social media, community engagement, and celebrity endorsements rather than fundamental economic indicators Lansiaux et al. (2022). This characteristic highlights the power of collective belief and shared narratives to create tangible economic impacts, which also plays a role in the valuation of more structured crypto assets like DAI as shown in our work.
This paper sets out to enhance the simulation models for DAI stablecoin, particularly focusing on the associated risk factors and the efficacy of its price stabilization mechanisms. Utilizing empirical data and employing a variety of modeling methods, we plan to study the complex factors that influence the value of the DAI peg. Building on previous work, DAISIM Bhat et al. (2021), we consider the impact of beliefs and narratives, which appear to play a significant role in DAI’s valuation alongside the more technical aspects of its protocol. Our analysis aims to shed light on the nuanced interaction between market behavior and the design of the protocol that together maintains DAI’s stability. In particular, our contributions can be listed as follows.
The remainder of this paper is organized as follows: Section 2 offers a detailed analysis of the DAI mechanism, its structure, user interaction, and the role of price oracles. Section 3 discusses the mechanisms for price stabilization of DAI. Section 4 introduces DAISIM and our revised objective function. Section 5 presents the simplified theoretical foundation of this model. Section 6 explores the relationship between collateral price and derivative price using empirical data and simulations. Next, Section 7 examines various risk factors in stable derivatives. The paper concludes with Section 8 summarizing our findings and insights.
Our particular interest lies in the mechanisms that enable these synthetic assets to maintain track of their underlying assets under market pressures and volatility. MakerDAO’s DAI stands out as an important example of such a synthetic derivative, a stablecoin designed to peg US Dollar. We find it instructive to explore the inner workings of DAI’s stability protocol, which relies mostly on decentralized mechanisms without centralized authority. While DAI has transitioned to a multi-collateral DAI starting in November 2019, our analysis below will look into the single collateral form, known as SAI, which operated from 18 December 2017, until the protocol’s transition to the multi-collateral system. SAI reflects the core mechanism of DAI and provides ease of exposition and analysis.
DAI functions by allowing users to lock up collateral (e.g., Ethereum) in a smart contract. The action of doing this is called opening a Collateralized Debt Position (CDP). The process of collateral lock-up and DAI generation was designed to ensure over-collateralization, typically requiring a collateral value exceeding the value of DAI by at least 150%. This requirement ensures the creation of a buffer to absorb market volatility. The specific over-collateralization ratios are subject to change based on governance decisions and market dynamics throughout SAI’s tenure.
Users typically interact with DAI in the following ways. As illustrated in Figure 1, users generate a CDP and obtain DAI by locking up their collateral assets. This DAI can then be used to transact, invest, or leverage in other decentralized financial applications. When users wish to retrieve their collateral, they repay the DAI they generated plus a stability fee to unlock their original assets. In addition to direct interaction with CDPs, users can buy or sell DAI on various exchange platforms just like any other cryptocurrency.
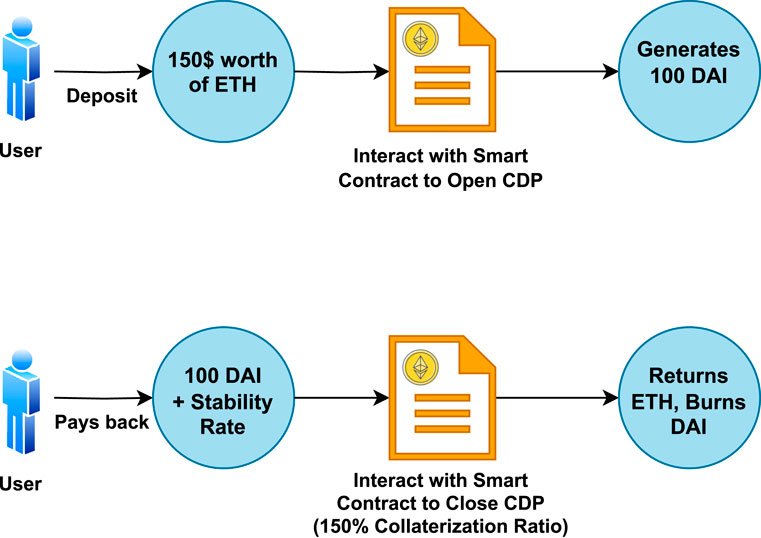
Figure 1. Illustrations of opening and closing CDP.
Oracles serve as bridges that bring real-world information, in this case market data, into the blockchain environment. In the context of the DAI stablecoin mechanism, oracles play an indispensable role, because DAI’s stability and over-collateralization rely on the accurate and timely valuation of collateral assets. Oracles provide this service by feeding external data, in this case, the current market prices of collateral assets, into the blockchain. In DAI, this data is used to verify whether the value of the collateral in a CDP falls below a certain threshold, and if so, triggers a liquidation event to ensure DAI remains adequately backed.
While the emphasis often rests on creation and utilization of DAI, an equally important mechanism is how the system handles potential under-collateralization. If the value of the collateral in a CDP drops below a predefined threshold, the system automatically liquidates a portion of the collateral to ensure DAI remains over-collateralized. This liquidation process involves auctioning off the collateral for DAI. Keepers, independent actors in the ecosystem, play a significant role in these auctions, bidding on and buying the liquidated collateral. This automatic and decentralized liquidation process is essential to maintain trust in DAI’s stability, even during significant market downturns.
Synthetic derivatives like Single-Collateral DAI (SAI) aim to mirror a particular asset’s value. In SAI’s case, it seeks to peg its value to the US Dollar. The question then arises: How does it ensure that its value remains stable at 1 USD? In reality, several mechanisms work together to ensure this stability.
Emergency shutdown is a mechanism designed for extreme circumstances. This process can be triggered during events like security breaches or huge market volatility. It allows DAI holders to directly redeem its value for $1 of collateral at the point in time when the Emergency Shutdown is initiated, essentially enforcing the 1:1 USD soft peg.
Another significant mechanism to ensure price stability is the DAI Savings Rate. When market dynamics push the DAI price away from the target, this savings rate is adjusted. If DAI’s market price goes above 1 USD, the savings rate decreases, reducing demand and pushing the price towards 1 USD. Conversely, if DAI’s price falls below 1 USD, the savings rate rises, increasing demand and nudging the price upwards. In the Single-Collateral DAI, there isn’t a DAI Savings Rate; instead, stability Fees on CDPs are adjusted directly to balance the demand and supply.
Keepers play an invaluable role in maintaining DAI’s stability. These are typically automated agents incentivized by profit. They actively participate in Debt and Collateral Auctions during CDP liquidations. More crucially, they trade DAI around its target price, selling when the price is high and buying when it’s low, banking on the long-term convergence towards the target price, thereby helping in maintaining the price stability. Individuals or entities are often motivated to operate keepers due to the potential for profit. This profit expectation relies on their belief that the price of DAI will remain stable around 1 USD.
An often underestimated element in the mechanism of stability is the narrative or the shared belief of its participants. While tangible mechanisms like target prices, keepers, and oracles play vital roles, the intangible narrative equally underpins the stability of such systems.
For example, the shared belief in DAI (SAI) is that it will stay aligned with the US dollar. This belief is propagated and reinforced through consistent communication, historical performance, community trust, and governance transparency. When participants uniformly believe in the 1:1 pegging, they act in ways that naturally enforce this peg further. For instance, if the price of SAI drifts slightly above 1 USD, the narrative would drive participants who are believing to sell, thereby pushing the price back to the peg. Conversely, if SAI dips below 1 USD, the narrative would deem it undervalued, triggering buys and bringing the price back to one dollar.
This shared narrative isn’t solely built on blind faith. When the system consistently demonstrates its ability to maintain the peg through various market conditions, it reinforces the narrative. In the following sections, we will delve deeper into the role of this narrative by simulating the effects of shared belief.
Let’s consider the DAI to be solely influenced by “belief” (when
In essence, any given price could theoretically serve as a Nash Equilibrium. However, the mechanism of over-collateralization, Emergency Shutdown, and narrative set by MakerDAO suggest that the Schelling point is anchored at 1 USD.
DAISIM Bhat et al. (2021) presented a detailed computational simulation of the single-collateral DAI stablecoin, which was initiated by the MakerDAO project in 2017. This study places a significant emphasis on modeling the behavior of cryptocurrency investors, who are characterized by a range of risk tolerances and are considered rational in their portfolio optimization strategies. A key feature of this simulator is its incorporation of automated mechanisms for both order matching and updating prices, which are critical for determining the market price of DAI. The primary aim of this research is to investigate how the price of single-collateral DAI and the allocation of investment portfolios vary among a group of investors. This variation is analyzed in the context of exogenous parameters such as the price of ETH, as well as several internal system parameters, including the stability rate and transaction fees.
In terms of the simulation’s structure, the system parameters play a pivotal role in shaping its dynamics. These include the Stability Rate, represented as
The initial objective function proposed in DAISIM model centered around the asset optimization mechanism. It used a vector
However, the simulated price of the DAI driven by this objective function displayed significant deviation from the desired 1 USD peg. Such consistent deviations suggest that external factors, potentially rooted in market beliefs about DAI’s stability were absent from the model’s considerations. Therefore, we introduce “belief factor”
The term
Here we present a simple theoretical model of DAI price. This model is presented primarily as an explanatory tool—we do not claim that this is the “correct” model of reality. However, this model allows us to explain two phenomena: 1) how belief influences the price being close to 1, reflected in a high demand for DAI at price below that value and a low demand beyond that price, and 2) how dependence of supply and demand for DAI on the price of ETH might impact the relationship between ETH price and the valuation of DAI. This model could potentially serve as a baseline for further investigation and development by the research community.
First, we model the supply of DAI as linearly increasing in its price
Where
Likewise, we can model the demand
To determine the price, we equate these two as follows:
This yields the following equation for the price of DAI as a function of
We can see that as
We will see in the following section that empirically there is no evidence for a strong dependence of
Figure 2 demonstrates the closing prices of both ETH and DAI over the 2-year period from 2018 to 2020. Ethereum (ETH) exhibited significant volatility, with its price ranging from approximately $84 to $1,456. The average closing price for ETH during this period was about $332.52. On the other hand, DAI demonstrated its characteristic stability. As a stablecoin, its price hovered around the $1 peg, with minor fluctuations. The average closing price for DAI was approximately $1.0007 as shown in Table 1. To further understand the relationship between ETH and DAI, we calculated the correlation coefficient between their closing prices, which came out as 0.1336. The calculated correlation coefficient of 0.1336 suggests a weak positive linear relationship between the closing prices of ETH and DAI.
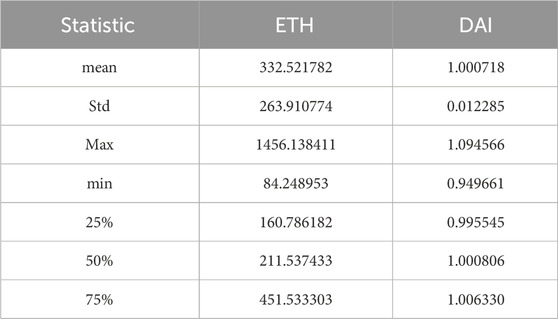
Table 1. Statistical values for DAI and ETH closing price.
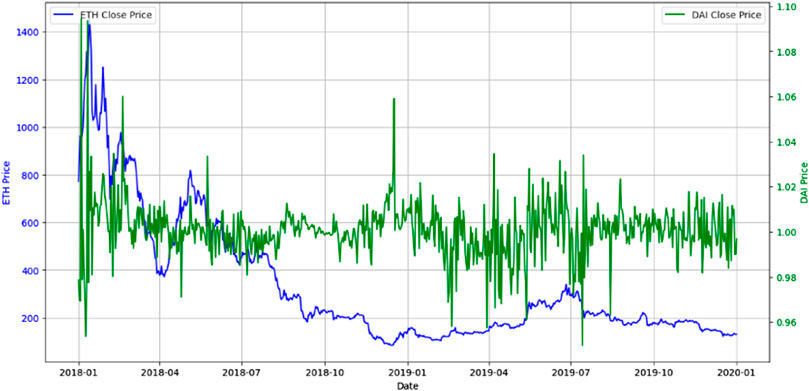
Figure 2. Real data of DAI price vs. ETH price.
Figure 3 illustrates the scatter plot of DAI vs. ETH closing prices. We observe there’s a high density of points around the DAI price of $1, confirming its stable nature. This dense cluster is spread across various ETH prices, which is consistent with the observation that DAI maintains its peg to around $1 regardless of ETH’s price movements. The scatter plot reaffirms the distinct characteristics of the two assets. DAI, being a stablecoin, predominantly hovers around the $1 mark, irrespective of the volatility and price changes exhibited by ETH. This scatter plot also aligns with the previously computed weak correlation coefficient, indicating that the movements in DAI prices have a weak linear relationship with ETH’s price movements.
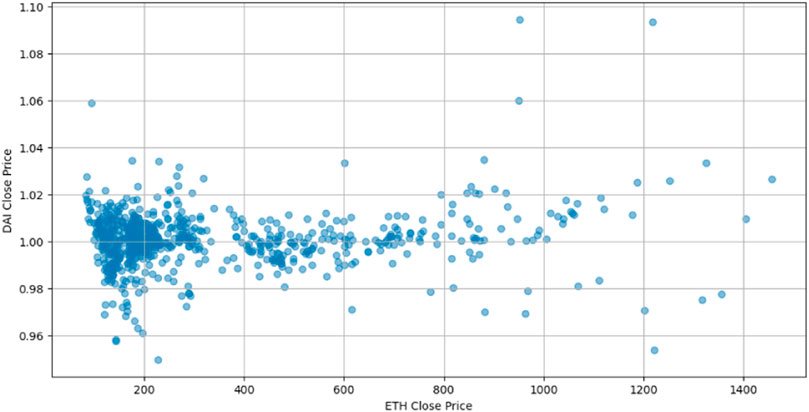
Figure 3. Scatter Plot of DAI price vs. ETH price.
Figures 4, 5, demonstrates the predicted value of the price of DAI through simulation models. The DAISIM simulation model initially outputs DAI prices ranging from approximately $3.34 to $4.17. This shows that the predicted DAI price significantly deviates from its pegged value of $1. This variation is attributed to the model’s lack of consideration for market beliefs and narratives. However, with the integration of a belief parameter based on the hypothesis of DAI’s peg to $1, there is a substantial improvement in price stability. The modified model generates DAI prices that fluctuate closely around the $1 mark with minimal deviations.
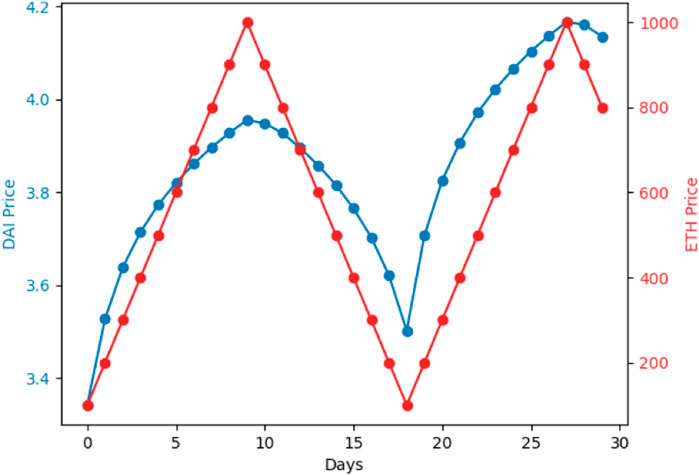
Figure 4. DAI price vs. ETH price (b = 0).
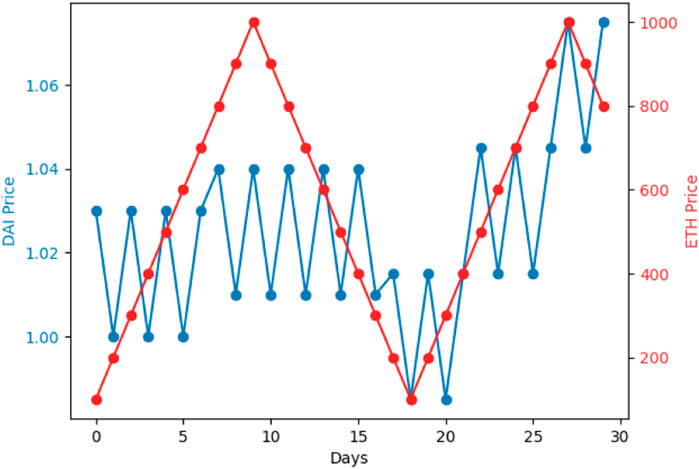
Figure 5. DAI price VS ETH price (b = 10).
This improvement is also evidenced by examining the correlation coefficients between DAI and ETH prices in both models as depicted in Figures 6, 7. Initially, the correlation coefficient stands at 0.86, indicating a strong positive correlation. This suggests that DAI prices are significantly influenced by ETH’s price movements, contrary to the observed behavior of DAI in the real world. However, after the introduction of the belief parameter, the correlation coefficient decreases to 0.54. The lower correlation more accurately mirrors the real-world expectation that DAI’s price remains largely independent of ETH’s market fluctuations.
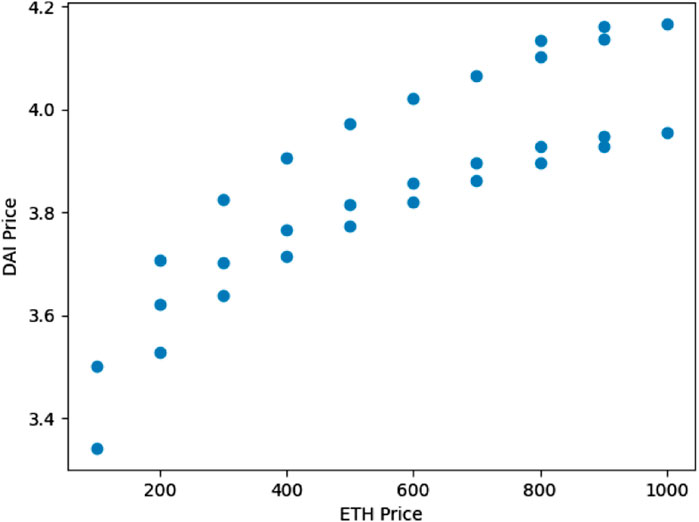
Figure 6. Scatterplot of DAI price vs. ETH price (b = 0).
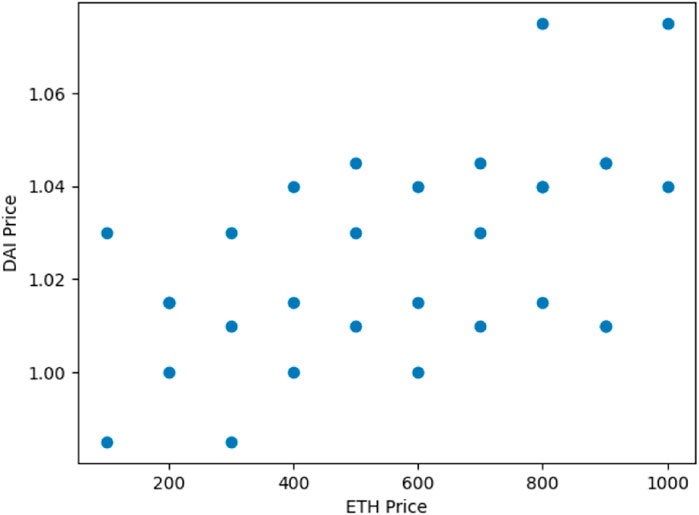
Figure 7. Scatterplot of DAI price vs. ETH price (b = 10).
Figure 8 shows box plots that illustrate the monthly correlations between ETH and DAI in 2018. The real-world box plot is compared with simulations based on various belief factors values ranging from 0.0 to 1.0. Simulations are run monthly for each of the belief factors with 100 investors and a fixed CDP rate of 0.01; transaction fees are ignored. From the box plot, we observe that the simulations with very low and very high belief factor values do not align well with the real data. Interestingly, the box plots for belief factors close to 0.7 produce a correlation distribution that closely resembles the real-world data. This indicates that a belief factor around 0.7 effectively balances the objective function, maintaining DAI’s price alignment with its peg while producing realistic correlations between ETH and DAI. Therefore, the simulations suggest that under this simulation settings, a belief factor close to 0.7 provides accurate representation of real-world behavior in terms of monthly correlations between ETH and DAI in 2018.
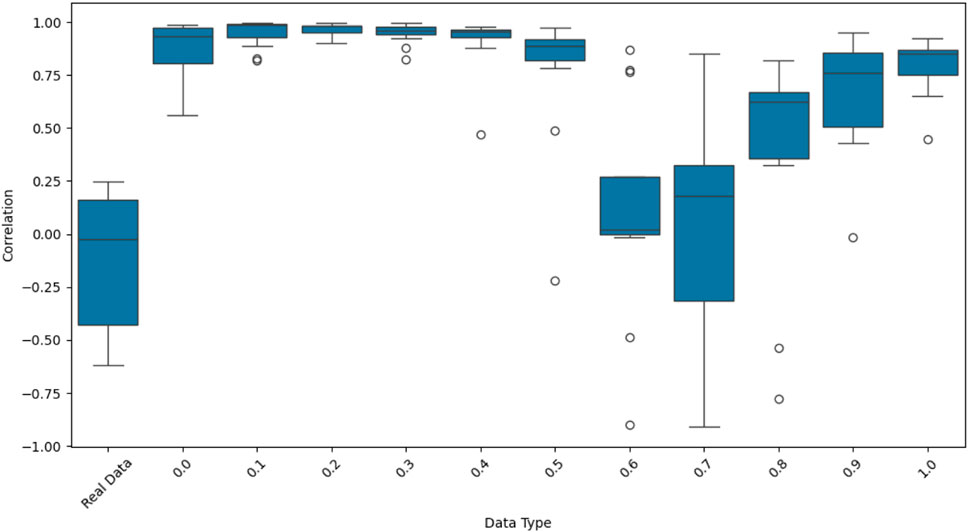
Figure 8. Comparison of monthly correlations for simulated vs real-world data.
Next to check similarity in price trends, Figures 9, 10, 11 present scatter plots comparing the relationship between ETH price and DAI price for real data (left column) and simulated data with a belief factor of 0.7 (right column) over three arbitrarily chosen months. The scatter plots for the real data demonstrate higher variance in DAI prices, reflecting the real-world volatility and variation in trader beliefs about DAI’s value. This greater variance could be due to the real-world dynamics of yield farming, speculative investments, and other extrinsic factors not captured by the simulation model. In contrast, the simulated data shows less variance in DAI prices, which can be attributed to the scale of the simulation (100 investors) and the fixed parameters, such as the CDP rate set at 0.01. In real-world scenarios, the number of investors is significantly larger, and the CDP rate is dynamic, contributing to the observed differences with the simulated environment. This comparison highlights that while the simulation with a belief factor of 0.7 captures the overall trend between ETH and DAI prices, it does not perfectly match the real-world variance, indicating areas for further refinement in the simulation model.
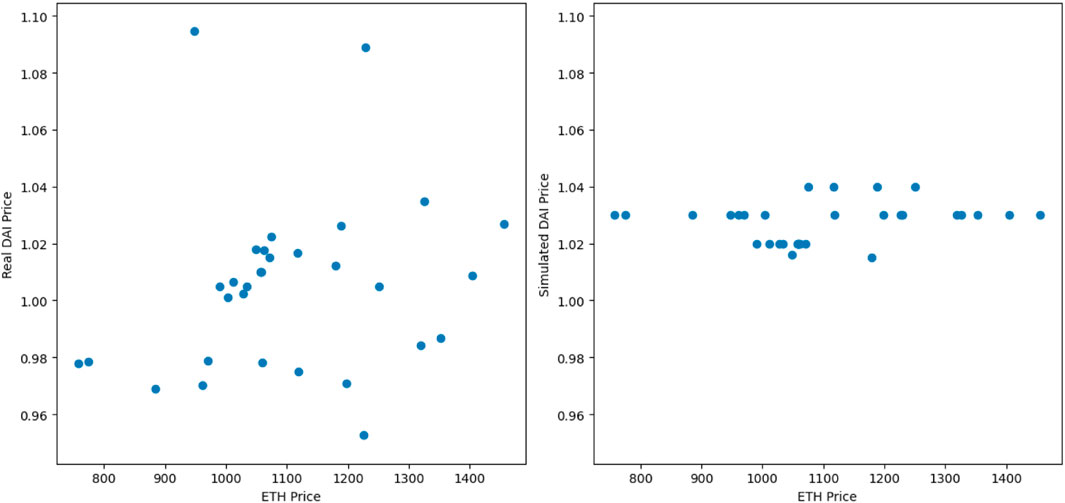
Figure 9. Real and Simulated DAI vs ETH Prices in January.
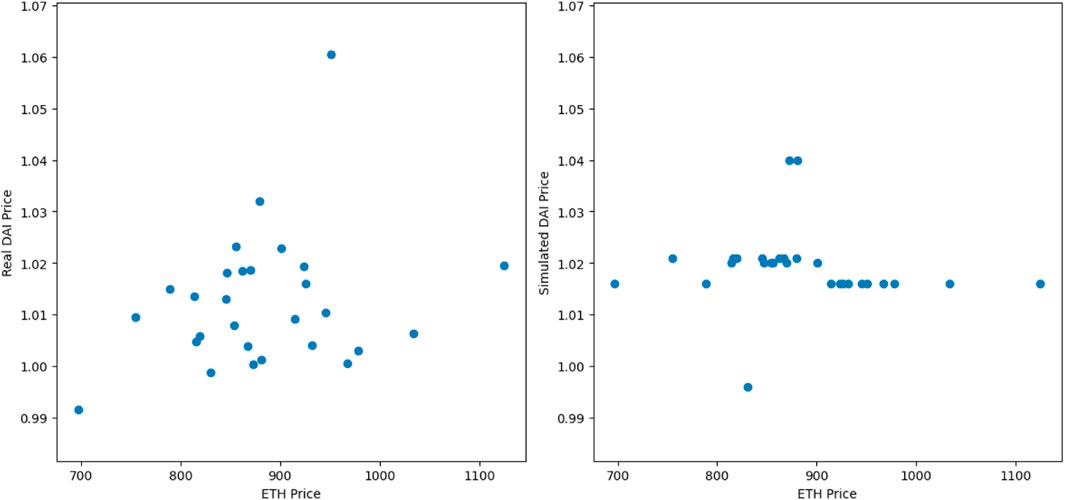
Figure 10. Real and Simulated DAI vs ETH Prices in February.

Figure 11. Real and Simulated DAI vs ETH Prices in March.
Stable derivatives represent stability against the volatility of cryptocurrencies in DeFi. Although these stablecoins are engineered to maintain peg with traditional currencies or commodities, they face various risk factors that can destabilize their value.
The stability and operation of decentralized applications or protocols largely depend on the foundation provided by the underlying blockchain. If the blockchain experiences issues such as poor performance, delayed transactions, or security breaches, this impacts all applications built on it. A practical example is the Mirror Protocol’s shutdown, which stemmed from Oracle issues on the Terra blockchain. Challenges faced by a blockchain can ripple through to DeFi protocols, diminishing user trust and reducing system stability.
Oracles play a critical role in connecting blockchain systems with real-world data. They are responsible for delivering precise price data, ensuring proper collateralization within the system. However, they are not exempt from risks. Events like pricing inaccuracies, unexpected system behaviors, or targeted attacks can result in oracles providing wrong data. This misinformation can set off unwarranted liquidations or other adverse system actions.
Smart contracts are core to DeFi protocol operations. Like other softwares, they are also prone to vulnerabilities. Threat actors continuously search for these vulnerabilities in the smart contract code to exploit. In the worst case, an attack on the infrastructure could result in a total loss of decentralized assets held as collateral.
Despite DeFi’s central tenet being decentralization, some aspects still rely on centralized systems, particularly in early stages. DeFi platforms sometimes lean on centralized systems or foundations for operations, management, and governance. Any malfunction or regulatory issues of these centralized parts can pose a considerable threat to the protocol. Issues could range from access barriers in specific countries, failure in front-end user interfaces, or legal complications for the overseeing foundation, all of which can affect the protocol’s seamless operation and expansion.
Considering single collateral DAI, the debt ceiling sets a maximum threshold for the amount of DAI that can be minted against a specified collateral, commonly ETH. Establishing this limit is a strategic management scheme to restrict the available supply of DAI in the DeFi market. However, the complex dynamics of the DeFi market can transform this into a potential risk factor for the stable derivative. When the amount of DAI generated against the single collateral reaches its debt ceiling, the system prohibits any further generation of DAI. As a result, users are compelled to acquire DAI exclusively from the open market. Such constraints can exert upward pressure on DAI’s price, pushing it beyond its intended $1 peg. This situation brings out the risk of a stable derivative’s price surpassing its designated peg.
We introduced a belief parameter in the modeling of the DAI stablecoin to effectively capture market sentiments regarding its valuation and stability. Moreover, we constructed a mathematical model that quantitatively depicts the stability mechanism of DAI in response to ETH price fluctuations. The updated simulation model demonstrated improved stability of DAI price around $1 by integrating the belief parameter. Correlation analysis showed a decrease in correlation between DAI and ETH prices from 0.86 to 0.54 after the adjustments made to the baseline model DAISIM. Additionally, we reviewed the sources of risks associated with stable derivatives, discussing the impact of factors such as oracle reliability, debt ceiling, and smart contract vulnerabilities on their stability and operation. The comparison of real and simulated data reveals that a belief factor around 0.7 best approximates the real-world monthly correlations between ETH and DAI, though the simulations exhibit less variance in DAI prices. This discrepancy suggests that the simulation model, while effective in capturing overall trends, may need adjustments in scale and parameters to better reflect the higher volatility and variability present in real-world data. Future work could explore the impact of parameters such as CDP rate and number of investors to better capture the complexity and volatility seen in real-world data. Furthermore, we plan to refine the model to reduce the correlation between DAI and ETH prices and expand the model to incorporate multi-collateral DAI in order to provide deeper insights into its stability and risk factors in a more diverse economic environment.
The original contributions presented in the study are included in the article/Supplementary Material, further inquiries can be directed to the corresponding author.
ZF: Conceptualization, Data curation, Formal Analysis, Methodology, Resources, Software, Validation, Visualization, Writing–original draft, Writing–review and editing. HM: Conceptualization, Data curation, Formal Analysis, Methodology, Resources, Software, Validation, Visualization, Writing–original draft, Writing–review and editing. BK: Conceptualization, Investigation, Project administration, Supervision, Writing–review and editing.
The author(s) declare that no financial support was received for the research, authorship, and/or publication of this article.
The authors declare that the research was conducted in the absence of any commercial or financial relationships that could be construed as a potential conflict of interest.
All claims expressed in this article are solely those of the authors and do not necessarily represent those of their affiliated organizations, or those of the publisher, the editors and the reviewers. Any product that may be evaluated in this article, or claim that may be made by its manufacturer, is not guaranteed or endorsed by the publisher.
ANRGUSC (2024). Daisim 2.0 [Software]. Available at: https://github.com/ANRGUSC/DAISIM.
Ante, L., Fiedler, I., and Strehle, E. (2021). The influence of stablecoin issuances on cryptocurrency markets. Finance Res. Lett. 41, 101867. doi:10.1016/j.frl.2020.101867
Bhat, S., Kahya, A. B., Krishnamachari, B., and Kumar, R. (2021). “Daisim: a computational simulator for the makerdao stablecoin,” in 4th international symposium on foundations and applications of blockchain 2021 (FAB 2021) (USA: Schloss Dagstuhl-Leibniz-Zentrum für Informatik).
Clark, J., Demirag, D., and Moosavi, S. (2020). Demystifying stablecoins: cryptography meets monetary policy. Queue 18, 39–60. doi:10.1145/3387945.3388781
Gudgeon, L., Perez, D., Harz, D., Livshits, B., and Gervais, A. (2020). “The decentralized financial crisis,” in 2020 crypto valley conference on blockchain technology (CVCBT), China, 11-12 June 2020 (IEEE), 1–15.
Klages-Mundt, A., Harz, D., Gudgeon, L., Liu, J.-Y., and Minca, A. (2020). “Stablecoins 2.0: economic foundations and risk-based models,” in Proceedings of the 2nd ACM Conference on Advances in Financial Technologies, Germany, October 21 - 23, 2020, 59–79.
Kothari, T., and Gu, W. C. (2018). Simulating stablecoin systems with latent market confidence index. Available at SSRN 3508036.
Lansiaux, E., Tchagaspanian, N., and Forget, J. (2022). Community impact on a cryptocurrency: twitter comparison example between dogecoin and litecoin. Front. Blockchain 5, 829865. doi:10.3389/fbloc.2022.829865
Lyons, R. K., and Viswanath-Natraj, G. (2023). What keeps stablecoins stable? J. Int. Money Finance 131, 102777. doi:10.1016/j.jimonfin.2022.102777
Mita, M., Ito, K., Ohsawa, S., and Tanaka, H. (2019). “What is stablecoin? a survey on price stabilization mechanisms for decentralized payment systems,” in 2019 8th international congress on advanced applied informatics (IIAI-AAI) (USA: IEEE), 60–66.
Team, M. (2020). The maker protocol: makerDAO’s multi-collateral dai (MCD) system: White paper, 1–25.
Keywords: stablecoins, DAI, MakerDAO, DEFI, stable derivatives, ethereum, DAO
Citation: Feng Z, Mohanty H and Krishnamachari B (2024) Modeling and analysis of crypto-backed over-collateralized stable derivatives in DeFi. Front. Blockchain 7:1392812. doi: 10.3389/fbloc.2024.1392812
Received: 28 February 2024; Accepted: 27 June 2024;
Published: 23 July 2024.
Edited by:
Qin Wang, Commonwealth Scientific and Industrial Research Organisation (CSIRO), AustraliaCopyright © 2024 Feng, Mohanty and Krishnamachari. This is an open-access article distributed under the terms of the Creative Commons Attribution License (CC BY). The use, distribution or reproduction in other forums is permitted, provided the original author(s) and the copyright owner(s) are credited and that the original publication in this journal is cited, in accordance with accepted academic practice. No use, distribution or reproduction is permitted which does not comply with these terms.
*Correspondence: Hardhik Mohanty, aG1vaGFudHlAdXNjLmVkdQ==
Disclaimer: All claims expressed in this article are solely those of the authors and do not necessarily represent those of their affiliated organizations, or those of the publisher, the editors and the reviewers. Any product that may be evaluated in this article or claim that may be made by its manufacturer is not guaranteed or endorsed by the publisher.
Research integrity at Frontiers
Learn more about the work of our research integrity team to safeguard the quality of each article we publish.