 Tanya Scott
 Les G. Underhill
94% of researchers rate our articles as excellent or good
Learn more about the work of our research integrity team to safeguard the quality of each article we publish.
Find out more
SYSTEMATIC REVIEW article
Front. Bird Sci., 24 April 2024
Sec. Science of Birding
Volume 3 - 2024 | https://doi.org/10.3389/fbirs.2024.1370918
Knowledge about the timing of moult and how it fits into the annual cycle, along with breeding and, in some cases migration, is an important component of understanding the life history of birds. In comparison with breeding and migration, there is a lack of knowledge about the moult of birds. Primary moult can be quantified using models such as the Underhill-Zucchini moult model. Studies that included estimates of primary moult parameters (duration, mean start date and standard deviation of mean start date) obtained using the Underhill-Zucchini moult model were compiled from the literature to generate a moult analysis database. These parameters provide information about the timing of moult, how it fits into the annual cycle and how synchronised moult is in the population. Relationships between the estimated moult parameters and a series of explanatory variables were explored. Critical gaps in our understanding of primary moult were revealed. The available data are taxonomically biased towards Charadriiformes and Passeriformes and there are substantial gaps in coverage across the phylogenetic tree. There are severe biases in the global distribution of moult studies across continents, with Africa having almost half of all applications of the moult model. Latitude emerged as an important explanatory variable but there are latitudinal gaps in the data, especially from the Tropic of Capricorn extending to 40°N and in the far northern and far southern hemispheres. Citizen scientists, both bird ringers and photographers, have a key role to play in helping to fill these data gaps. An emerging pattern in the available data is that the timing of primary moult is more synchronised in populations in far northern and far southern latitudes than in temperate or tropical zones, but more data in the far south is needed to confirm this. Timing of moult shows great variability in the tropics and sub-tropical regions of the southern hemisphere. In species that undertake an annual sequential moult, larger birds take longer to moult than smaller birds, but the allometric relationship is not tight. Migrants appear to be more synchronised in their moult than residents.
Newton (2009) highlighted the overall lack of knowledge of the primary moult of birds and the importance of this information in understanding their annual cycles. He pointed out that the quantitative study of moult “can be used to throw light on aspects of bird ecology that are otherwise hard to study.” He stated that these gaps in knowledge, filled by moult studies, would improve conservation recommendations for birds. Both explicitly, within the paper, and implicitly, by publishing this important paper in the journal Ringing & Migration, Newton (2009) recognised the key role of citizen scientists in the study of avian moult. In Newton’s (2009) thinking, the citizen scientists were bird ringers. Subsequently, a second category of citizen scientists has also made a contribution. These are photographers whose passion includes the challenge of taking photographs of open wings in such a way that moult status can be recorded in the same way as a bird ringer does with a bird in the hand (De Beer et al., 2000). The first quantitative study of primary moult using digital photographs as the data source was on the Black Skimmer Rynchops niger (Vieira et al., 2017); this has been followed up by a study of the moult of the African Oystercatcher Haematopus moquini (Bate et al., 2023).
Newton (2009) also highlighted the existence of custom-built models for the quantitative analysis of primary moult, referring in particular to the moult model of Underhill and Zucchini (1988). Other statistical approaches have been shown to introduce bias into the estimates of the parameters of moult (Underhill and Zucchini, 1988). An important milestone since Newton’s paper was the development, by Erni et al. (2013), of a universally available algorithm to implement the moult model in the R environment (R Core Team, 2019).
Remisiewicz (2011) and Dietz et al. (2015) recognised that moult analyses which used the Underhill-Zucchini moult model provided results which were comparable between species and that the sample size of primary moult studies of migrant waders had grown to a size that inter-species analyses were feasible. Remisiewicz (2011) showed how wing length, latitude of the moulting grounds and migration distance affect the timing and duration of primary moult of waders. Dietz et al. (2015) explored the effect of body mass and latitude on moult duration using data from studies on 27 wader populations of 11 different species. They found that larger and smaller waders had different latitudinal relationships with moult duration and that the moult duration for waders moulting in the northern hemisphere increased allometrically with body mass, whereas there was no correlation between moult duration and body mass for waders moulting in the southern hemisphere. Jackson and Underhill (2022) extended these investigations of moult strategies in waders by compiling data from 57 populations of 24 species. The variables explored were moult duration, timing of moult, body mass and moulting latitude. It was found that adult waders that moult at far northern latitudes (>30°N) undergo a consistently early, short moult; those that moult in the zone centred on the equator undergo a more variable moult in terms of timing and duration; and those moulting at more southern latitudes (>30°S) have a consistently late, long moult. In terms of the relationship between body mass and moult duration, smaller waders showed more variability in moult duration than larger waders (Jackson and Underhill, 2022).
Hedenström (2006), Rohwer et al. (2009) and Dietz et al. (2015) found an allometric relationship between body mass and moult duration. However, most of the species assessed by Hedenström (2006) and Rohwer et al. (2009) moult in the northern hemisphere and Dietz et al. (2015) only investigated moult in migrant waders breeding in the northern hemisphere. Dietz et al. (2015) realised that the moult differed between the hemispheres and suggested investigating whether moult duration differs between the northern and southern hemispheres in birds generally.
The original aim of this paper was to undertake a comprehensive review, on a global scale, of primary moult in populations of adult birds, both resident and migrant species, and both passerine and non-passerine species. However, preliminary analyses demonstrated that, in 2024, the available data had major shortcomings, so that the envisaged analyses were premature. The revised aims of the paper are thus to create a database of reliable Underhill-Zucchini moult parameter estimates and possible explanatory variables, such as moulting latitude, body mass and taxonomic classification, and to point out the deficiencies in the available information, which consists mainly of critical gaps in knowledge. The paper describes priorities for fieldwork and analysis, in order that key gaps are filled and a global review of primary moult can be undertaken. The focus in this paper is on the substantial majority of bird species for which primary moult is sequential over a single year. We exclude species such as ducks, which moult all their flight feathers simultaneously, and species such as many of the large raptors, which take several years to replace all their primaries.
We followed the precedent set by Remisiewicz (2011), Dietz et al. (2015) and Jackson and Underhill (2022) to restrict this database to analyses which had followed the method of Underhill and Zucchini (1988). The reason for doing so is because analyses using alternative statistical approaches have been demonstrated to show biases (Underhill and Zucchini, 1988).
All available literature was searched for studies of primary moult in birds that cited Erni et al. (2013) and/or Underhill and Zucchini (1988). Studies that included estimates of primary moult parameters obtained using the Underhill-Zucchini moult model (Underhill and Zucchini, 1988) were compiled to generate a moult analysis database. Some species have results for multiple populations at different study sites, which are sometimes reported in a single publication. We treated each population as a single study. Scientific and English common names of species are those used by Gill et al. (2022). To eliminate the potential for bias between adults and juveniles and free-living and captive birds, only results from studies of populations of adult free-living birds were used. The duration of moult, the start date of moult and the standard deviation of the start date were recorded where given. Mid-date of moult was calculated from the sum of the start date and half the duration. We used the mid-date of moult, rather than the starting date estimated by the Underhill-Zucchini moult model, because it can be more reliably estimated (Jackson and Underhill, 2022).
Jenni and Winkler (2020) generally defined “moult intensity” as the number of simultaneously growing primaries during moult. This number varies as moult progresses (Remisiewicz et al., 2009; Scott, 2023; Scott et al., 2023a, 2023b, 2023c) and this is therefore not an entirely satisfactory definition. However, Jenni and Winkler (2020, p. 114) also defined moult intensity as the “rate of feather mass production”, which is calculated as feather mass/duration. In other words, moult intensity is proportional to the reciprocal of duration, so that as duration increases the number of simultaneously moulting primaries decreases. Morrison et al. (2015) found a strong relationship between duration and number of simultaneously growing feathers of 15 passerine species. However, the relationship plotted in Morrison et al. (2015) is distinctly curvilinear but when it is transformed to the reciprocal of moult duration plotted against the number of simultaneously growing primaries, it becomes linear (pers. obs.). We therefore created the variable moult intensity by taking the reciprocal of duration.
At each study site, each population of each species was classified according to migratory status (resident or migrant, taken from the regional handbooks) and grouped according to the order and family to which it belonged. Body mass was taken from the published study where possible. Where body mass was not given, it was taken from Dunning (2008). We acknowledge that published estimates of body mass for a species often show considerable variation. In this paper, body mass is transformed to a logarithmic scale. Because of this, in the plots in this paper the different available body mass values for a species would almost invariably produce visually equivalent results.
Coordinates of localities for studies were mostly provided in the published papers. Where data were accumulated over a region, we chose a central position. If the coordinates of the study were not given, we used the coordinates of the place name given as the location of the sampling site. Latitudes in the northern hemisphere were given a positive sign whereas southern latitudes were given a negative sign.
We created a rate-of-change-in-day-length explanatory variable by calculating the difference in day length between the day on which moult started and the following day using package “geosphere” (v. 1.5-18) (Hijmans et al., 2022) in R.
Guided by the approaches pioneered by Remisiewicz (2011), Dietz et al. (2015) and Jackson and Underhill (2022), we explored relationships between the moult parameters and a series of explanatory variables. All analyses were performed in R (v. 3.6.2) (R Core Team, 2019) and should be treated as having the status of exploratory data analyses (Tukey, 1977).
We sought to determine how representative the data are and if there is bias in the distribution of Underhill-Zucchini analyses across taxonomic orders, continents and latitudes. We were interested in how the timing of moult, synchronicity of moult and the duration of moult vary with latitude. How the intensity of moult varies with the rate of change in day length measured at the start of moult was investigated. When day length is rapidly decreasing at the start of moult, it is expected that the birds might have a shorter, more intense moult so that they can complete moult before harsh winter conditions set in. We therefore investigated how duration and intensity of moult varied with species mass and if there was a physiological limit to the intensity of moult for birds of a given mass. This paper further examined how moult duration and synchronicity of moult within a population varied between migratory and resident species, the idea being that migratory species should have a shorter, more synchronous moult than residents because of time constraints imposed by their annual cycles.
In most studies, the scatter plots generated by plotting pairs of variables are a means to an end. They are used to infer relationships and to justify the fitting of particular statistical models. In this review, the scatter plots are an end in their own right. Our focus is on examining the patterns they display. Following Jackson and Underhill (2022), we make extensive use of quantile regression (Koenker and Bassett, 1978; Cade and Noon, 2003; Koenker, 2005) as an objective framework for examining patterns in the scatter plots, assisting with interpretation of plots and providing visual summaries of the data. Quantile regression was implemented in R using the rq() function from the “quantreg” package (v. 5.95) (Koenker, 2023). We used both linear and quadratic relationships in the quantile regressions, and only plotted lines and curves that were statistically significant. Quantile regression was used solely for interpretation of patterns.
In a least squares regression, the objective is to find the line which minimises the sum of the squares of the vertical distance between the line and the points in the scatter diagram. It is a line which, in some sense, passes through the “middle” of the points in the scatter diagram. In contrast, with a quantile regression it is possible to fit a line that goes through any quantile of the data in the scatter diagram (Koenker and Bassett, 1978). The 50% quantile regression line has half the points above it and half below it, and of all possible lines that achieve this, the objective is to fit the line which minimises the sum of the absolute differences between the line and the points in the scatter diagram. We also make extensive use of the 10% and 90% quantile regressions. The former has 10% of the points below the line and 90% above it, and vice versa for the latter. In other words, the 10% quantile regression helps define the shape of the “bottom” of the scatter diagram, and the 90% quantile regression helps define the shape of the “top” of the scatter diagram. All quantiles are feasible in the algorithm used to fit the lines. The 10%, 50% and 90% quantiles were chosen because of the size of our database made this a sensible option. The same algorithm is used for fitting all quantile regression lines. For lines other than 50%, the description is more complex than the 50% quantile regression but the algorithm uses the same concept, namely sums of absolute residuals. The 50% quantile regression (or median regression) is not the same as a least squares regression, because the former has an objective function minimising the sums of absolute residuals, whereas the latter is minimising the sums of squared residuals. This difference results in quantile regression being more robust than least squares regression, in the sense that it is less likely to be influenced by outliers. Jackson and Underhill (2022) provide further insights into quantile regression and its applications.
We summarised the analyses taxonomically by order and geographically by continent. We plotted the study sites on a world map. The number of Underhill-Zucchini moult analyses per taxonomic order was calculated. In the Passeriformes, the number of families covered by these analyses was tabulated. The number of analyses per continent as well as the distribution of these analyses across 5° bands of latitude was determined.
The mid-date of moult, the standard deviation parameter and the duration of moult were plotted separately against latitude and the 10%, 50% and 90% quantile regression lines were drawn. We also plotted moult intensity against the rate of change of day length.
To explore the allometric relationship between primary moult duration and body mass, we plotted the logarithm of duration against logarithm of body mass. Maintaining the consistency of using quantile regression, we used the 50% quantile regression as a robust approach to the estimation of the allometry. In this case, we also estimated the least squares regression line, to enable direct comparison with other results. We also explored the relationships between the logarithm of mass and both the reciprocal of duration and the logarithm of the reciprocal of duration.
Migrant species have to allocate time for two migratory journeys (and time for preparation for migration) into their annual cycles. Because moult and breeding rarely overlap, we anticipated that the time available for moult might be shorter for migrants than for residents. Likewise, due to the same constraints, we anticipated that primary moult would be more synchronised for migrants than residents. We tested these hypotheses for duration and standard deviation of start date of moult using the Mann-Whitney test.
A total of 260 studies was found which had used the Underhill-Zucchini moult model (Appendix 1). These included 143 species, of which 49 had moult data recorded for more than one population. All studies reported the estimate of the parameter for the mean starting date, 256 studies reported the estimate of the duration parameter and 214 reported the estimate of the standard deviation parameter.
The species in the 260 studies of Appendix 1 were distributed across eight taxonomic orders (Table 1) and 40 families. The majority of moult analyses (94%) focused on species in two orders: Passeriformes (60%) and Charadriiformes (34%) (Table 1), indicating taxonomic bias. Within the Passeriformes moult analyses have been undertaken for 25 families, with the largest number of analyses in the Ploceidae (31 studies on 16 species) (from Appendix 1).
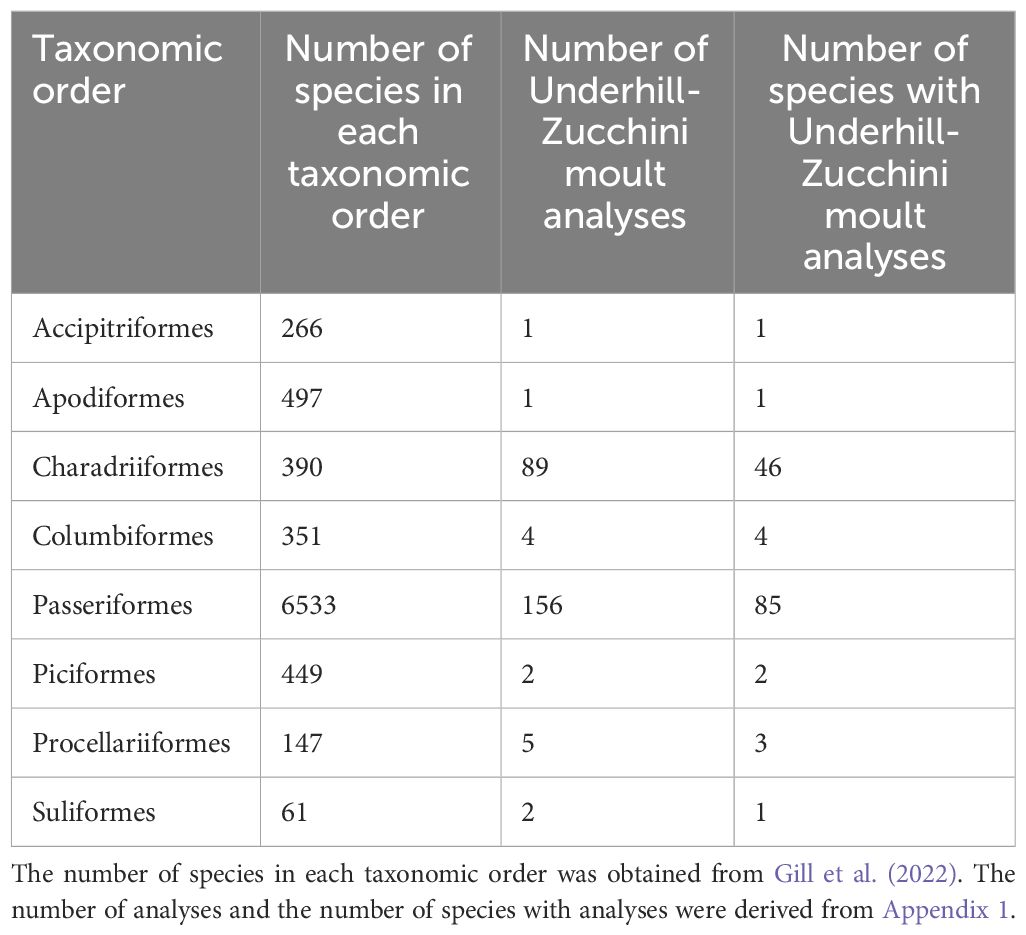
Table 1 Taxonomic orders of birds with studies using the moult model of Underhill and Zucchini (1988).
There is spatial bias in the distribution of the 260 moult studies (Figure 1). Africa was the continent with the most moult analyses (128, 49%), followed by Europe (68, 26%) (Figure 1; Appendix 1). Oceania had 32 studies, Asia 14, and North and South America had seven and eight analyses respectively (Appendix 1). Note that several studies were frequently made at single sites. Therefore, the eight studies in South America (Appendix 1) were located at only two sites (Figure 1).
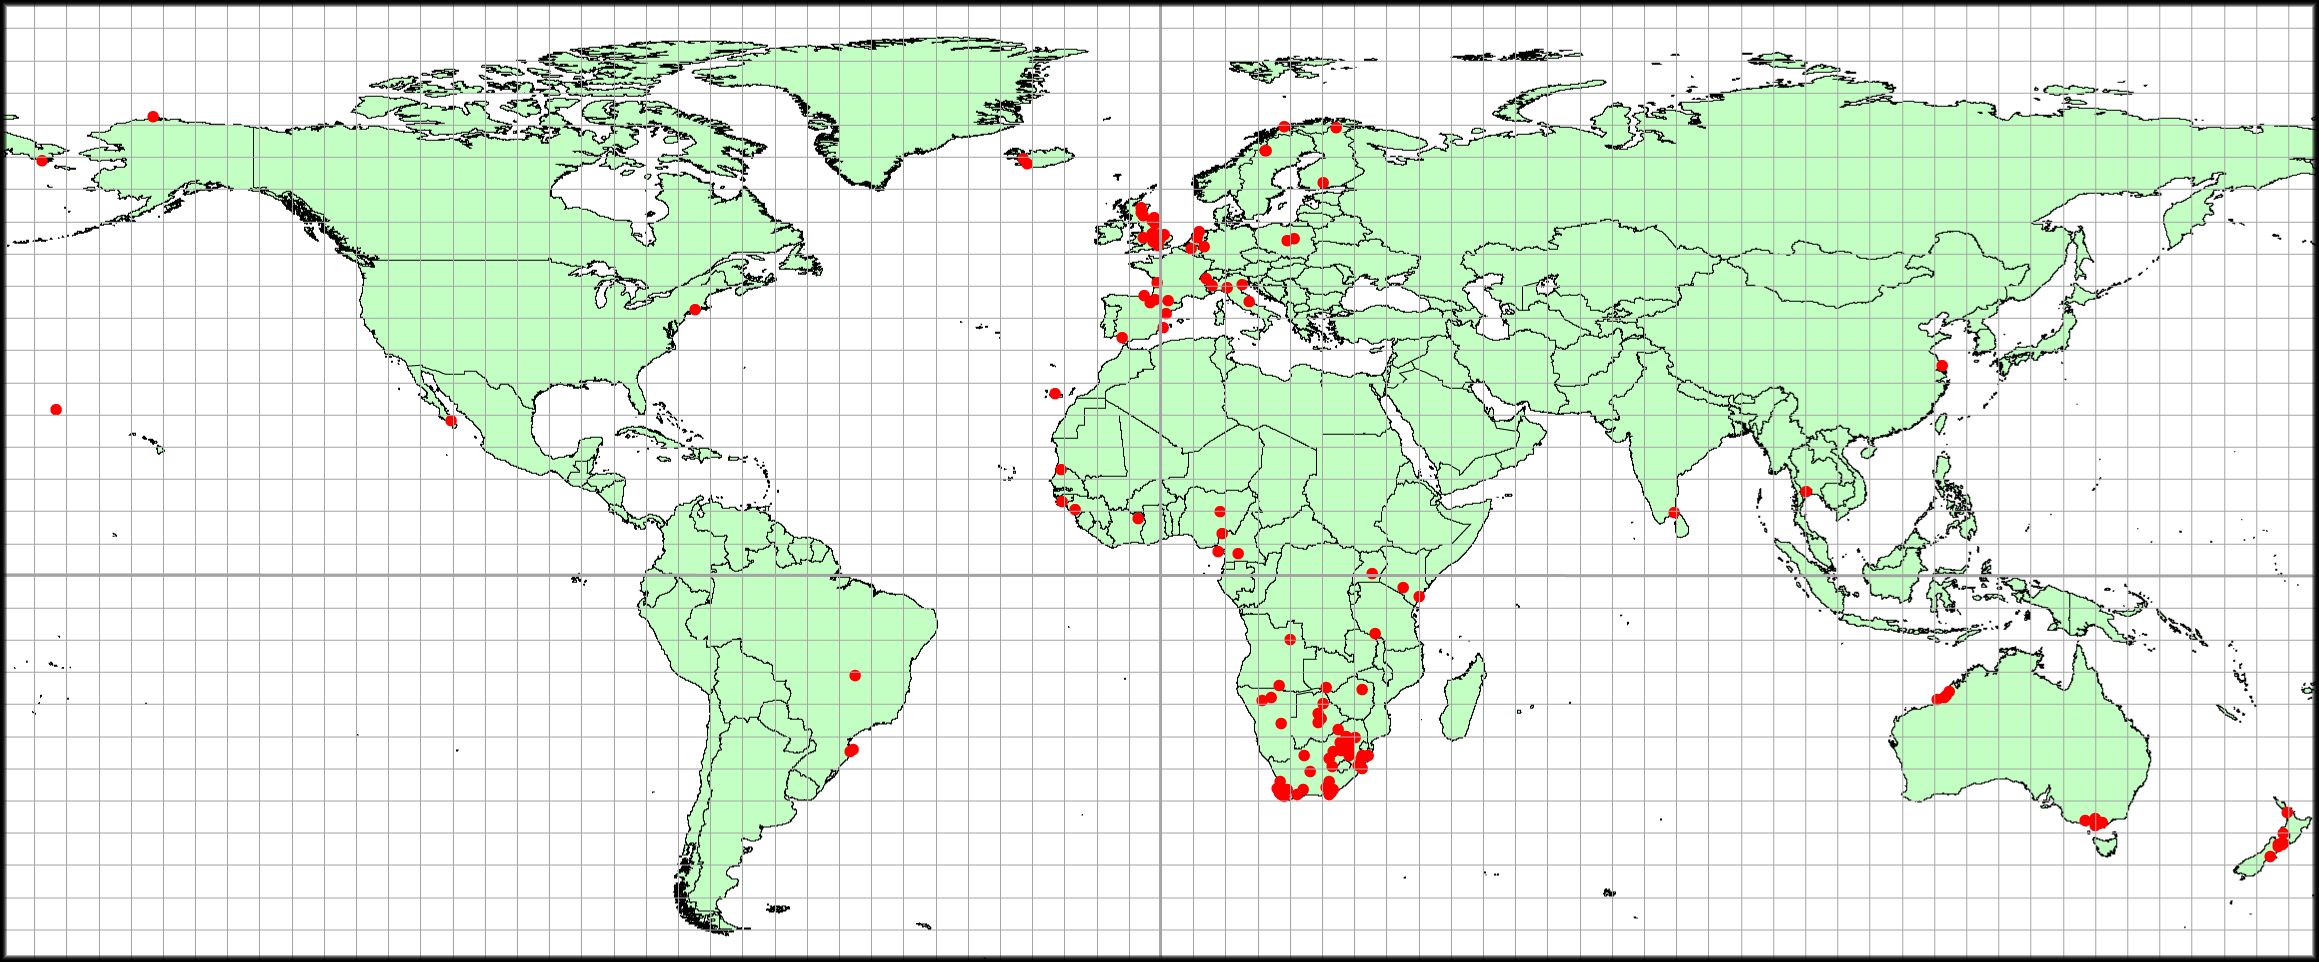
Figure 1 Map of the world showing the locations of bird populations where the Underhill-Zucchini analyses of primary moult have been done (red dots). Some sites have more than one study. Coordinates for the study sites are contained in Appendix 1.
More primary moult analyses using the Underhill-Zucchini model have been done in the southern hemisphere (159, 61%) than in the northern hemisphere (101, 39%) (Figure 2). There was a substantial gap in latitudinal coverage between 40°N and 15°S, with a total of 40 studies (15% of the total) between these latitudes, despite this zone containing a large fraction of the available terrestrial habitat. In the northern hemisphere the continents stretch to c. 75°N and there were 16 studies north of 55°N. In the southern hemisphere, both South America and Oceania stretch south of 35°S, with the former stretching to 56°S. There were 24 studies south of 35°S and none south of 45°S (Figure 2).
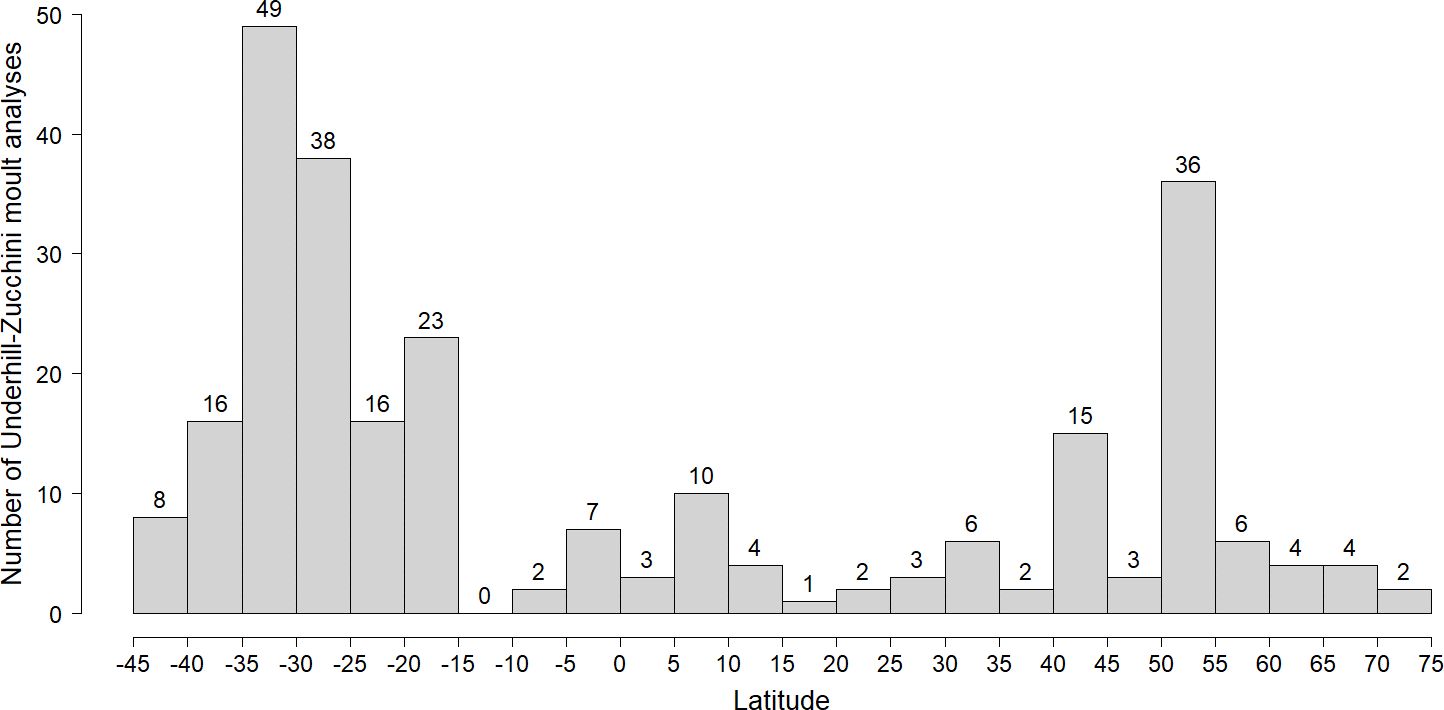
Figure 2 The distribution of Underhill-Zucchini analyses of primary moult in latitudinal bands of 5° widths. Latitudes in the southern hemisphere are negative.
Figure 3 relates the timing of moult, expressed as the mid-date of primary moult, to latitude. The three quantile regression lines (10%, 50% and 90%) summarise the underlying pattern of the available data. In the northern hemisphere, at latitudes from 30°N and northwards, moult took place towards the end of the boreal summer and into autumn (July–September). Variability in the timing of primary moult appeared to increase southwards towards the tropics and the southern hemisphere. With the available data, the greatest variability occurred between 15°S–30°S, when the mid-date of primary moult occurred throughout the year (Figure 3). Note that the Discussion will argue that these results are misleading.
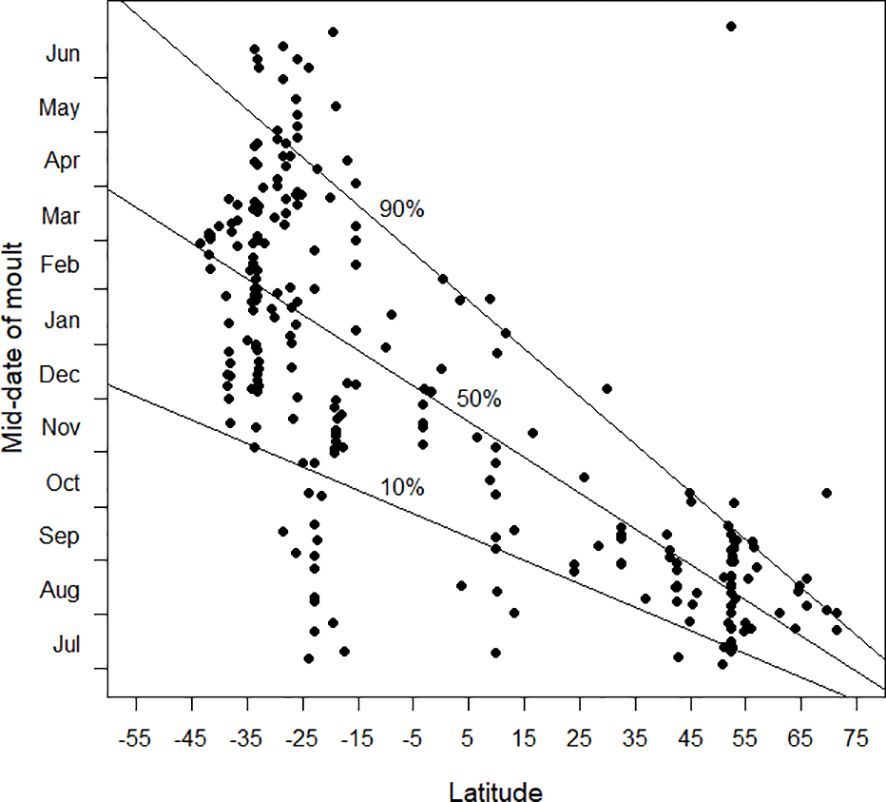
Figure 3 The mid-date of moult (see text) plotted against latitude. Latitudes in the southern hemisphere are negative. The 10%, 50% and 90% quantile regression lines (see text) are shown. The sample size was 257. This plot is criticised in the Discussion.
The standard deviation of start date provides a measure for how synchronised moult is within the population of a species at a site (Figures 4–6). Overall, based on the available data, there was a clear trend for smaller standard deviations (and therefore greater synchronicity) at far northern latitudes than in the southern hemisphere (Figure 4). Figure 5 shows the pattern for the northern hemisphere only. There was greater synchronicity of moult in the far north than in the northern tropics. Closer inspection of Figure 4 suggests that the overall pattern of larger standard deviations was not maintained at the most southerly latitudes for which data were currently available. This is evident in Figure 6, which demonstrates greater synchronicity at the southernmost latitudes for which data were available.
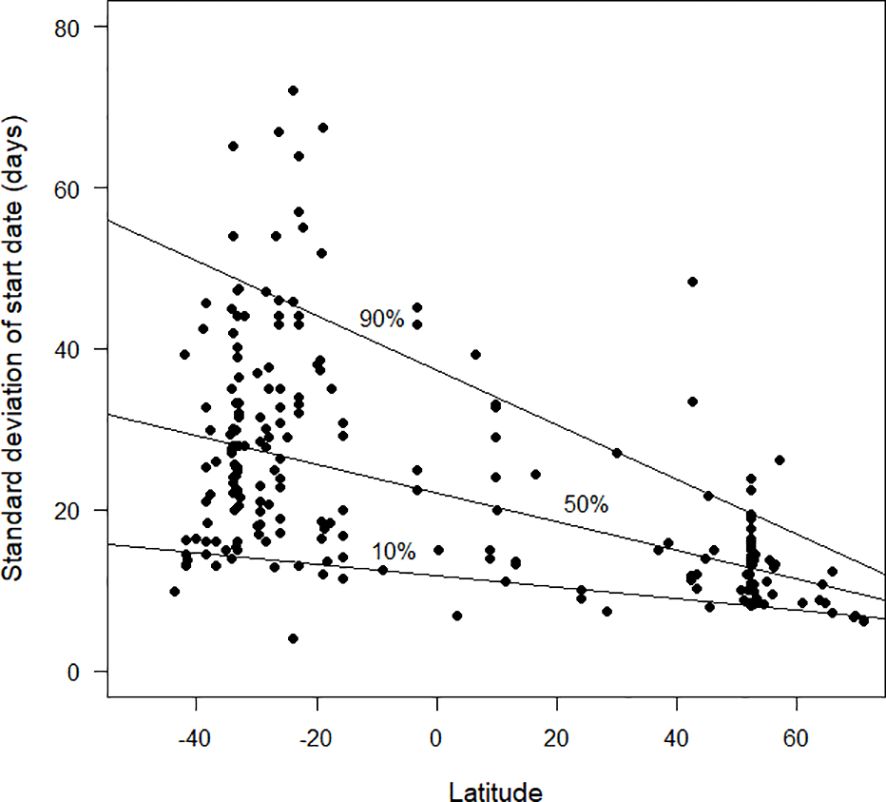
Figure 4 The standard deviation in start date of moult (days), as estimated by the Underhill-Zucchini moult model, plotted against latitude. Latitudes in the southern hemisphere are negative. The 10%, 50% and 90% quantile regression lines (see text) are shown. The sample size was 214.
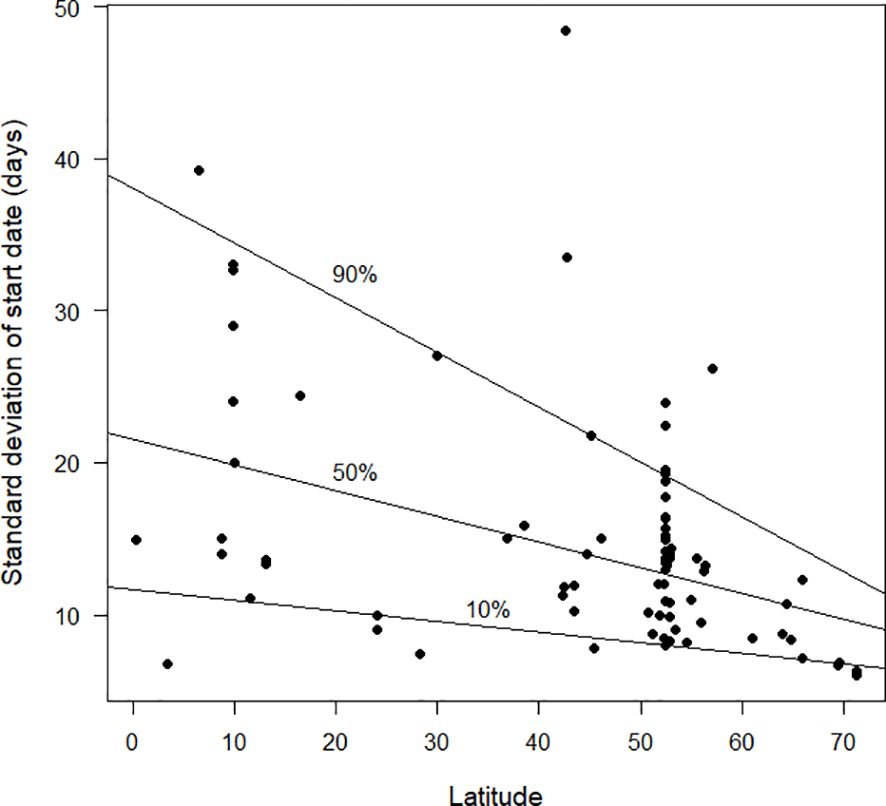
Figure 5 The standard deviation in start date of moult (days), as estimated by the Underhill-Zucchini moult model, plotted against latitude. The plot is restricted to studies in the northern hemisphere. The 10%, 50% and 90% quantile regression lines (see text) are shown. Sample size was 80.
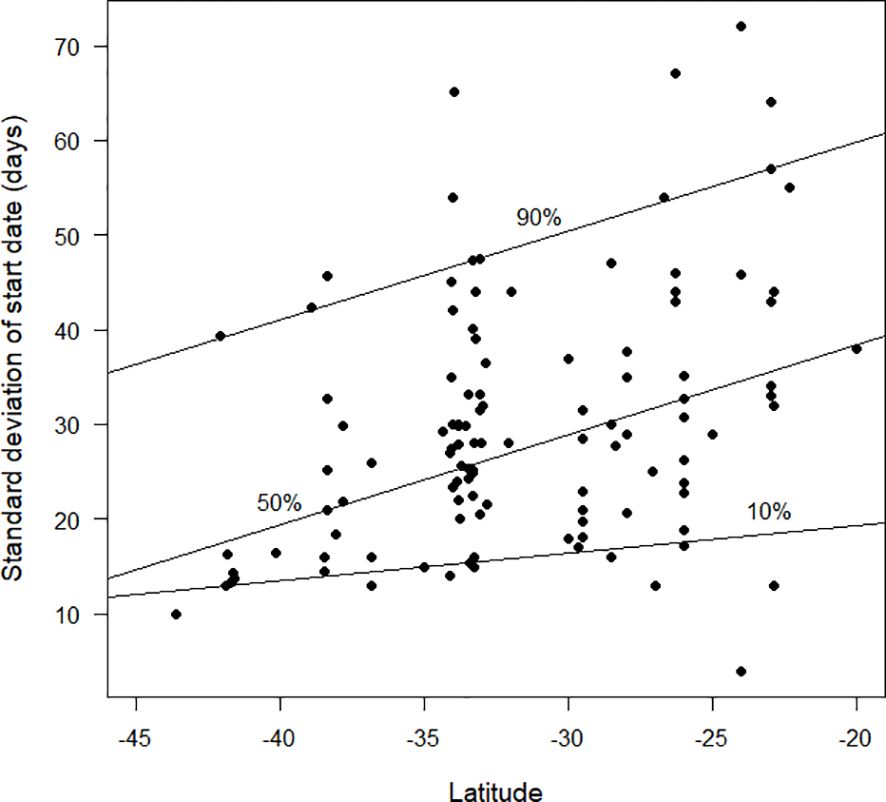
Figure 6 The standard deviation in start date of moult (days), as estimated by the Underhill-Zucchini moult model, plotted against latitude. The plot is restricted to studies in the southern hemisphere, south of 20°S. The 10%, 50% and 90% quantile regression lines (see text) are shown. The sample size was 112.
The duration of primary moult appeared to be relatively short in the northern hemisphere and longer and more variable in the southern hemisphere (Figure 7). The form of the 10% quantile regression is quadratic, suggesting that the duration of primary moult was shorter at high latitudes, for at least some species, than it was in the tropics. As with Figure 3, the Discussion will point out that, once additional data are available for the tropics, the overall pattern displayed by these results might be misleading.
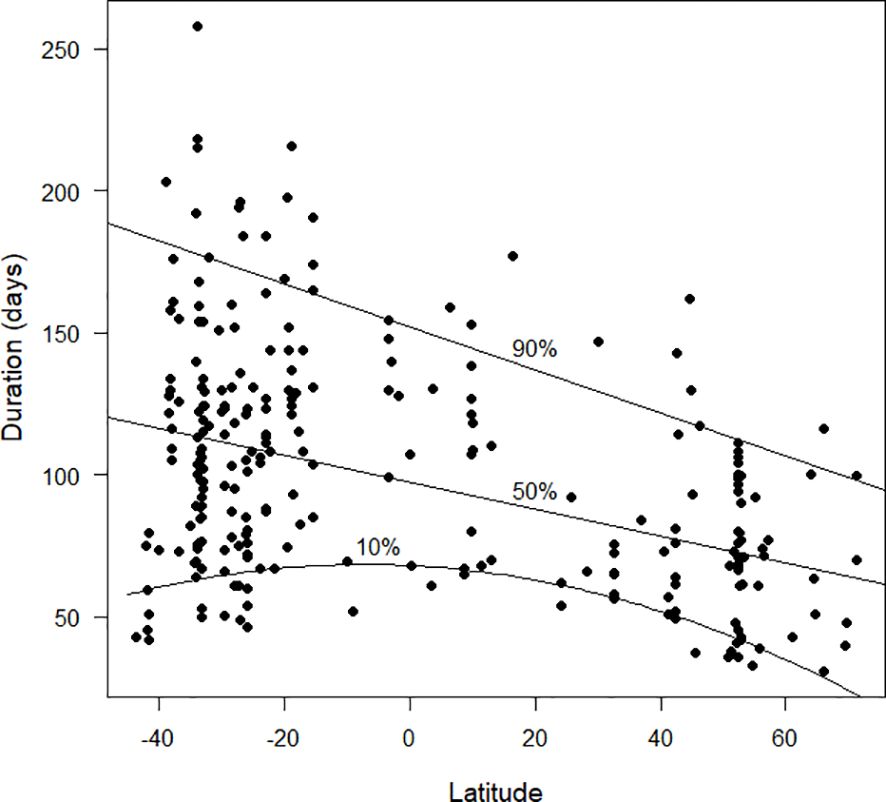
Figure 7 The duration of primary moult (days), as estimated by the Underhill-Zucchini moult model, plotted against latitude. Latitudes in the southern hemisphere are negative. The 10%, 50% and 90% quantile regression lines (see text) are shown. For the 10% quantile regression, the quadratic term was statistically significant but for the 50% and 90% quantile regression lines only the linear term was significant. The sample size was 256.
When day length was decreasing rapidly at the start of primary moult, the available data suggested that the duration of moult was short and birds underwent a moult of high intensity. However, moults of short durations and high intensity also occurred when the rate of change of day length was close to zero (Figure 8). The longest moult durations occurred when day length was increasing. The quadratic relationship for the 10% quantile regression suggests that there were no exceptionally rapid durations for primary moult when day length was increasing by two or more minutes per day at the start of moult (Figure 8).
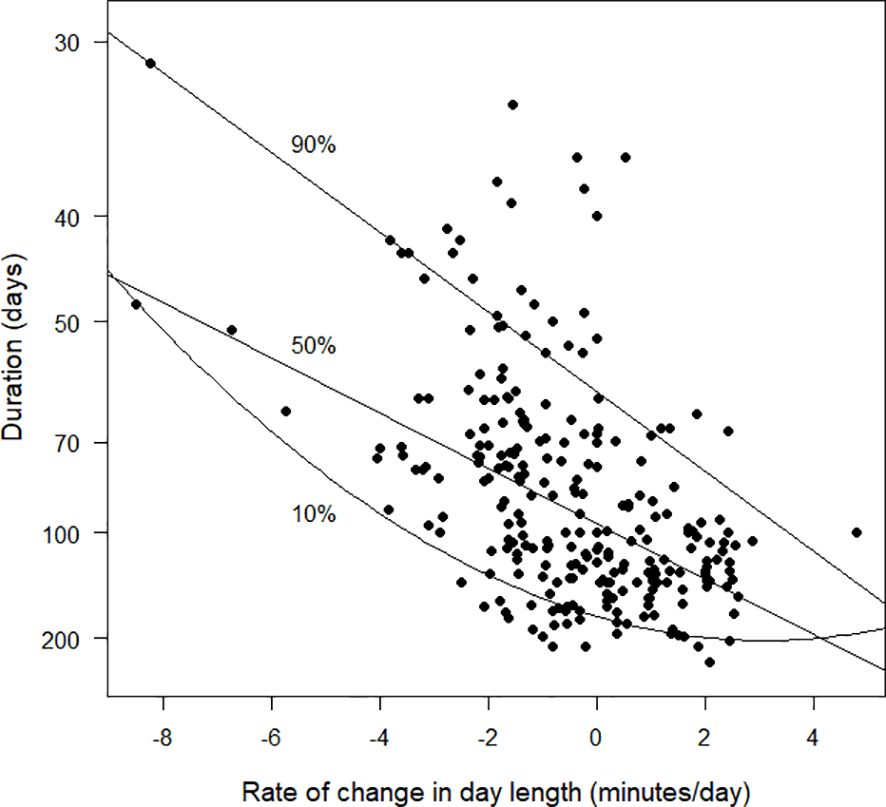
Figure 8 The duration of primary moult (days), as estimated by the Underhill-Zucchini moult model, plotted against rate of change in day length (minutes/day) at the date of start of moult. The values plotted on the y-axis are the reciprocals of the durations. Because 1/30 > 1/200, the species with durations of 30 days are plotted higher on the graph than species with durations of 200 days. This strategy results in the y-axis being interpretable as “moult intensity”, with greater intensity associated with shorter durations (see text). The 10%, 50% and 90% quantile regression lines are shown. The sample size was 256.
There was an allometric relationship between mass and duration (Figure 9). The relationship suggested by the 50% quantile regression line fitted to the logarithms of both variables was duration=52.79 mass0.149. However, the 10% and 90% quantile regression lines were far apart, suggesting that the allometric relationship was not tight. For completeness, the allometric relationship obtained using conventional least squares regression was duration=53.76 mass0.144 (the standard error of the exponent of mass was 0.017, t251=8.2, P<0.0001) and that obtained from reduced major axis regression was duration=51.43 mass0.155.
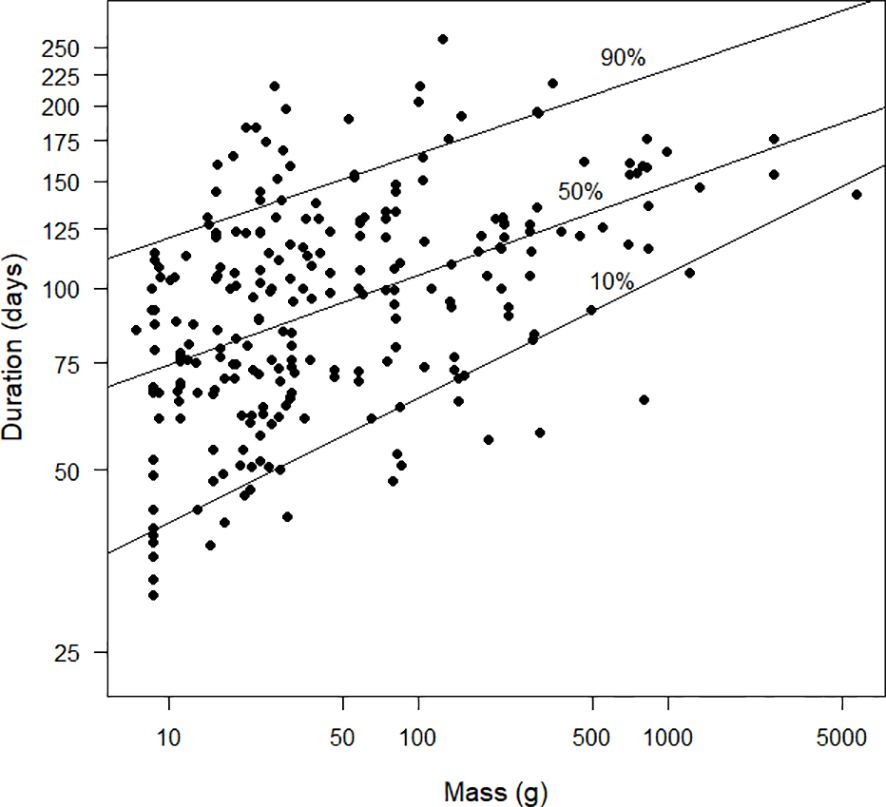
Figure 9 The duration (days) of primary moult, as estimated by the Underhill-Zucchini moult model, plotted against mass (g). The x-axis and y-axis are plotted on a logarithmic scale. The 10%, 50% and 90% quantile regression lines (see text) are shown. The sample size was 253.
Figures 10 and 11 explore the relationships between the inverse of duration and mass. The inverse of duration is proportional to the daily increase in the moult index and therefore to moult intensity. From the quantile regression, the allometric relationship between these two variables was intensity=0.0189 mass–0.0149 (Figure 11). From the least squares regression the relationship was intensity=0.0186 mass–0.0144 (the standard error of the exponent of mass was 0.017, t251=–8.2, P<0.0001) and from the reduced major axis regression it was intensity=0.0169 mass–0.0155. The relationships between the pairs of models in this paragraph and the one above are a mathematical consequence of the properties of logarithms.
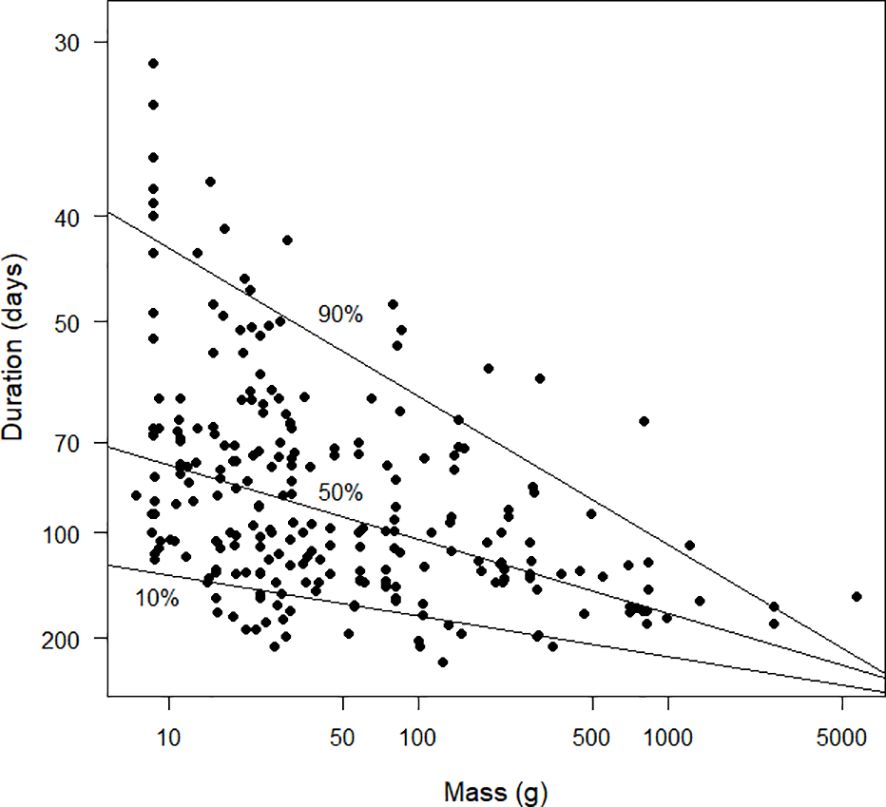
Figure 10 Scatter diagram duration (days), plotted against mass (g). Note that the x-axis is plotted on a logarithmic scale and the values plotted on the y-axis are the reciprocals of the durations. Because 1/30 > 1/200, the species with durations of 30 days are plotted higher on the graph than species with durations of 200 days. This strategy results in the y-axis being interpretable as “moult intensity”, with greater intensity associated with shorter durations (see text). Duration was estimated using the Underhill-Zucchini moult model. The 10%, 50% and 90% quantile regression lines are shown. The sample size was 253.
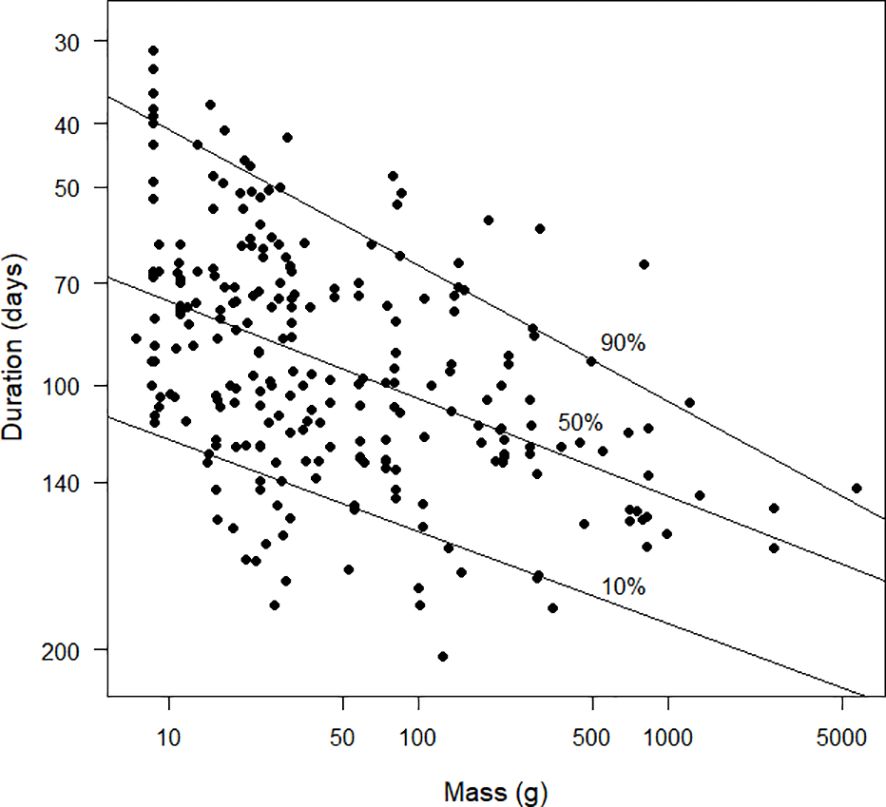
Figure 11 Scatter diagram duration (days), plotted against mass (g). Note that the x-axis is plotted on a logarithmic scale. The values plotted on the y-axis are the logarithms of the reciprocals of the durations. Because log(1/30) > log(1/200), the species with durations of 30 days are plotted higher on the graph than species with durations of 200 days. This strategy results in the y-axis being interpretable as “moult intensity”, with greater intensity associated with shorter durations (see text). Duration was estimated using the Underhill-Zucchini moult model. The 10%, 50% and 90% quantile regression lines are shown. The sample size was 253.
The median durations of moult for migrants and residents were 95 days (n=115) and 99 days (n=136) respectively and were not significantly different (Mann-Whitney U=7074.5, P=0.19). If the standard deviation parameter in the moult model is small, it indicates that moult is synchronised and the stage of moult for birds in the population are all close to the moult trajectory of the average bird. The medians of the estimated standard deviation parameters for migrants and residents were 16 days (n=87) and 24 days (n=126) respectively. The primary moult of migrants was more synchronised than that of residents (Mann-Whitney U=3698, P<0.001).
As in Jackson and Underhill (2022), quantile regression (Koenker and Bassett, 1978; Cade and Noon, 2003; Koenker, 2005) was used in the role of exploratory data analysis (Tukey, 1977). In least squares regression analysis, the focus is on the mean of the response variable in relation to the explanatory variable. If prediction intervals are included in a plot showing a least squares regression line these are essentially parallel to the regression line (Figure 12). Their calculation involves an assumption of homoscedasticity, in other words that the distribution of “errors” along the regression line is identical. Quantile regression enables the nature of the heteroscedasticity to be revealed. These points are illustrated in Figure 12. Note that the 50% quantile regression line, effectively the median regression line, is similar to, but not identical to, the least squares regression line, i.e. the “mean” line (Figure 12).
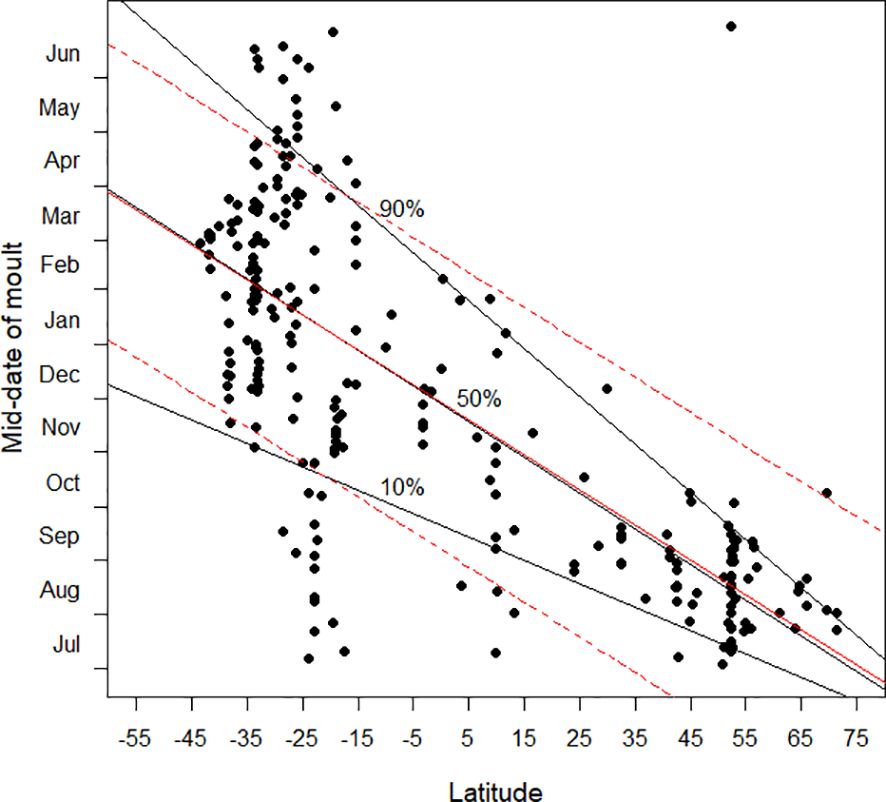
Figure 12 This graphic illustrates a key difference between ordinary least squares regression and quantile regression. In the scatter diagram the mid-date of moult is plotted against latitude. The black lines are the 10%, 50% and 90% quantile regression lines, as in Figure 3. The red line is the least squares regression line, and the dotted lines are the lines for the regular 80% prediction intervals for linear regression.
The most notable outcome of this review is the fact that it exposes the gaps in our understanding of primary moult in quantitative terms. This is true in relation to every fundamental measure of the representativeness of the data: for example, by taxonomy (Table 1), continent (Figure 1) and latitude (Figure 2).
The available data are taxonomically biased. Only eight of the 38 orders of flying birds (Gill et al., 2022) have at least one species with its primary moult parameters estimated using the Underhill-Zucchini model, with most of the analyses attributed to two orders (Charadriiformes and Passeriformes) (Table 1). Likewise, within the Passeriformes, the analyses are not well distributed across the families. This highlights a substantial gap in coverage across the phylogenetic tree.
Furthermore, a major shortcoming of the available results is their geographical bias. The most serious shortfall is the lack of data from the tropics and extending north to 40°N (Figures 1, 2). There are also severe biases in relation to the global distribution across the continents (Figure 1). Once these gaps are addressed it will be feasible to do a comprehensive review of primary moult.
From Figures 3–7, it is clear that latitude is an important explanatory variable in relation to the parameters of primary moult. But it is possible, and probably likely, that the patterns exhibited in these figures are somewhere between incomplete and misleading. It is probable that these plots capture the variability of timing of primary moult (Figure 3), its standard deviation (Figures 4–6) and its duration (Figure 7) at latitudes 55°N to 40°N and from 15°S to 35°S, but not in the far north, the far south and a broad band of latitudes north and south of the equator. In particular, it is likely that the biggest shortfall in data is the last-mentioned zone, between latitudes 40°N and 15°S. Once more results from this zone are available it is likely that the patterns in Figures 3–7 will change radically.
The relationship which the available data are suggesting is that in far northern latitudes the mid-date of moult lies in the boreal late summer and autumn, after the spring–early summer breeding season, and avoiding the harsh winter period (Figure 3). At the southernmost latitudes for which data are available, especially south of 40°S, the complementary pattern appears to be emerging, with the mid-date of moult in the austral autumn (Figure 3), consistent with a predominant breeding season in the austral spring. Between 15°S and 25°S there are a total of 40 moult studies (Figure 1); the mid-dates of moult are scattered throughout the calendar year (Figure 3). In this latitudinal band, temperatures are relatively warm throughout the year but seasonality and regularity of rainfall, and therefore food availability, vary considerably. The timing of breeding and moult is therefore variable depending on local conditions (e.g. Jackson and Underhill, 2022). Once more data become available for latitudes between 40°N and 15°S it is likely that the pattern shown between these latitudes will change dramatically and that the mid-dates of moult will be shown to occur throughout the year. The lack of cold conditions continues as far north as c. 30°N. It is therefore likely that this lack of seasonal pattern in the timing of primary moult might extend as far north as this, beyond which the tendency for the mid-date of moult to be in the boreal autumn will start to predominate. Based on the above discussion, we hypothesise that the actual pattern will be like Figure 13.
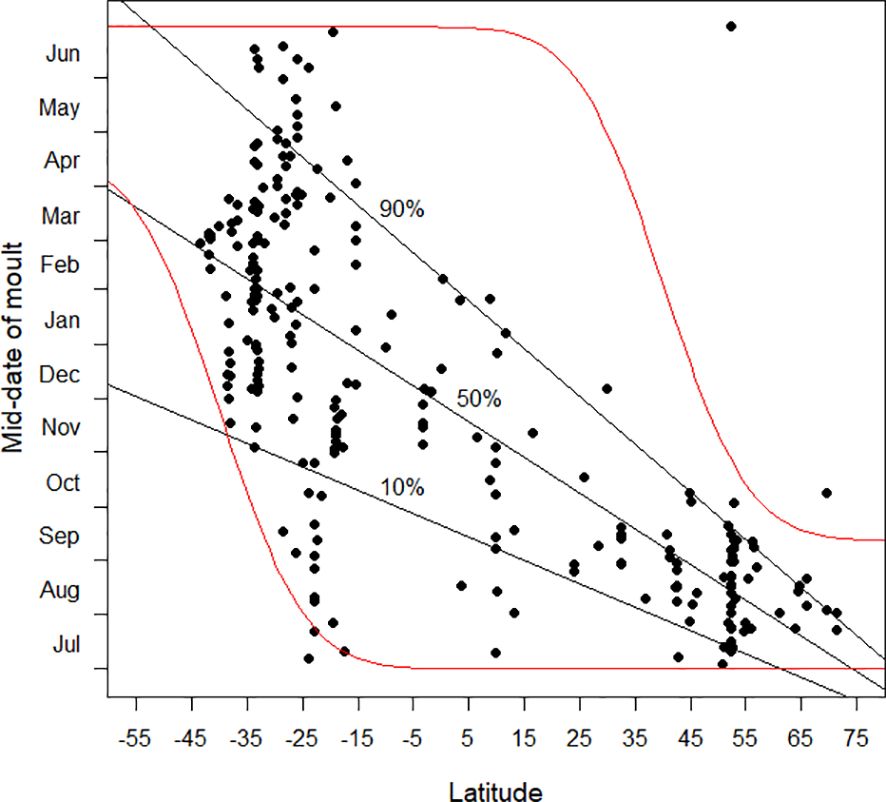
Figure 13 The mid-date of moult (see text) plotted against latitude. Latitudes in the southern hemisphere are negative. Our working hypothesis (see text) is that the area between the two red lines will be occupied with results when there is a more representative sample of analyses from the latitudes between about 40°N and 15°S than currently available (Figure 2). The quantile regression lines in this plot, based on currently available data, and copied from Figure 3, are then likely to prove misleading.
Likewise, the current pattern between latitude and the standard deviation parameter (Figure 4) is likely to prove misleading once additional data become available. We anticipate that there will be a lot more species with large standard deviations in the tropics (i.e. unsynchronised moult). We anticipate small standard deviations (i.e. synchronised moult) when additional analyses become available from places such as the South Island of New Zealand and southern South America (Figure 6 hints at this). We predict that the 90% quantile regression (currently a straight line in Figure 4) will show a quadratic pattern, with a maximum value in the tropics and decreases towards high latitudes in both the southern and northern hemispheres.
Although the parameters of primary moult are clearly related to latitude (Figures 3–7), it is an explanatory variable implying relationship and not causation. It is a proxy for the real causal explanatory variables, which would include temperature, seasonality, day length, and many others. In northern latitudes, north of c. 45°N, primary moult mainly takes place after breeding and ahead of harsh winter weather (Figure 3). A similar pattern is developing in the southern hemisphere (Figure 3), but more studies south of 35°S are needed to confirm this. It is clear that in the north and south, explanatory variables such as temperature and seasonality, for which latitude is a proxy, dominate the parameters of moult. However, in the tropics, it is likely that species-specific factors and local conditions dominate in determining the timing of moult. For example, in Thailand (13°N), Long-toed Stints Calidris subminuta moult rapidly near the end of the wet season when food is most abundant (Round et al., 2012). In Kenya (3°S), Greater Sand Plovers Charadrius leschenaultii moult slowly because the only constraint is to complete moult prior to fattening for migration in February/March (Jackson, 2017).
Given that latitude is not, in itself, a causal variable, we searched for alternatives. We tried to relate rate of change in day length measured at the start of moult to duration (Figure 8). Rate of change in day length is a complex variable, an interaction of both latitude and calendar date. The underlying hypothesis was that the duration of moult should be short when day length is decreasing rapidly, because large negative values for this variable can be interpreted by the bird as an indication that harsh winter conditions are approaching and that a rapid moult rate is needed, with the outcome that duration would then be short. This variable showed promise, with short moult durations when day length was decreasing rapidly and no short durations when day length was increasing rapidly. However, when day length was stable there was a large variation in moult durations (Figure 8).
We explored the allometric relationship between the duration of primary moult and bird mass, where the focus is on the exponent of mass (Figure 9). There have been three studies which have examined this allometric relationship (Hedenström, 2006; Rohwer et al., 2009; Dietz et al., 2015). Hedenström (2006) used a sample of 60 European passerines with durations fitted “by eye” in Ginn and Melville (1983) and derived the allometric relationship: duration=34.4 mass0.19. He considered this result preliminary. Rohwer et al. (2009), based on primary moult durations for 43 species obtained using a variety of methods, claimed that the exponent of mass was 0.14. Dietz et al. (2015) found the exponent of mass to be 0.17 for 13 species of northern hemisphere waders with durations estimated using the Underhill-Zucchini moult model. Using least squares regression (the recommended method for finding allometric relationships, Kilmer and Rodríguez, 2016) we found the relationship: duration=53.76 mass0.144. Our relationship estimates durations longer than that of Hedenström (2006). For example, for a bird with a mass of 100 g, the predicted durations are 104 days and 83 days, respectively. The direction of the difference is unsurprising, given that Hedenström’s (2006) results were based on European species moulting either under the constraint of impending migration or the advent of cold weather.
Figures 10 and 11 present the same underlying information as Figure 9, but with a different visual emphasis. In Figure 10, increases along the y axis, for birds of a given mass, can be interpreted as measuring increasing moult intensity. The striking feature of Figure 10 is that the upper right corner contains no values. This is not a consequence of data limitations but a physiological reality. There appears to be a physiological frontier of moult intensity for birds at a certain mass. This frontier must lie above the 90% quantile regression line in Figure 10. Species moulting close to this frontier are probably producing poor quality primaries. In contrast, species which lie below the 50% quantile regression line are probably producing high quality primaries. It remains to be seen whether the bottom left corner of Figure 10 remains empty once additional data are available. Species in this corner would consist of birds with small mass and long moult durations; these are potentially species from the tropics, which is the region with the largest data deficiency (Figures 1, 2). Based on this discussion, and the insights on moult intensity in relation to feather quality in Jenni and Winkler (2020), Figure 14 encapsulates the hypotheses proposed in this paragraph. The concepts presented here should be investigated further. In particular, the relationship between the traditional definition of moult intensity as average number of growing primaries and the definition suggested here, the reciprocal of moult duration, needs attention.
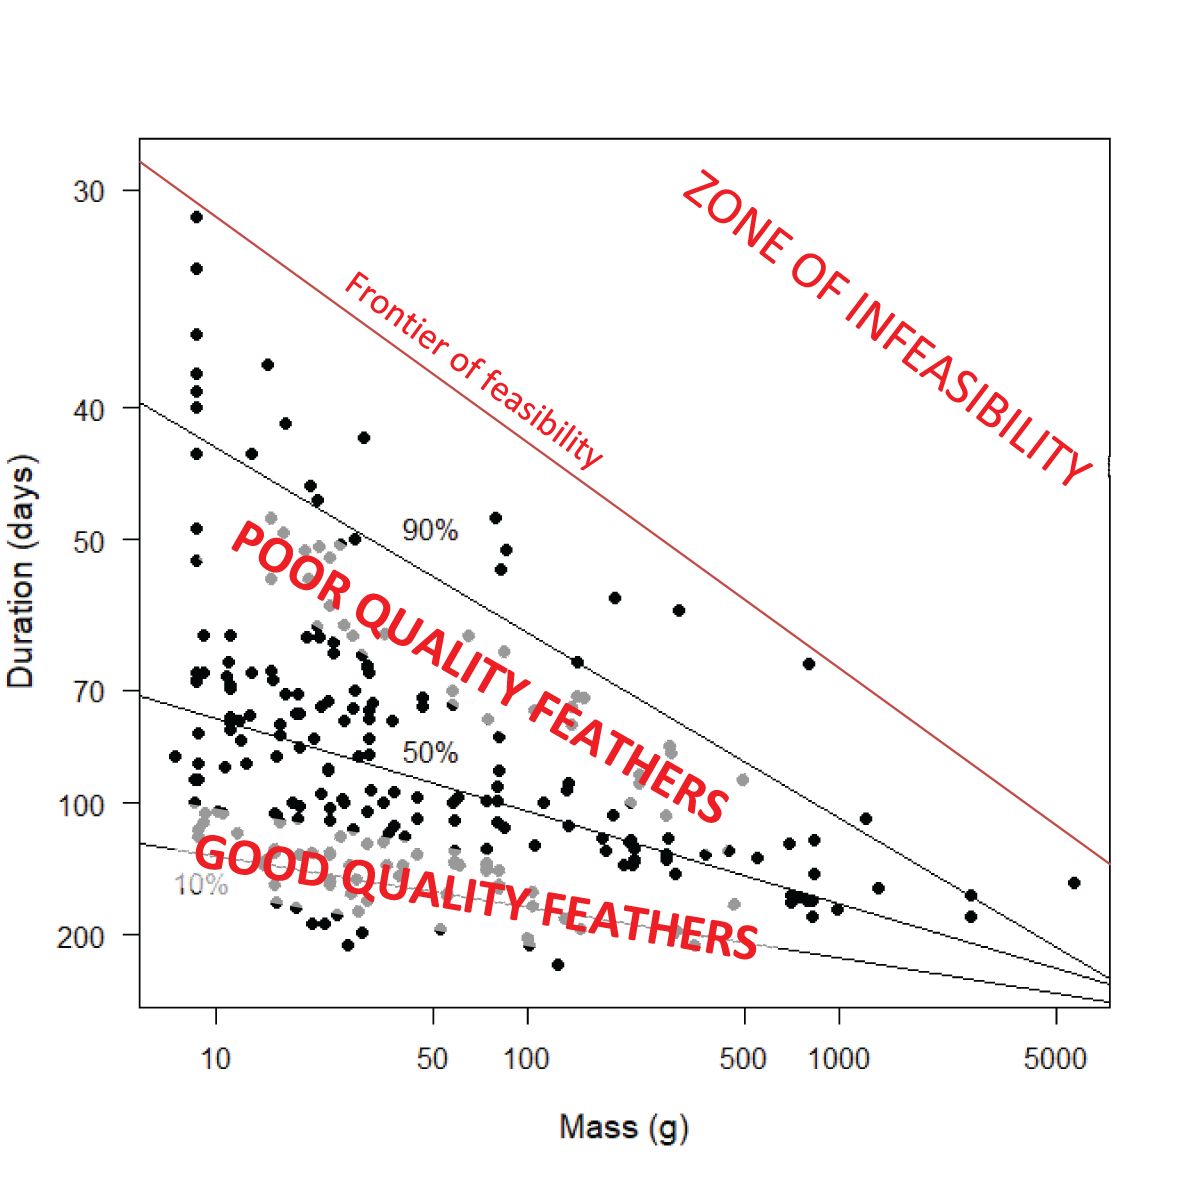
Figure 14 Hypothesised interpretation of Figure 10 in relation to quality of primary feathers. The y-axis represents “moult intensity” (see text), calculated as the increase in the moult index per day of primary moult, which is the inverse of duration.
Figure 11, with logarithms on both axes, lays the foundation for the allometric relationships between the proposed new definition of moult intensity and mass. However, as a straightforward property of logarithms, the allometric relation in Figure 11 is the inverse of the relationship in Figure 9 between mass and duration. From a visual communication perspective, Figure 10 is more successful than Figure 11 therefore we do not consider Figure 11 further.
De la Hera et al. (2009) analysed moult durations in 48 European passerine species, also using moult durations fitted “by eye” in Ginn and Melville (1983). They found that larger species took longer to moult than smaller species. After controlling for body mass, moult duration was found to be longer in residents (and short distance migrants) than in long distance migrants. These results are likely to be improved by the use of durations estimated statistically by a quantitative moult model. This also applies to the results of Silveira and Marini (2012) who focused on the primary moult of passerine and non-passerine tropical birds in South America. They found that the duration of moult was longer than in similar temperate-zone species and an increase in body mass was associated with an increase in moult duration. The one migratory species in their study had the shortest moult duration out of the eight studied.
In this study we reported only one result per species per locality. Newton (2009) envisaged annual studies which would reveal long terms trends in each of the parameters of moult and which could be related to environmental conditions in each year. Newton (2009) was thinking in a European, mainly British, context where seasonal variation is relatively small. In many parts of the world, and especially in arid areas in the tropics and near-tropics, there is large variability in the timing and annual amount of rainfall (Underhill, 1999). This impacts annual environmental productivity, which in turn impacts the timing of moult (Nwaogu and Cresswell, 2021). Thus, consideration needs to be given to the possibility that studies pooling primary moult data across multiple years generate estimated standard deviation parameters which are larger than they would be if only individual years were considered.
In an era of global climate change, there is also a need for repeat studies of moult at, for example, decadal intervals. Even if data volumes are inadequate to undertake annual studies, it might be feasible to accumulate available data over long enough periods, possibly a decade, to ensure that the impact of individual outlying years is relatively small. The only study of this nature that we are aware of is that of Taylor et al. (2018), who found an increase in moult duration of 46% over six decades in Alaska. This is a such a dramatic change that it needs to be compared to the results of further studies of this nature.
As noted in the Introduction, citizen scientists have a crucial role to play in the study of primary moult. Bird ringers have the opportunity to collect moult data while they have the bird in the hand. These fieldwork methods are described by De Beer et al. (2000). Bird ringing schemes need to curate these data. Digital photography (Vieira et al., 2017; Bate et al., 2023) represents an additional source of primary moult data, especially for species that are seldom handled by ringers. Systems need to be devised to curate these images. Remarkably, the protocol for moult data collection by ringers has remained unaltered since it was first developed (Ashmole, 1962; Ginn and Melville, 1983). A large proportion of primary moult data accumulated by ringers in the early decades of recording moult was not curated by ringing schemes and remains in notebooks. These historical data are of particular value because they will enable the quantification of trends in primary moult parameters through time.
It is noteworthy that Africa is the leader of quantitative studies of primary moult. Almost half of all applications of the moult model of Underhill and Zucchini (1988) have been undertaken on birds on this continent.
However, this is also a symptom of the major shortcomings of the current database. In every aspect considered there are unfortunate data gaps. The fact that half the analyses are African is a consequence of many other continents having little data. Citizen scientists, both bird ringers and photographers, have a key role to play in helping to fill the data gaps.
Latitude emerged as the dominant explanatory variable. But there are latitudinal gaps in the data, especially in the tropics, in the far northern hemisphere and at the southern limits of the continents of South America and Oceania, especially the South Island of New Zealand.
The main pattern that appears to be emerging is that primary moult is more synchronised across populations of all species at far northern latitudes than in temperate or tropical zones. Individuals within populations moulting in the far north all tend to moult at the same time to ensure that moult is finished before the harsh winter conditions set in. This pattern is clear in the northern hemisphere and is an emerging trend in the southern hemisphere. The available data for the tropics and for sub-tropical climates of the southern hemisphere display a great deal of variability in the timing of moult.
In these analyses, latitude is acting as a proxy for the true explanatory variables. In the far north and far south, latitude, combined with calendar date, is a satisfactory proxy for variables such as temperature, day length, seasonality, and ultimately food availability. Across the tropics and sub-tropics, the true factors that determine timing of moult are much less related to latitude but more to species-specific factors and local conditions. A single latitude can straddle habitats ranging from deserts to tropical rainforests. Thus, the lack of any consistent pattern with regard to moult is thus the anticipated result in the tropics and sub-tropics. The challenge in these areas is going to be finding the actual variables explaining the parameters of primary moult.
In broad terms, among species that undertake an annual sequential moult, larger birds take longer to moult than smaller birds. But the allometric relationship is not tight. Migrants appear to be more synchronised in their moult than residents. This is expected for migrants because they must fit migration into their annual cycles along with breeding and moult.
The objective of this paper was to describe the statistical patterns that are emerging as the number of quantitative analyses using the moult model of Underhill and Zucchini (1988) increases. Moult, however, is a physiological process, controlled by endogenous and exogenous factors (Jenni and Winkler, 2020). A next step would be to explore these patterns of moult in relation to these factors.
The original contributions presented in the study are included in the article/Supplementary Material. Further inquiries can be directed to the corresponding author.
TS: Data curation, Formal analysis, Investigation, Methodology, Writing – original draft, Writing – review & editing. LU: Conceptualization, Funding acquisition, Investigation, Methodology, Supervision, Writing – review & editing.
The author(s) declare financial support was received for the research, authorship, and/or publication of this article. TS was supported by a Science Faculty PhD Fellowship from the University of Cape Town. LGU acknowledges research grants from the University of Cape Town.
Dr Rene Navarro generated the world map (Figure 1). This paper is a version of a chapter in the PhD thesis of TS (Scott, 2023).
The authors declare that the research was conducted in the absence of any commercial or financial relationships that could be construed as a potential conflict of interest.
The author(s) declared that they were an editorial board member of Frontiers, at the time of submission. This had no impact on the peer review process and the final decision.
All claims expressed in this article are solely those of the authors and do not necessarily represent those of their affiliated organizations, or those of the publisher, the editors and the reviewers. Any product that may be evaluated in this article, or claim that may be made by its manufacturer, is not guaranteed or endorsed by the publisher.
The Supplementary Material for this article can be found online at: https://www.frontiersin.org/articles/10.3389/fbirs.2024.1370918/full#supplementary-material
Ashmole N. P. (1962). The Black Noddy Anous tenuirostris on Ascension Island. Part 1. General biology. Ibis 103, 235–273. doi: 10.1111/j.1474-919X.1962.tb07246.x
Bate T. C., Ryan P. G., Underhill L. G. (2023). Primary moult in the annual cycle of adult African Oystercatchers Haematopus moquini. Ostrich 94, 258–265. doi: 10.2989/00306525.2023.2250560
Cade B. S., Noon B. R. (2003). A gentle introduction to quantile regression for ecologists. Front. Ecol. Environ. 1, 412–420. doi: 10.1890/1540-9295(2003)001[0412:AGITQR]2.0.CO;2
De Beer S. J., Lockwood G. M., Raijmakers J. H. F. A., Raijmakers J. M. H., Scott W. A., OsChadleus H. D., et al. (2000). SAFRING bird ringing manual. ADU Guide 5, 1–102.
De la Hera I., Díaz J. A., Pérez-Tris J., Luis Tellería J. (2009). A comparative study of migratory behaviour and body mass as determinants of moult duration in passerines. J. Avian Biol. 40, 461–465. doi: 10.1111/j.1600-048X.2008.04689.x
Dietz M. W., Rogers K. G., Gutiérrez J. S., Piersma T. (2015). Body mass and latitude both correlate with primary moult duration in shorebirds. Ibis 157, 147–153. doi: 10.1111/ibi.12185
Dunning J. B. Jr (Ed.) (2008). CRC handbook of avian body masses (2nd edn) (Boca Raton, Florida, USA: CRC Press).
Erni B., Bonnevie B. T., OsChadleus H.-D., Altwegg R., Underhill L. G. (2013). moult: An R package to analyse moult in Birds. J. Stat. Softw. 52, 1–23. doi: 10.18637/jss.v052.i08
(2022) IOC World Bird List v12.1. Available online at: https://www.worldbirdnames.org/new/bow/ (Accessed 16 May 2022).
Hijmans R. J., Karney C., Williams E., Vennes C. (2022) Geosphere: spherical trigonometry. R package version 1.5-18. Available online at: https://CRAN.R-project.org/package=geosphere.
Jackson C. H. W. (2017). The moult and migration strategies of Lesser Sand Plover, Greater Sand Plover and Terek Sandpiper. Cape Town, South Africa: University of Cape Town, South Africa.
Jackson C. H. W., Underhill L. G. (2022). Primary moult strategies in adult migrant waders (Charadrii). Wader Study 129, 76–87. doi: 10.18194/ws
Kilmer J. T., Rodríguez R. L. (2016). Ordinary least squares regression is indicated for studies of allometry. J. Evol. Biol. 30, 4–12. doi: 10.1111/jeb.12986
Koenker R. (2005). Quantile regression (Cambridge: Cambridge University Press). doi: 10.1017/CBO9780511754098
Koenker R. (2023) quantreg: Quantile regression. R package version 5.95. Available online at: http://CRAN.R-project.org/package=quantreg.
Morrison C. A., Baillie S. R., Clark J. A., Johnston A., Leech D. I., Robinson R. A. (2015). Flexibility in the timing of post-breeding moult in passerines in the UK. Ibis 157, 340–350. doi: 10.1111/ibi.12234
Nwaogu C. J., Cresswell W. (2021). Local timing of rainfall predicts the timing of moult within a single locality and the progress of moult among localities that vary in the onset of the wet season in a year-round breeding tropical songbird. J. Ornithol. 162, 265–276. doi: 10.1007/s10336-020-01825-1
R Core Team (2019). R: A language and environment for statistical computing (Vienna, Austria: R Foundation for Statistical Computing). Available at: https://www.R-project.org/.
Remisiewicz M., Tree A. J., Underhill L. G., Gustowska A., Taylor P. B. (2009). Extended primary moult as an adaptation of adult Wood Sandpipers Tringa glareola to their use of freshwater habitats of southern Africa. Ardea. 97, 271–280. doi: 10.1371/journal.pbio.1000132
Remisiewicz M. (2011). The flexibility of primary moult in relation to migration in Palaearctic waders – an overview. Wader Study Group Bull. 118, 163–174.
Rohwer S., Ricklefs R. E., Rohwer V. G., Copple M. M. (2009). Allometry of the duration of flight feather molt in birds. PloS Biol. 7, e1000132. doi: 10.1371/journal.pbio.1000132
Round P. D., Gale G. A., Nimnuan S. (2012). Moult of primaries in Long-toed Stints (Calidris subminuta) at a non-breeding area in Thailand. Ring. Migr. 27, 32–37. doi: 10.1080/03078698.2012.691344
Scott T. (2023). A contribution to understanding the primary moult of birds. Cape Town, South Africa: University of Cape Town, South Africa.
Scott T., Raijmakers J. M. H., Underhill L. G. (2023a). The primary moult of adult Red-headed Finches Amadina erythrocephala. Ostrich 94, 278–291. doi: 10.2989/00306525.2023.2265571
Scott T., Scholer M., Melville D. S., Underhill L. G. (2023b). Timing and duration of primary moult in New Zealand’s silvereye (tauhou, Zosterops lateralis). Notornis 70, 97–110.
Scott T., Underhill L. G., Underhill G. D. (2023c). Primary moult of adult Laughing Doves Spilopelia Senegalensis: introduction of the relative duration index and a comparison of moult indices. Ostrich 94, 266–277. doi: 10.2989/00306525.2023.2255749
Silveira M. B., Marini MÂ. (2012). Timing, duration, and intensity of moult in birds of a neotropical savanna in Brazil. Condor 114, 435–448. doi: 10.1525/cond.2012.110022
Taylor A. R., Lanctot R. B., Holmes R. T. (2018). “An evaluation of 60 years of shorebird response to environmental change at Utqiaġvik (barrow), Alaska,” in Trends and traditions: Avifaunal change in western North America. Studies of western birds 3. Eds. Shuford W. D., Gill R. E. Jr., Handel C. M. (Western Field Ornithologists, Camarillo, California), pp 312–pp 330.
Underhill L. G. (1999). Avian demography: statistics and ornithology. Ostrich 70, 61–70. doi: 10.1080/00306525.1999.9639750
Underhill L. G., Zucchini W. (1988). A model for avian primary moult. Ibis 130, 358–372. doi: 10.1111/j.1474-919X.1988.tb08810.x
Keywords: bird ringing, citizen science, latitude, annual cycle, quantile regression
Citation: Scott T and Underhill LG (2024) Global review of quantitative studies of primary moult of birds using the Underhill-Zucchini moult model. Front. Bird Sci. 3:1370918. doi: 10.3389/fbirs.2024.1370918
Received: 15 January 2024; Accepted: 10 April 2024;
Published: 24 April 2024.
Edited by:
Michael Wink, Heidelberg University, GermanyReviewed by:
Reuven Yosef, Ben-Gurion University of the Negev, IsraelCopyright © 2024 Scott and Underhill. This is an open-access article distributed under the terms of the Creative Commons Attribution License (CC BY). The use, distribution or reproduction in other forums is permitted, provided the original author(s) and the copyright owner(s) are credited and that the original publication in this journal is cited, in accordance with accepted academic practice. No use, distribution or reproduction is permitted which does not comply with these terms.
*Correspondence: Tanya Scott, dGFueWFzY290dC56YUBnbWFpbC5jb20=
Disclaimer: All claims expressed in this article are solely those of the authors and do not necessarily represent those of their affiliated organizations, or those of the publisher, the editors and the reviewers. Any product that may be evaluated in this article or claim that may be made by its manufacturer is not guaranteed or endorsed by the publisher.
Research integrity at Frontiers
Learn more about the work of our research integrity team to safeguard the quality of each article we publish.