 Cameron Ho1,2*
 John M. Marzluff2
 Daniel R. Stahler1
 Douglas W. Smith1Thomas Mueller3,4Martin Wikelski5,6
 Kamran Safi5,6
 Matthias-Claudio Loretto5,6,7,8*
- 1Yellowstone Center for Resources, National Park Service, Yellowstone National Park, WY, United States
- 2School of Environmental and Forest Sciences, University of Washington, Seattle, WA, United States
- 3Senckenberg Biodiversity and Climate Research Centre (SBiK-F), Frankfurt am Main, Germany
- 4Department of Biological Sciences, Johann Wolfgang Goethe-University Frankfurt, Frankfurt am Main, Germany
- 5Department of Migration, Max-Planck Institute of Animal Behavior, Radolfzell, Germany
- 6Department of Biology, University of Konstanz, Konstanz, Germany
- 7Ecosystem Dynamics and Forest Management Group, School of Life Sciences, Technical University of Munich, Munich, Germany
- 8Berchtesgaden National Park, Berchtesgaden, Germany
Anthropogenic food subsidies can alter ecosystem processes, such as competition, predation, or nutrient transfer, and may strongly affect protected areas. Increasing recreation and ecotourism often create food subsidies, especially in the surrounding lands through fast-growing gateway communities. How the effects of these subsidies extend into protected areas when animals move across boundaries remains largely unexplored. We addressed this question by studying the movement and foraging of common ravens (Corvus corax), opportunistic scavengers that are well known to feed on predator kills and on anthropogenic food subsidies. We analyzed spatiotemporal data from 57 global positioning system (GPS)-tagged ravens, trapped within or close to Yellowstone National Park, to study their seasonal use of natural and anthropogenic food sources. Although Yellowstone National Park contains a full suite of native predators and ravens can be observed at virtually every kill site, we show that anthropogenic subsidies were utilized to a much greater extent than other natural resources, especially during winter. Important subsidies included gut piles of harvested game animals left by hunters, fat present on wastewater settling ponds, roadkill, and waste from agricultural and urban activities. These subsidies were distributed over vast areas beyond Yellowstone National Park. During fall/winter, ravens traveled longer distances (21.9 vs. 13 km) and spent more time outside Yellowstone National Park (73% of GPS points outside), mostly feeding on anthropogenic subsidies, than in spring/summer (42% of GPS points outside). This difference between seasons was more pronounced for individuals holding territories within the protected area than for those without territories. The large area over which ravens used anthropogenic food subsidies (within more than 100 km of Yellowstone National Park) affects the park’s raven population and the scavenging services they provide. We suggest that the scale of resource use must be considered by managers seeking to control expanding raven populations elsewhere.
Introduction
Humans, globally, create food subsidies for animals (Oro et al., 2013), which are often more attractive to animals than natural resources as they are highly predictable in space and time (Bartumeus et al., 2010; Cortes-Avizanda et al., 2012). Such subsidies can shift the trophic structure of ecosystems by supplementing a select subset of the entire species pool. Opportunistic and facultative scavengers (e.g., cockroaches, rats, foxes, gulls, and corvids), in particular, frequently take advantage of anthropogenic subsidies; this leads to better body condition, reproductive output, survival, and population growth (Marzluff and Neatherlin, 2006; Bartumeus et al., 2010; Cortes-Avizanda et al., 2012). The changes in resource distribution and their exploitation by opportunist species can affect communities, food webs, and ecosystems by altering competition within and between species, predator–prey interactions, and the transfer of nutrients between areas (Carey et al., 2012; Oro et al., 2013).
Such changes in an ecosystem are particularly problematic when they affect protected areas intended to maintain global biodiversity (Watson et al., 2014). When pristine and intact ecosystems are confronted with high human population densities and the subsidies they introduce, their conservation value may decrease or even be eradicated (Hansen and Defries, 2007). This is a growing issue, as recreation and ecotourism attract increasingly large numbers of visitors to protected areas (Wittemyer et al., 2008; Martinuzzi et al., 2015). In the surrounding lands of these protected areas, gateway communities are expanding with intensified land use, exploitative wildlife management practices (e.g., hunting), and growing ecotourism with associated accommodations and infrastructure (e.g., picnic areas, waste treatment facilities, and campgrounds) (Marzluff and Neatherlin, 2006; Wittemyer et al., 2008; Martinuzzi et al., 2015; Brunk et al., 2021). These changes in land use and increased human activity consequently reduce the effective size of the protected areas (Hansen and Defries, 2007).
Common ravens (Corvus corax, hereafter raven) are food generalists and facultative scavengers, which are highly adept at exploiting anthropogenic subsidies (Ratcliffe, 1997; Kristan and Boarman, 2003). Vagrant ravens that are juveniles, immatures, and adults without breeding partners or territories can range widely to forage (Loretto et al., 2016; Marzluff et al., 2021) during their nomadic life stage. In contrast, territorial ravens are resident and defend land year-round (Heinrich, 1988). Access to food varies between individuals, with territorial birds dominating vagrants (Marzluff and Heinrich, 1991) and males usually dominating females (Braun and Bugnyar, 2012). Ravens have a diverse natural diet consisting of carrion (often produced by large predators), small mammals, invertebrates, birds, eggs, amphibians, fish, and plants (Nelson, 1934). They also take advantage of ephemeral anthropogenic resources such as roadkill and offal left by hunters (Heinrich, 1988; Wilmers et al., 2003a). Throughout the year, but especially in winter, ravens are known to feed on large and permanent anthropogenic subsidies frequently, such as landfills, waste treatment centers, and discards in agricultural and urban areas (Webb et al., 2011; Loretto et al., 2017; Harju et al., 2018; Jain et al., 2022). These anthropogenic resources typically lead to high densities of ravens in the surrounding lands and an increasing population overall (Marzluff et al., 1994). High densities of ravens can pose an additional threat to already endangered species through their predation on eggs or juveniles [e.g., desert tortoise (Gopherus agassizii) Kristan and Boarman, 2003; greater sage-grouse (Centrocercus urophasianus) Coates and Delehanty, 2010; snowy plover (Charadrius nivosus) Hardy and Colwell, 2012; Steller’s eider (Polysticta stelleri) USDI FWS, 2003]. Understanding the reliance of ravens on anthropogenic as compared with natural resources improves our understanding of raven population dynamics and can suggest sustainable avenues through which their population growth can be curbed (Marzluff et al., 2021).
The aim of this study was to investigate the use of natural foods and anthropogenic subsidies in the surrounding lands of a protected area and to document the extent to which such use influenced the movements of ravens. We analyzed ravens’ resource use within and outside Yellowstone National Park, the centerpiece of the Greater Yellowstone Ecosystem (GYE). The GYE is considered one of the few reasonably intact temperate ecosystems on earth and contains a full suite of native carnivores (Noss et al., 2002). Since the reintroduction of wolves in Yellowstone National Park in 1995, their activity has led to carrion being more abundant, and available for consumption by ravens for longer periods of time (Wilmers et al., 2003a; Wilmers et al., 2003b). Observational studies suggest that ravens frequently associate with wolves even in the absence of carrion (Stahler et al., 2002) and that predators help to stabilize raven populations (Walker et al., 2018). However, the same area has an expanding human presence through the growth of gateway communities and park visitation (https://irma.nps.gov/STATS/Reports/Park), and thus increasing anthropogenic food subsidies (Wilmers et al., 2003a; Wilmers et al., 2003b). In this study, for the first time, we quantified ravens’ use of anthropogenic and natural resources at the individual level within a large, protected area and its surrounding lands. We expected ravens to primarily feed on natural food sources due to the large size of Yellowstone National Park (≈ 9,000 km²), with its high density of ungulates and predators leading to frequently available carcasses. As anthropogenic subsidies cannot be monopolized by single individuals, we predicted that ravens of low social rank (i.e., vagrants and females) would use these resources more often than dominant individuals (i.e., territorials and males). We also expected a seasonal difference in foraging behavior given the varying abundance of certain food types over the year (e.g., insects, small mammals, winter kills, and gut piles left by hunters during hunting seasons).
Methods
Study area and data collection
We studied ravens in the GYE, which includes a mix of federal and private land, wilderness, natural areas managed for recreation and resource extraction, agriculture, and a full spectrum of exurban to urban settlements. Since the natural recolonization of cougars (Puma concolor) in the 1980s, followed by the reintroduction of gray wolves (Canis lupus) in the mid-1990s, the predator community has been restored, and the flow of carrion to scavengers has increased (Wilmers and Getz, 2004; Ruth et al., 2019). For this study, we used an extensive dataset on the spatial and temporal position of carcasses, their usage by large carnivores, and the probable cause of death. These data were gathered by the Yellowstone Wolf and Cougar Projects (see e.g., Metz et al., 2012), for which wolves and cougars are monitored throughout the year by both aerial and ground surveys with assistance from GPS tracking and very high-frequency (VHF) collars to assess their kill rate and prey selection. During the winter study period (annually each November 15th to December 15th and throughout March), carcasses used by wolves were detected using three independent methods. Ground observation teams tracked a subset of wolf packs during daylight hours. Aerial observations of packs were made from a fixed-wing aircraft as weather allowed. Ground search teams visited clustered locations using data from GPS-collared wolves to search for possible kills (for details on these methods, see Metz et al., 2012; Smith et al., 2020). Cougar kill detection relied on data from GPS-collared cougars following similar cluster location methods described for wolves.
To study the movements and foraging behavior of ravens, we captured ravens in Yellowstone National Park and the surrounding area between October 2019 and March 2020 using remote-controlled net launchers (Coda Enterprises, Ltd.). We usually set up the net launcher before sunrise or during the day when ravens were absent and camouflaged it with local material (e.g., grass, twigs, snow, and waste). We used a variety of baits (carrion, including roadkill, winter kill, and predator kills, and also anthropogenic food). Ravens used in this study were trapped at 16 different locations (11 of which were inside Yellowstone National Park), and it often took hours or even several days before ravens landed in front of the trap. We fitted solar-powered GPS transmitters (e-obs GmbH; Bird Solar UMTS, 25 g) on ravens as backpacks with a Teflon harness (after Buehler et al., 1995) that weighed 35–37 g (i.e., 3.1%–3.7% of the raven’s body mass). The GPS transmitters recorded data between approximately sunrise and sunset at 30-minute intervals with fully charged batteries (i.e., above 3,900 mV), at 1-hour intervals with a lower battery voltage (i.e., below 3,900 mV), and temporarily stopped GPS data collection when the voltage was extremely low (i.e., below 3,700 mV). The data were downloaded using a short-range radio receiver or via the cellular network and stored on Movebank, a database for animal tracking data (www.movebank.org ). We used software R version 4.1.1 (Development Core Team, 2021) for data processing and analysis.
We determined sex by the genetic analysis of blood samples (n = 53; Avian DNA Sexing Test conducted by www.healthgene.com ) or breeding behavior (n = 4; only females incubate eggs; Ratcliffe, 1997; Bedrosian et al., 2008). We determined territorial status by inspecting each individual’s distribution of GPS locations. Territorial ravens rarely venture far from their regularly used breeding and roosting sites, regardless of the time of year (Webb et al., 2011). During the breeding season (April–July), this pattern can be easily detected when mapping the data, as territorial ravens typically use much smaller spaces than vagrant ravens (Webb et al., 2011). We identified 18 individuals as territorial and could confirm breeding in most cases (n = 15). Vagrant individuals (n = 39) follow a nomadic lifestyle, that is, they frequently change night roosts and do not show any homing behavior (see also Loretto et al., 2017; Harju et al., 2018; Marzluff et al., 2021).
We analyzed location data collected between October 2019 and February 2021. As we occasionally collected GPS locations at night, or with a higher sampling rate, we removed locations between dusk and dawn, as defined by the R package “suncalc” for the geographical location and time of year (Thieurmel and Elmarhraoui, 2019), and subsampled the dataset to ensure that no locations of the same individual were obtained within 28 min of each other.
Defining foraging events
We defined “foraging events” as spatiotemporal locations where ravens accumulated and/or paused at known food sources. We acknowledge that all ravens present at such resources may not be actively eating (consuming or handling food items), and may be instead waiting to eat, or resting after eating. However, based on extensive observations of foraging ravens [e.g., those in the studies by Marzluff and Heinrich (1991); Marzluff et al. (1996); Marzluff and Neatherlin (2006); Loretto et al. (2016), and Beck et al. (2020)] we are confident that the ravens present at the food resources were foraging (i.e., eating, searching for food, caching food, socializing after eating, or waiting to access food). We located foraging events by examining the GPS positions of ravens that indicated prolonged food resource use during daylight hours. At a minimum, a foraging event had one raven, and took place for at least 1 hour over three consecutive GPS points (Anderson and Lindzey, 2003) that were restricted to a single landcover type (e.g., grass, forested, or human-developed area). We plotted the GPS data with corresponding timestamps in Google Earth (© 2021 Google LCC) and described each foraging event based on visual inspection of the surrounding landscape on the 2014–2020 Google Earth images, the pattern of the GPS points, and observations made in the field.
We distinguished between foraging events at “point resources” and “dispersed resources.” Point resources had a clear center of activity that was marked by a single point with a high density of raven GPS locations that decreased with increased distance from the center (Figures 1A, C, E). We verified a subset of these foraging events with direct observation and inferred that all point resource sites included one of the following food sources: carcasses provided by predators and other natural causes, carcasses of domestic stock in agricultural areas, hunter offal (hereafter referred to as gut piles), or roadkill. We confirmed the point resources by direct observation and from the occurrence of GPS-collared predators. All foraging events that we classified as “wolf kill” were confirmed by direct observation, that is, examination of the kill site to determine the cause of death, or the appearance of wolf GPS points before the arrival of tagged raven GPS points. We confirmed “other carcass sites” by direct observation and using the GPS-tracking data of cougars and other predators (this category included predation by bears and cougars, and also ungulates that had died of non-predatory natural causes and were discovered by ravens before collared predators), ungulates with an unknown cause of death, or carcasses that were moved from within Yellowstone National Park to one of seven carcass dump sites by National Park Service employees. Our assessment of roadkill was biased toward larger mammals because small mammals [e.g. Uinta ground squirrels (Urocitellus armatus), which are abundant in summer] are usually consumed quickly or carried away from the road. We inferred that there was additional use of these resources if there was a particularly high number of ravens in hunting areas, within 10 meters of a road, waste processing facilities, recreational sites, or at a ranch (Appendix A, Supplementary Table 1). We identified ranches by using Google Earth imagery to locate buildings, fences, or cattle shadows (Mateo-Tomás et al., 2015). We defined hunting areas within the Montana Department of Fish, Wildlife, and Parks hunting zones within legal hunting seasons.
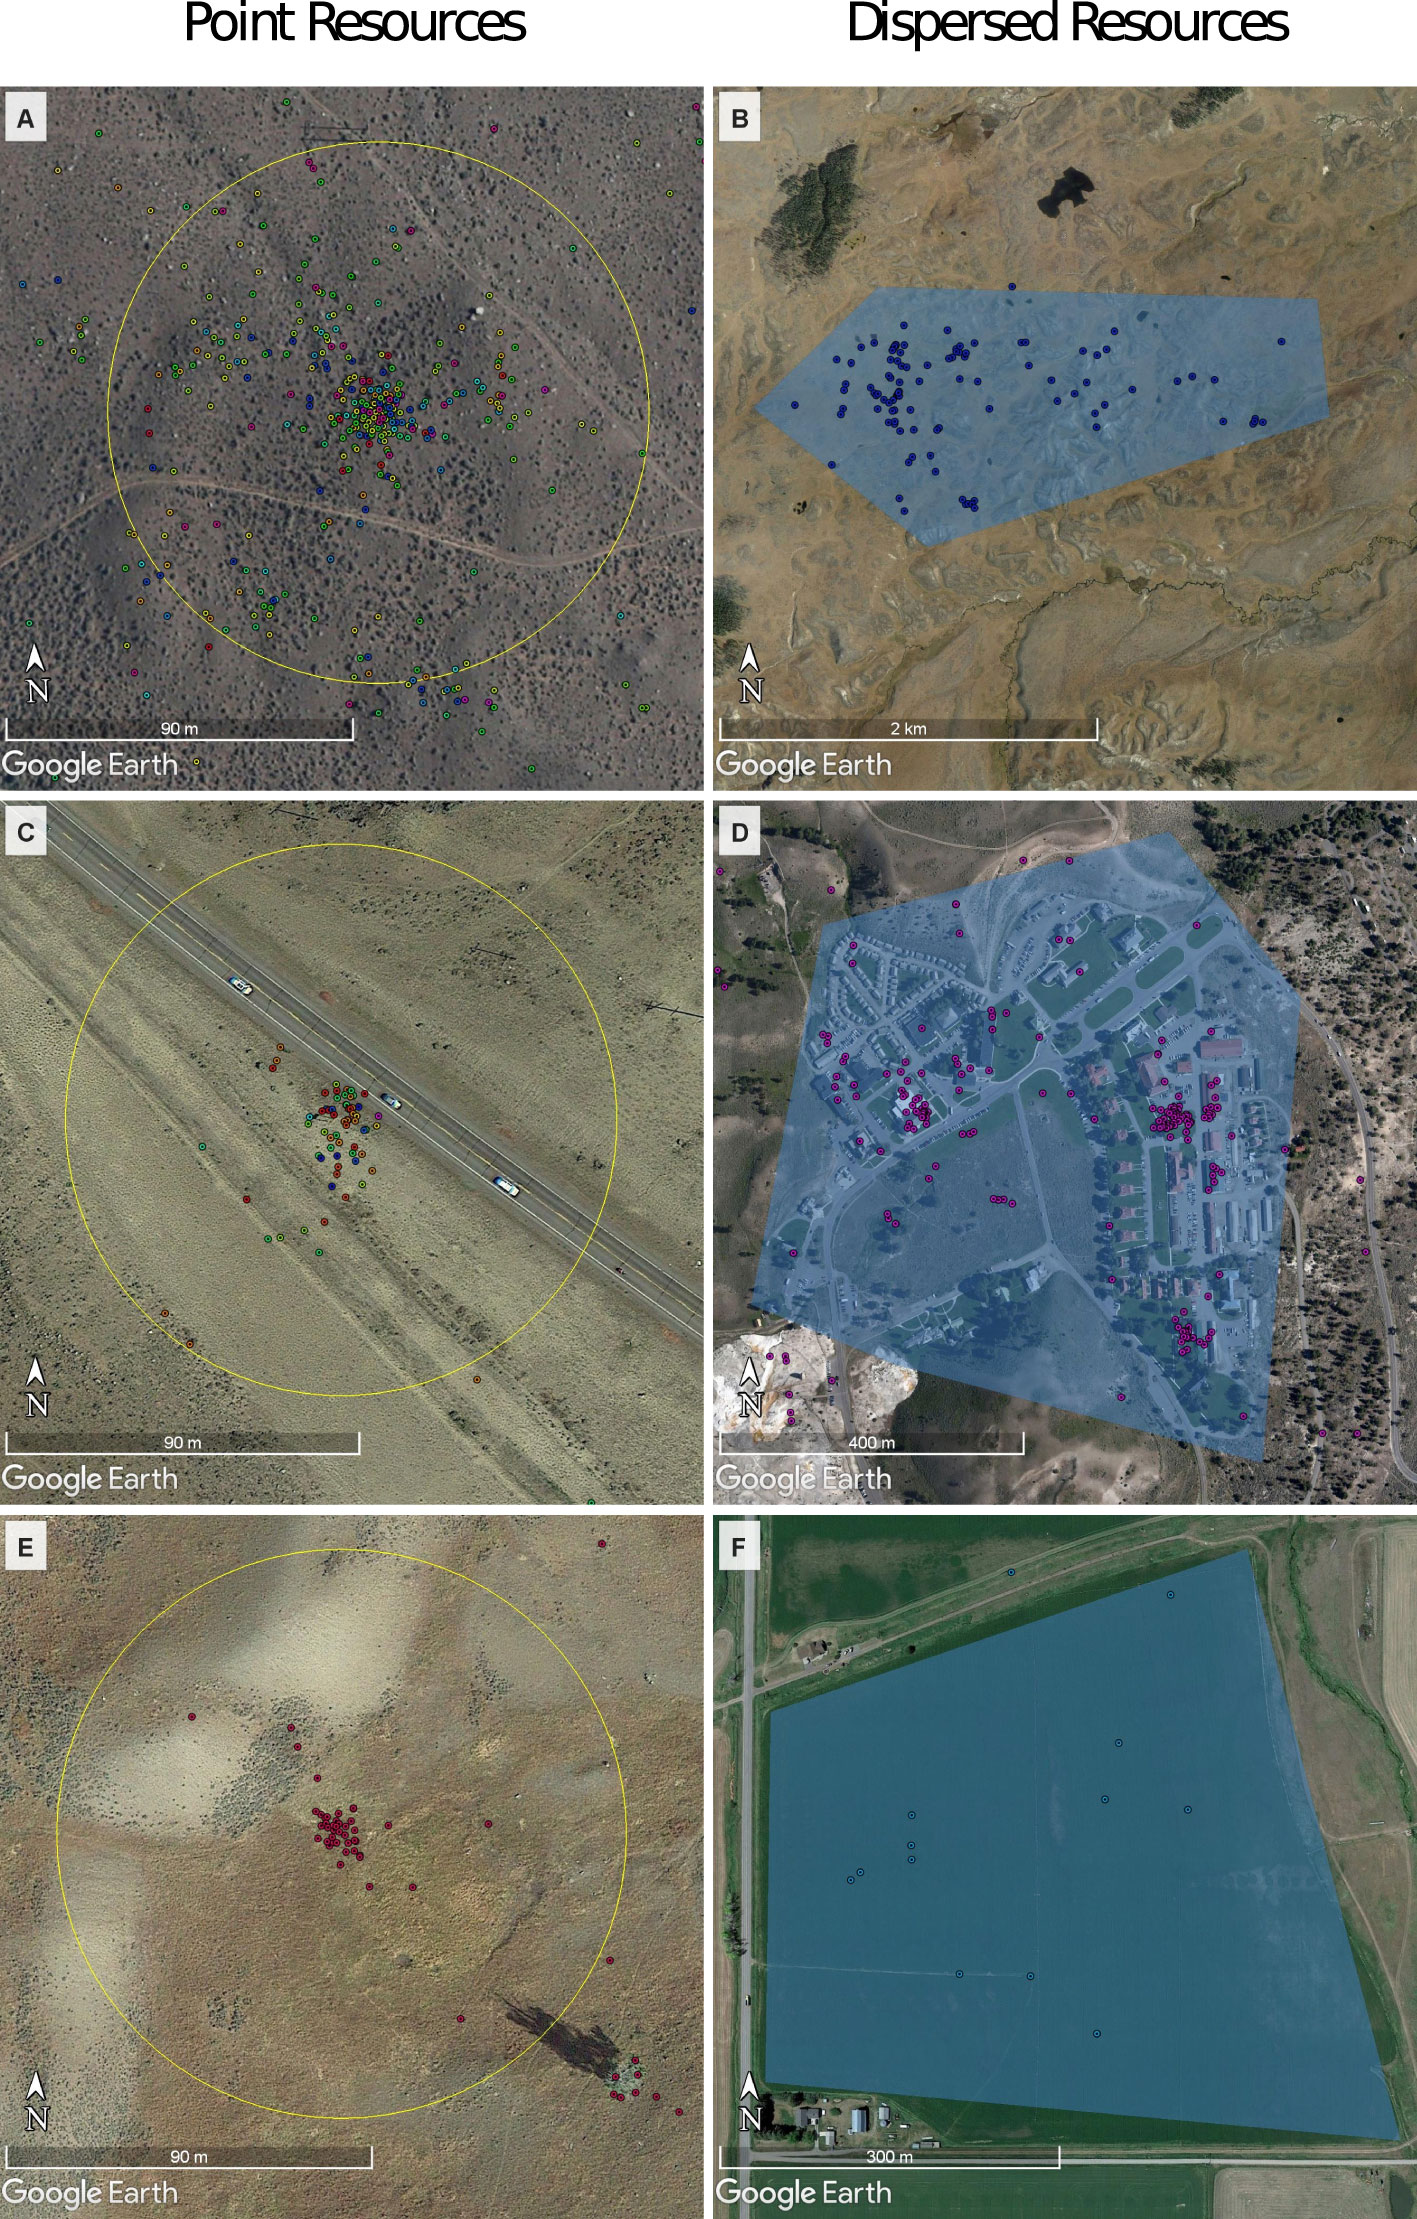
Figure 1 Examples of raven GPS locations (points) at point and dispersed resources as screen shots from Google Earth Imagery 2021 Version 7.3.4.8248. Point resource range (70 m) is represented by the yellow circle in (A) gut pile, (C) roadkill, and (E) wolf kill. Dispersed resource outlines are represented by the blue polygons and are much larger in size (see also different scale bars in the images). Examples for dispersed resources are shown in (B) natural dispersed resource, (D) anthropogenic dispersed resource, and (F) agriculture. GPS, global positioning system.
In contrast to “point resources,” we defined “dispersed resources” as places where ravens foraged without gathering or pausing at a well-defined focal point (Figures 1B, D, F). These included congregations of ravens dispersed within natural or developed areas. We spent 517 minutes between April and September 2021 conducting focal observations (Altmann 1974) on individual ravens to confirm that dispersed behavior at natural sites was associated with foraging. During these observations, we selected a bird at random and followed its behavior, noting each time it obtained a food item (the food was either visible or the feeding maneuver was identified by characteristic head tipping and swallowing), how it obtained food, and, where possible, what food item was obtained.
We classified our certainties that ravens were foraging at resources as being “confirmed”, “probable”, or “unsure”. Allocation to each of these categories was based on prior knowledge and the presence of definitive features (Appendix B, Supplementary Table 2). A “confirmed” event occurred at a location where we observed ravens eating an identifiable food. Our identification of feeding resulted from the direct observation of tagged or untagged ravens at that location. For example, we were able to confirm 100% of the foraging events at wolf kills because we directly observed the food item (carrion or wolf fecal waste) and tagged ravens (GPS points) at all sites. In contrast, we confirmed eating, mostly by untagged ravens, at only a small percentage of sites that we classified as dispersed natural foraging locations due to the large number of sites and the difficulty of accessing such areas. If we were less certain about a likely foraging event, we classified it as “probable.” Probable sites were those with distinctive GPS point distributions in areas with landcover that suggested a likely, unconfirmed resource type. For example, a cluster of raven locations in the backcountry of Yellowstone National Park would likely occur at carrion (“other carcass” category), but may also result from a short-lived anthropogenic food source (e.g., hiker picnic spot). We identified a small number of raven gatherings at sites indicative of foraging (n = 214, point and dispersed concentrations) that we could not clearly associate with a resource type. These “unsure” locations, for example, may have resulted from dispersed GPS points in a large stand of trees in the middle of cropland. At such sites, we were unsure if agricultural or natural (e.g., insects in the trees) resources were being exploited.
After defining 2,557 foraging events, we selected all GPS points within 70 m of point resources (a radius chosen from visual inspection of GPS data at foraging events; Figures 1A, C, E) or within the boundaries of the polygons delimiting dispersed resources (Figures 1B, D, F) that occurred during the time of resource use by tagged ravens (i.e., from the first to the last GPS point at a resource). We then removed points that occurred simultaneously in two or more foraging events (Appendix C; Supplementary Figure 1). To account for variation in the type of food items and their use within resource categories (Appendix A, Supplementary Table 1), we combined resources with similar characteristics for the analysis. We combined crop and ranching sites into “agriculture,” and landfill, water treatment pond, and dispersed foraging in urban areas into “waste,” given the high availability of human refuse in such areas. We categorized all naturally available carcasses except for those that were provided by or were closely associated with wolves as “other carcass” (ncougar = 18, ngrizzly = 1, nwinter = 9, ncarcass dump = 21, nunknown = 377). Wolf kills (nwolf = 157) were grouped separately due to our interest in the usage of wolves as a specific resource for ravens given records of their interactions (Stahler et al., 2002).
Individual raven characteristics and resource diversity
We investigated the diversity of raven diets by relating an individual’s Shannon diversity index value (k = 7 resource categories) to its sex and territorial status using a generalized linear model with a gamma error distribution.
Seasonal variation in raven resource usage
We investigated the effects of season on the proportion of (1) an individual raven’s GPS points, and (2) all GPS-tagged ravens in each resource category. We defined seasons as spring/summer (April–September; hereafter, this will be referred to as summer) and fall/winter (October–March; hereafter, this will be referred to as winter), thereby accounting for the hunting season (late October through March) and vegetative phenology in the park (greenup begins in April). For the first method, we did not include individuals with less than 100 GPS points in a particular season. For each resource category we used a separate generalized linear mixed model (GLMM) with a beta-binomial error structure (glmmTMB; Brooks et al., 2017), which allowed us to account for overdispersion and differences in the number of tagged birds between seasons (nOctober–March = 57, nApril–September = 50; change in numbers reflects mortality and tag failure). For the second method, we examined the proportion of individuals using each resource category in each season with a GLMM with a binomial error structure (lme4; Bates et al., 2015) while including an observation-level random effect to account for overdispersion as needed (in our case, for use of roadkill; Harrison, 2015). We also included the number of days that each foraging site was monitored to account for variability in sampling duration when more individuals were detected during longer foraging events.
Seasonal variation in ravens’ use of space
We investigated seasonal variation in ravens’ use of space using two different methods. First, we examined locations in relation to the boundaries of Yellowstone National Park. We used the R package “sf” (Pebesma, 2018) to determine the number of GPS points that fell within the boundaries of Yellowstone National Park and compared the numbers within and outside the park with a chi-squared contingency table test and post hoc testing, when applicable, using the R package “chisq.posthoc.test” (Ebbert, 2019). Second, we examined the average maximum daily displacement (i.e., the maximum distance between the first GPS point of an individual for each day and all other GPS points on the same day). We did not include individuals with less than 50 days of tracking in our calculations. We analyzed daily displacement with a Mann–Whitney U-test, which allowed for small samples and a non-normal distribution. We used both methods for two sample groups: territorial ravens that held territories within Yellowstone National Park boundaries, and vagrants that resided within the GYE. We performed these separate analyses to account for variations in use of space between breeding and non-breeding individuals (Webb et al., 2011; Harju et al., 2018). We confirmed the breeding status of all individuals in this analysis (by the direct observation of nests or family groups) to avoid confounding our results with the classification of territorial status inferred from movement patterns.
Individual raven characteristics and resource use
We investigated the effects of a raven’s sex and territorial status on their resource usage in each season using a Dirichlet regression (DirichletReg, Maier 2014). This technique allowed us to model the proportional use of multiple categories of food resources simultaneously. We used the alternative parameterization (Maier 2014), parameterizing the mean and precision, as suggested by Douma and Weedon (2019) for ecological data. We adjusted our alpha value using a Bonferroni correction (αBonferroni = 0.0042) to account for multiple comparisons. We modeled each season separately because the GLMMs models for each resource category showed a significant difference in resource usage by ravens between seasons. We used the null precision model because it had the lowest AIC, with roadkill as the reference category.
Results
Ravens and resources
We trapped and outfitted 57 ravens with GPS transmitters within Yellowstone National Park and the surrounding area (Appendix D, Supplementary Table 3), including a mixture of individuals of both sexes at different life stages (Appendix E, Supplementary Table 4). We identified 2,557 foraging events, representing a large variety of natural and anthropogenic resources (Figure 2), which took place on a variety of landcover types (Table 1; Appendix F, Supplementary Tables 5, 6). Most resources were used in a single land cover type, but gut piles were exploited in various anthropogenic and natural lands (Table 1; Appendix F, Supplementary Tables 5, 6). Ravens persisted at agricultural, waste, and natural dispersed resources for longer periods of time than at gut piles and carcasses (Appendix G, Supplementary Table 7). These foraging events were identified based on resource usage by any of the GPS-tagged ravens and thus do not represent the general availability of food in the GYE over the study period of 17 months. A sample of these foraging events was confirmed though direct observations (2.6%–100% of sites per resource category; Appendix H, Supplementary Table 8). We directly observed ravens feeding on gut piles, grease at water treatment ponds, garbage at dump sites, handouts from people at parking and recreational sites, carcasses of cattle at ranching operations, and road-killed elk (Cervus canadensis) and deer (mule, Odocoileus hemionus; white-tailed, Odocoileus virginianus). Within the developed areas (anthropogenic dispersed sites), we occasionally observed ravens raiding garbage containers, investigating litter, and displaying begging behavior for food directed at humans. During the total 517 minutes of focal observations on individual ravens in natural areas we directly observed ravens foraging for invertebrates, plant matter, and small animals (Appendix I, Supplementary Table 9).
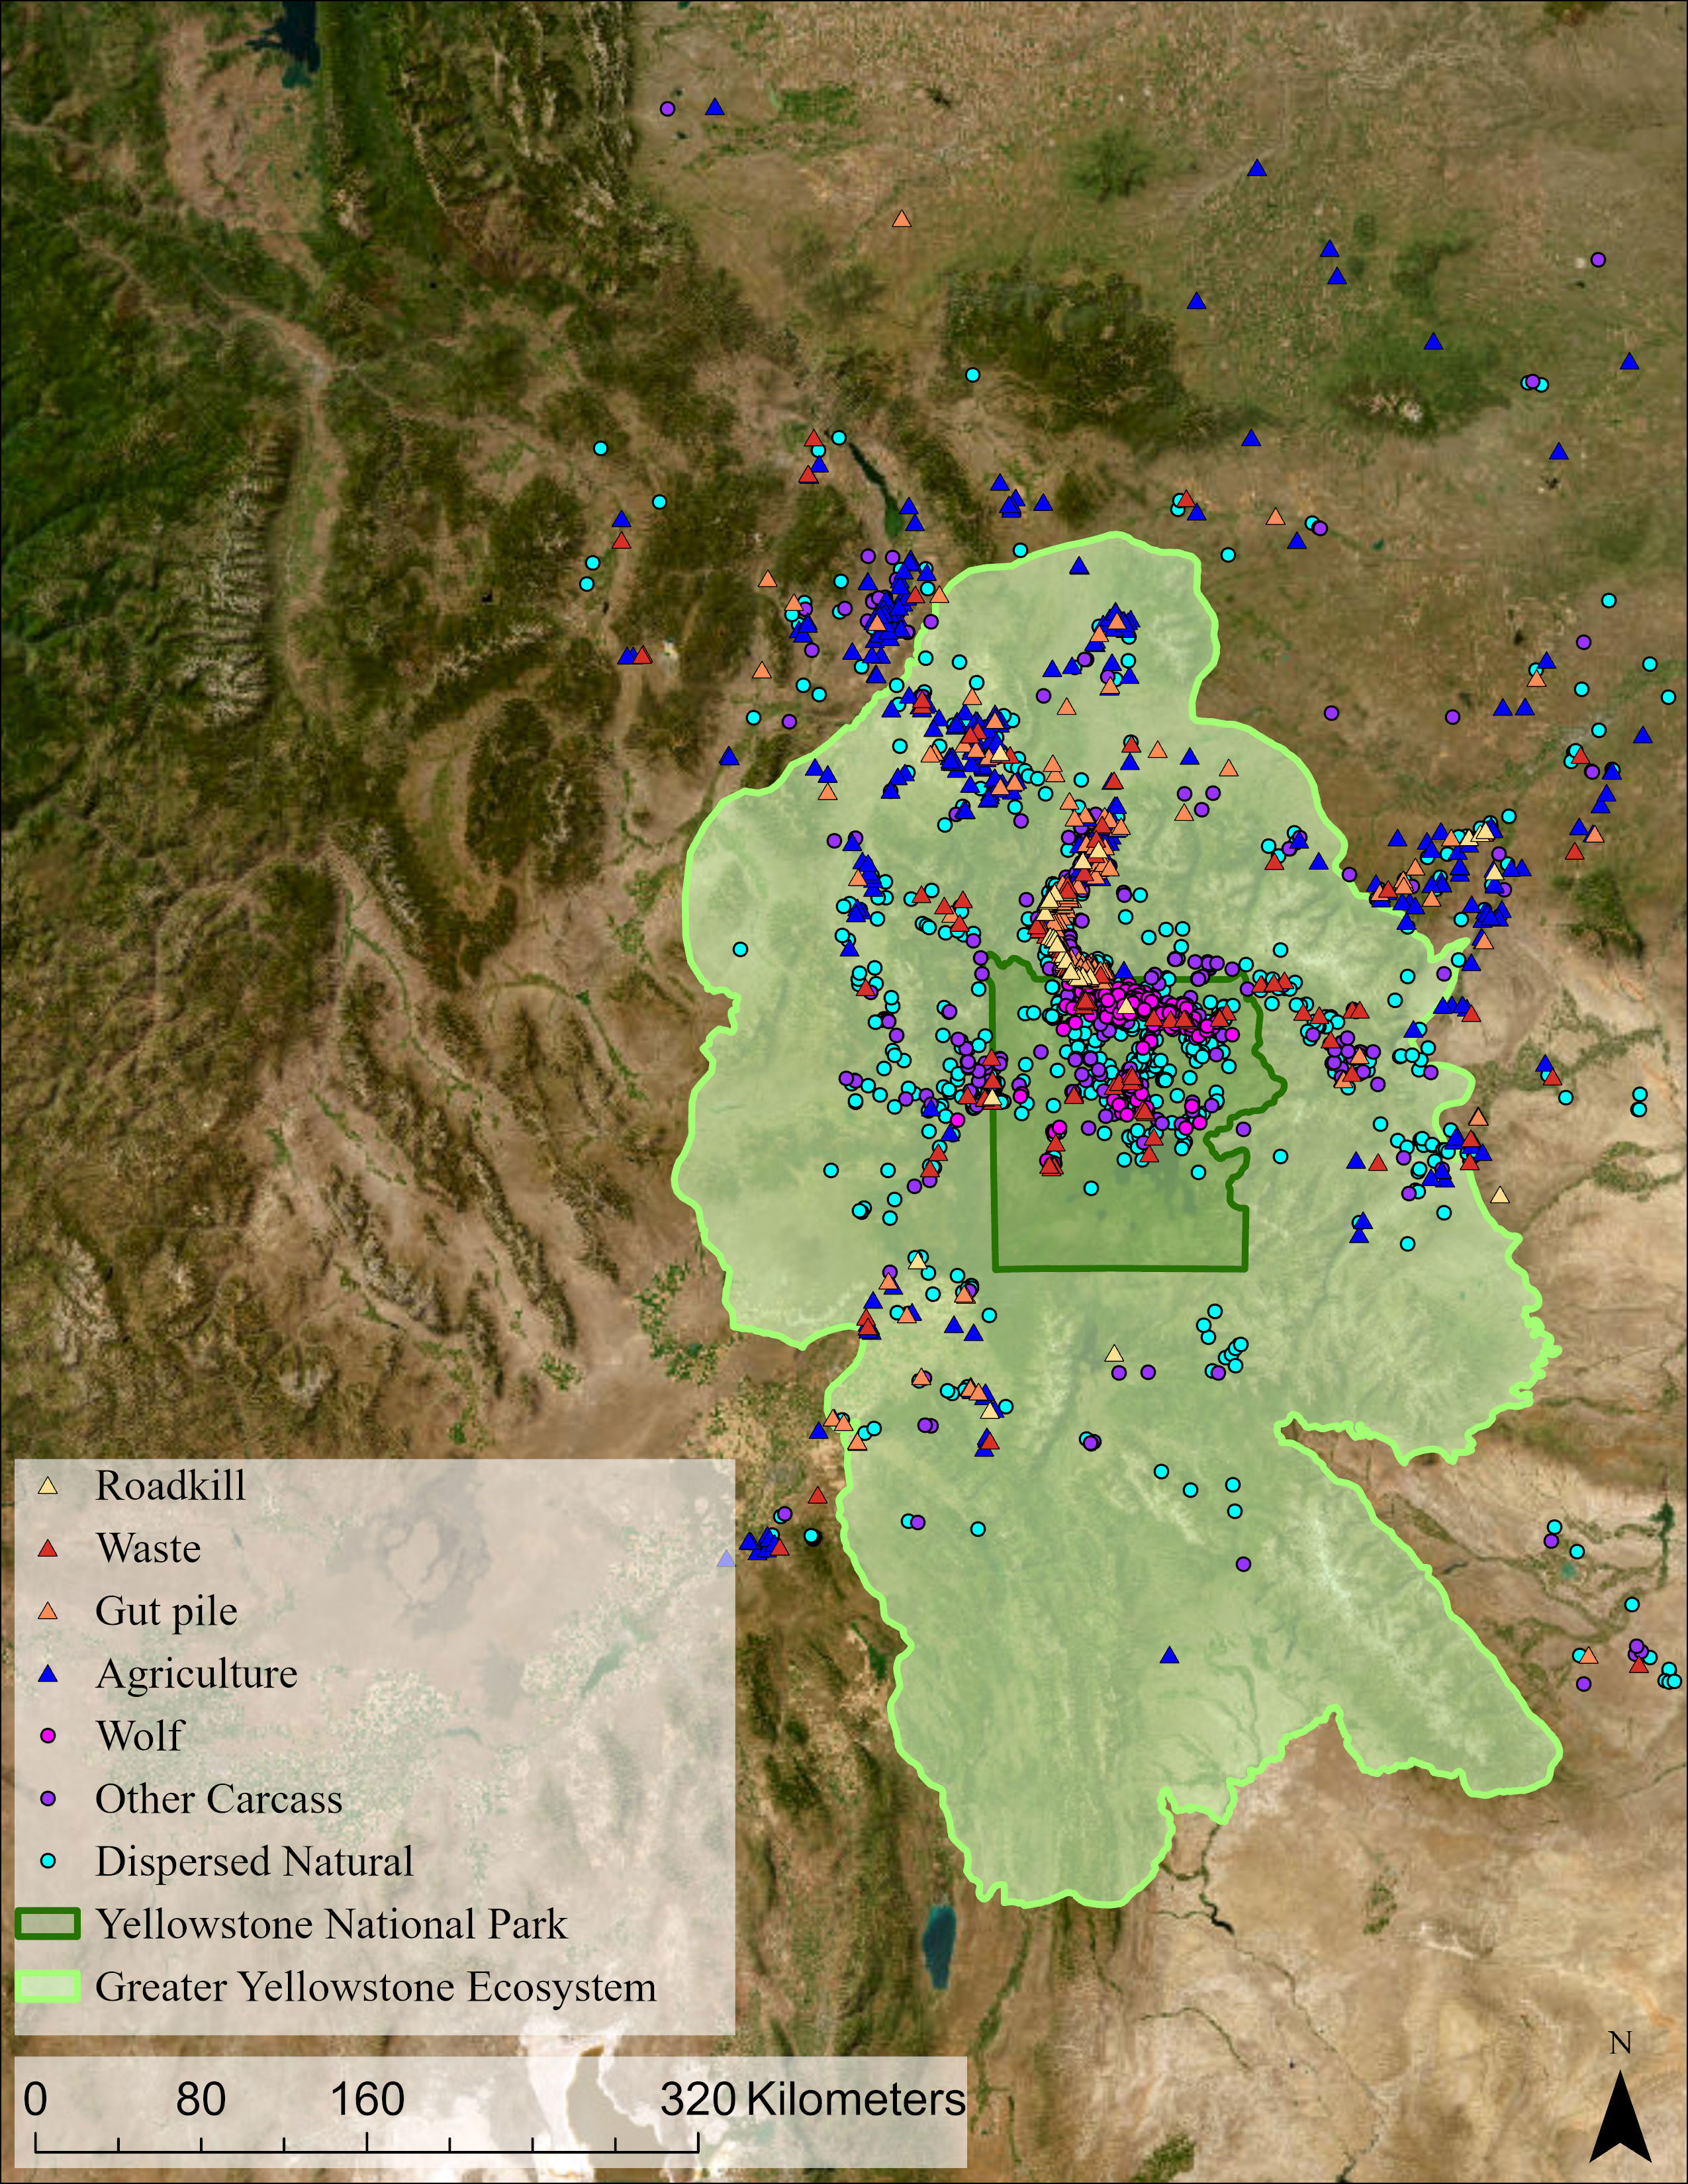
Figure 2 The foraging events of the GPS-tagged ravens that were identified in this study. The GYE and Yellowstone National Park are highlighted in shades of green. GPS, global positioning system; GYE, Greater Yellowstone Ecosystem.
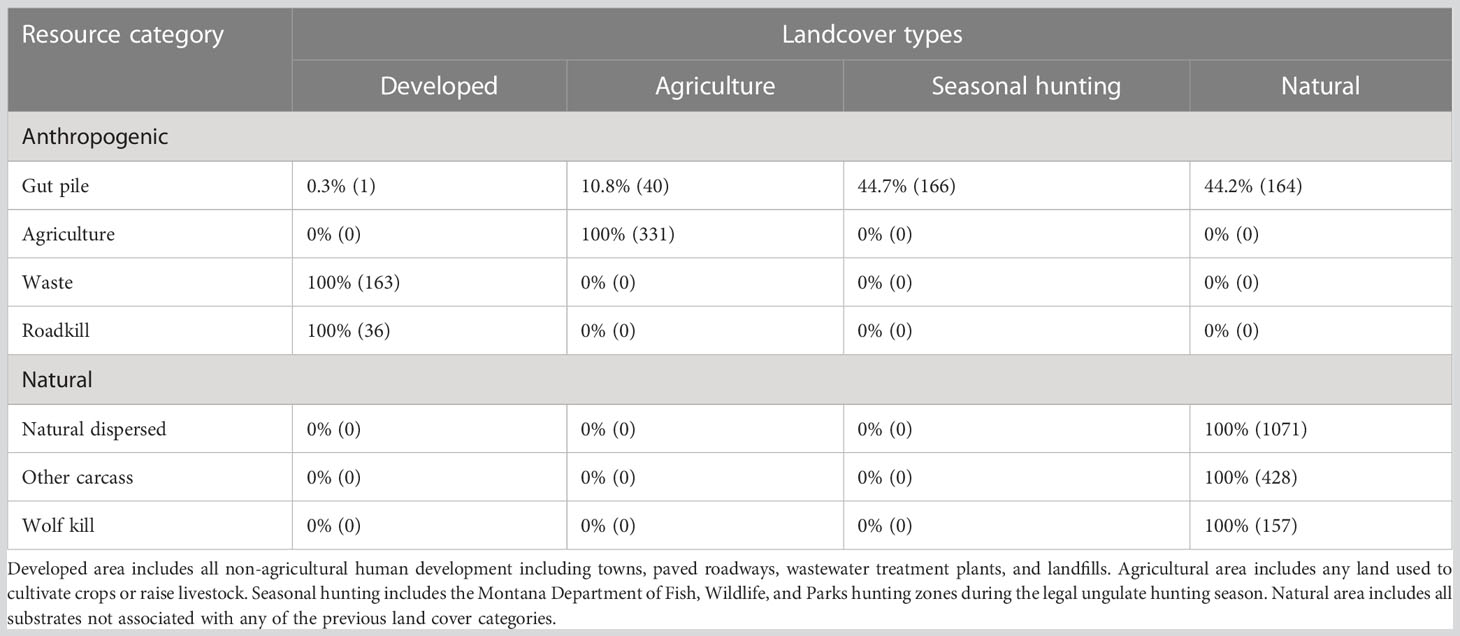
Table 1 Percentage of each foraging events present within different landcover types with the number of foraging events in parentheses.
General patterns of resource use
We investigated changes in resource use between seasons and individuals and we found large differences for both. During the winter, ravens foraged predominantly on anthropogenic resources (mean = 75.8% anthropogenic resource usage per individual, range 24.2%–98.6%; Figure 3), which significantly differed from their behavior in summer (χ2 = 3921.1, df = 1; p < 0.001), when ravens relied predominantly on natural resources (mean = 60.8% natural resource usage per individual, range 0%–99.6%; Figure 3). Ravens used agriculture, waste (including garbage, water treatment plants, and anthropogenic dispersed resources), and other carcasses frequently throughout the year (Appendix J, Supplementary Figure 2; Appendix K, Supplementary Table 10). Corresponding to the hunting seasons in the winter, ravens frequently fed on gut piles (24.69%) even more frequently than roadkill (1.53%) or wolf kills (3.35%; Figure 3; Appendix K, Supplementary Table 10). However, in the summer, ravens predominantly fed on natural dispersed resources (e.g., invertebrates) (Figure 3; Appendix I, Supplementary Table 9; Appendix K, Supplementary Table 10). Model results showed a seasonal difference for the proportion of GPS points at each food source (Figure 3; Appendix L, Supplementary Table 11), confirming different resource use in summer and winter. In addition, the proportion of individuals at each foraging event changed between seasons for waste, dispersed natural foods, and other carcasses, but not for gut piles, agriculture, roadkill, or wolf kills (Appendix L, Supplementary Table 12). Restricting the model to include only foraging events classified with a “confirmed” or “probable” certainty did not change the results of either of these models (Appendix M, Supplementary Tables 12, 13).
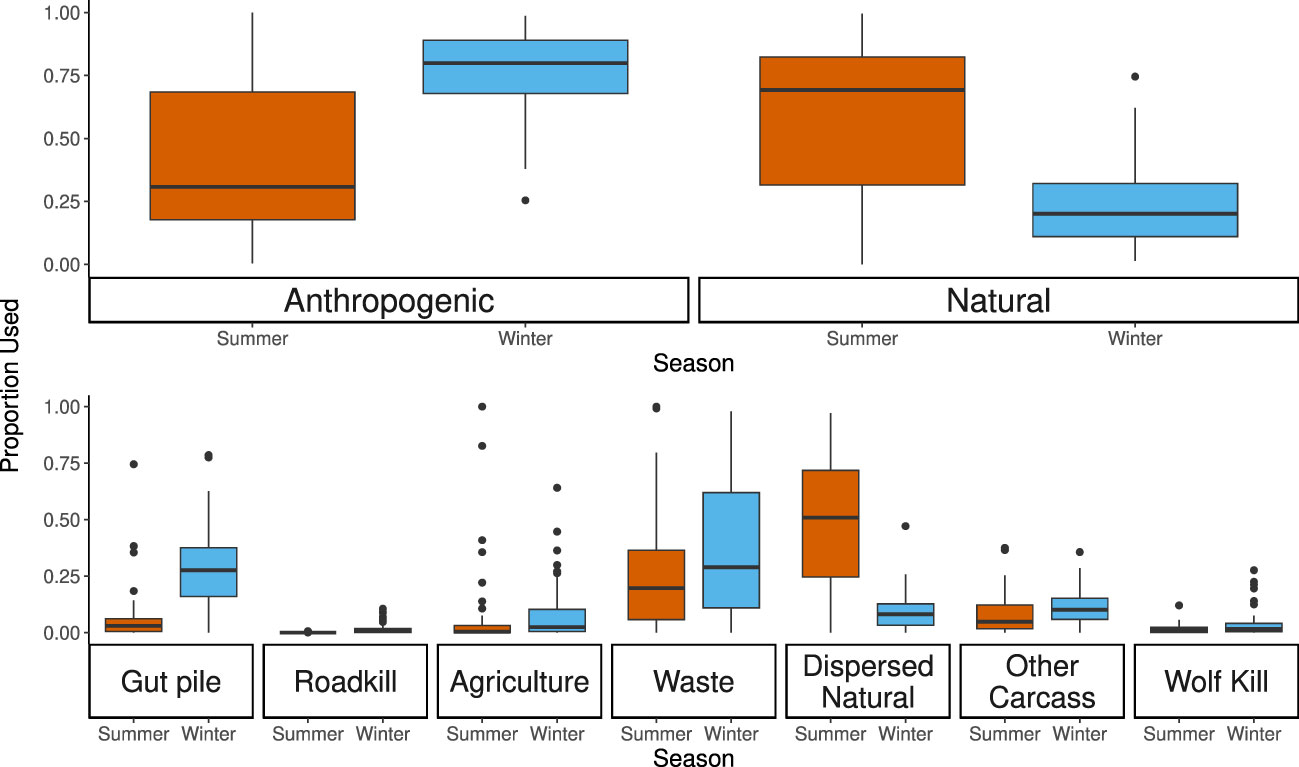
Figure 3 Proportional use of resources in summer and winter. The upper panel represents the combined categories and the lower panel each category separately. A chi-squared test for the upper panel and separate generalized linear mixed models with binomial error distributions for each of the categories in the lower part revealed that there were significant differences for all categories between the summer and winter (see also Appendix L, Supplementary Table 11 for model results).
There was strong individual variation both overall (Figure 4) and seasonally in resource use by ravens (Appendix N, Supplementary Figures 3, 4). Some individuals, (e.g., individuals 7667 and 7660) used many resources, evenly, whereas others focused on specific resources such as agriculture (individual 7651), natural dispersed foods (individual 7595), waste (individual 7565), or carcasses (individual 7533). Five ravens in our sample held territories that contained nests located within or directly adjacent to developed visitor and residential areas, thus allowing them to predominantly forage from abundant anthropogenic dispersed resources (Old Faithful: 7485 and 7494; Gardiner: 7528; and Mammoth: 7530 and 7654). The tendency for some ravens to be relatively focused on foraging one or two types of food items, and for others to utilize all resources in nearly even proportions, is indicated by the variability in the Shannon diversity index, which ranged from 0.07 to 1.73 (equal use of all seven resource categories would result in an index value of 1.95). Raven sex and status had no significant effect on the diversity (or evenness) of resources an individual used (the model including sex and territorial status did not outperform the null model, ΔAIC = 2.4; Appendix O, Supplementary Table 14).
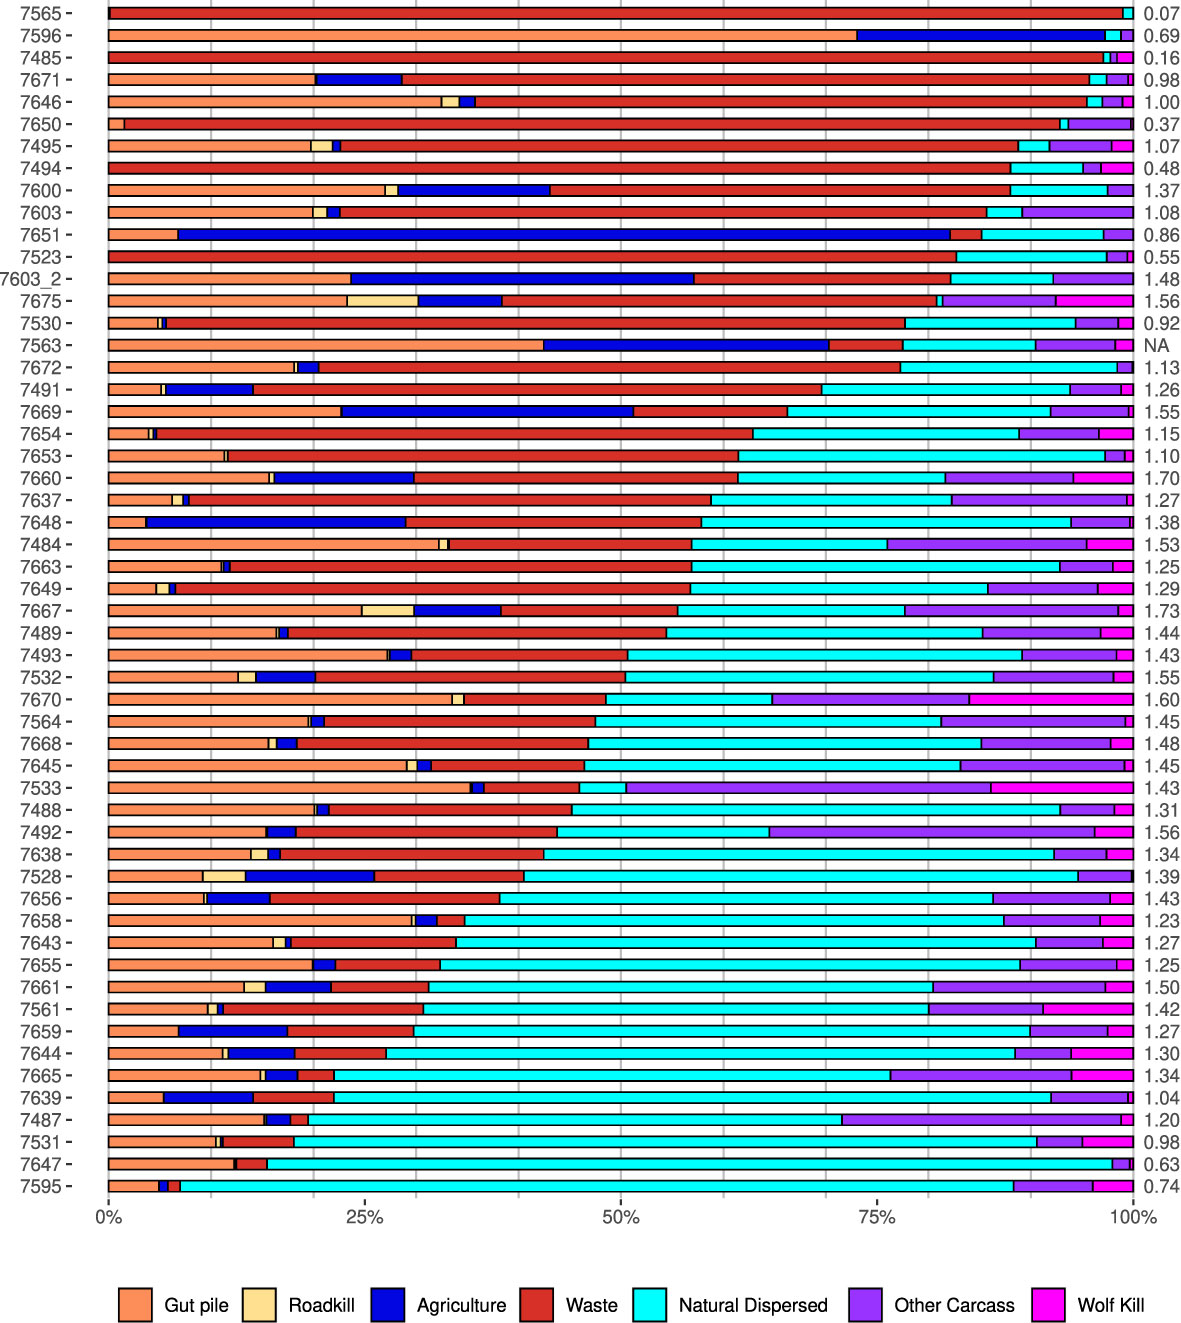
Figure 4 Individual variation in resource use categories. Each row represents the resources used by an individual raven, identified by its GPS transmitter number in the left column. The Shannon diversity index for each individual’s foraging decisions is located in the right column. Individuals are ordered according to their use of natural resources (least–greatest use). GPS, global positioning system.
Ravens used resources across a vast area, with most of their activity concentrated around the northern border of Yellowstone National Park (Figure 2). Wolf kills were exploited mostly in the Northern Range of Yellowstone National Park (Figure 2), where wolves and ungulates are most abundant (Metz et al., 2020). At the same time, ravens used anthropogenic resources throughout the GYE that were in farms, ranches, roads, cities, towns, and recreation sites (Figure 2).
Territorial and vagrant ravens varied in terms of their use of space within and beyond the boundaries of Yellowstone National Park. Territorial ravens that had nests located within the park (n = 15) showed significant differences in their use of space between seasons [χ2 = 13975, 1 degree of freedom (df); p < 0.001], spending less time within the park during the winter (inside: 35.8%; outside: 64.2%) than in the summer (inside: 90.7%; outside 9.3%; Figure 5). Territorial ravens had an average (median) maximum daily displacement of 3.9 km (range of individual averages 1.7–8.4 km) during the summer and 21.7 km (range of individual averages 7.4–34.6 km) in the winter (W = 209, p < 0.001, nwinter = 15, nsummer = 14; Figure 6). Vagrant birds in the GYE (n = 37) also showed significant differences in their use of resources in Yellowstone National Park between seasons (χ2 = 27,418, 1 df; p = <0.001), but the seasonal difference in their use of these resources was less pronounced than that of territorial birds (winter inside: 23.8%, outside: 76.2%; summer inside: 59.9%, outside: 40.1%; Figure 5). Vagrant ravens had an average (median) maximum daily displacement of 14.5 km (range 5.7–37.4 km) during the summer and 22.2 km (range 4.4–47.1 kilometers) in winter (W = 650, p = 0.006, nwinter = 34, nsummer = 29; Figure 6).
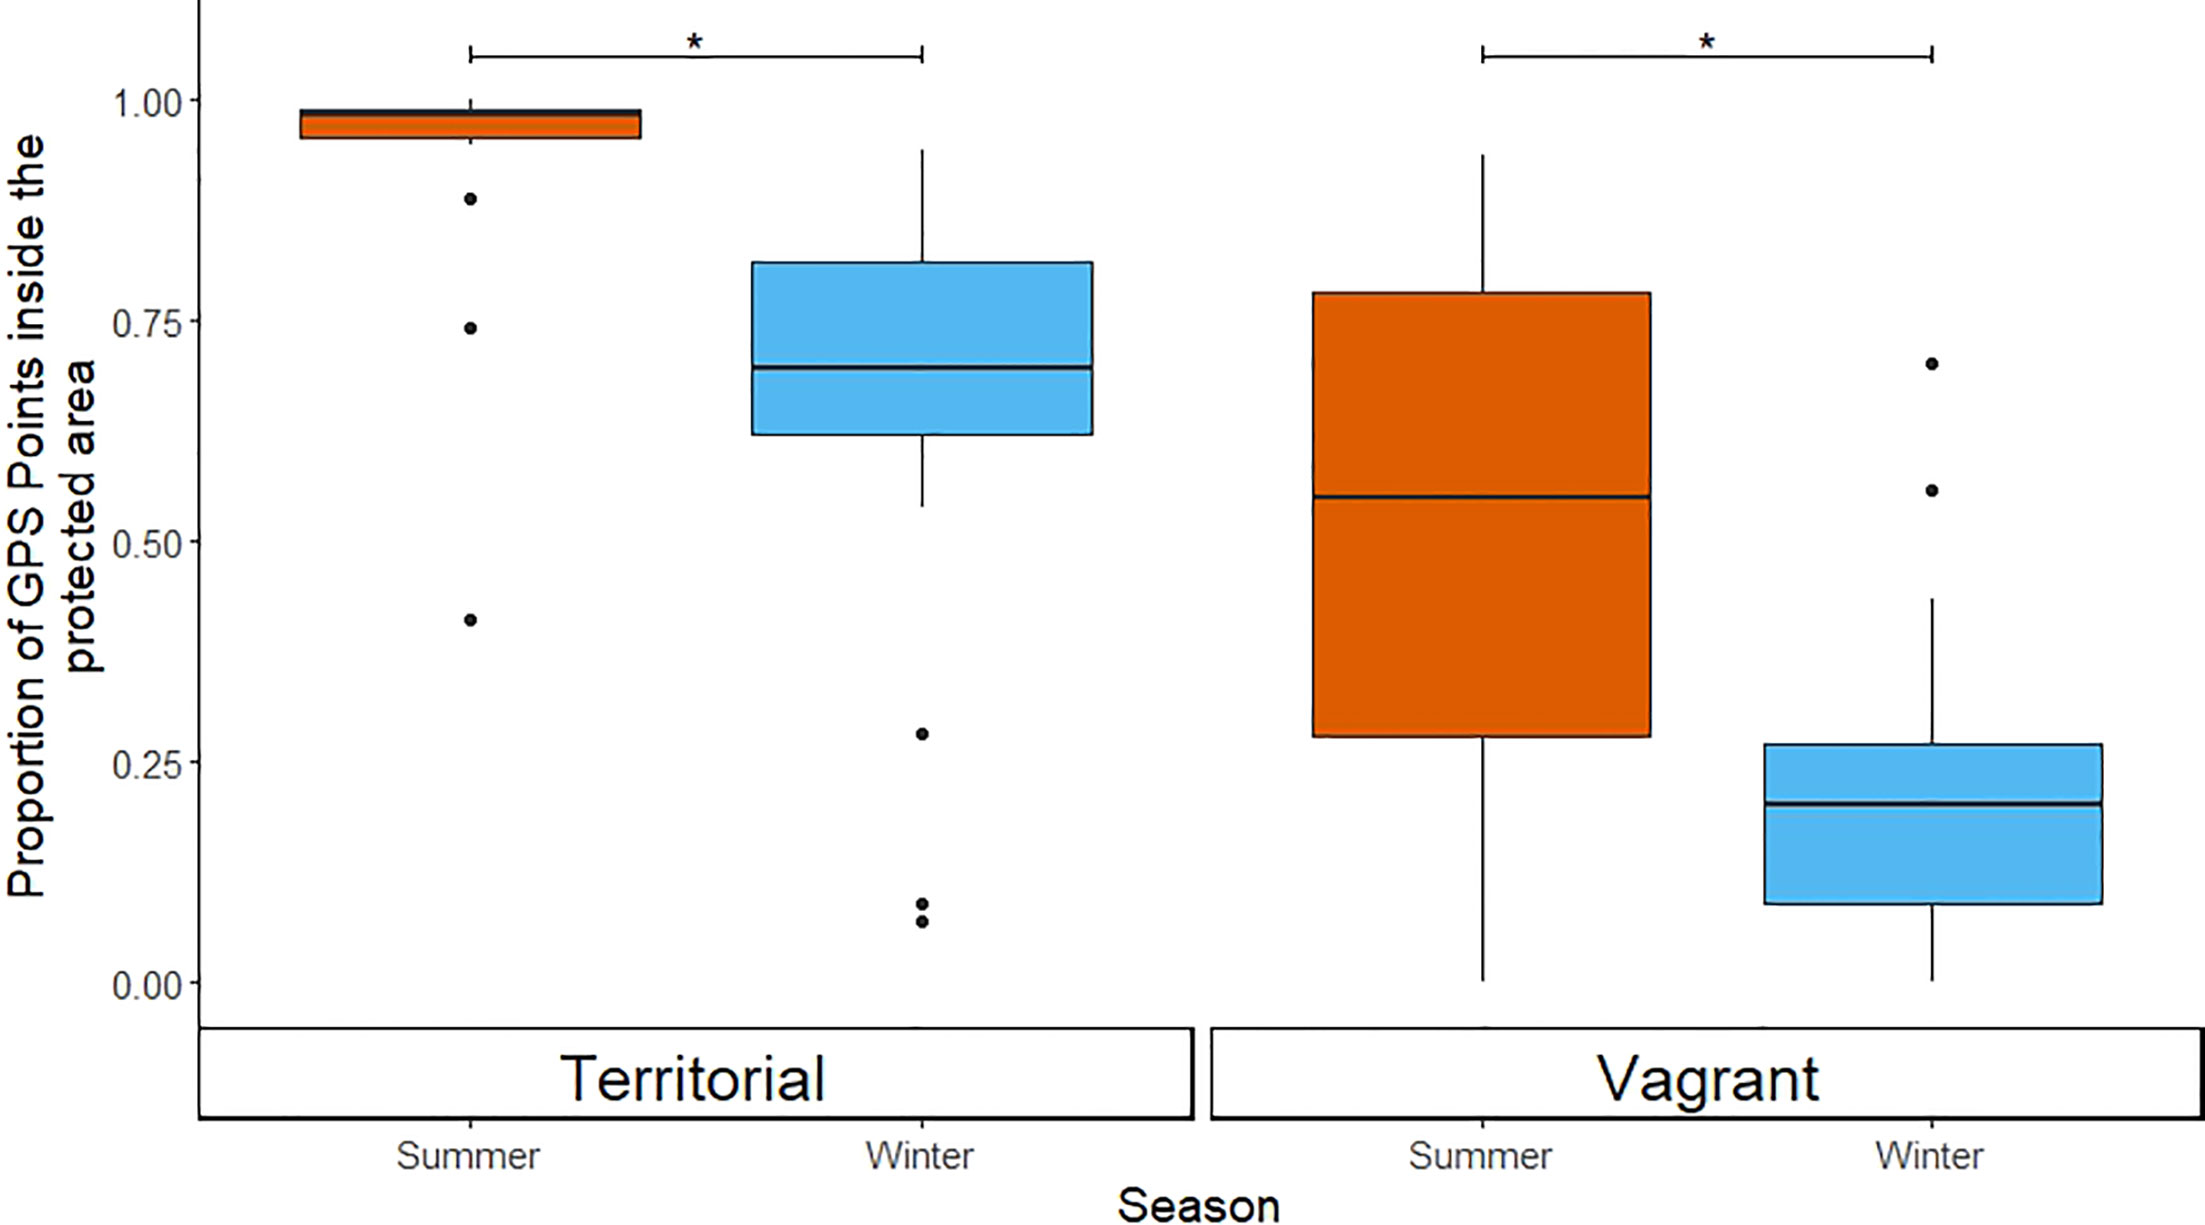
Figure 5 Differences in the proportion of GPS positions inside the boundaries of Yellowstone National Park between the summer and winter for territorial ravens with territories within the park (left panel) and vagrant ravens (right panel). Note that because we classified ravens as either territorial or vagrant based on their use of space, we make no comparisons between these groups. GPS, global positioning system. Asterisks (*) indicate statistically significant differences between groups (p < 0.05).
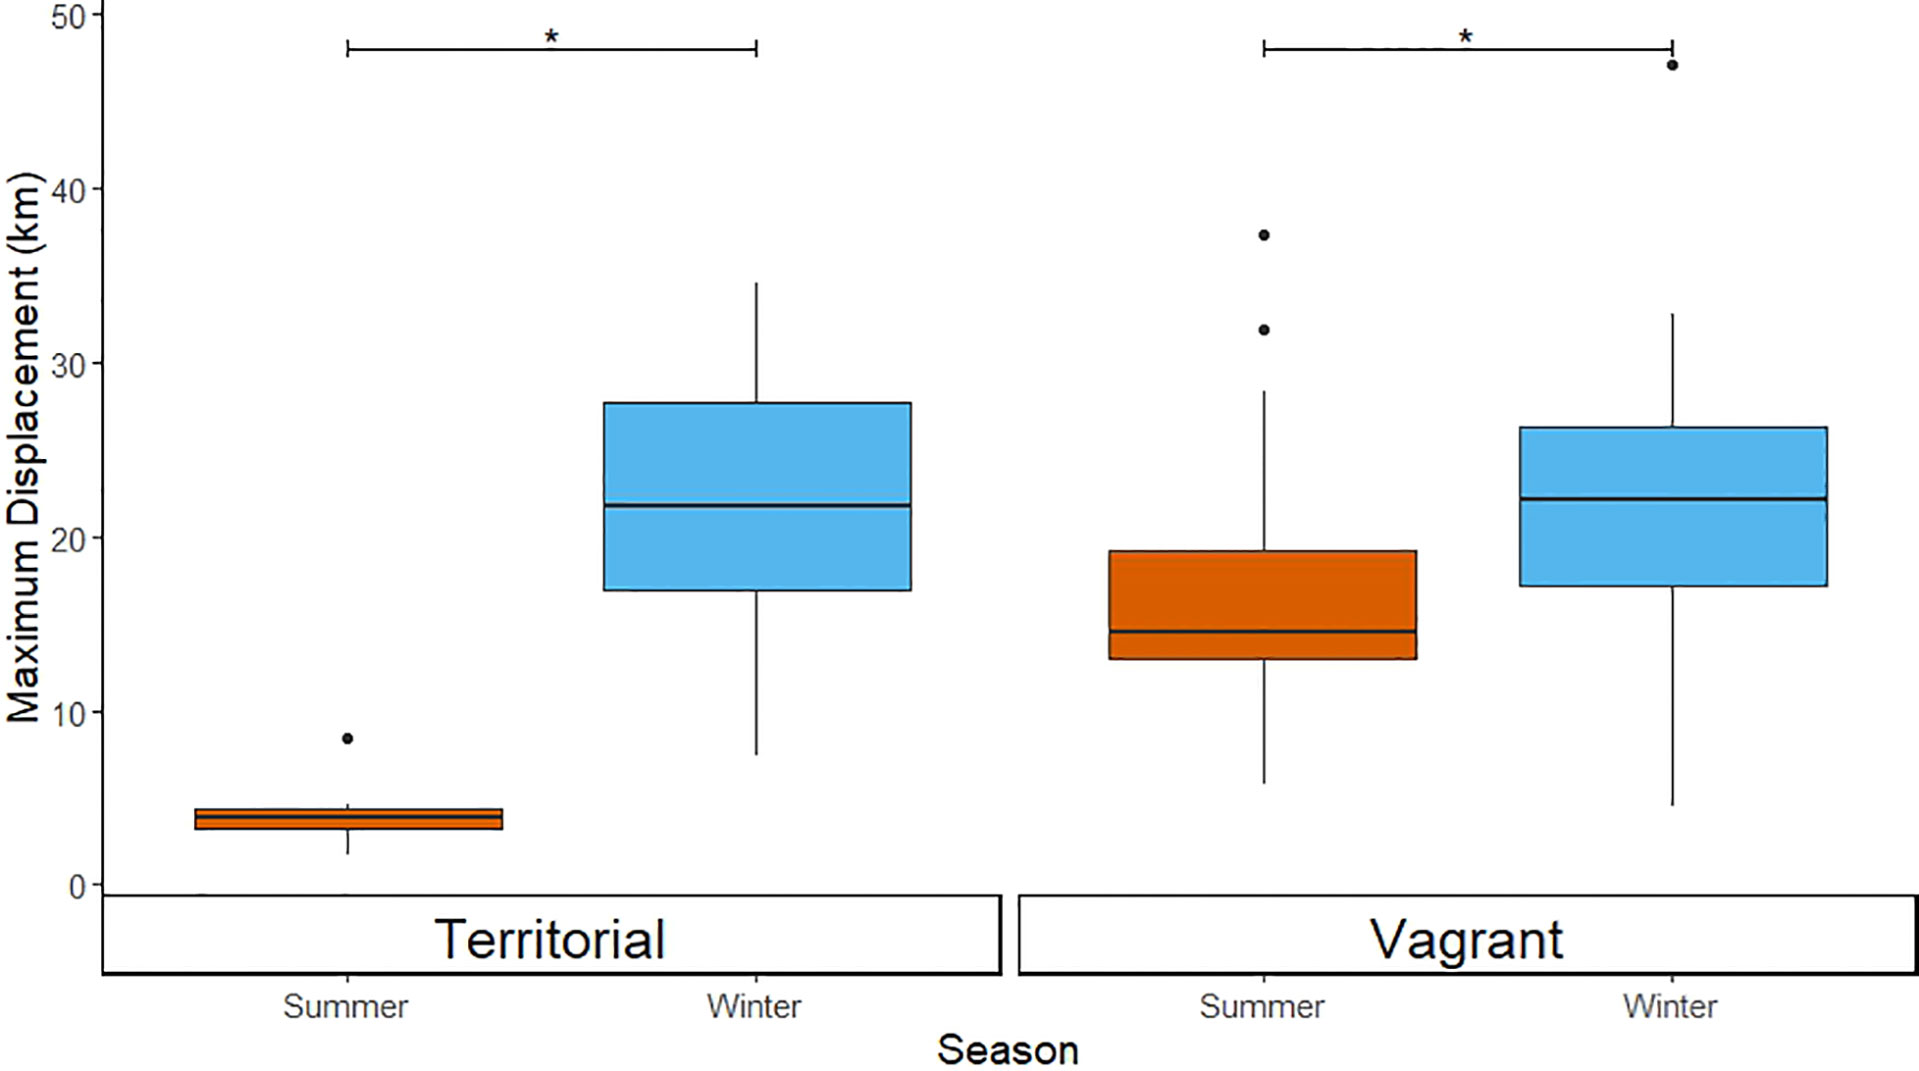
Figure 6 The boxplots show significant differences in average maximum displacement between the summer and winter for territorial ravens with territories within the park (left panel) and vagrant ravens (right panel). Note that because we classified ravens as either territorial and vagrant based on their use of space, we make no comparisons between these groups. Asterisks (*) indicate statistically significant differences between groups (p < 0.05).
Individual characteristics of ravens using each resource
The sex and territorial status of ravens had no effect on their usage of resources in either season (αBonferroni = 0.0042; all p ≥ 0.02, Appendix P, Supplementary Tables 15, 16). Restricting the model to include only foraging events classified with a “confirmed” or “probable” certainty did not change the results of either of these models (Appendix Q, Supplementary Tables 1, 18).
Discussion
Our results show that all ravens trapped within and close to Yellowstone National Park were heavily subsidized by anthropogenic resources beyond the park’s boundary. Year-round, ravens spent considerably more time foraging on anthropogenic food sources than on natural carcasses. This contradicted our expectation that due to the large size of Yellowstone National Park (≈ 9,000 km²) and its high predator density, ravens would feed predominantly on predator kills. The exploited anthropogenic subsidies were distributed over vast areas that extended far beyond the GYE. During the winter, ravens traveled longer distances and spent more time outside Yellowstone National Park, mostly feeding on anthropogenic food subsidies. This was in contrast to the summer, when ravens fed extensively on insects within the protected area, despite many of them being captured outside Yellowstone National Park boundaries. This was particularly relevant for individuals with territories within Yellowstone National Park, as they moved almost daily to subsidies outside the protected area in winter, but mostly stayed within their territory in summer. Overall, we found no differences in resource use between males and females or vagrant and territorial ravens, perhaps because of extensive individual variation.
With the vast distribution of exploited anthropogenic subsidies in mind, we demonstrate that ravens’ use of these food sources was not a local phenomenon. Instead, it is a general pattern, even in a landscape with a low human population density (Wyoming and Montana have with 2.3 and 2.9 persons per km², respectively, the lowest population densities in the contiguous United States; U.S. Census Bureau, 2021). Given the relatively low proportion of times spent in proximity to natural foods in winter, we expect that the population of ravens in this area would be lower without human subsidy. A healthy population of large predators might partially mitigate such an effect if this was the case in the entire GYE, as suggested by a study on population responses of ravens to reintroduced wolves in Yellowstone National Park (Walker et al., 2018). Previous studies concluding that ravens might primarily rely on wolf kills (Stahler et al., 2002) likely underestimated the number of ravens in the area and their large movement capacity. Our results show that almost every GPS-tagged raven eventually fed at a wolf kill. However, when we consider resource use from the individual raven’s perspective, wolf kills played a minor role compared with anthropogenic food.
One of the key ecosystem functions that ravens and other scavengers provide is the fast consumption of carrion (Mateo-Tomás et al., 2017; Grilli et al., 2019), thereby reducing disease transmission (Szcodronski and Cross, 2021). It has been suggested that scavengers in the GYE reduce the risk of brucellosis transmission from livestock to elk by quickly consuming infected aborted biological materials (Szcodronski and Cross, 2021). As the most abundant vertebrate scavenger species in the GYE, ravens play a key role in the removal of natural and anthropogenic carcasses (roadkill, gut piles, and livestock) (Wilmers et al., 2003a). Ravens are often the first scavengers to arrive at the sites of predator kills as they pay attention to the behavioral cues of predators (e.g., wolves in hunting mode) (Stahler et al., 2002) and use auditory information to locate food through conspecific calls (Heinrich and Marzluff, 1991), wolf howls (Harrington, 1978), and gunshots (White, 2005). Once a raven finds food, it will not only feed and cache food for later consumption (Heinrich and Pepper, 1999; Beck et al., 2020), but may indirectly attract more ravens and other scavenger species (Heinrich and Marzluff, 1991; Marzluff et al., 1996). Together, these adaptations reveal the great potential of the activity of ravens and other scavengers for ecosystem services such as carcass removal and reduction of disease transmission. As anthropogenic subsidies increase raven populations, they might, in turn, affect ravens’ efficiency in carcass removal, but this interplay needs to be further investigated.
At the same time, feeding on anthropogenic subsidies bears the risk of contamination by toxicants such as lead ammunition, veterinary drugs, and insecticides (Mateo-Tomás et al., 2017; Herrero-Villar et al., 2021). Craigshead and Bedrosian (2008) showed that almost half of the sampled ravens in the GYE had elevated blood lead levels, with the lead levels of females being significantly higher than those of males (Craigshead and Bedrosian (2008). Apart from permanent food sources, such as landfills and wastewater treatment ponds, ravens in our study could be observed in the greatest numbers north of Yellowstone National Park during hunting seasons. Hundreds of individuals aggregate to forage on the gut piles of hunted animals; this was reflected by a large proportion of foraging-associated GPS locations of ravens in this area. As most hunting occurs in the cold season, when most invertebrate scavengers are inactive, vertebrate scavengers are essential for carcass removal. The lead-based ammunition, which is predominantly used by hunters, puts scavengers feeding on gut piles at risk of lead poisoning, which in turn can diminish their capacity to provide the aforementioned ecosystem services.
In this study, we were able to directly confirm a large number of foraging events through direct observation, and to infer many more through careful assessment. Our data do not necessarily reflect the biomass obtained by ravens from each resource, but rather the time that ravens spent at each resource. Some resources, such as carcasses and waste treatment facilities, provide readily attainable food, but these vary widely in terms of their potential biomass. For instance, by skimming fat from wastewater treatment ponds consistently, small amounts of biomass can be consumed, while feeding on an ungulate carcass is much more profitable if competition with other scavengers is not high. Other resources, such as naturally dispersed foods, may require extensive searching for small, evasive prey, which might have led to an overestimation of their contribution to a raven’s diet. Despite this uncertainty about the foraging efficiency of ravens, we are confident that our extensive observations, the large variety of methods, and the repeated analysis, including and excluding the category “unsure,” produced a reliable picture of ravens’ foraging efforts regarding different resources and in different seasons.
Conservation implications
Conservationists have long recognized the limits of protected areas (Newmark, 1995) and the need to complement them with buffers and corridors for sensitive species (Soulé and Terborghh, 1999). The failure to appropriately manage lands beyond reserves impacts the management of rare or recovering species in reserves. For example, recent increases in hunting quotas on wolves outside the protected bounds of Yellowstone National Park reduced the number of wolves inside the reserve, impacting demographic and social processes (Cassidy et al., 2023). In contrast, our results indicate a positive effect for ravens, that is, the interior population benefits from human activities outside the same protected area. Such positive or negative effects on select species can be expected around many protected areas worldwide. In particular, this applies to common, opportunistic species from groups, such as corvids, seabirds, and mammalian mesopredators and apex predators, with large movement capacities that enable them to exploit resources beyond protected areas. For instance, yellow-legged gull (Larus michahellis) populations increase as a result of their exploitation of anthropogenic subsidies (Oro et al., 2013 and references therein). Egyptian vultures (Neophron percnopterus) in some areas also benefit from subsidies and move across large distances to exploit them (McGrady et al., 2018). However, most Old-World vultures suffer from anthropogenic activities that occur within and outside protected areas, such as illegal poisoning or poaching (Ogeda et al., 2011). Thus, when humans alter the resource distribution around protected areas, it can have very different outcomes for the species directly exploiting anthropogenic subsidies. With both positive and negative responses from populations exploiting anthropogenic subsidies, the resulting effects on other species in the food web via predation and competition are not well understood. Due to gateway communities growing at a fast rate, and increased recreation and ecotourism in and around protected areas (Martinuzzi et al., 2015), this is an increasing issue that needs increased attention, research, and the implementation of mitigation strategies such as the reduction or removal of subsidies where possible.
Taken together, we show that all ravens trapped in or close to Yellowstone National Park heavily relied on anthropogenic subsidies. This has been described for other areas (Mojave Desert, Knight et al., 1993; temperate rainforests of the Pacific Northwest, Webb et al., 2011; Western US sagebrush habitat, O’Neil et al., 2018; Central Europe, Loretto et al., 2016; Loretto et al., 2017), but was unexpected for the GYE, one of the last reasonably intact temperate ecosystems containing a full suite of native carnivores. Many areas currently experience increased human activity and subsidies with increasing populations of ravens or other opportunists (see Marzluff et al., 2021 and references therein). Unlike other areas, where high populations of ravens pose an additional threat to already threatened species (Boarman, 2003), there is no indication of such a threat in the GYE. Our data on ravens’ extensive foraging movements provide important information for land management strategies that aim to limit ravens’ access to anthropogenic resources (Boarman, 2003; Marzluff et al., 2021), but also emphasize that ravens provide important ecosystem services (disease control, winter nutrient cycling) that require further research.
Data availability statement
The original contributions presented in the study are included in the article/supplementary files, further inquiries can be directed to the corresponding author/s.
Ethics statement
All research was conducted in accordance with Yellowstone National Park research permit 8072, the National Parks Service IACUC (IMR_YELL_Loretto_Raven_2018.A1), Montana State Collector’s Permit 2020–021-W, Federal Bird Banding Permit 22489, and the University of Washington IACUC protocol 3077–01.
Author contributions
CH, JM, and M-CL contributed to all phases of the project, leading fieldwork, analysis, and manuscript preparation. DaS and DoS led fieldwork on carnivores, acquired raven data, and critically revised the manuscript. TM, MW, and KS contributed to data interpretation and critical revision of the manuscript. All authors contributed to the article and approved the submitted version.
Funding
CH and JM received funding from the National Geographic Society (NGS-61630R-19). JM received funding from the James W. Ridgeway endowment to the School of Environmental and Forest Sciences at the University of Washington. M-CL was supported by the European Union’s Horizon 2020 research and innovation program under the Marie Sklodowska-Curie grant agreement No 798091. DoS and DaS received funding by Yellowstone Forever, Annie and Bob Graham, and Valerie Gates for support of wolf and cougar predations studies. We also acknowledge partial support by the Deutsche Forschungsgemeinschaft (DFG, German Research Foundation) under Germany’s Excellence Strategy—EXC 2117—422037984.
Acknowledgments
Georgia Coleman aided our formulation and application of methodology. Lauren Walker, Connor Meyer, Jeremy SunderRaj, Katie Roloson, Jannine Clemmons, Kerry Gunther, Bill Bridgeland, and Robin Rauch confirmed ravens’ use of various resources.
Conflict of interest
The authors declare that the research was conducted in the absence of any commercial or financial relationships that could be construed as a potential conflict of interest.
Publisher’s note
All claims expressed in this article are solely those of the authors and do not necessarily represent those of their affiliated organizations, or those of the publisher, the editors and the reviewers. Any product that may be evaluated in this article, or claim that may be made by its manufacturer, is not guaranteed or endorsed by the publisher.
Supplementary material
The Supplementary Material for this article can be found online at: https://www.frontiersin.org/articles/10.3389/fbirs.2023.1119507/full#supplementary-material
References
Altmann J. (1974). Observational study of behavior: sampling methods. Anim. Behav. 49, 227–266. doi: 10.1163/156853974X00534
Anderson C. R., Lindzey F. G. (2003). Estimating cougar predation rates from GPS location clusters. J. Wildlife Manage. 67 (2), 307–316. doi: 10.2307/3802772
Bartumeus F., Giuggioli L., Louzao M., Bretagnolle V., Oro D., Levin. S. A. (2010). Fishery discards impact seabird movement patterns at regional scale. Elsevier 20 (3), 215–222. doi: 10.1016/j.cub.2009.11.073
Bates D., Maechler M., Bolker B., Walker S. (2015). Fitting linear mixed-effects models using lme4. J. Stat. Software 67, 1–48. doi: 10.18637/jss.v067.i01
Beck K. B., Loretto M. C., Bugnyar T. (2020). Effects of site fidelity, group size and age on food-caching behaviour of common ravens. Corvus corax. Anim. Behav. 164, 51–64. doi: 10.1016/j.anbehav.2020.03.015
Bedrosian B., Loutsch J., Craighead D. (2008). Using morphometrics to determine the sex of common ravens. Northwestern Nat. 89, 46–52. doi: 10.1898/1051-1733(2008)89[46:UMTDTS]2.0.CO;2
Boarman W. I. (2003). Managing a subsidized predator population: reducing common raven predation on desert tortoises. Environ. Management 32 (2), 205–217. doi: 10.1007/s00267-003-2982-x
Braun A., Bugnyar T. (2012). Social bonds and rank acquisition in raven nonbreeder aggregations. Anim. Behaviour 84 (6), 1507–1515. doi: 10.1016/j.anbehav.2012.09.024
Brooks M. E., Kristensen K., van Benthem K. J., Magnusson A., Berg C. W., Nielsen A., et al. (2017). glmmTMB balances speed and flexibility among packages for zero-inflated generalized linear mixed modeling. R J. 9 (2), 378–400. doi: 10.32614/RJ-2017-066
Brunk K. M., West E. H., Peery M. Z., Pidgeon A. M. (2021). Reducing anthropogenic subsidies can curb density of overabundant predators in protected areas. Biol. Conserv. 256. doi: 10.1016/j.biocon.2021.109081
Buehler D. A., Fraser J. D., Fuller M. R., McAllister L. S., Seegar J. K. D. (1995). Captive and field-tested radio attachment techniques for bald eagles. J. Field Ornithology 66, 173–180. doi: 10.1016/j.anbehav.2012.09.024
Carey M. P., Sanderseon B. L., Barnas K. A., J.D. O. (2012). Native invaders – challenges for science, management, policy, and society. Front. Ecol. Environ. 10 (7), 373–381. doi: 10.1890/110060
Cassidy K. A., Borg B. L., Klauder K. J., Sorum M. S., Thomas-Kuzilik R., Dewey S. R., et al. (2023). Human-caused mortality triggers pack instability in gray wolves. Front. Ecol. Environment. doi. doi: 10.1002/fee.2597
Coates P. S., Delehanty D. J. (2010). Nest predation of greater sage-grouse in relation to microhabitat factors and predators. J. Wildlife Management 74 (2), 240–248.
Cortes-Avizanda A., Jovani R., Carrete M., J.A. D. (2012). Resource unpredictability promotes species diversity and coexistence in an avian scavenger guild: a field experiment. Ecology 93 (12), 2570–2579. doi: 10.1890/12-0221.1
Craigshead D., Bedrosian B. (2008). Blood lead levels of common ravens with access to big-game offal. Wildlife Manage. 72, 240–245. doi: 10.2193/2007-120
Development Core Team R. (2021). R: a language and environment for statistical computing (Vienna, Austria: R Foundation for Statistical Computing). Available at: https://www.R-project.org/.
Donihue R. (2018) Greater Yellowstone ecosystem boundary – shapefile. Available at: https://www.arcgis.com/home/item.html?id=b55466380b614c1dbf686d2baf149b5b.
Douma C. J., Weedon J. T. (2019). Analysing continuous proportions in ecology and evolution: a practical introduction to beta and dirichlet regression. Methods Ecol. Evol. 10 (9), 1412–1430. doi: 10.1111/2041-210X.13234
Ebbert D. (2019) Chisq.posthoc.test: a post hoc analysis for pearson’s chi-squared test for count data. r package version 0.1.2. Available at: https://CRAN.R-project.org/package=chisq.posthoc.test.
Engel K. A., Young L. S. (1989). Spatial and temporal patterns in the diet of common ravens in southwestern Idaho. Condor 91 (2), 372–378. doi: 10.2193/2009-047; 10.2307/1368316
Grilli M. G., Bildstein K. L., S.A. L. (2019). Nature’s clean-up crew: quantifying ecosystem services offered by a migratory avian scavenger on a continental scale. Ecosystem Serv. 39, 100990. doi: 10.1016/j.ecoser.2019.100990
Hansen A. J., Defries R. (2007). Ecological mechanisms linking protected areas to surrounding lands. Ecol. Applications 17 (4), 974–988. doi: 10.1890/05-1098;10.1675/063.035.0401
Hardy M. A., Colwell M. A. (2012). Factors influencing snowy plover nest survival on ocean-fronting beaches in coastal northern California. Waterbirds 35 (4), 503–656. doi: 10.2307/1367925;
Harju S. M., Olson C. V., Hess J. E., B. B. (2018). Common raven movement and space use: influence of anthropogenic subsidies within greater sage-grouse nesting habitat. Ecosphere 9 (7). doi: 10.1002/ecs2.2348
Harrison X. A. (2015). A comparison of observation-level random effect and beta-binomial models for modelling overdispersion in binomial data in ecology & evolution. PeerJ 3, e1114. doi: 10.7717/peerj.1114
Heinrich B. (1988). Winter foraging at carcasses by three sympatric corvids, with emphasis on recruitment by the raven, Corvus corax. Behav. Ecol. Sociobiology 23 (3), 41–156. doi: 10.1007/BF00300349
Heinrich B., Marzluff J. M. (1991). Do common ravens yell because they want to attract others? Behav. Ecol. Sociobiology 28, 13–21. doi: 9.10.1006/anbe.1998.0906
Heinrich B., Pepper J. W. (1999). Influence of competitors on caching behaviour in the common raven, Corvus corax. Anim. Behaviour 56 (5), 1083–1090.
Herrero-Villar M., Sánchez-Barbudo I. S., Camarero P. R., Taggart M. A., Mateo. R. (2021). Increasing incidence of barbiturate intoxication in avian scavengers and mammals in Spain. Environ. pollut. 284, 117452. doi: 10.1016/j.envpol.2021.117452
Jain V., Bugnyar T., Cunnungham S. J., Gallego-Abenza M., Loretto M.C., Sumasgutner P. (2022). The spatial and temporal exploitation of anthropogenic food sources by common ravens (Corvus corax) in the Alps. Movement Ecol. 10 35 doi: 10.1186/s40462-022-00335-4
Knight R. L., Knight L. A. H., Camp R. (1993). Raven populations and land-use patterns in the Mojave desert, California. Wildlife Soc. Bull. 21, 469–470. doi: 10.5038/2162-4593.9.1.5
Kristan III, E.B., Boarman W. I. (2003). Spatial pattern of risk of common raven predation on desert tortoise. Ecology 84 (9), 2432–2443. doi: 10.1890/02-0448
Loretto M. C., Schuster R., Bunyar T. (2016). GPS Tracking of non-breeding ravens reveals the importance of anthropogenic food sources during their dispersal in the Eastern Alps. Curr. Zoology 62 (4), 337–344. doi: 10.1093/cz/zow016
Loretto M. C., Schuster R., Itty C., Marchand P., Genero F., Bugnyar T. (2017). Fission-fusion dynamics over large distances in raven non-breeders. Sci. Rep. 7, 380. doi: 10.1038/s41598-017-00404-4
Maier M., University of Economics and Business - Institute for Statistics and Mathematics (2014). DirichletReg: dirichlet regression for compositional data in r. report (Vienna: WU Vienna University of Economics and Business).
Martinuzzi S., Radeloff V. C., Joppa L. N., Hamilton C. M., Helmers D. P., Plantinga A. J., et al. (2015). Scenarios of future land use changes around united states’ protected areas. Biol. Conserv. 184, 446–455. doi: 10.1016/j.biocon.2015.02.015
Marzluff J. M., Boone R. B., Cox. G. W. (1994). Historical changes in populations and perceptions of native pest bird species in the West. Stud. Avian Biol. 111 (4), 15202–15220.
Marzluff J. M., Heinrich B. (1991). Foraging by common ravens in the presence and absence of territory holders: an experimental analysis of social foraging. Anim. Behav. 42 (5), 755–770. doi: 10.1016/S0003-3472(05)80121-6
Marzluff J. M., Heinrich B., C.S. M. (1996). Raven roosts are mobile information centres. Anim. Behav. 51, 89–103. doi: 10.1006/anbe.1996.0008
Marzluff J. M., Loretto M.-C., Ho C. K., Coleman G. W., Restani. M. (2021). Thinking like a raven: restoring integrity, stability, and beauty to western ecosystems. Human-Wildlife Interact. 15:322. doi: 10.26077/2525-d6f5
Marzluff J. M., Neatherlin E. (2006). Corvid response to human settlement and campgrounds: causes, consequences, and challenges of conservation. Biol. Conservation 9 (1), 69–75. doi: 10.1016/j.biocon.2005.12.026
Mateo-Tomás P., Olea P. P., Moleón M., Selva N., J.A. Sánchez-Zapata. (2017). Both rare and common species support ecosystem services in scavenger communities. Global Ecol. Biogeography 26 (12), 1459–1470. doi: 10.1111/geb.12673
Mateo-Tomás P., Olea P. P., Moleón M., Vicente J., Botella F., Selva N., et al. (2015). From regional to global patterns in vertebrate scavenger communities subsidized by big game hunting. Diversity Distributions 21 (8), 913–924. doi: 10.1111/ddi.12330
McGrady M. J., Karelus D. L., Rayaleh H. A., Sarrouf Willson M., Meyburg B.-U., Oli M. K., et al. (2018). Home ranges and movements of Egyptian vultures neophron percnopterus in relation to rubbish dumps in Oman and the horn of Africa. Bird Study 65 (4), 544–556. doi: 10.1080/00063657.2018.1561648
Metz M. C., Hebblewhite M., Smith D. W., Stahler D. R., MacNulty D. R., Tallian A., et al. (2020). “What wolves eat and why,” in Yellowstone Wolves: science and discovery in the world’s first national park. Eds. Smith D. W., Stahler D. R., MacNulty D. R. (Chicago, IL: University of Chicago Press), 157–168.
Metz M. C., Smith D. W., Vucetich J. A., Stahler D. R., R.O. P. (2012). Seasonal patterns of predation for gray wolves in the multi-prey system of Yellowstone national park. J. Anim. Ecol. 81 (3), 553–563. doi: 10.1111/j.1365-2656.2011.01945.x
National Park Service Visitor Use Statistics (2022). Available at: https://irma.nps.gov/STATS/Reports/Park (Accessed Dec 1, 2022).
Nelson A. L. (1934). Summer food preferences of the American raven in southeastern Oregon. Condor 6 (2), 339–343. doi: 15.10.26077/em1c-6d33; 10.2307/1363515
Newmark W. D. (1995). Extinction of mammal populations in western north American parks. Conserv. Biology 36 (1), 10–15. doi: 16.10.1046/j.1523-1739.1995.09030512.x
Noss R. F., Carroll C., Vance-Borland K., Wuerthner G. (2002). A multicriteria assessment of the irreplaceability and vulnerability of sites in the greater Yellowstone ecosystem. Conserv. Biol. 16 (4), 895–908. doi: 10.1046/j.1523-1739.2002.01405.x
Ogeda D. L., Keesing F., Virani M. Z. (2011). Dropping dead: causes and consequences of vulture population declines worldwide. Ann. New York Acad. Sci. 1249, 57–71. doi: 10.1111/j.1749-6632.2011.06293.x
O’Neil S. T., Coates P. S., Brussee B. E., Jackson P. J., Howe K. B., Moser A. M., et al. (2018). Broad-scale occurrence of a subsidized avian predator: reducing impacts of ravens on sage-grouse and other sensitive prey. J. Appl. Ecol. 55 (6), 2641–2652. doi: 10.1111/1365-2664.13249
Oro D., Genovart M., Tavecchia G., Fowler M. S., Martinez-Abrain A. (2013). Ecological and evolutionary implications of food subsidies from humans. Ecol. Lett. 16 (12), 1501–1514. doi: 10.1111/ele.12187
Pebesma E. (2018). Simple features for r: standardized support for spatial vector data. R J. 10, 439–446. doi: 10.32614/RJ-2018-009
Ruth T., Buotte P., Hornocker M. (2019). “Yellowstone Cougars: ecology before and during wolf restoration,” in Yellowstone Cougars: ecology before and during wolf restoration (Boulder, Colorado: University Press of Colorado).
Smith D. W., Metz M. C., Stahler D. R., MacNulty D. R. (2020). “How we study wolf-prey relationships,” in Yellowstone Wolves: science and discovery in the world’s first national park. Eds. Smith D. W., Stahler D. R., MacNulty D. R. (Chicago, IL: University of Chicago Press), 139–148.
Soulé M. E., Terborghh J. (1999). Continental conservation: scientific foundations of regional reserve networks (Covelo, CA: Island Press).
Stahler D. R., Heinrich B., Smith D. (2002). Common ravens, corvus corax, preferentially associate with grey wolves, canis lupus, as a foraging strategy in winter. Anim. Behav. 64 (2), 283–290. doi: 10.1006/anbe.2002.3047
Szcodronski K. E., Cross P. C. (2021). Scavenger reduce potential brucellosis transmission risk in the greater Yellowstone ecosystem. Ecosphere 12 (10), e03783. doi: 10.1002/ecs2.3783
Thieurmel B., Elmarhraoui A. (2019). Suncalc: compute sun position, sunlight phases, moon position and lunar phase. r package version 0.5.0.
U.S. Census Bureau (2021) Change in resident population of the 50 states, the district of Columbia, and Puerto Rico: 1910 to 2020. Available at: https://www2.census.gov/programs-surveys/decennial/2020/data/apportionment/population-change-data-table.pdf (Accessed August 31, 2022).
USDI FWS (2003). “Human influences on predators of nesting birds on the north slope of Alaska,” in Proceedings of a public workshop held 17-18 April 2003 in anchorage, Alaska (Alaska, USA: U. S. Fish and Wildlife Service Field Office, Fairbanks).
Walker L. E., Marzluff J. M., Metz M. C., Wirsing A. J., Moskal L. M., Stahler D. R., et al. (2018). Population responses of common ravens to reintroduced gray wolves. Ecol. Evol. 8 (22), 11158–11168. doi: 10.1002/ece3.4583
Watson J. ,. N., Dudley ,. D., Hockings S. M. (2014). The performance and potential of protected areas. Nature 515, 67–73. doi: 10.1038/nature13947
Webb W. C., Marzluff J. M., Hepinstall-Cyerman J. (2011). Linking resource use with demography in a synanthropic population of common ravens. Biol. Conserv. 144, 2264–2273. doi: 10.1016/j.biocon.2011.06.001
White C. (2005). Hunters ring dinner bell for ravens: experimental evidence of a unique foraging strategy. Ecology 86 (4), 1057–1060. doi: 10.1890/03-3185
Wilmers C. C., Crabtree R. L., Smith D. W., Murphy K. M., Getz W. M. (2003b). Trophic facilitation by introduced top predators: grey wolf subsidies to scavengers in Yellowstone national park. J. Anim. Ecol. 72, 909–916. doi: 10.1046/j.1365-2656.2003.00766.x
Wilmers C. C., Getz W. M. (2004). Simulating the effects of wolf-elk population dynamics on resource flow to scavengers. Ecol. Modeling 177, 193–208. doi: 10.1016/j.ecolmodel.2004.02.007
Wilmers C. C., Stahler D. R., Crabtree R. L., Smith D. W., Getz W. M. (2003a). Resource dispersion and consumer dominance: scavenging at wolf- and hunter-killed carcasses in greater Yellowstone. U.S.A. Ecol. Lett. 6, 996–1003. doi: 10.1046/j.1461-0248.2003.00522.x
Keywords: foraging, common raven, human subsidy, protected area, Yellowstone
Citation: Ho C, Marzluff JM, Stahler DR, Smith DW, Mueller T, Wikelski M, Safi K and Loretto M-C (2023) Scavengers use natural and anthropogenic resources connecting protected areas with surrounding lands. Front. Bird Sci. 2:1119507. doi: 10.3389/fbirs.2023.1119507
Received: 08 December 2022; Accepted: 22 May 2023;
Published: 27 June 2023.
Edited by:
David Koons, Colorado State University, United StatesReviewed by:
Adam Duerr, Conservation Science Global, Inc., United StatesToni Laaksonen, University of Turku, Finland
Copyright © 2023 Ho, Marzluff, Stahler, Smith, Mueller, Wikelski, Safi and Loretto. This is an open-access article distributed under the terms of the Creative Commons Attribution License (CC BY). The use, distribution or reproduction in other forums is permitted, provided the original author(s) and the copyright owner(s) are credited and that the original publication in this journal is cited, in accordance with accepted academic practice. No use, distribution or reproduction is permitted which does not comply with these terms.
*Correspondence: Matthias-Claudio Loretto, bWF0dGhpYXMubG9yZXR0b0BnbWFpbC5jb20=; Cameron Ho, aG8uY2FtZXJvbjk4QGdtYWlsLmNvbQ==