
95% of researchers rate our articles as excellent or good
Learn more about the work of our research integrity team to safeguard the quality of each article we publish.
Find out more
ORIGINAL RESEARCH article
Front. Biomater. Sci. , 22 May 2024
Sec. Bioinspired and Complex Materials
Volume 3 - 2024 | https://doi.org/10.3389/fbiom.2024.1399448
This article is part of the Research Topic Women in Biomaterials Science 2023 View all 12 articles
 Jodi Graf1
 Kartik Bomb1
 Michael Trautmann-Rodriguez1Bader M. Jarai1Nicole Gill1
 April M. Kloxin1,2*†
 Catherine A. Fromen1*†
Macrophages are phagocytic innate immune cells capable of phenotypical switching in response to the local microenvironment. Studies often use either primary macrophages or immortalized cell lines for hypothesis testing, therapeutic assessment, and biomaterial evaluation without carefully considering the potential effects of cell source and tissue of origin, which strongly influence macrophage response. Surprisingly, limited information is available about how, under similar stimuli, immortalized cell lines and primary cells respond in both phenotypical and functional changes. To address this need, in this work, we cultured immortalized macrophage cell lines derived from different origins (i.e., blood, lung, peritoneal) to understand and compare macrophage phenotypical responses, including polarization and plasticity, morphological changes, and phagocytic functionalities, as well as compared primary macrophages extracted from peritoneal and bone marrow to their immortalized cell line counterparts. We found significant differences in baseline expression of different markers (e.g., CD86, MHCII, CD206, and EGR2) amongst different cell lines, which further influence both polarization and repolarization of the cells, in addition to their phagocytic functionality. Additionally, we observed that, while RAW 264.7 cells behave similarly to the primary bone marrow-derived macrophages, there are noticeable phenotypical and functional differences in cell line (IC-21) and primary peritoneal macrophages, highlighting tissue-specific differences in macrophage response amongst cell lines and primary cells. Moving to three-dimensional (3D) culture in well-defined biomaterials, blood-derived primary and cell line macrophages were encapsulated within hydrogel-based synthetic extracellular matrices and their polarization profiles and cell morphologies were compared. Macrophages exhibited less pronounced polarization during 3D culture in these compliant, soft materials compared to two-dimensional (2D) culture on rigid, tissue culture plastic plates. Overall, our findings highlight origin-specific differences in macrophage response, and therefore, careful considerations must be made to identify the appropriate cell source for the application of interest.
Macrophages are chief immune effector cells that are the first responders upon pathogen entry and are responsible for neutralizing the invading pathogen by engulfing it through phagocytosis (Park et al., 2022). Additionally, macrophages can activate differently based on their microenvironment through a process called polarization, adopting transient phenotypes classically characterized as pro-inflammatory activation (M1) or anti-inflammatory (M2) activation (Sreejit et al., 2020). Furthermore, macrophages exhibit plasticity, allowing them to repolarize in response to alternate stimuli, which is an interesting approach to addressing immune dysfunction and imbalance in diseased states. Indeed, recent studies have highlighted that macrophage polarization goes beyond the linear M1-M2 paradigm and is often influenced by tissue origin, disease states, and polarization stimuli (Sreejit et al., 2020; Park et al., 2022; Strizova et al., 2023). For example, Lavin et al. performed a comprehensive analysis on tissue-derived macrophages from different sources, including brain, lung, liver, spleen, peritoneal, colon, ileal, and monocytes, and showed marked differences in the base expression level in the markers for macrophages from different tissue origin (Lavin et al., 2014). Yet, many in vitro studies, including in the design and application of biomaterials, do not consider macrophage origin in cell type selection.
An increasing number of studies have utilized immune engineering approaches (e.g., protein-based therapies, engineered particles, and polymer scaffolds) to drive phenotypical and functional responses of macrophages (Mao et al., 2022; Zarubova et al., 2022; Zheng et al., 2022). Biomaterial properties, such as surface topography, stiffness, and dynamic mechanical forces, in addition to bioactive cues, have been shown to have a profound effect on modulating macrophage phenotype. Recent advances in particle-based drug delivery have shown that material composition, size, shape, charge, and targeting ligands impact macrophage phagocytosis and polarization (Sylvestre et al., 2020; Mao et al., 2022). Researchers continue to evaluate biomaterial design rules in macrophages from varied sources, including both immortalized cell lines (Wu et al., 2020; Tu et al., 2022) and primary cells (Chen et al., 2020; Jarai et al., 2021). Macrophages are powerful models to understand the innate immune system, but further consideration into cell choice and origin are needed to contextualize experimental data.
Some of the commonly used murine cell lines for in vitro investigation include RAW 264.7 (monocyte-derived) (Kim et al., 2019), MH-S (alveolar macrophages) (Ruge et al., 2012), and IC-21 (peritoneal macrophages) (Ullah et al., 2019) cells. Common ex vivo murine primary cells include bone-marrow derived macrophages (BMMs) (Palomba et al., 2021), which are hematopoietic precursors differentiated ex vivo into macrophages, or terminally differentiated macrophages from different tissues, such as lung (alveolar macrophages, AM) (Bobba et al., 2021) and peritoneal cavity (peritoneal macrophages, PM) (Tran et al., 2016). Despite known differences between macrophages from different tissues, macrophages used for in vitro applications often have a discrepancy between the application of interest and the macrophage origin, which limits the understanding of macrophage response in a disease- and tissue-specific context. There remains limited understanding of how cells from these different locations will polarize and repolarize in the presence of different stimuli, or what inherent differences exist in their phagocytic capacity. Comparing immortalized cell lines and primary cells from the same source and in the same culture conditions is also important for informing the desired cell type for application of interest.
While 2D culture on tissue-culture plastic (TCP) remains the standard of practice, the field is shifting toward 3D culture models for both fundamental and applied studies of cell function and fate inspired by native cellular microenvironments (Liu and Segura, 2020). For well-defined 3D cultures, synthetic hydrogels have shown relevance as 3D cell culture platforms for testing hypotheses about cell-microenvironment interactions, including with the extracellular matrix (ECM), and for providing well-defined, tunable, and robust properties. For example, previous work has shown that the stiffness of hydrogel-based synthetic ECMs, presence of specific adhesive ligands, and degradability significantly affect macrophage responses in both 2D and 3D culture (Cha et al., 2017; Kim et al., 2019; Bomb et al., 2022; Bomb et al., 2023). Researchers have also shown that biomaterial properties, such as porosity, topography, geometry, hydrophobicity, applied forces, and viscoelasticity, also impact cellular response (Rayahin et al., 2015; Zhou et al., 2021). The microenvironment, as well as the cell choice, will dictate polarization and functionality of macrophages, and both should be carefully considered for in vitro immune modeling. Amongst synthetic systems, poly (ethylene glycol) (PEG)-based hydrogels linked and modified with peptides are widely used for their tunability and biocompatibility. PEG is bioinert; therefore, bioactive ligands can be integrated to allow cell adhesion and present biochemical cues relevant to the tissue of interest, and concentration and crosslinking of the polymer and peptide building blocks can be used to control stiffness (Lou and Mooney, 2022; Wiley et al., 2022; Brady et al., 2023). Recently, bioprinting has emerged with the potential to replace manual preparation of hydrogels for creating 3D cultures with consistency and high-throughput and facilitating studies of cellular interactions within physiologically relevant microenvironments (Sun et al., 2021; Du et al., 2022). As these biomaterials-based tools enable ECM mimicry, their coupled role in understanding macrophage response as a function of cell origin and tissue-specific response remains an important area of research, from understanding design rules to elucidating underlying biological mechanisms.
In this work, we examined the phenotypical and functional profile of different macrophage cell lines (i.e., RAW 264.7, MH-S, and IC-21) and primary cells (i.e., BMMs and PMs) for insights into their similarities and differences. In traditional 2D culture, we first investigated the marker expression of untreated or naïve macrophage cell lines and primary cells, then evaluated the polarization profile upon M1 and M2 stimulation, phagocytic profile, and repolarization with alternative stimuli in TCP culture conditions. To characterize the phenotype of the cell, we focused on traditional surface and intracellular markers (CD86, MHCII, CD206, and EGR2), quantified by flow cytometry to provide a cell-by-cell analysis. Our observations highlighted the differences in macrophage response obtained from different sources (Figure 1). We then further explored the behavior of primary versus immortalized macrophages encapsulated in bioprinted PEG-peptide synthetic ECMs, specifically focusing on cells that were bone-marrow derived (BMMs and RAW 264.7) as prototypical macrophages often used in general studies of immune cell responses. We employed the RASTRUM™ bioprinter for creating well-defined 3D cultures of immune cells within in a multiwell plate format, where the RASTRUM™ is capable of synthesizing synthetic ECMs with combinations of adhesive peptides (e.g., RGD, GFOGER, and DYIGSR), whole proteins, and enzyme-degradable linkers inspired by the native ECM (Mahmodi et al., 2021; Du et al., 2022). Overall, our results can inform the macrophage choice for 3D cell culture or more broadly to assess the immune response to emerging biomaterial technologies.
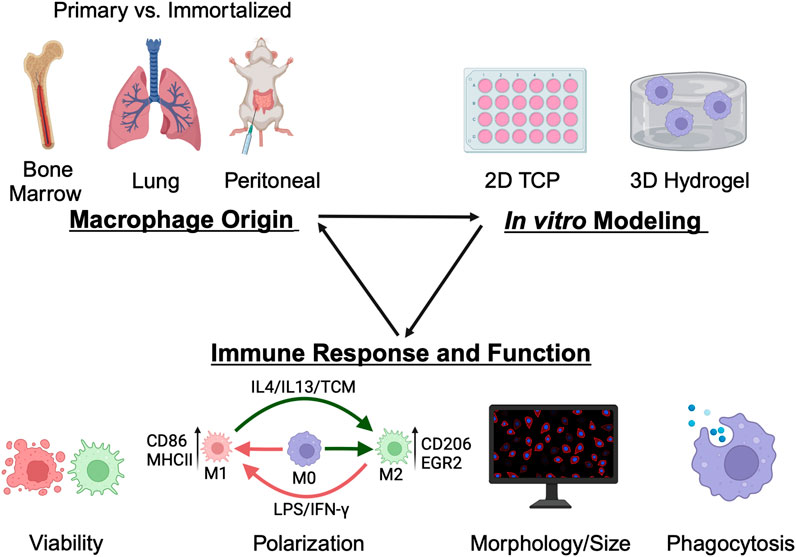
Figure 1. Overview of methodology. Common macrophage sources, both immortalized and primary, from various tissue origins (lung, peritoneal, and bone-marrow) were analyzed for functional and phenotypic differences in both traditional tissue-culture plastic and in 3D hydrogel culture to inform cell choice for in vitro applications in biomaterial evaluation, hypothesis testing, and therapeutic screening. Figure created using BioRender.com.
MH-S, IC-21, and RAW 264.7 murine cell lines were purchased from American Type Culture Collection (ATCC, Manassas, Virginia, United States). All the cells were cultured between passages 2–10 in complete media, RPMI 1640 Medium (ThermoFisher Scientific) supplemented with 10% heat-inactivated fetal bovine serum (certified Gibco heat inactivated, USA origin) and 1% penicillin/streptomycin. Primary BMMs and PMs were isolated from healthy BALB/c and C57BL/6 mice (6–12 weeks old, Jackson Laboratories, Bar Harbor, Maine, United States), respectively, following the approved Institutional Animal Care and Use Committee (IACUC) protocol at the University of Delaware. Bone marrow was extracted from femurs and tibias, and cells were cultured in BMM differentiation media (complete media supplemented with 30% L929 conditioned media) until confluent in a T-75 flask before using for the experiments. PMs were isolated using a peritoneal lavage. Cells were isolated and cultured per standard techniques (Gonçalves and Mosser, 2015). The cells were centrifuged (500 g for 5 min) and resuspended in complete media and allowed to attach overnight before using for the experiments.
Cells were seeded, allowed to adhere for 24 h, then stimulated with M1 or M2 stimuli for 24 h. Immortalized cell lines (seeded at 10e5 cells/well in a 6-well plate) were polarized with M1 and M2 stimuli for 24 h to compare the polarization profile of the cell line. The polarization profile of primary cells was determined by treating the cells (seeded at 50e5 cells/well in a 6-well plate) with M1 or M2 stimuli for 24 h. Cell lines were seeded at a lower density to account for their higher proliferation rates, assuming the cells lines would double approximately twice between seeding and flow cytometry analysis while primary cells would exhibit limited proliferation and potentially lower viability within the same timeframe.
Lipopolysaccharides (LPS) (20 ng/mL, Escherichia coli O111:B4 [Millipore Sigma, Rockville, MD, United States]) and interferon (IFN)-γ (20 ng/mL, PeproTech®) were used as M1 stimuli. Interleukin (IL)4/IL13 (10 ng/mL each, PeproTech®) was used as M2 stimuli. IL4/IL13 (10 ng/mL each) supplemented with 50% tumor-conditioned media (TCM) from A549 cells (IL4/IL13/TCM) was used as a tumor-conditioned stimuli. The cytokine concentration was decided based on values found in previous literature, where concentrations between 10 ng/mL to 100 ng/mL are typical for polarization stimuli (Andreakos et al., 2004; Edwards et al., 2006; Genin et al., 2015; Bomb et al., 2022).
To compare the plasticity of different cell lines, pre-polarized macrophages (M1 or M2) receiving 24 h of dose 1 were repolarized with either the same stimuli or a different stimulus for an additional 24 h with dose 2 (Supplementary Figure S1). The polarization profile was quantified using flow cytometry.
The plasticity index (PI) was defined to assess the relative polarization of macrophages to alternative stimuli compared to the polarization with the same stimuli. PI was quantified separately for each marker using median fluorescence intensity (MFI) using Eqs 1, 2 (for M1 markers) and Eqs 3, 4 (for M2 markers), where subscripts indicate either dose 1 (initial polarization) or dose 2 (plastic change). A (+) sign convention was adopted for when the repolarization would be expected to align with upregulation of the marker type (i.e., + for M1 markers of CD86 and MHCII when M2→M1; (−) for M1 markers when M1→M1). Absolute values >1 indicate that cells were plastic and experienced repolarization upon secondary stimuli based on the respective marker.
M1 Markers (CD86, MHCII)
M2 Markers (CD206, EGR2)
The phagocytic ability of cell lines was determined by quantifying the uptake of fluorescent (FITC) phosphatidylcholine (PC) coated lipid microparticles (3 μm diameter, Echelon Biosciences, Salt Lake City, Utah, United States). Uniform PC particle suspension (achieved by sonication and vortexing) was seeded (∼2 particles per cell) on polarized cell lines (20 ng/mL IFNγ or 10 ng/mL each IL4/13). The particle uptake was determined after 6 h by quantifying particle positive cell population [% PC positive (+ve)] and MFI of the internalized particles using flow cytometry on FITC channel.
Cells on TCP were detached using Accutase (Innovative Cell Technologies, Inc.) for 30 min and washed with phosphate buffered saline (PBS), followed by staining with Zombie Yellow (10 min). Cells were blocked with anti-CD16/32 (Fc block) and immunostained with anti-CD86 and anti-MHCII (30 min). Cells were then fixed with 4% paraformaldehyde (PFA) in PBS (15 min), permeabilized using Intracellular Staining Permeabilization Wash Buffer (BioLegend), and immunostained with anti-CD206 and EGR2 (30 min). Further information on antibodies can be found in Supplementary Table S1. BMMs and PMs were gated on CD11b and F4/80 double positive. For internalization studies, cells were washed twice with FACS buffer (2% FBS in PBS) to remove unbound particles and quenched with 0.4% Trypan Blue dye to quantify internalized particles. Samples were analyzed using ACEA NovoCyte Flow Cytometer. The gates were set using untreated samples and MFI was plotted for each marker (Supplementary Figures S2–S4).
Cell lines (seeded at 10e4 cells/well) and primary cells (seeded at 50e4 cells/well) were washed with PBS and fixed with 4% PFA (15 min). Note, higher cell seeding density was selected for terminally differentiated primary cells given their lack of proliferation over time. Cells were permeabilized by washing with 0.2% Triton-X (5 min) and stained with 2:250 Phalloidin-Rhodamine (ActinRed™ 555 ReadyProbes™ Reagent, Invitrogen™) for 20 min. Cells were washed with PBS and incubated with 70 nM 4',6-diamidino-2-phenylindole (DAPI) (Invitrogen™) for 10 min to stain nuclei. Cells were imaged on BioTek Cytation 5 Multimode Imager. Cell area and circularity were analyzed using Fiji imaging package for the ImageJ2 1.53q software. For morphological analysis, the area selection tool was used to trace the macrophage area and determine the cell spread manually. Circularity for each macrophage was then quantified using the built-in circularity analysis tool.
Bioinks and activators (Cat. no. Px02.29PH, 1.1 kPa with RGD, GFOGER, YIGSR, and HA) were generously provided by Inventia Life Science (Sydney, Australia). The 3D cultures were printed using the RASTRUM™ bioprinter (Inventia Life Science) following protocols previously described for breast cancer cell lines (Engel et al., 2022). Briefly, the printing protocol was created via RASTRUM™ Cloud (Inventia Life Science). Cells were seeded in the F177 activator at a density of 20e6 cells/mL (BMMs) and 5e6 cells/mL (RAW 264.7) and printed within Large Plug model in a 96-well plate (Corning—#CLS3904). The Large Plug model (0.5 mm in height) fills the whole surface of a well in a standard 96 well plate (surface area ∼0.32 cm2) as shown in previous literature (Gomila Pelegri et al., 2023). Seeding densities were varied to account for differences in proliferation between the cell types, as shown in Supplementary Figure S6. A lower seeding density of RAW 264.7 cells allowed for proliferation over the experiment time course with the aim of having the number of RAW 264.7 cells be similar to the number of BMMs after 7 days; the initial cell densities also provided a mix of cell-cell and cell-matrix interactions with single cells/small clusters of encapsulated cells throughout the 3D culture upon printing. RAW 264.7 cells were maintained in Dulbecco’s Modified Eagle’s Medium (DMEM) complete media (10% heat-inactivated fetal bovine serum and 1% penicillin/streptomycin) and BMMs were maintained in BMM culture media (DMEM with 10% heat-inactivated fetal bovine serum and 1% penicillin/streptomycin supplemented with 30% L929 conditioned media).
The viability of macrophages in 3D culture was assessed by a LIVE/DEAD Viability/Cytotoxicity Kit (ThermoFisher Scientific). The LIVE/DEAD kit contained calcein-AM to indicate viable cells (live cells fluoresce green; excitation [ex.] 494 nm, emission [em.] 517 nm) and ethidium homodimer-1 to label dead cells (dead cells fluoresce red; ex. 528 nm, em. 617 nm). Hydrogels were washed 3x with PBS + 3 min PBS incubation, then incubated (37°C, 5% CO2) for 10 min in a solution of calcein-AM (2 µM) and ethidium homodimer-1 (4 µM). After incubation, hydrogels were washed 3x with PBS + 3 min PBS incubation. Hydrogels were imaged with a confocal microscope (LSM 800, Zeiss; ×10 objective and frame size of 1,024 × 1,024, 180 µm z-stack, 8.38 µm/stack, three images per sample). Cell viability was quantified with Imaris 9.9.1 imaging software (Oxford Instruments) using Find Surfaces for AF488 (green) channel and Rhoda (red) channel functions. The percentage of viable cells was calculated by the number of green cells/total number of cells × 100%.
For 3D Immunostaining, cells were washed with PBS and fixed with 4% PFA (15 min). Cells were permeabilized by washing with 0.2% Triton-X (5 min) and stained with Phalloidin-Rhodamine (2:50, 20 min). Cells were washed with PBS and incubated with Hoechst 33342 solution (ThermoFisher Scientific) (1:200) to stain nuclei. Hydrogels were imaged with a confocal microscope (LSM 800, Zeiss; ×20 objective and frame size of 1,024 × 1,024, 200 µm z-stack, 2 µm/slice, three images per sample). Cell area and circularity were analyzed using Fiji imaging package for the ImageJ2 1.53q software. For morphological analysis, the area selection tool was used to trace the macrophage area and determine the cell spread manually. Circularity for each macrophage was then quantified using the built-in circularity analysis tool.
All centrifugation steps and washes were complete at 500 g for 5 min. Cells were retrieved from hydrogel matrix to complete downstream flow cytometry analysis. Here, 75 µL of cell retrieval solution (F235, Inventia Life Science) was added to each well for 45 min to enzymatically degrade the hydrogel matrix followed by addition of 100 µL of PBS. To remove contents from the well, 3x PBS washes were performed, passed through a 70 μm cell strainer, and centrifuged and washed 2x with 2% FBS in PBS buffer. Cells were used for flow cytometry analysis as described in Section 2.5.
GraphPad Prism 9 was used to perform statistical analyses. All quantitative data are represented as mean ± standard error of the mean. Tukey’s multiple-comparison test was used to generate p-values in ANOVA multiple comparisons unless stated otherwise. Three or more biological replicates were used for statistical analysis.
We first investigated the baseline expression of M1 and M2 markers and morphology for both untreated cell lines and primary cells to understand basal profiles. RAW 264.7 (BALB/c origin, monocyte-derived), IC-21 (C57BL/6 origin, peritoneum), and MH-S (BALB/c origin, lungs) cells were selected as immortalized cell lines. BMMs (BALB/c and C57BL/6 origin) and PMs (C57BL/6 origin) were selected as primary cells. Cells were seeded for 24 h before analyzing M1 (CD86 and MHCII) and M2 (CD206 and EGR2) markers using flow cytometry. M1 and M2 markers were selected based on our previous work (Jarai and Fromen, 2022), where we showed the specific marker expression strongly correlated with polarization stimuli.
Statistically significant differences were observed for all the markers between different cell lines (Figure 2A). RAW 264.7 cells showed the lowest marker expression for both M1 and M2 markers compared to MH-S and IC-21 cells. We hypothesize that the low marker expression for RAW 264.7 cells is due to the monocyte-derived origin of the cell line, while both MH-S and IC-21 are sourced from tissue-resident macrophage cell lines, where the baseline expression differs depending on the tissue type. This is also reported in previous literature where BMMs showed differences in marker expression compared to tissue-resident macrophage counterparts both in the lung and the peritoneal cavity (Misharin et al., 2017; Zhao et al., 2017). IC-21 cells showed the highest basal M2 marker expression of both CD206 and EGR2. This basal phenotypical skewing is somewhat counterintuitive to the genetic background of the strain used to isolate the cells; RAW 264.7 and MH-S cells are derived from BALB/c mice, which is characterized as a more Th2 strain, whereas IC-21 cells are derived from C57BL/6 mice, which is characterized as a more Th1 strain (Santos et al., 2006; Jones et al., 2013). However, we speculate these basal M1 and M2 dispositions are attributed to the extent of macrophage differentiation. This is also highlighted in previous studies, which showed a higher M2 marker expression on cells correlated with macrophage differentiation marker expression (F4/80) irrespective of the genetic background of the mice (Chamberlain et al., 2009; Chamberlain et al., 2015). Furthermore, MH-S cells had the lowest surface area and a statistically higher circular morphology compared to both IC-21 to RAW 264.7 cells. This may be due to the increased surface tension observed for AMs resulting in a more circular morphology. Also, F-actin staining of MH-S cells showed that actin structure was diffuse in the cytoplasm, whereas for both IC-21 and RAW 264.7 cells, increased formation of cytoplastic protrusions was observed.
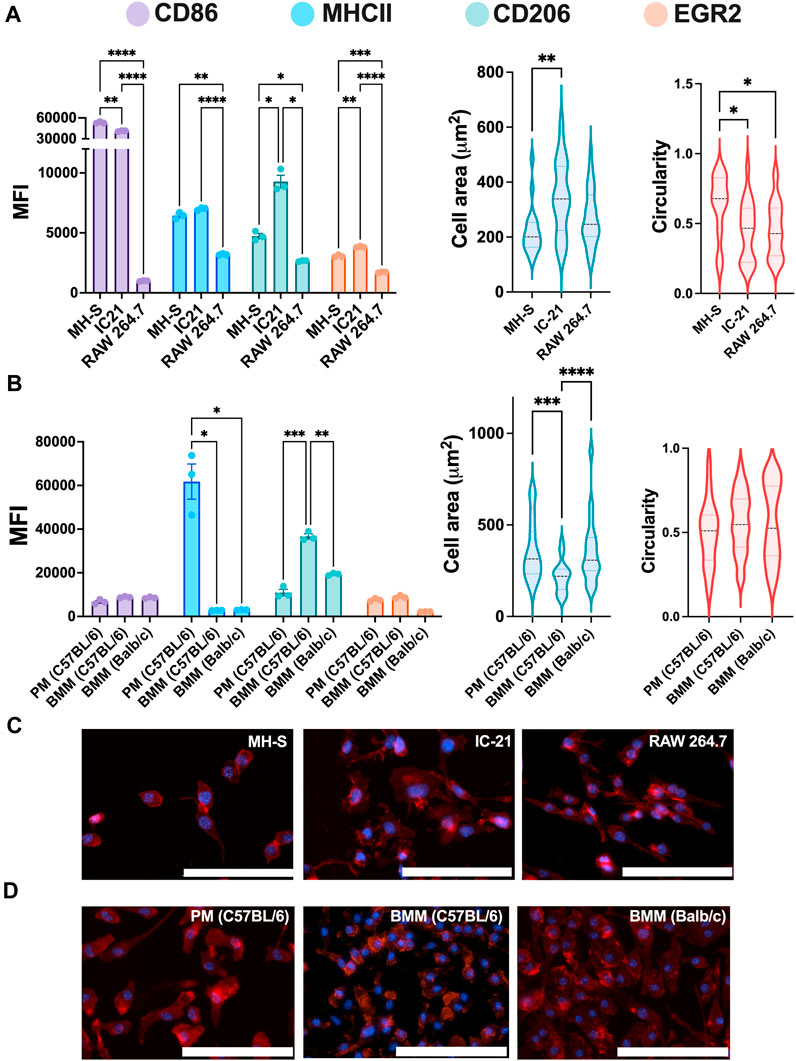
Figure 2. Phenotypical characterization of macrophages from different origins. The Phenotypical characterization and morphology of (A) untreated macrophage cell lines (n = 3) and (B) untreated primary macrophages (n = 3). CD86 and MHCII were used to characterize M1 phenotype, while CD206 and EGR2 were used for M2 phenotype assessment. Cells were immunostained (C–D) for nuclei (blue) and F-actin (red), and cell morphology was quantified using cell spread and circularity characterization. Statistics were performed using Tukey’s post-hoc test with one-way ANOVA for comparing marker expression for cell lines and primary cells and cell area and circularity analysis for cell lines, *p < 0.05, **p < 0.01, ***p < 0.001, ****p < 0.0001. Scale bar: 100 µm.
Next, we looked at the marker expression and morphology for untreated ex vivo primary cells and again observed statistically significant differences between PMs and BMMs of two strains (Figure 2B). Like the cell lines, PMs showed statistically higher MHCII expression than both BMMs (C57BL/6 and BALB/c); however, contrary to cell lines, PMs showed statistically lower CD206 expression compared to BMMs. BMMs from C57BL/6 origin (Th1 skewed) showed higher CD206 and EGR2 expression compared to those from BALB/c origin (Th2 skewed), which again is counterintuitive. However, we hypothesize the hyper-physiological conditions of TCP may contribute to this basal expression and, as shown in our later evaluations, basal expression levels do not directly correlate to polarization potential. Unlike the cell lines, PMs and BMMs (C57BL/6 and BALB/c) showed similar elongated cell morphology. C57BL/6 BMMs had lowest mean cell area (218.7 µm2) compared to BALB/c BMMs (357 μm2) and PMs (362 μm2). These findings highlight the differences in marker expressions and cell morphology between the cell lines and the primary cells from similar tissue origin.
Next, we studied the response of M1 and M2 stimuli on macrophage cell lines. Cells were polarized for 24 h with M1 (LPS or IFNγ) or M2 (IL4/13 or IL4/3/13/TCM) stimuli for 24 h before analyzing the phenotypical profile using flow cytometry and normalizing MFI to the untreated (UT) condition of each cell type, where upregulation of a particular marker is indicated by a normalized MFI greater than 1. For M1 markers (CD86 and MHCII, Figures 3A, B, respectively), IFNγ promoted a robust marker expression across all the cell lines; however, LPS only resulted in increased M1 marker expression for RAW 264.7 cells. MHCII, an antigen presentation marker, was highly upregulated in M1-stimulated RAW 264.7 cells, followed by MH-S and IC-21 cells (Figure 3B). RAW 264.7 cells are of monocyte-derived origin that has been shown to closely resemble primary BMMs (Berghaus et al., 2010). Furthermore, Zajd et al. reported that compared to PMs, primary BMMs (C57BL/6) are skewed more toward a M1 phenotype when stimulated, which may explain both increased MHCII and CD86 marker expression in RAW 264.7 cells (Zajd et al., 2020). Reduced M1 marker expression upon M1 stimulation in IC-21 cells may be attributed to the origin of tissue-resident macrophages. This was also reported by Stevens et al., who showed that PMs show a lower M1 response to mycobacterial infection compared to AMs (Stevens et al., 2021). Interestingly, for IC-21 cells, M2 stimuli downregulated the expression for M1 markers (statistically significant for CD86), whereas, for other cell lines, no such difference in the expression levels was observed.
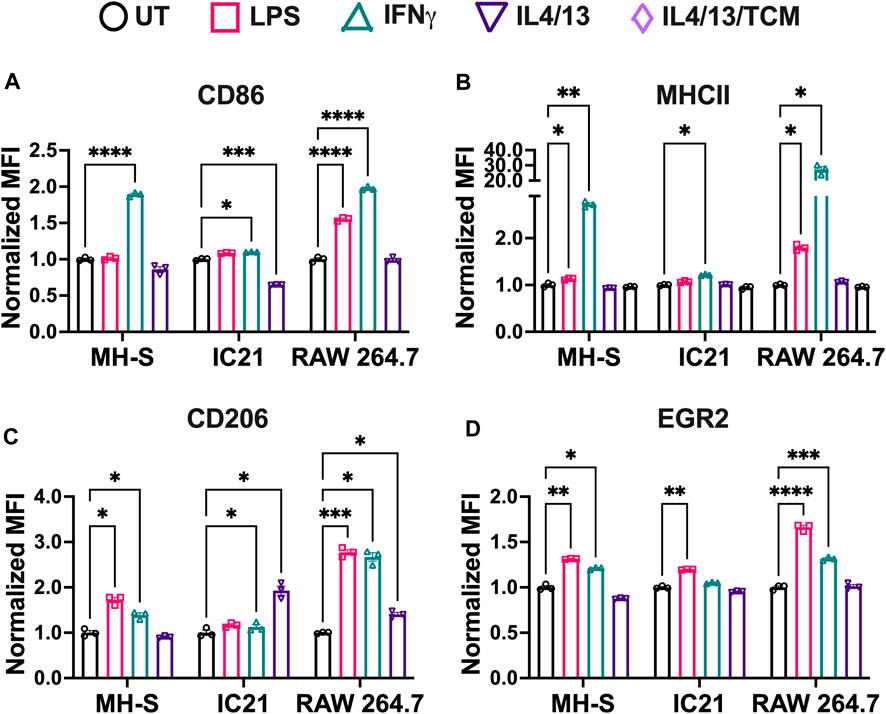
Figure 3. Phenotypical responses of macrophages from different origins stimulated with soluble factors. The phenotypical profile of macrophage cell lines was quantified by characterizing both M1 and M2 markers upon stimulation with different M1 and M2 stimuli using flow cytometry. (A) CD86 and (B) MHCII were used as M1 markers. (C) CD206 and (D) EGR2 were used as M2 markers. Statistics were performed using Tukey’s post-hoc test with one-way ANOVA. *p < 0.05, **p < 0.01, ***p < 0.001, ****p < 0.0001.
For M2 markers, we observed interesting trends. CD206 expression was upregulated by both M2 stimuli in IC-21 and RAW 264.7 cells, while no changes were observed in MH-S cells (Figure 3C). Surprisingly, for EGR2, both M2 stimuli failed to upregulate EGR2 expression (Figure 3D). These data indicate that different cell lines upregulate M2 marker expressions to different levels. A higher dose of M2 stimuli or a repeated dose of M2 stimuli might be required to effectively polarize cells and generate persistent M2 marker expression. Furthermore, M1 stimuli of LPS and IFNγ upregulated the marker expression of both CD206 and EGR2. While LPS and IFNγ are thought to be only M1 stimuli, macrophages exist on a spectrum and therefore can express both inflammatory and anti-inflammatory markers at the same time (Mosser and Edwards, 2008; Smith et al., 2016). Further, macrophages generally progress from inflammatory to anti-inflammatory over time (Risser et al., 2023). Previous works have shown that LPS led to increased expressed of M2-like markers and cytokines, (such as IL-10, Arg1, CD206) (Ci et al., 2010; Zhang et al., 2019; Zhen et al., 2023). Further, immortalized cells lines have chromosomal abnormalities or mutations that allow their propagation, which may also affect polarization markers; therefore, the choice to use a cell line should be carefully considered.
For M1 stimuli, compared to IFNγ stimulation, LPS-stimulated cells showed reduced M1 marker expression across the cell lines. IFNγ stimulation is modulated by JAK-STAT pathway, which promotes the upregulation of pro-inflammatory genes leading to immediate response to IFNγ (Sikorski et al., 2012). In addition to pro-inflammatory genes, interferon regulatory factors are also secreted, which helps sustain IFNγ induced response. On the other hand, LPS stimulation is modulated by Toll Like Receptor 4 (TLR4) signaling to promote upregulation of pro-inflammatory genes and induce an M1 response. However, due to a lack of sustained pro-inflammatory response, LPS stimulation might generate a weaker M1 stimulation compared to IFNγ at equivalent mass dosages. Furthermore, IFNγ stimulation also regulates the transcription of interferon-stimulated gene, which contributes to the upregulation of MHC molecules (Ivashkiv, 2018). Our results follow this trend where MHCII expression is upregulated more by IFNγ compared to LPS across all the cell lines.
For M2 stimuli, IL4 and IL13 were used together for M2 stimulation because both IL4 and IL13 have been shown to involve phosphorylation of STAT6, which promotes STAT6 translocation to the nucleus to regulate the transcription of M2 genes and promote M2 polarization (Gordon and Martinez, 2010). Further, adding tumor-conditioned stimuli with IL4 and IL13 yielded a similar phenotypical profile as IL4/13 stimulation. This may be due to the heterogeneous source of tumor-conditioned stimuli, which in our study was obtained from A549 cells (human-derived lung cancer cells) for use with murine macrophages. Previous studies have successfully shown differences in the phenotypical profile of macrophages using tumor-conditioned stimuli from homogenous sources for both mice and human models (Benner et al., 2019; Little et al., 2019). Based on these observations, we selected IFNγ and IL4/13 for further evaluation.
Overall, our results indicate that the RAW 264.7 cell line is the most responsive to both M1 and M2 stimuli compared to both MH-S and IC-21 cells. This robust response, as well as quick proliferation, may be a reason why these cells are extensively used within in vitro characterizations in the literature.
Next, we assessed the effect of these stimuli on the cell morphology of different cell lines by quantifying cell area and cell circularity (Figure 4A). In general, MH-S cells exhibited a trend of lower cell spread and higher circular morphology compared to both IC-21 and RAW 264.7 cells (Figures 4B, C). This difference could arise from the cell origins, where AMs reside at the air-liquid interface in the lung and face increased surface tension resulting in a more circular morphology with compact actin fiber assembly. The area of both MH-S and IC-21 cells was independent of M1 and M2 stimuli, while LPS significantly increased the area of RAW 264.7 cells, highlighting differences in stimuli-dependent morphology changes amongst different cell lines (Figure 4B). Next, we quantified the circularity of the cells to determine cell elongation upon stimuli treatment (Figure 4C), where McWhorter et. al have reported a higher circularity upon M1 stimuli treatment and lower circularity or increased cell elongation upon M2 stimuli treatment (McWhorter et al., 2013). We observed that cell morphology, like cell spreading, exhibited trends of dependence on tissue of origin. For example, MH-S cells showed a more circular morphology independent of the stimuli, while IC-21 cells showed a higher circularity with M1 stimuli and a more elongated morphology upon M2 stimuli treatment, as previously reported in the literature. For IC-21 cells, morphological changes correlated well with phenotypical changes, where M1 marker expression (CD86) was increased with M1 stimulation and decreased with M2 stimulation (Figure 3A). Interestingly, for RAW 264.7 cells, IL4/13 treatment significantly increased cell circularity.
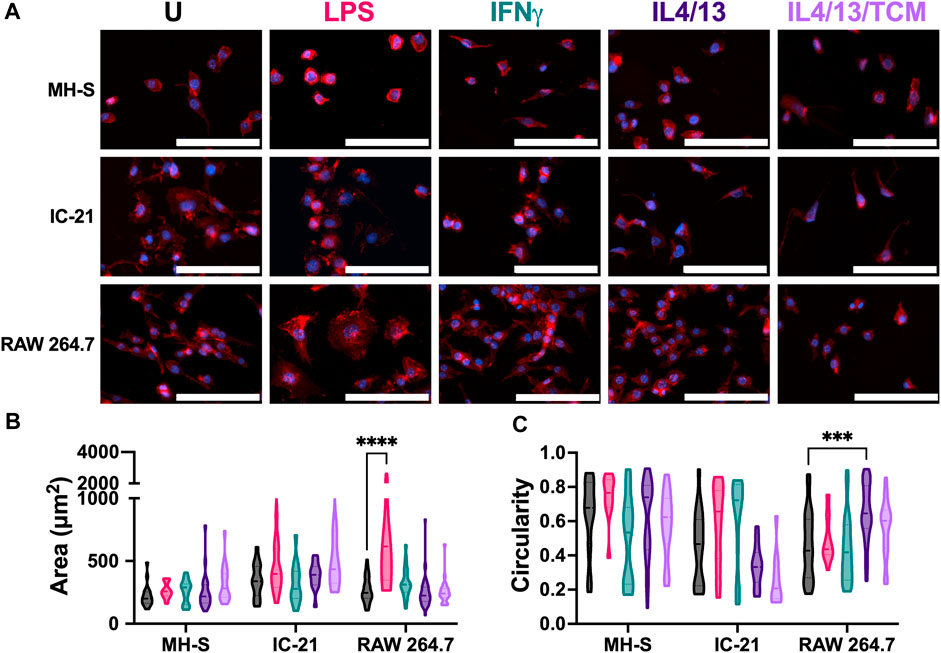
Figure 4. Morphological responses of macrophages from different origins stimulated with soluble factors. The effect of polarization stimuli on cell morphology of different cell lines was determined. (A) Representative image of cells with nuclei (blue) and F-actin (red) qualitatively show morphological differences between different cell lines across all the treatment groups. (B) Cell area and (C) circularity were quantified for all the cell lines across different conditions. Statistics were performed using Tukey’s post-hoc test with one-way ANOVA. ***p < 0.001, ****p < 0.0001. Scale bar: 100 µm.
Overall, we report cell line-specific differences in morphology in response to different stimuli. Except for RAW 264.7 cells, we did not observe statistically significant changes in morphology upon stimuli treatment. We hypothesize this may be due to the stiff TCP substrate used in the experiments. The stiffness of many body tissues is in the kilopascal (kPa) range, while the stiffness of these culture dishes is in the gigapascal range, which may negate the effect of soluble stimuli on cell morphology. We, along with others, have shown an increased morphological response to stimuli treatment when cultured on a more physiologically relevant substrate (Sridharan et al., 2019; Bomb et al., 2022).
Phagocytosis is a critical macrophage function responsible for the uptake and removal of foreign pathogens to maintain homeostasis and is often impaired in diseased conditions (Allard et al., 2018). We investigated the effect of polarization stimuli on phagocytosis in different cell lines by using fluorescent lipid microparticles coated with PC as phagocytic mimics and allowed the cells to internalize the particles for 6 h. Uptake of the PC microparticles was confirmed in all the cell lines with the presence of a second peak (Figure 5A, gray), which is quantified in Figure 5B. For the untreated condition, RAW 264.7 cells showed the highest particle uptake, followed by IC-21 cells and MH-S cells. This trend was observed for both the M1 and M2 polarization conditions as well. Wang et al. reported similar observation in primary cells, where BMMs showed increased uptake compared to PMs, highlighting phagocytic similarities between primary cells and immortalized cell lines (Wang et al., 2013). Quantitative analysis of % PC + ve cells further confirmed the uptake profile (Figure 5B). For all the experimental conditions, MH-S cells (∼30% UT, ∼34% IFNγ, ∼34% IL4/13) showed the lowest uptake, followed by IC-21 (∼37% UT, ∼36% IFNγ, ∼41% IL4/13) and RAW 264.7 cells (∼45% UT, ∼45% IFNγ, ∼45% IL4/13). Furthermore, stimuli-related effects on phagocytosis were cell-line dependent. While RAW 264.7 cells did not show changes in phagocytosis on polarization, phagocytosis by both MH-S and IC-21 cells was sensitive to stimuli treatment in different ways. For MH-S cells, the polarization with both M1 and M2 stimuli increased the uptake compared to untreated cells; however, for IC-21 cells, only M2 stimuli increased the uptake, again highlighting the impact of tissue origin differences.
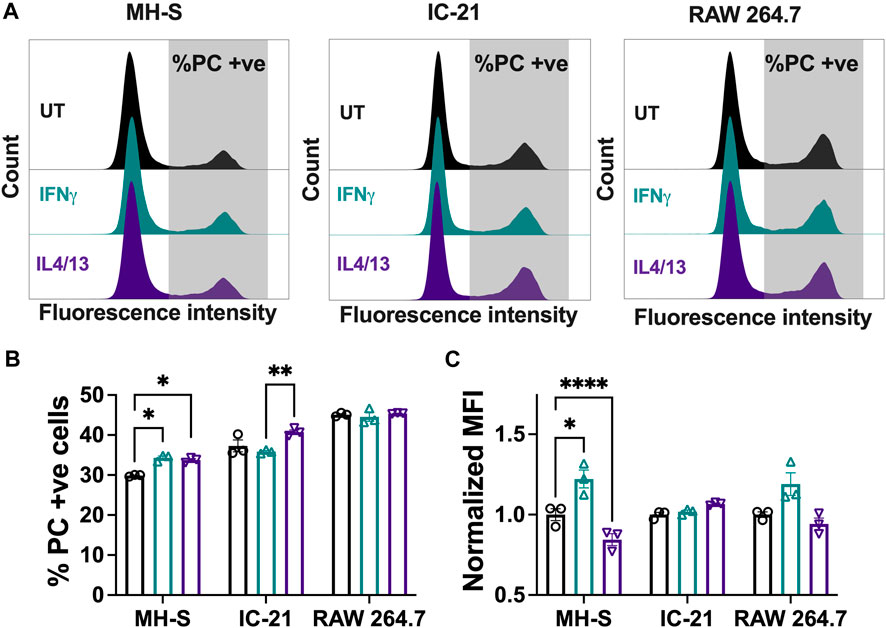
Figure 5. Phagocytic responses of macrophages from different origins stimulated with soluble factors. The effect of polarization stimuli on phagocytosis of phosphatidylcholine (PC) coated fluorescent microparticles by different cell lines was determined. (A) Representative histograms of population of cells that internalized PC microparticles. (B) Quantification of population of cells (%) that internalized PC microparticles and (C) normalized median fluorescence intensity (MFI) of the internalized particles. Statistics were performed using Tukey’s post-hoc test with one-way ANOVA. *p < 0.05, ***p < 0.001, ****p < 0.0001.
We also evaluated uptake via the normalized MFI (Figure 5C), where a higher normalized MFI value indicates a higher number of average internalized particles. For MH-S cells, we observed a significantly higher normalized MFI with IFNγ stimulation, while the normalized MFI was significantly reduced with IL4/13 stimulation compared to the untreated condition. A similar trend was observed for RAW 264.7 cells but was non-significant. This suggests that, for different cell lines, the polarization of macrophages not only impacts how many cells uptake particles but also influences how active individual cells are in their ability to internalize multiple particles.
Overall, we highlight that different cell lines have different propensities to internalize particles, which are further influenced by the polarization stimuli. Both the proportion of phagocytic cells and normalized MFI yield differential insights and are important considerations in investigating the phagocytic capacity of the macrophages.
We next investigated the relative repolarization capacity of different cell lines. Pre-polarized cells were treated with either IFNγ or IL4/13 (dose 2), and the phenotype of the repolarized macrophages after 24 h with dose 2 was quantified using flow cytometry. Repolarization of macrophages was determined by quantifying the PI for each marker, which normalizes the change in expression of final phenotype to the initial phenotype (Figure 6). A negative PI value indicates: 1) a decrease in M1 marker expression for (M1 to M2) repolarized macrophages compared to M1 macrophages and 2) a decrease in M2 marker expression for (M2 to M1) repolarized macrophages compared to M2 macrophages. In contrast, a positive PI value indicates: 1) an increase in the M1 marker expression for the (M2 to M1) repolarized macrophages compared to the M2 macrophages and 2) an increase in the M2 marker expression for (M1 to M2) repolarized macrophages compared to M1 macrophages. We compared PI for (M1 to M2) polarization (black bars) with (M2 to M1) polarization (pink bars). If the magnitude of the PI for (M1 to M2) polarization is higher than (M2 to M1) polarization, then it is easier to polarize cells to M2 phenotype, and vice versa. Similar values of the PI highlight that the cells can be repolarized to either stimulus effectively.
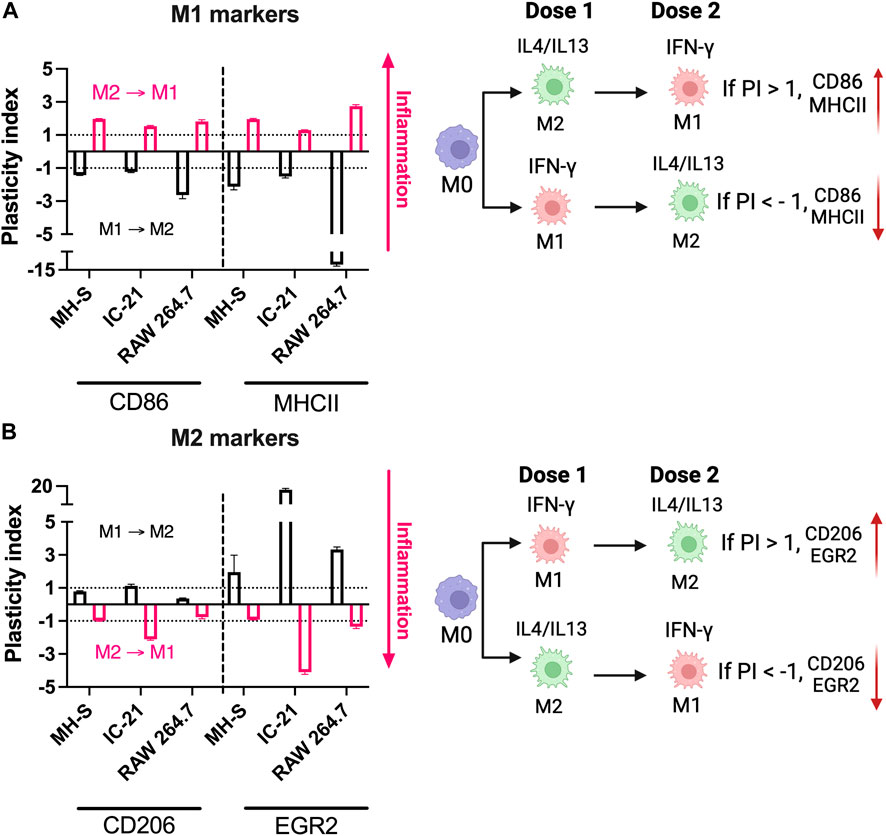
Figure 6. Repolarization responses of macrophages from different origins stimulated with soluble factors. Relative repolarization of different macrophage cell lines was determined by quantifying the PI for both (A) M1 and (B) M2 markers. The M1 to M2 PI was calculated by repolarizing IFNγ-treated cells to IL4/13 treated cells, and M2 to M1 PI was calculated by repolarizing IL4/13 treated cells to IFNγ.
For example, for RAW 264.7 cells, PI for MHCII (M1 marker) was ∼ (−) 12.07 for (M1 to M2) repolarized macrophages and ∼ (+) 2.74 for (M2 to M1) repolarized macrophages; similarly, for IC-21 cells, PI for EGR2 (M2 marker) was ∼ (+)17.04 for M1 to M2 repolarized macrophages and ∼ (−)4.09 for M2 to M1 repolarized macrophages, highlighting changes in the individual marker expression upon repolarization (Figure 6). Overall, for MH-S cells, (M1 to M2) polarized cells had a higher PI for EGR2; (M2 to M1) polarized cells had higher PI for CD86. At the same time, both MHCII and CD206 showed similar PI values, indicating a similar level of plasticity. For IC-21 cells, (M1 to M2) polarized cells had a higher PI for MHCII and EGR2, while (M2 to M1) polarized cells had a higher PI for CD86 and CD206. For RAW 264.7 cells, (M1 to M2) polarized cells had a higher PI for CD86, MHCII, and EGR2. In contrast, CD206 had a higher PI for (M2 to M1) polarized cells.
These results suggest that not all macrophage cell lines respond similarly to repolarization. For example, for RAW 264.7 cells, it is easier to repolarize M1 polarized cells to M2, whereas the M2 polarized cells dampen the repolarization response to M1 stimuli. This observation is in-line with their strain background of Th2, indicating a preference towards M2-phenotypes. On the other hand, MH-S cells were more plastic and responded similarly to M1 and M2 repolarization. IC-21 cells showed a relatively higher EGR2 PI than other markers, suggesting an increased propensity to repolarize towards the M2 phenotype. Previous literature, to our knowledge, has investigated either M1 or M2 repolarization of macrophages, which limits our understanding of macrophage plasticity to either phenotype. For example, PMs have been shown to repolarize to either M1 or M2 macrophage phenotype in the presence of different therapeutic modalities (Farajzadeh et al., 2018; Moradi-Chaleshtori et al., 2021). However, to determine plasticity, the repolarization of macrophages should be investigated using both M1 and M2 stimuli simultaneously. This was previously demonstrated by Smith et al. where BMMs increasingly repolarize from the M1 to M2 phenotype; however, the M2 phenotype inhibits repolarization to the M1 phenotype (Smith et al., 2016). These observations, along with our results, are important for immune-engineering applications reliant on repolarization paradigms (Jarai et al., 2023).
Analogous to Figures 2, 3, we next assessed the phenotypical profile and morphology of primary macrophages extracted from mice of relevant genetic background and cultured ex vivo. As mentioned, macrophage phenotypes vary among strains; therefore, we assessed BMMs from both BALB/c and C57BL/6 mice. For both types of BMMs, M1 stimuli of IFNγ significantly upregulated both CD86 (Figure 7A) and MHCII (Figure 7B) marker expression. Notably, C57BL/6 BMMs had higher upregulation of both M1 markers (MHCII and CD86), which is consistent with previous literature that shows macrophages from C57BL/6 mice are more responsive to inflammatory stimuli (Santos et al., 2006). While M2 stimuli IL4/13 significantly upregulated CD206 (Figure 7C) for both strains, IL4/13 upregulated EGR2 for only BMMs from BALB/c mice, not C57BL/6 mice (Figure 7D), again consistent with the genetic background. Further, CD206 was more strongly increased in BALB/c BMMs compared to C57BL/6 BMMs. These data further align with BALB/c being a predominantly Th2 strain (Watanabe et al., 2004; Santos et al., 2006; Jones et al., 2013). This point is further illustrated by calculating the ratio of M1 and M2 markers (Supplementary Figure S5). C57BL/6 BMMs exhibited higher M1/M2 when stimulated with IFNγ. BALB/c BMMs exhibited higher M2/M1 when stimulated with IL4/IL13. For PMs, IFNγ significantly upregulated MHCII (Figure 7B) and CD206 (Figure 7C), while IL4/13 significantly upregulated MHCII (Figure 7B) and EGR2 (Figure 7D). Unlike BMMs from the same strain (C57BL/6), IL4/13 strongly upregulated EGR2 in PMs but not CD206. Upregulation of MHCII holds across all PMs and BMMs tested in response to IFNγ, while only PMs did show not an increase in CD86 when treated with either M1 or M2 stimuli.
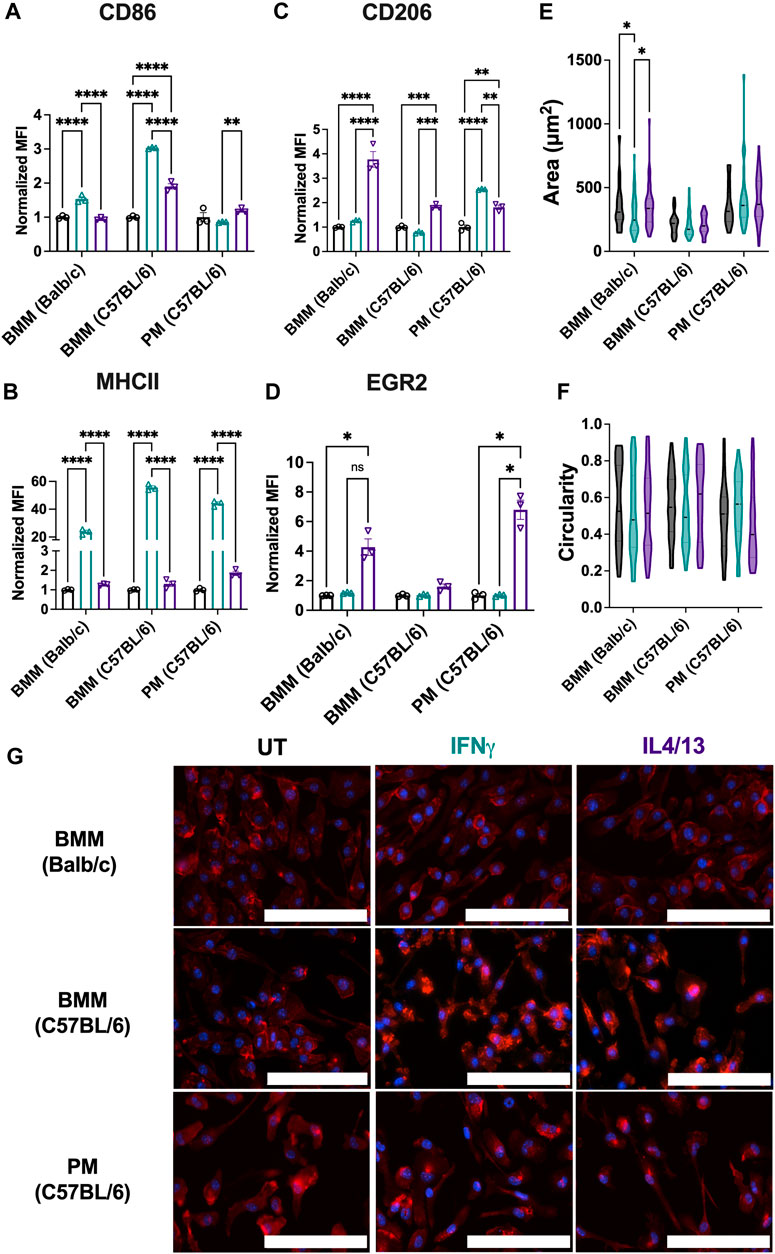
Figure 7. Phenotypical and phagocytic responses of macrophages from different origins upon repolarization. The effect of polarization stimuli on macrophage polarization and phagocytosis was determined for primary bone marrow-derived macrophages (BMMs) and peritoneal macrophages (PMs). (A) CD86 and (B) MHCII were used as M1 markers. (C) CD206 and (D) EGR2 were used as M2 markers (E) Cell area and (F) circularity were quantified for all the primary cells across different conditions. (G) Representative images of cells with nuclei (blue) and F-actin (red) qualitatively show morphological changes between different cell lines across all the treatment groups. Statistics were performed using one-way ANOVA. *p < 0.05, **p < 0.01, ***p < 0.001, ****p < 0.0001. Scale bar: 100 µm.
Comparing cell lines to their primary cell counterparts (Figures 3, 7), some differences in the marker expression in the primary cells were observed: these include 1) IL4/13 stimulation upregulated EGR2 marker expression in BMMs (BALB/c) and PMs, whereas no change in the marker expression was observed for the cell line counterparts (RAW 264.7 and IC-21); 2) for IFNγ stimulation, the MHCII expression was similar for both RAW 264.7 and BMMs (BALB/c), whereas PMs showed a much higher increase in the fold change (∼44.1X) compared to IC-21 cells (∼1.2X). We hypothesize this is due to the transcriptional and genetic changes (Ben-David et al., 2018) introduced by the immortalization of primary cells, which has previously been reported for multiple cell types including macrophages (Levenson et al., 2018) and endothelial cells (Deng et al., 2020).
Next, we assessed the morphological changes of primary cells under both M1 and M2 stimulation. BMMs from both strains and PMs showed similar cell area (Figure 7E), and circularity (Figure 7F), and elongated morphology (Figure 7G), irrespective of the stimuli. Only BALB/c BMMs showed differences in cell area due to stimuli; IFNγ treated cells had lower cell area compared to the other conditions. Similar morphology was observed for both RAW 264.7 and IC-21 cell lines compared to BMMs (BALB/c) and PMs (C57BL/6), respectively, suggesting both primary cells and cell lines show similar morphology under different activation conditions. Non-significant differences in the morphology are again attributed to the hyper-physiological stiffness of the TCP culture substrate, which promotes a more elongated morphology. Overall, our results indicate that notable phenotypical differences exist in the primary macrophages obtained from different tissues and between the cell lines and the primary cells from the same origin.
Although 2D cell culture on TCP is the standard of practice, cell function and fate are dictated by a range of biochemical and biophysical cues in their multi-dimensional microenvironments. Bioinspired 3D culture models provide opportunities for understanding immune responses in more physiologically relevant environments that are specific to the tissue of interest. Among the cell types analyzed above in 2D culture, the most widely used immortalized (RAW 264.7) and primary (C57BL/6) murine bone-marrow macrophages were chosen for culture in three dimensions for probing similarities and differences in responses of immortalized and primary cells in 3D culture. Here, we used the RASTRUMTM bioprinter to create well-defined 3D cultures in a multi-well plate format (Figure 8A), providing rigor, reproducibility, and accessibility and enabling facile imaging and cell harvesting for downstream assays. We selected a bioprinted synthetic ECM composition (1.1-kPa cell-degradable PEG-peptide hydrogel with RGD, GFOGER, YIGSR, and HA) with properties inspired by tissues from which macrophages were derived (e.g., stiffness and ligands from ECM proteins [fibronectin, collagen, laminin] relevant to lung, peritoneal cavity) (Yen et al., 1997; Bomb et al., 2022; Wodzanowski et al., 2022).
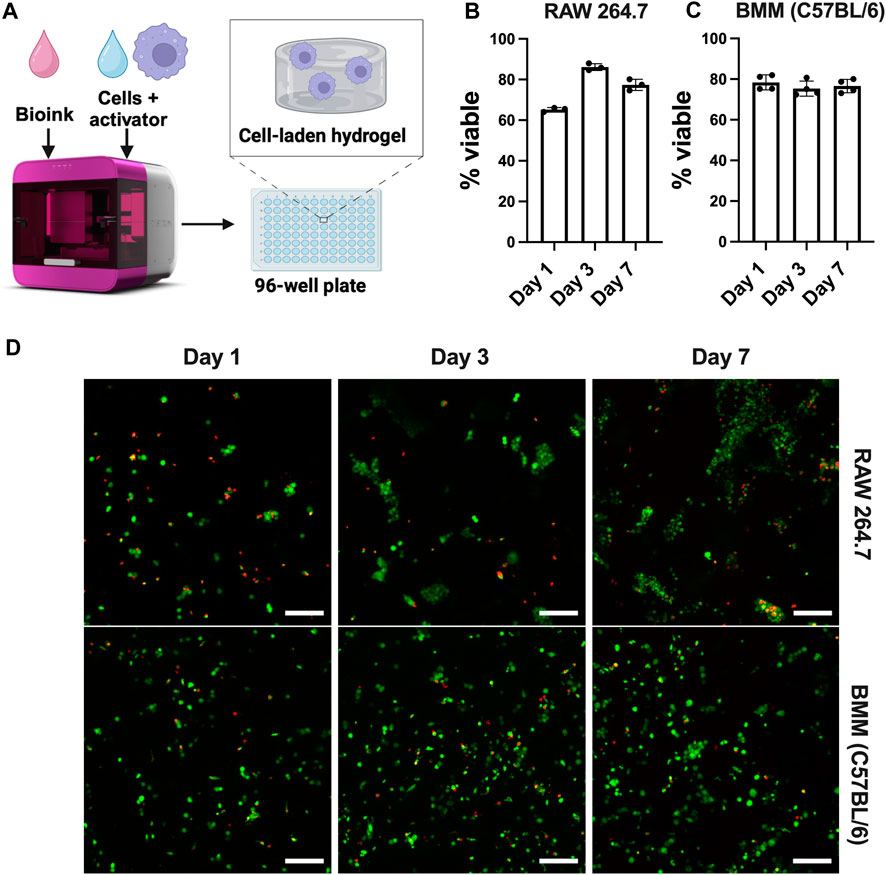
Figure 8. Well-defined, bioprinted 3D cultures of macrophages from different origins. (A) Schematic of Inventia™ bioprinter for 3D cell encapsulation. Viability of (B) RAW 264.7 cells (5E6 cells/mL) and (C) BMMs (C57BL/6, 20E6 cells/mL) encapsulated in 1.1 kPa PEG-peptide hydrogels with RGD, GFOGER, YIGSR, and HA was confirmed using (D) LIVE/DEAD™ kit (n ≥ 3). Scale bar: 100 µm. Figure created using BioRender.com.
Cell viability up to 7 days was confirmed using Live/Dead™ staining. The results suggest that cells maintain viability >70% after 7 days (Figure 8), showing that RASTRUM™ printed hydrogels are suitable for 3D culture of both immortalized and primary macrophages. As expected, RAW 264.7 cells exhibited increased cell number and metabolic activity that are indicative of proliferation (Supplementary Figure S6). As seen in Figure 8B, RAW 264.7 cells also formed large clusters over time, consistent with reports of their behavior in other 3D applications (Kim et al., 2019; Fang et al., 2020). However, cell clustering and proliferation may make RAW 264.7 cells undesirable for future 3D culture applications, limiting single cell analysis. Notably, unlike RAW 264.7 cells, BMMs remained mainly single cells (Figure 8C), with greater uniformity of cells throughout the hydrogel. Lack of cell clustering with BMM cultures is likely attributed to their limited proliferation, as expected and supported by the total cell counts and metabolic data over the 7-day period (Supplementary Figure S6). To the best of our knowledge, these results represent the first use of the RASTRUM™ bioprinter for 3D culture of macrophages, presenting future opportunities for tuning of cell-matrix and cell-cell interactions using the features of this platform (Du et al., 2022; Engel et al., 2022; Jung et al., 2022; Sullivan et al., 2023).
To probe any differences between immortalized and primary macrophage responses now in 3D culture, we examined the polarization of RAW 264.7 cells and BMMs encapsulated within the synthetic ECM upon the application of soluble stimuli. Analogous to Figure 7, M1 (CD86/MHCII) and M2 markers (CD206/EGR2) were quantified using flow cytometry after 24-h polarization with M1 stimuli (IFNγ) or M2 stimuli (IL4/IL13). IFNγ significantly upregulated M1 markers (CD86/MHCII) for RAW 264.7 cells (Figures 9A, B). Although not statistically significant, BMMs treated with IFNγ also showed slight upregulation of CD86 and MHCII compared to IL4/13 treated cells (Figures 9A, B). Neither cell line showed significant upregulation of M2 markers (Figures 9C, D).
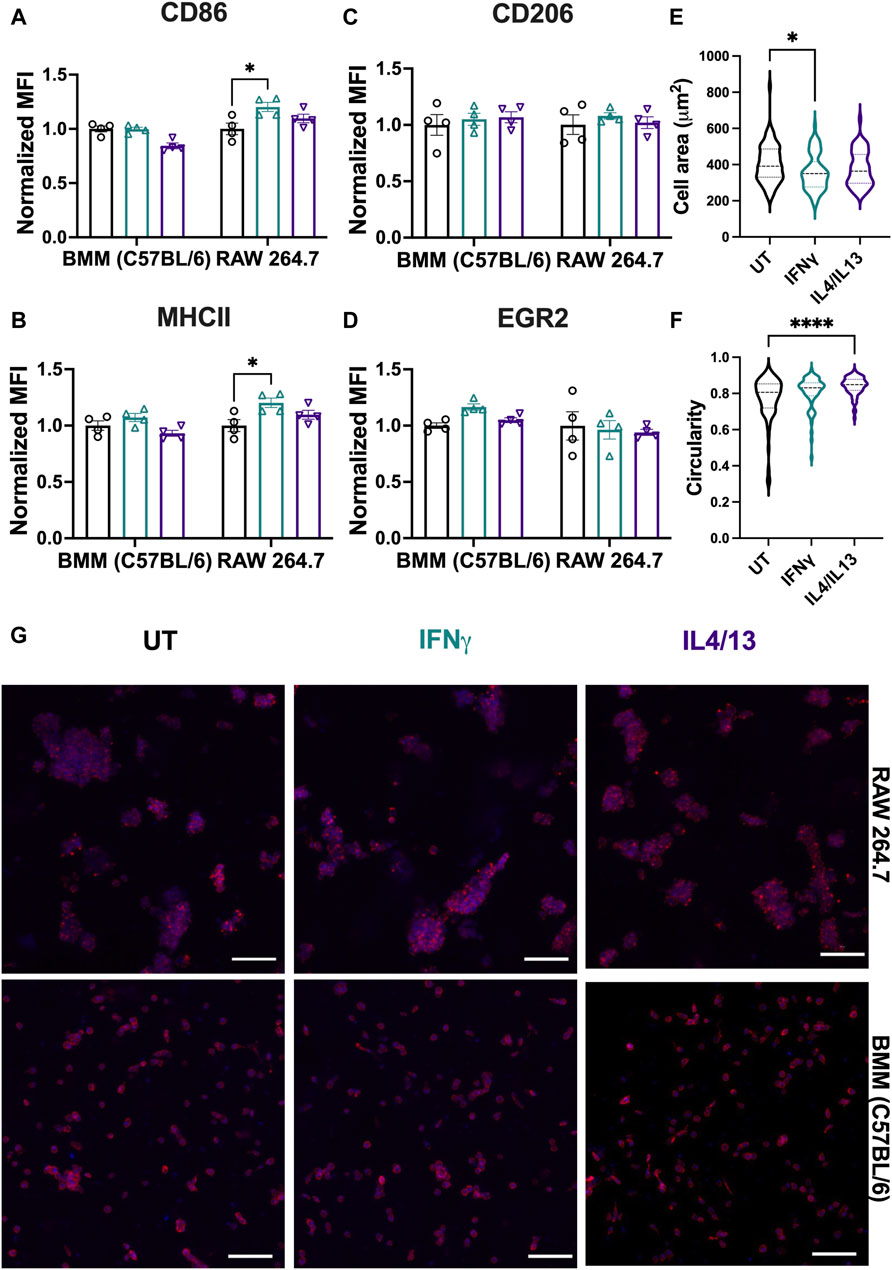
Figure 9. Effect of soluble stimuli on macrophage polarization in well-defined, bioprinted 3D cultures. Effect of polarization stimuli on macrophage polarization was determined for RAW 264.7 cells and primary BMMs (C57BL/6) in 3D culture (1.1 kPa PEG-peptide hydrogels with RGD, GFOGER, YIGSR, and HA). (A) CD86 and (B) MHCII were used as M1 markers. (C) CD206 and (D) EGR2 were used as M2 markers. All data are normalized to the UT control for the respective cell type. (E) Cell area and (F) circularity were quantified for all the cell types across different conditions. (G) Representative images of BMMs with nuclei (blue) and F-actin (red) qualitatively show morphology of BMMs across all the treatment groups. Statistics were performed using Tukey’s post hoc test with one-way ANOVA. *p < 0.05, **p < 0.01, ***p < 0.001, ****p < 0.0001.” Scale bar: 100 µm.
Analogous to analyses on TCP, we assessed morphological differences (area and cell circularity) based on stimuli (IFNγ and IL4/13) (Figure 9E). Only BMMs were quantitatively analyzed for morphology; single cell statistics cannot be determined accurately with large cell clusters, and therefore, RAW 264.7 cells were not analyzed for volume and sphericity. We observed similar mean cell areas (350–400 μm2) and circularities (∼0.8) of BMMs across conditions (Figure 9F, G). Similarities across treatment groups are expected based on flow cytometry results, which suggest that polarization across conditions was insignificant. We observed the largest ranges of circularity and area of cells in the untreated condition, with lower circularity and larger cell areas in the untreated condition compared to the other conditions. Unlike on TCP, we observed mainly rounded morphologies, which is expected for macrophages encapsulated within soft materials (Cha et al., 2017; Chen et al., 2020; Bomb et al., 2022; Wodzanowski et al., 2022).
Compared to TCP, macrophages cultured in hydrogels were less responsive to external stimuli (IFNγ and IL14/IL13) when compared to the untreated condition for the respective cell type. This observation aligns with previous literature. For example, Lee et al. found that RAW 264.7 cells cultured in 3D hydrogels were less responsive to stimuli (LPS) (Lee and Ki, 2020). The biophysical properties of the microenvironment (e.g., matrix stiffness, density, degradability, structure) as well as biochemical cues (e.g., ligand type, density) all influence cellular responses (Bomb et al., 2022). We hypothesize that the lack of significant upregulation of M1 or M2 markers relative to TCP is due to culture in compliant materials relative to culture on rigid TCP. Soft materials have been shown to activate inflammatory responses in macrophages (Cha et al., 2017; Chen et al., 2020), where Cha et al. showed higher levels of CD86 expression in PEG diacrylate (PEGDA) hydrogels compared to gelatin methacrylate hydrogels (Cha et al., 2017). Kim et al. also noted that the 3D environment itself can induce inflammation compared to TCP (Kim et al., 2019). Further, Lee et al. found that RAW 264.7 cell response to an immunomodulatory polysaccharide was less in 3D culture in PEG-based hydrogels relative to 2D culture on TCP, potentially owing to the low availability of receptors in 3D culture like in tissues (Lee and Ki, 2020).
Hydrogel compliance also plays an important role in polarization; however, exactly how the modulus correlates to polarization remains unclear based on the current literature. Some researchers have noted that cells seeded on top of hydrogels display a more M2-like phenotype with stiffer gels (Chen et al., 2020; Bomb et al., 2022) while others have found that increased stiffness promotes M1-like phenotype (Sridharan et al., 2019; Bu et al., 2022). This trend can change based on the range of stiffnesses tested and the chemistry of the hydrogel. Further, 3D cultures and 2D hydrogel culture trends do not always align. Several researchers noted that larger pores size and lower modulus promote more M2-like phenotypes (He et al., 2018; Bu et al., 2022; Cicuéndez Maroto et al., 2024). Others also have reported that RAW 264.7 cells in PEG-based hydrogels increase baseline expression of both M1 and M2 markers in 3D culture in both compliant and stiff cell-degradable PEG-peptide hydrogels relative to 2D culture on TCP (Kim et al., 2019). Future work is needed to address how stiffness impacts the phenotype in such well-defined 3D cultures alongside synergistic effects of stiffness and external stimuli.
Based on previous literature as noted above (Cha et al., 2017; Kim et al., 2019; Lee and Ki, 2020), we speculate that higher base level expression of inflammatory markers prior to stimulation may hinder subsequent polarization with external stimuli when compared to the untreated control. There may also be less availability of receptors in 3D culture for binding to applied ligands or nonspecific interactions between the hydrogel components and cytokines that impact ligand-receptor binding. Note, the diffusion of cytokines through the full hydrogel thickness is expected to occur within an hour, based on the literature and assuming one-dimensional Fickian diffusion (td = L2/D, where the length (L) is 0.055 cm and the diffusion coefficient (D) of the proteins through a PEG-hydrogel is estimated to be ∼1E-6 cm2/s) (Weber et al., 2009). In this context, we do not expect cytokine diffusion to be limiting the macrophage response in these studies. Macrophages may need higher concentrations of cytokines and longer incubation times, or repeated exposures to see pronounced responses to stimuli. Opportunities for future studies include probing tissue-specific responses within such culture systems for their validation and application. Overall, our results establish the relevance of a bioprinted synthetic ECM for well-defined 3D culture of both immortalized and primary macrophages and provide insights into differences in their function in 3D culture toward informing cell type selection in both fundamental and applied studies, from biological mechanisms to biomaterials designs.
Our findings demonstrate that macrophages from different cell lines display marked differences in phenotypical and morphological profile, phagocytosis function, and repolarization with alternative stimuli. Both immortalized and primary cells vary in polarization based on the tissue origin and mouse strain. Macrophages are less sensitive to stimuli in 3D hydrogel culture and have notably different morphologies than on TCP. While limited to the specific cell lines and markers addressed here, through this analysis, we aim to provide researchers with an important baseline for selecting a macrophage cell line or primary cells for biomaterial applications. Our results further showcase bioprinted well-defined 3D cultures for studies of immortalized or primary macrophages in bioactive hydrogel-based synthetic ECMs with high throughput; future work with such systems has the potential to bridge an important gap between in vitro and in vivo systems for probing tissue-relevant responses of macrophages and other innate immune cells. Here, we focused on cell-by-cell analysis to understand the phenotype and function of the cell. In future work, phenotypic characterization of selected cell lines or primary cells of interest in a specific application should also include gene expression and functional differences in cytokine release profiles to fully elucidate differences between these macrophage research tools.
The raw data supporting the conclusion of this article will be made available by the authors, without undue reservation.
Primary BMMs and PMs were isolated from healthy BALB/c and C57BL/6 mice (6–12 weeks old, Jackson Laboratories, Bar Harbor, Maine, USA), respectively, following the approved Institutional Animal Care and Use Committee (IACUC) protocol at the University of Delaware. The study was conducted in accordance with the local legislation and institutional requirements.
JG: Writing–original draft, Writing–review and editing, Conceptualization, Data curation, Formal Analysis, Investigation, Methodology, Project administration, Supervision, Visualization. KB: Conceptualization, Data curation, Formal Analysis, Investigation, Methodology, Project administration, Visualization, Writing–original draft, Writing–review and editing. MT-R: Conceptualization, Formal Analysis, Investigation, Writing–original draft, Writing–review and editing. BJ: Conceptualization, Formal Analysis, Investigation, Writing–original draft, Writing–review and editing. NG: Formal Analysis, Investigation, Writing–original draft, Writing–review and editing. AK: Writing–original draft, Writing–review and editing, Conceptualization, Funding acquisition, Project administration, Resources, Supervision. CF: Writing–original draft, Writing–review and editing, Conceptualization, Funding acquisition, Project administration, Resources, Supervision.
The author(s) declare that financial support was received for the research, authorship, and/or publication of this article. Research reported in this work was supported by a National Institutes of Health (NIH) Director’s New Innovator Award with grant number DP2HL152424 (AK), a NIH National Institute of General Medicine (NIGMS) Award with grant number R35GM142866A (CF), by the National Science Foundation (NSF) through the University of Delaware Materials Research Science and Engineering Center (DMR-2011824), and by the Institute for Engineering Driven Health at the University of Delaware with support from a NSF Accelerating Research Translation grant (2331440). Additionally, the authors acknowledge the use of facilities and instrumentation supported by the NSF through the University of Delaware Materials Research Science and Engineering Center (DMR-2011824) and NIH NIGMS through the Delaware COBRE (P20GM104316). Microscopy access, through the Delaware Biotechnology Institute (DBI) BioImaging, was supported by grants from the NIH-NIGMS (P20GM103446), the NIGMS (P20 GM139760), and the State of Delaware. Additional student support was obtained from the Collins fellowship (KB and JG), National Science Foundation (NSF) Graduate Research Fellowship Program (GRFP) Award number 1940700 (JG), and Department of Education (DOE) Graduate Assistance in Areas of National Need (GAANN): Inclusive Teaching in Chemical Engineering (ITChE) fellowship (MT-R).
The authors declare that the research was conducted in the absence of any commercial or financial relationships that could be construed as a potential conflict of interest.
All claims expressed in this article are solely those of the authors and do not necessarily represent those of their affiliated organizations, or those of the publisher, the editors and the reviewers. Any product that may be evaluated in this article, or claim that may be made by its manufacturer, is not guaranteed or endorsed by the publisher.
The content of this article is solely the responsibility of the authors and does not necessarily represent the official views of the National Institutes of Health or National Science Foundation.
The Supplementary Material for this article can be found online at: https://www.frontiersin.org/articles/10.3389/fbiom.2024.1399448/full#supplementary-material
Allard, B., Panariti, A., and Martin, J. G. (2018). Alveolar macrophages in the resolution of inflammation, tissue repair, and tolerance to infection. Front. Immunol. 9, 1777. doi:10.3389/fimmu.2018.01777
Andreakos, E., Sacre, S. M., Smith, C., Lundberg, A., Kiriakidis, S., Stonehouse, T., et al. (2004). Distinct pathways of LPS-induced NF-κB activation and cytokine production in human myeloid and nonmyeloid cells defined by selective utilization of MyD88 and Mal/TIRAP. Blood 103, 2229–2237. doi:10.1182/blood-2003-04-1356
Ben-David, U., Siranosian, B., Ha, G., Tang, H., Oren, Y., Hinohara, K., et al. (2018). Genetic and transcriptional evolution alters cancer cell line drug response. Nature 560, 325–330. doi:10.1038/s41586-018-0409-3
Benner, B., Scarberry, L., Suarez-Kelly, L. P., Duggan, M. C., Campbell, A. R., Smith, E., et al. (2019). Generation of monocyte-derived tumor-associated macrophages using tumor-conditioned media provides a novel method to study tumor-associated macrophages in vitro. J. Immunother. cancer 7, 140–214. doi:10.1186/s40425-019-0622-0
Berghaus, L. J., Moore, J. N., Hurley, D. J., Vandenplas, M. L., Fortes, B. P., Wolfert, M. A., et al. (2010). Innate immune responses of primary murine macrophage-lineage cells and RAW 264.7 cells to ligands of Toll-like receptors 2, 3, and 4. Comp. Immunol. Microbiol. Infect. Dis. 33, 443–454. doi:10.1016/j.cimid.2009.07.001
Bobba, C. M., Fei, Q., Shukla, V., Lee, H., Patel, P., Putman, R. K., et al. (2021). Nanoparticle delivery of microRNA-146a regulates mechanotransduction in lung macrophages and mitigates injury during mechanical ventilation. Nat. Commun. 12, 289. doi:10.1038/s41467-020-20449-w
Bomb, K., Pradhan, L., Zhang, Q., Jarai, B. M., Bhattacharjee, A., Burris, D. L., et al. (2022). Destructive fibrotic teamwork: how both microenvironment stiffness and profibrotic interleukin 13 impair alveolar macrophage phenotype and function. Biomaterials Sci. 10, 5689–5706. doi:10.1039/d2bm00828a
Bomb, K., Zhang, Q., Ford, E. M., Fromen, C. A., and Kloxin, A. M. (2023). Systematic d-amino acid substitutions to control peptide and hydrogel degradation in cellular microenvironments. ACS Macro Lett. 12, 725–732. doi:10.1021/acsmacrolett.3c00144
Brady, S. R., Gohsman, S. B., Sepulveda, K., and Weaver, J. D. (2023). Engineering synthetic poly(ethylene) glycol-based hydrogels compatible with injection molding biofabrication. J. Biomed. Mater. Res. Part A 111, 814–824. doi:10.1002/jbm.a.37523
Bu, W., Wu, Y., Ghaemmaghami, A. M., Sun, H., and Mata, A. (2022). Rational design of hydrogels for immunomodulation. Regen. Biomater. 9, rbac009. doi:10.1093/rb/rbac009
Cha, B. H., Shin, S. R., Leijten, J., Li, Y. C., Singh, S., Liu, J. C., et al. (2017). Integrin-mediated interactions control macrophage polarization in 3D hydrogels. Adv. Healthc. Mater. 6, 1700289. doi:10.1002/adhm.201700289
Chamberlain, L. M., Godek, M. L., Gonzalez-Juarrero, M., and Grainger, D. W. (2009). Phenotypic non-equivalence of murine (monocyte-) macrophage cells in biomaterial and inflammatory models. J. Biomed. Mater. Res. Part A 88, 858–871. doi:10.1002/jbm.a.31930
Chamberlain, L. M., Holt-Casper, D., Gonzalez-Juarrero, M., and Grainger, D. W. (2015). Extended culture of macrophages from different sources and maturation results in a common M2 phenotype. J. Biomed. Mater. Res. Part A 103, 2864–2874. doi:10.1002/jbm.a.35415
Chen, M., Zhang, Y., Zhou, P., Liu, X., Zhao, H., Zhou, X., et al. (2020). Substrate stiffness modulates bone marrow-derived macrophage polarization through NF-κB signaling pathway. Bioact. Mater 5, 880–890. doi:10.1016/j.bioactmat.2020.05.004
Cicuéndez Maroto, M., García-Lizarribar, A., Casarrubios Molina, L., Feito Castellano, M. J., Fernández San Argimiro, F. J., García Urkia, N., et al. (2024). Functionality of macrophages encapsulated in porcine decellularized adipose matrix hydrogels and interaction with Candida albicans.
Ci, X., Ren, R., Xu, K., Li, H., Yu, Q., Song, Y., et al. (2010). Schisantherin A exhibits anti-inflammatory properties by down-regulating NF-κB and mapk signaling pathways in lipopolysaccharide-treated raw 264.7 cells. Inflammation 33, 126–136. doi:10.1007/s10753-009-9166-7
Deng, L., Pollmeier, L., Zhou, Q., Bergemann, S., Bode, C., Hein, L., et al. (2020). Gene expression in immortalized versus primary isolated cardiac endothelial cells. Sci. Rep. 10, 2241. doi:10.1038/s41598-020-59213-x
Du, E. Y., Jung, M., Skhinas, J., Tolentino, M. K., Jamshidi, N., Houng, J., et al. (2022). A 3D bioprintable hydrogel with tuneable stiffness for exploring cells encapsulated in matrices of differing stiffnesses. ACS Applied Bio Materials 6, 4603–4612. doi:10.1021/acsabm.3c00334
Edwards, J. P., Zhang, X., Frauwirth, K. A., and Mosser, D. M. (2006). Biochemical and functional characterization of three activated macrophage populations. J. Leukoc. Biol. 80, 1298–1307. doi:10.1189/jlb.0406249
Engel, M., Belfiore, L., Aghaei, B., and Sutija, M. (2022). Enabling high throughput drug discovery in 3D cell cultures through a novel bioprinting workflow. SLAS Technol. 27, 32–38. doi:10.1016/j.slast.2021.10.002
Fang, J. Y., Yang, Z., and Han, B. (2020). Switch of macrophage fusion competency by 3D matrices. Sci. Rep. 10, 10348. doi:10.1038/s41598-020-67056-9
Farajzadeh, R., Zarghami, N., Serati-Nouri, H., Momeni-Javid, Z., Farajzadeh, T., Jalilzadeh-Tabrizi, S., et al. (2018). Macrophage repolarization using CD44-targeting hyaluronic acid–polylactide nanoparticles containing curcumin. Artif. cells, nanomedicine, Biotechnol. 46, 2013–2021. doi:10.1080/21691401.2017.1408116
Genin, M., Clement, F., Fattaccioli, A., Raes, M., and Michiels, C. (2015). M1 and M2 macrophages derived from THP-1 cells differentially modulate the response of cancer cells to etoposide. BMC Cancer 15, 577. doi:10.1186/s12885-015-1546-9
Gomila Pelegri, N., Stanczak, A. M., Bottomley, A. L., Milthorpe, B. K., Gorrie, C. A., Padula, M. P., et al. (2023). Adipose-derived stem cells spontaneously express neural markers when grown in a PEG-based 3D matrix. Int. J. Mol. Sci. 24, 12139. doi:10.3390/ijms241512139
Gonçalves, R., and Mosser, D. M. (2015). The isolation and characterization of murine macrophages. Curr. Protoc. Immunol. 111, 14.1. 1–14.1. 16. doi:10.1002/0471142735.im1401s111
Gordon, S., and Martinez, F. O. (2010). Alternative activation of macrophages: mechanism and functions. Immunity 32, 593–604. doi:10.1016/j.immuni.2010.05.007
He, X.-T., Wu, R.-X., Xu, X.-Y., Wang, J., Yin, Y., and Chen, F.-M. (2018). Macrophage involvement affects matrix stiffness-related influences on cell osteogenesis under three-dimensional culture conditions. Acta Biomater. 71, 132–147. doi:10.1016/j.actbio.2018.02.015
Ivashkiv, L. B. (2018). IFNγ: signalling, epigenetics and roles in immunity, metabolism, disease and cancer immunotherapy. Nat. Rev. Immunol. 18, 545–558. doi:10.1038/s41577-018-0029-z
Jarai, B. M., Bomb, K., and Fromen, C. A. (2023). Nanoparticle pre-treatment for enhancing the survival and activation of pulmonary macrophage transplant. Drug Deliv. Transl. Res. 13, 1955–1966. doi:10.1007/s13346-023-01319-6
Jarai, B. M., and Fromen, C. A. (2022). Nanoparticle internalization promotes the survival of primary macrophages. Adv. NanoBiomed Res. 2, 2100127. doi:10.1002/anbr.202100127
Jarai, B. M., Stillman, Z., and Fromen, C. A. (2021). Hydrogel nanoparticle degradation influences the activation and survival of primary macrophages. J. Mater. Chem. B 9, 7246–7257. doi:10.1039/d1tb00982f
Jones, S. W., Roberts, R. A., Robbins, G. R., Perry, J. L., Kai, M. P., Chen, K., et al. (2013). Nanoparticle clearance is governed by Th1/Th2 immunity and strain background. J. Clin. Investigation 123, 3061–3073. doi:10.1172/jci66895
Jung, M., Skhinas, J. N., Du, E. Y., Tolentino, M. A. K., Utama, R. H., Engel, M., et al. (2022). A high-throughput 3D bioprinted cancer cell migration and invasion model with versatile and broad biological applicability. Biomaterials Sci. 10, 5876–5887. doi:10.1039/d2bm00651k
Kim, M., Lee, S., and Ki, C. S. (2019). Cellular behavior of RAW264.7 cells in 3D poly(ethylene glycol) hydrogel niches. ACS Biomaterials Sci. Eng. 5, 922–932. doi:10.1021/acsbiomaterials.8b01150
Lavin, Y., Winter, D., Blecher-Gonen, R., David, E., Keren-Shaul, H., Merad, M., et al. (2014). Tissue-resident macrophage enhancer landscapes are shaped by the local microenvironment. Cell 159, 1312–1326. doi:10.1016/j.cell.2014.11.018
Lee, S., and Ki, C. S. (2020). Inflammatory responses of macrophage-like RAW264.7 cells in a 3D hydrogel matrix to ultrasonicated schizophyllan. Carbohydr. Polym. 229, 115555. doi:10.1016/j.carbpol.2019.115555
Levenson, E. A., Martens, C., Kanakabandi, K., Turner, C. V., Virtaneva, K., Paneru, M., et al. (2018). Comparative transcriptomic response of primary and immortalized macrophages to murine norovirus infection. J. Immunol. 200, 4157–4169. doi:10.4049/jimmunol.1700384
Little, A. C., Pathanjeli, P., Wu, Z., Bao, L., Goo, L. E., Yates, J. A., et al. (2019). IL-4/IL-13 stimulated macrophages enhance breast cancer invasion via rho-GTPase regulation of synergistic VEGF/CCL-18 signaling. Front. Oncol. 9, 456. doi:10.3389/fonc.2019.00456
Liu, Y., and Segura, T. (2020). Biomaterials-Mediated regulation of macrophage cell fate. Front. Bioeng. Biotechnol. 8, 609297. doi:10.3389/fbioe.2020.609297
Lou, J., and Mooney, D. J. (2022). Chemical strategies to engineer hydrogels for cell culture. Nat. Rev. Chem. 6, 726–744. doi:10.1038/s41570-022-00420-7
Mahmodi, H., Piloni, A., Utama, R., and Kabakova, I. (2021). Mechanical mapping of bioprinted hydrogel models by brillouin microscopy. bioRxiv 23, e00151. 2021.02.18.431535. doi:10.1016/j.bprint.2021.e00151
Mao, J., Chen, L., Cai, Z., Qian, S., Liu, Z., Zhao, B., et al. (2022). Advanced biomaterials for regulating polarization of macrophages in wound healing. Adv. Funct. Mater. 32, 2111003. doi:10.1002/adfm.202111003
Mcwhorter, F. Y., Wang, T., Nguyen, P., Chung, T., and Liu, W. F. (2013). Modulation of macrophage phenotype by cell shape. Proc. Natl. Acad. Sci. 110, 17253–17258. doi:10.1073/pnas.1308887110
Misharin, A. V., Morales-Nebreda, L., Reyfman, P. A., Cuda, C. M., Walter, J. M., Mcquattie-Pimentel, A. C., et al. (2017). Monocyte-derived alveolar macrophages drive lung fibrosis and persist in the lung over the life span. J. Exp. Med. 214, 2387–2404. doi:10.1084/jem.20162152
Moradi-Chaleshtori, M., Shojaei, S., Mohammadi-Yeganeh, S., and Hashemi, S. M. (2021). Transfer of miRNA in tumor-derived exosomes suppresses breast tumor cell invasion and migration by inducing M1 polarization in macrophages. Life Sci. 282, 119800. doi:10.1016/j.lfs.2021.119800
Mosser, D. M., and Edwards, J. P. (2008). Exploring the full spectrum of macrophage activation. Nat. Rev. Immunol. 8, 958–969. doi:10.1038/nri2448
Palomba, R., Di Francesco, M., Di Francesco, V., Piccardi, F., Catelani, T., Ferreira, M., et al. (2021). Boosting nanomedicine performance by conditioning macrophages with methyl palmitate nanoparticles. Mater. Horizons 8, 2726–2741. doi:10.1039/d1mh00937k
Park, M. D., Silvin, A., Ginhoux, F., and Merad, M. (2022). Macrophages in health and disease. Cell 185, 4259–4279. doi:10.1016/j.cell.2022.10.007
Rayahin, J. E., Buhrman, J. S., Zhang, Y., Koh, T. J., and Gemeinhart, R. A. (2015). High and low molecular weight hyaluronic acid differentially influence macrophage activation. ACS Biomater. Sci. Eng. 1, 481–493. doi:10.1021/acsbiomaterials.5b00181
Risser, G. E., Machour, M., Hernaez-Estrada, B., Li, D., Levenberg, S., and Spiller, K. L. (2023). Effects of Interleukin-4 (IL-4)-releasing microparticles and adoptive transfer of macrophages on immunomodulation and angiogenesis. Biomaterials 296, 122095. doi:10.1016/j.biomaterials.2023.122095
Ruge, C. A., Schaefer, U. F., Herrmann, J., Kirch, J., Canadas, O., Echaide, M., et al. (2012). The interplay of lung surfactant proteins and lipids assimilates the macrophage clearance of nanoparticles. PloS one 7, e40775. doi:10.1371/journal.pone.0040775
Santos, J. L., Andrade, A. A., Dias, A. A. M., Bonjardim, C. A., Reis, L. F. L., Teixeira, S. M. R., et al. (2006). Differential sensitivity of C57BL/6 (M-1) and BALB/c (M-2) macrophages to the stimuli of IFN-γ/LPS for the production of NO: correlation with iNOS mRNA and protein expression. J. Interferon & Cytokine Res. 26, 682–688. doi:10.1089/jir.2006.26.682
Sikorski, K., Chmielewski, S., Olejnik, A., Wesoly, J. Z., Heemann, U., Baumann, M., et al. (2012). STAT1 as a central mediator of IFNγ and TLR4 signal integration in vascular dysfunction. Jak-Stat 1, 241–249. doi:10.4161/jkst.22469
Smith, T. D., Tse, M. J., Read, E. L., and Liu, W. F. (2016). Regulation of macrophage polarization and plasticity by complex activation signals. Integr. Biol. (Camb) 8, 946–955. doi:10.1039/c6ib00105j
Sreejit, G., Fleetwood, A. J., Murphy, A. J., and Nagareddy, P. R. (2020). Origins and diversity of macrophages in health and disease. Clin. Transl. Immunol. 9, e1222. doi:10.1002/cti2.1222
Sridharan, R., Cavanagh, B., Cameron, A. R., Kelly, D. J., and O'Brien, F. J. (2019). Material stiffness influences the polarization state, function and migration mode of macrophages. Acta Biomater. 89, 47–59. doi:10.1016/j.actbio.2019.02.048
Stevens, M. T., Nagaria, B. D., Britton, W. J., and Saunders, B. M. (2021). Macrophages of different tissue origin exhibit distinct inflammatory responses to mycobacterial infection. Immunol. Cell Biol. 99, 1085–1092. doi:10.1111/imcb.12493
Strizova, Z., Benesova, I., Bartolini, R., Novysedlak, R., Cecrdlova, E., Foley, LILY K., et al. (2023). M1/M2 macrophages and their overlaps – myth or reality? Clin. Sci. 137, 1067–1093. doi:10.1042/cs20220531
Sullivan, M. A., Lane, S., Volkerling, A., Engel, M., Werry, E. L., and Kassiou, M. (2023). Three-dimensional bioprinting of stem cell-derived central nervous system cells enables astrocyte growth, vasculogenesis, and enhances neural differentiation/function. Biotechnol. Bioeng. 120, 3079–3091. doi:10.1002/bit.28470
Sun, X., Ma, Z., Zhao, X., Jin, W., Zhang, C., Ma, J., et al. (2021). Three-dimensional bioprinting of multicell-laden scaffolds containing bone morphogenic protein-4 for promoting M2 macrophage polarization and accelerating bone defect repair in diabetes mellitus. Bioact. Mater. 6, 757–769. doi:10.1016/j.bioactmat.2020.08.030
Sylvestre, M., Crane, C. A., and Pun, S. H. (2020). Progress on modulating tumor-associated macrophages with biomaterials. Adv. Mater. 32, 1902007. doi:10.1002/adma.201902007
Tran, T.-H., Krishnan, S., and Amiji, M. M. (2016). MicroRNA-223 induced repolarization of peritoneal macrophages using CD44 targeting hyaluronic acid nanoparticles for anti-inflammatory effects. PloS one 11, e0152024. doi:10.1371/journal.pone.0152024
Tu, P.-C., Pan, Y.-L., Liang, Z.-Q., Yang, G.-L., Wu, C.-J., Zeng, L., et al. (2022). Mechanical stretch promotes macrophage polarization and inflammation via the RhoA-ROCK/NF-κB pathway. BioMed Res. Int. 2022, 1–9. doi:10.1155/2022/6871269
Ullah, S., Seidel, K., Türkkan, S., Warwas, D. P., Dubich, T., Rohde, M., et al. (2019). Macrophage entrapped silica coated superparamagnetic iron oxide particles for controlled drug release in a 3D cancer model. J. Control. Release 294, 327–336. doi:10.1016/j.jconrel.2018.12.040
Wang, C., Yu, X., Cao, Q., Wang, Y., Zheng, G., Tan, T. K., et al. (2013). Characterization of murine macrophages from bone marrow, spleen and peritoneum. BMC Immunol. 14, 6–10. doi:10.1186/1471-2172-14-6
Watanabe, H., Numata, K., Ito, T., Takagi, K., and Matsukawa, A. (2004). Innate immune response in th1- and th2-dominant mouse strains. Shock 22, 460–466. doi:10.1097/01.shk.0000142249.08135.e9
Weber, L. M., Lopez, C. G., and Anseth, K. S. (2009). Effects of PEG hydrogel crosslinking density on protein diffusion and encapsulated islet survival and function. J. Biomed. Mater Res. A 90, 720–729. doi:10.1002/jbm.a.32134
Wiley, K. L., Sutherland, B. P., Ogunnaike, B. A., and Kloxin, A. M. (2022). Rational design of hydrogel networks with dynamic mechanical properties to mimic matrix remodeling. Adv. Healthc. Mater 11, e2101947. doi:10.1002/adhm.202101947
Wodzanowski, K. A., Caplan, J. L., Kloxin, A. M., and Grimes, C. L. (2022). Multiscale invasion assay for probing macrophage response to gram-negative bacteria. Front. Chem. 10, 842602. doi:10.3389/fchem.2022.842602
Wu, Z., Chen, C., Luo, J., Davis, J. R., Zhang, B., Tang, L., et al. (2020). EGFP-EGF1-conjugated poly (lactic-co-glycolic acid) nanoparticles as a carrier for the delivery of CCR2− shRNA to atherosclerotic macrophage in vitro. Sci. Rep. 10, 19636. doi:10.1038/s41598-020-76416-4
Yen, C. J., Fang, C. C., Chen, Y. M., Lin, R. H., Wu, K. D., Lee, P. H., et al. (1997). Extracellular matrix proteins modulate human peritoneal mesothelial cell behavior. Nephron 75, 188–195. doi:10.1159/000189530
Zajd, C. M., Ziemba, A. M., Miralles, G. M., Nguyen, T., Feustel, P. J., Dunn, S. M., et al. (2020). Bone marrow-derived and elicited peritoneal macrophages are not created equal: the questions asked dictate the cell type used. Front. Immunol. 11, 269. doi:10.3389/fimmu.2020.00269
Zarubova, J., Hasani-Sadrabadi, M. M., Ardehali, R., and Li, S. (2022). Immunoengineering strategies to enhance vascularization and tissue regeneration. Adv. Drug Deliv. Rev. 184, 114233. doi:10.1016/j.addr.2022.114233
Zhang, W., Zhang, Y., He, Y., Wang, X., and Fang, Q. (2019). Lipopolysaccharide mediates time-dependent macrophage M1/M2 polarization through the Tim-3/Galectin-9 signalling pathway. Exp. Cell Res. 376, 124–132. doi:10.1016/j.yexcr.2019.02.007
Zhao, Y.-L., Tian, P.-X., Han, F., Zheng, J., Xia, X.-X., Xue, W.-J., et al. (2017). Comparison of the characteristics of macrophages derived from murine spleen, peritoneal cavity, and bone marrow. J. Zhejiang University-SCIENCE B 18, 1055–1063. doi:10.1631/jzus.b1700003
Zheng, Y., Han, Y., Sun, Q., and Li, Z. (2022). Harnessing anti-tumor and tumor-tropism functions of macrophages via nanotechnology for tumor immunotherapy. Exploration 2, 20210166. doi:10.1002/exp.20210166
Zhen, H., Hu, H., Tan, C., Yu, X., Gan, X., and Huang, X. (2023). Regulation of M1/M2 polarization in LPS-stimulated macrophages by 1,25(OH)2D3. Altern. Ther. Health Med. 29, 501–505.
Keywords: macrophage, hydrogel, biomaterials, innate immune cell, polarization, 3D culture
Citation: Graf J, Bomb K, Trautmann-Rodriguez M, Jarai BM, Gill N, Kloxin AM and Fromen CA (2024) Macrophage variance: investigating how macrophage origin influences responses to soluble and physical cues with immortalized vs. primary cells in 2D and 3D culture. Front. Biomater. Sci. 3:1399448. doi: 10.3389/fbiom.2024.1399448
Received: 11 March 2024; Accepted: 19 April 2024;
Published: 22 May 2024.
Edited by:
Silviya Petrova Zustiak, Saint Louis University, United StatesReviewed by:
Koyal Garg, Saint Louis University, United StatesCopyright © 2024 Graf, Bomb, Trautmann-Rodriguez, Jarai, Gill, Kloxin and Fromen. This is an open-access article distributed under the terms of the Creative Commons Attribution License (CC BY). The use, distribution or reproduction in other forums is permitted, provided the original author(s) and the copyright owner(s) are credited and that the original publication in this journal is cited, in accordance with accepted academic practice. No use, distribution or reproduction is permitted which does not comply with these terms.
*Correspondence: April M. Kloxin, YWtsb3hpbkB1ZGVsLmVkdQ==; Catherine A. Fromen, Y2Zyb21lbkB1ZGVsLmVkdQ==
†These authors have contributed equally to this work and share last authorship
Disclaimer: All claims expressed in this article are solely those of the authors and do not necessarily represent those of their affiliated organizations, or those of the publisher, the editors and the reviewers. Any product that may be evaluated in this article or claim that may be made by its manufacturer is not guaranteed or endorsed by the publisher.
Research integrity at Frontiers
Learn more about the work of our research integrity team to safeguard the quality of each article we publish.