 Catriona Miller
 Theo Portlock
 Denis M. Nyaga
 Justin M. O’Sullivan
- 1The Liggins Institute, The University of Auckland, Auckland, New Zealand
- 2The Maurice Wilkins Centre, The University of Auckland, Auckland, New Zealand
- 3MRC Lifecourse Epidemiology Unit, University of Southampton, Southampton, United Kingdom
- 4Singapore Institute for Clinical Sciences, Agency for Science Technology and Research, Singapore, Singapore
Machine learning (ML) has shown great promise in genetics and genomics where large and complex datasets have the potential to provide insight into many aspects of disease risk, pathogenesis of genetic disorders, and prediction of health and wellbeing. However, with this possibility there is a responsibility to exercise caution against biases and inflation of results that can have harmful unintended impacts. Therefore, researchers must understand the metrics used to evaluate ML models which can influence the critical interpretation of results. In this review we provide an overview of ML metrics for clustering, classification, and regression and highlight the advantages and disadvantages of each. We also detail common pitfalls that occur during model evaluation. Finally, we provide examples of how researchers can assess and utilise the results of ML models, specifically from a genomics perspective.
1 Introduction
The general hype around the generative artificial intelligence (AI) era has increased the popularity of machine learning (ML) for a range of applications. Alongside this, the advent of “plug and play” style ML tools, such as PyCaret, has dramatically increased the accessibility of ML to scientists and researchers without a traditional computational background (Ali, 2020; Manduchi et al., 2022; Whig et al., 2023). In genomics, ML is becoming increasingly used to analyse large and complex datasets, including sequencing data (Caudai et al., 2021; Chafai et al., 2024). Therefore, it is increasingly important that “all” researchers understand what happens after an ML model has been deployed. This is particularly true for the choice of performance metrics and how to interpret the validity of the results. As such, without understanding the common metrics used in ML, together with an awareness of the inherent strengths and weaknesses of such metrics, there is a possible risk of result inflation (Kapoor and Narayanan, 2023). Therefore, understanding the potential biases within the input data is essential to successfully interpret the results (Vokinger et al., 2021).
Existing reviews of ML applications to genetic and genomic datasets either focus on earlier stages of the ML pipeline (e.g., feature selection, method selection), or give an overview of the whole process (Libbrecht and Noble, 2015; Ho et al., 2019; Musolf et al., 2022; Pudjihartono et al., 2022). This review addresses an important gap in the literature by focusing on the final section of the ML pipeline – model evaluation. Specifically, we cover the most common use cases of ML in genomics before an in-depth analysis of the metrics used to evaluate each subtype, including the advantages and disadvantages of each. We finalise by cautioning researchers and scientists of the common pitfalls that can bias model performance and inflate the metrics reported.
1.1 Types of ML typically used in genomics
Supervised learning, unsupervised learning, semi-supervised learning, and reinforcement learning are the four main types of ML algorithms used within genetic and genomic datasets (Figure 1) (Libbrecht and Noble, 2015; Ho et al., 2019; Koumakis, 2020; Bracher-Smith et al., 2021). Here we focus on unsupervised and supervised learning and their subcategories: clustering (unsupervised learning), classification and regression (supervised learning).
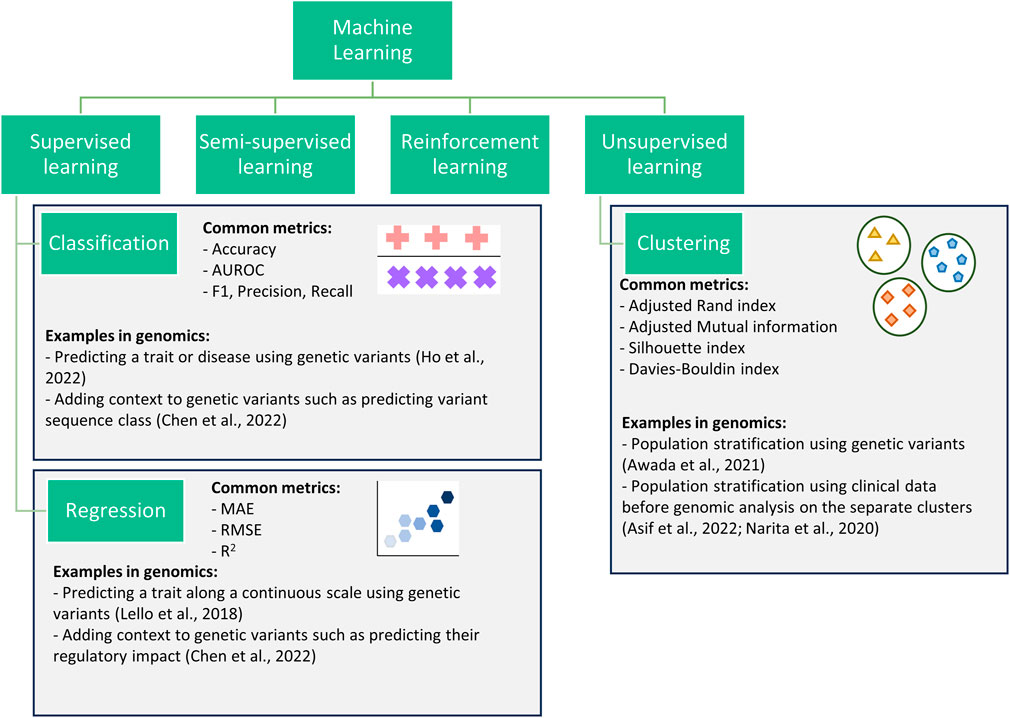
Figure 1. Flowchart showing four categories of machine learning. This review focuses on three subcategories (classification, regression, and clustering) within the supervised and unsupervised categories.
Clustering algorithms are processes for the identification of subgroups within a population. Clustering can be performed when data is prelabelled (e.g., known disease subtypes) or with no a priori information. Clustering has been successfully used to improve prediction (Alyousef et al., 2018), to identify disease-related gene clusters (Di Giovanni et al., 2023), or to better define complex traits/diseases (Lottaz et al., 2007; Lopez et al., 2018; Yin et al., 2018; Awada et al., 2021).
Classification algorithms encompass all machine learning methods where pre-labelled data is used to train an algorithm to predict the correct class, where class refers to all data points with a given label (e.g., control class or a specific disease class). These are commonly used within genomics to predict a trait/disease (i.e., diagnostics) (Trakadis et al., 2019; Lee and Lee, 2020; Ho et al., 2022), or to identify potential biomarkers (Al-Tashi et al., 2023). However, they can struggle with imbalanced datasets, where one class is significantly more prevalent than the other, leading to biased predictions (Ramyachitra and Manikandan, 2014).
Regression algorithms, like classification algorithms, predict a target variable for each datapoint or individual; however, they are applied in applications involving continuous variables. For example, regression algorithms are commonly used for the prediction of highly heterogeneous traits with known scales such as height, systolic blood pressure, and waist-hip ratio (Bellot et al., 2018; Lello et al., 2018). While regression algorithms can capture complex relationships between variables, they are sensitive to outliers which can impact the reliability of predictions (Wang, 2021). This review only covers regression for continuous variables. Other methods, such as negative binomial and Poisson used in mutation burden analysis and differential gene expression analysis (Sun et al., 2017; Li et al., 2019; Zhang et al., 2020), are outside of the scope.
Classification and regression algorithms have also been applied to add context to genomic data such as predicting the regulatory impacts of single nucleotide polymorphisms (SNPs). For example, the interpretable deep learning sequence model Sei predicts sequence regulatory activity based on chromatin profiles (Chen et al., 2022). Such a framework can be considered both classification and regression as it predicts a variant’s sequence class (classification) and provides a regulatory impact score (regression). In this case, classification provides users with a more understandable output (e.g., promoter) but loses some of the information, whereas the regression score captures more information but is less interpretable. Therefore, by providing both a classification and regression output, users can decide between increased interpretability and information.
Clustering, classification, and regression algorithms all have multiple metrics for evaluating their performance and this review focuses on the most commonly used ones in genomics (Figure 1). This review focuses on their applicability for evaluating models in the fields of genetics and genomics. However, the majority of the metrics detailed are also used for hyperparameter tuning during cross-validation. The choice of the metric for tuning can greatly impact the model produced, often resulting in a model that scores highly for the provided metric at the expense of the other metrics. Therefore, the advantages and disadvantages (both general and genomic specific) discussed for each metric in this review are still largely relevant when choosing a metric for hyperparameter tuning. Yang and Shami (2020) provides a review of hyperparameter optimisation.
2 ML metrics for clustering
The choice of metric for evaluating clustering algorithms largely depends on whether there is access to a “ground truth” (Box 1). If there are known categories to compare the clusters to, extrinsic measures can be used such as the Adjusted Rand Index (Hubert and Arabie, 1985) or Mutual Information (Vinh et al., 2010) (Figure 2). Without a ground truth, intrinsic measures must be used (e.g., the Sillhouette index or Davies Bouldin index). Intrinsic metrics measure the similarities between points within the same cluster compared to the similarity between clusters (Figure 2). They score highly if the intra-cluster similarity is greater than the inter-cluster similarity. Extrinsic metrics score highly if the clusters are similar to the known ground truth clusters (Figure 2).
Box 1 | Glossary
Class – a group of samples or individuals with the same target variable. For example, a control and asthmatic would be two classes in a classification analysis.
Clustering ground truth – a known set of clusters for a given dataset.
Decision boundary – a score threshold used in classification algorithms to assign individuals to classes.
Euclidean distance – the length of the line segment that would connect two points.
Imbalanced dataset – a dataset where one class(es) appears at a much higher rate than the other class(es).
Intra-cluster similarity – similarity between datapoints assigned to the same cluster.
Inter-cluster similarity – similarity between datapoints assigned to different clusters.
True positive rate (TPR) – also known as recall. The percentage of “positive” samples that have been correctly labelled as “positive”.
False positive rate (FPR) – the percentage of ‘negative’ samples that are incorrectly classified as “positive”.
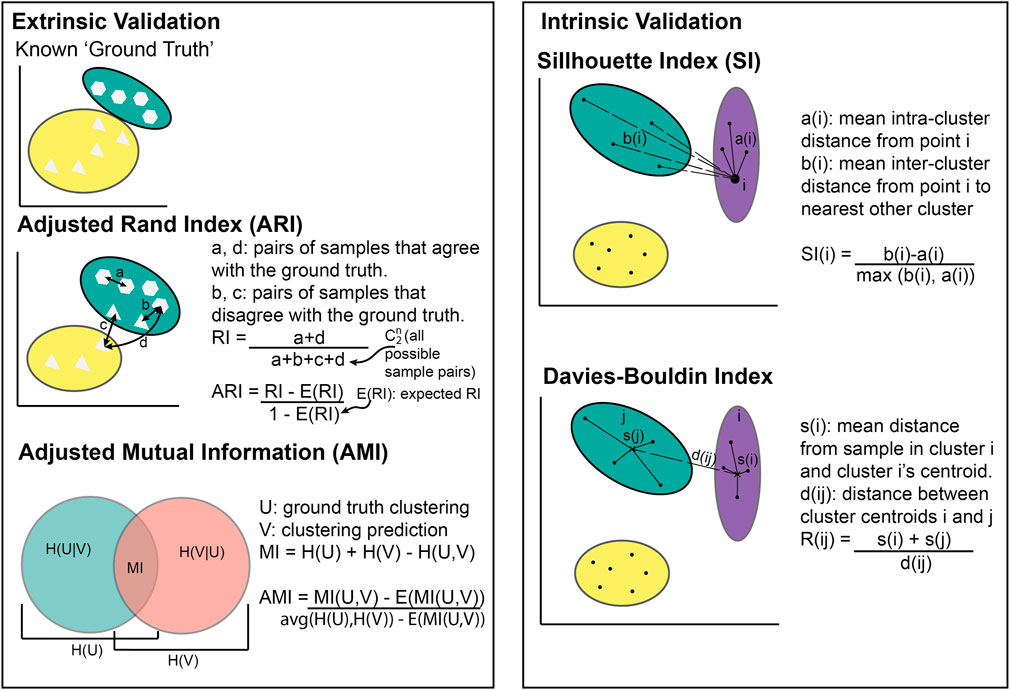
Figure 2. Illustration of cluster metric calculations. Extrinsic validation methods require known clusters to compare against whilst intrinsic validation does not.
2.1 Adjusted Rand Index
The Adjusted Rand Index (ARI) is a measure of similarity between two clusterings of the same dataset, while accounting for similarities that occur by chance (Hubert and Arabie, 1985). For example, the ARI can be used to compare the similarity between calculated clusters within a disease group and known clusters based on disease subtypes.
Given:
- n = number of samples in the dataset
- a and d = number of pairs of samples in the same and different clusters between the two clusterings respectively
- ni and nj = number of samples in clusters i and j respectively
If ARI = −1, it indicates complete disagreement (i.e., no individuals are in the same cluster as the known ground truth), while ARI = 0 indicates an agreement equivalent to that from random chance, and ARI = 1 indicates perfect agreement (i.e., all individuals are in the same cluster as the known ground truth). Figure 2 shows most individuals placed in the same cluster as the known ground truth, meaning the ARI would be between 0 and 1.
ARI is a common metric choice for validating the performance of a clustering technique within biology (Shi et al., 2022; Zhen et al., 2022). However, ARI is based on the assumption that the known clusters are correct for the use case. For example, if the aim of clustering is to identify novel groups within a population (diseased or otherwise) or to identify similarities between genetic variants, comparing against known clusters would be detrimental to the problem (Awada et al., 2021). Another limitation is ARI’s bias to cluster size. If a clustering contains a mixture of large and small sized clusters, ARI will be predominantly influenced by the large clusters (Warrens and van der Hoef, 2022).
2.2 Adjusted Mutual Information
Adjusted Mutual Information (AMI) is a clustering metric that comes from information theory (Vinh et al., 2010). It calculates how much information is shared between two clusterings (i.e., known clusters and calculated clusters).
- U and V = two clusterings (e.g., calculated clusters and known clusters)
- H = individual entropy – a measure of expected uncertainty
- MI = mutual information algorithm described by Vinh et al. (2010).
- E = the expected value based on chance.
Both AMI and ARI adjust for chance and can be used to calculate an algorithm’s performance when a “ground truth” is known. Therefore, deciding when it is appropriate to prioritize one metric over the other can be difficult. The key differentiating factor derives from the fact that ARI scores solutions with similar sized clusters higher. By contrast, AMI is biased towards “pure” clusters, consisting of only one class type and are often imbalanced (Romano et al., 2016). For example, if some disease subtypes are rarer than others resulting in imbalanced cluster sizes, AMI is likely to be a more accurate metric than ARI. Variations of AMI measures have been used in biology, including to create gene regulatory networks (Shachaf et al., 2023), identify SNP interactions (Cao et al., 2018), and to analyse similarities between biomarkers (Keup et al., 2021).
2.3 Silhouette index
The Silhouette Index (SI) is a common metric that is typically used when there are no labels for the data being clustered. It compares the similarity within a cluster to the similarity between clusters (Rousseeuw, 1987).
Given:
- N = number of samples in the dataset
- a(i) = mean within cluster distance for sample i
- b(i) = mean distance between sample i and samples within the nearest cluster
SI values range from −1 to 1 with negative values indicating that the average sample has been assigned to “the wrong cluster.” Higher scores (approaching 1) indicate robust clustering and the presence of dense, well-separated clusters. In biological use cases, stratifying individuals can be nuanced meaning clusters could be weaker. As such, there is no guideline for an SI value that acts as a cut-off for “good” clustering for biological data. Rather, the SI threshold varies between use cases (Pagnuco et al., 2017; Zhao et al., 2018).
The SI metric does not rely on labels or measure prediction validity. Therefore, the SI metric is helpful for evaluating the comparative performances of different clustering methods. However, the SI metric cannot detect if the clustering is due to a bias in the data that is unrelated to the trait (Chhabra et al., 2021). For example, when clustering whole genome sequencing data, the clusters may be related to ancestry, sex, or other traits distributed across the population and not the actual trait being studied. Another disadvantage is the key assumption that clusters are Gaussian, meaning that any SI values for data that does not follow a spherical shape will be misleading (Thrun, 2018). For example, if a disease has a limited number of genes associated with it, the genes would not cover enough dimensions to be spherical and satisfy this assumption. Sparsity can also result in irregular shapes. Therefore, the SI metric would not be suitable in some cases, such as rare disease clustering, and should always be used with caution. Nonetheless, it is a useful method in genetics and genomics where clusters are often unknown so there are no labels to compare against (Lopez et al., 2018; Yin et al., 2018).
2.4 Davies-Bouldin Index
A less common intrinsic method for evaluating clustering performance is the Davies-Bouldin Index (DBI). This metric compares the similarity between each cluster and the cluster most similar to it (Davies and Bouldin, 1979).
Given:
- N = number of clusters
- si = the mean distance between each sample in cluster i and cluster i’s centroid
- dij = the distance between cluster centroids i and j
DBI is an intrinsic method and shares many advantages and disadvantages with the SI. However, unlike the SI, the lower the DBI, the better the samples are clustered with zero being the minimum score. The computation of the DBI is simpler and more efficient than for the SI (Petrovi’c, 2006). This is a particularly valid consideration for the analysis of large genomics datasets, particularly if the data being clustered is whole-genome sequencing data. A limitation of DBI is that the clustering algorithm for its generation requires the Euclidean distance between cluster centroids (Davies and Bouldin, 1979). This is typically not a problem for genomics as Euclidean distance is a common choice in bioinformatic analyses. However, different distance matrices can provide different, even conflicting results and there are times when another distance measure may be more suitable for the research question (Jaskowiak et al., 2014). For example, genomics datasets such as whole genome sequencing data often suffer from sparsity meaning that most of the data is zeroes (Yazdani et al., 2015). In these cases, DBI would not be suitable.
2.5 Other clustering metrics
While these four clustering metrics cover the majority of use cases within genomics, there are other metrics that have their advantages. These include internal metrics such as the Calinski-Harabasz index (variance ratio criterion) (Caliñski and Harabasz, 1974; Babichev et al., 2017; Huang et al., 2021) as well as external metrics such as the Fowlkes-Mallows index (Fowlkes and Mallows, 1983; Ryšavý and Železný, 2017; Lee et al., 2023). Methods such as gap statistics are predominantly used for selecting the number of clusters, however, can be used as a metric (Tibshirani et al., 2001; Lugner et al., 2021). Advantages and disadvantages as well as previous uses of these are included in Table 1.
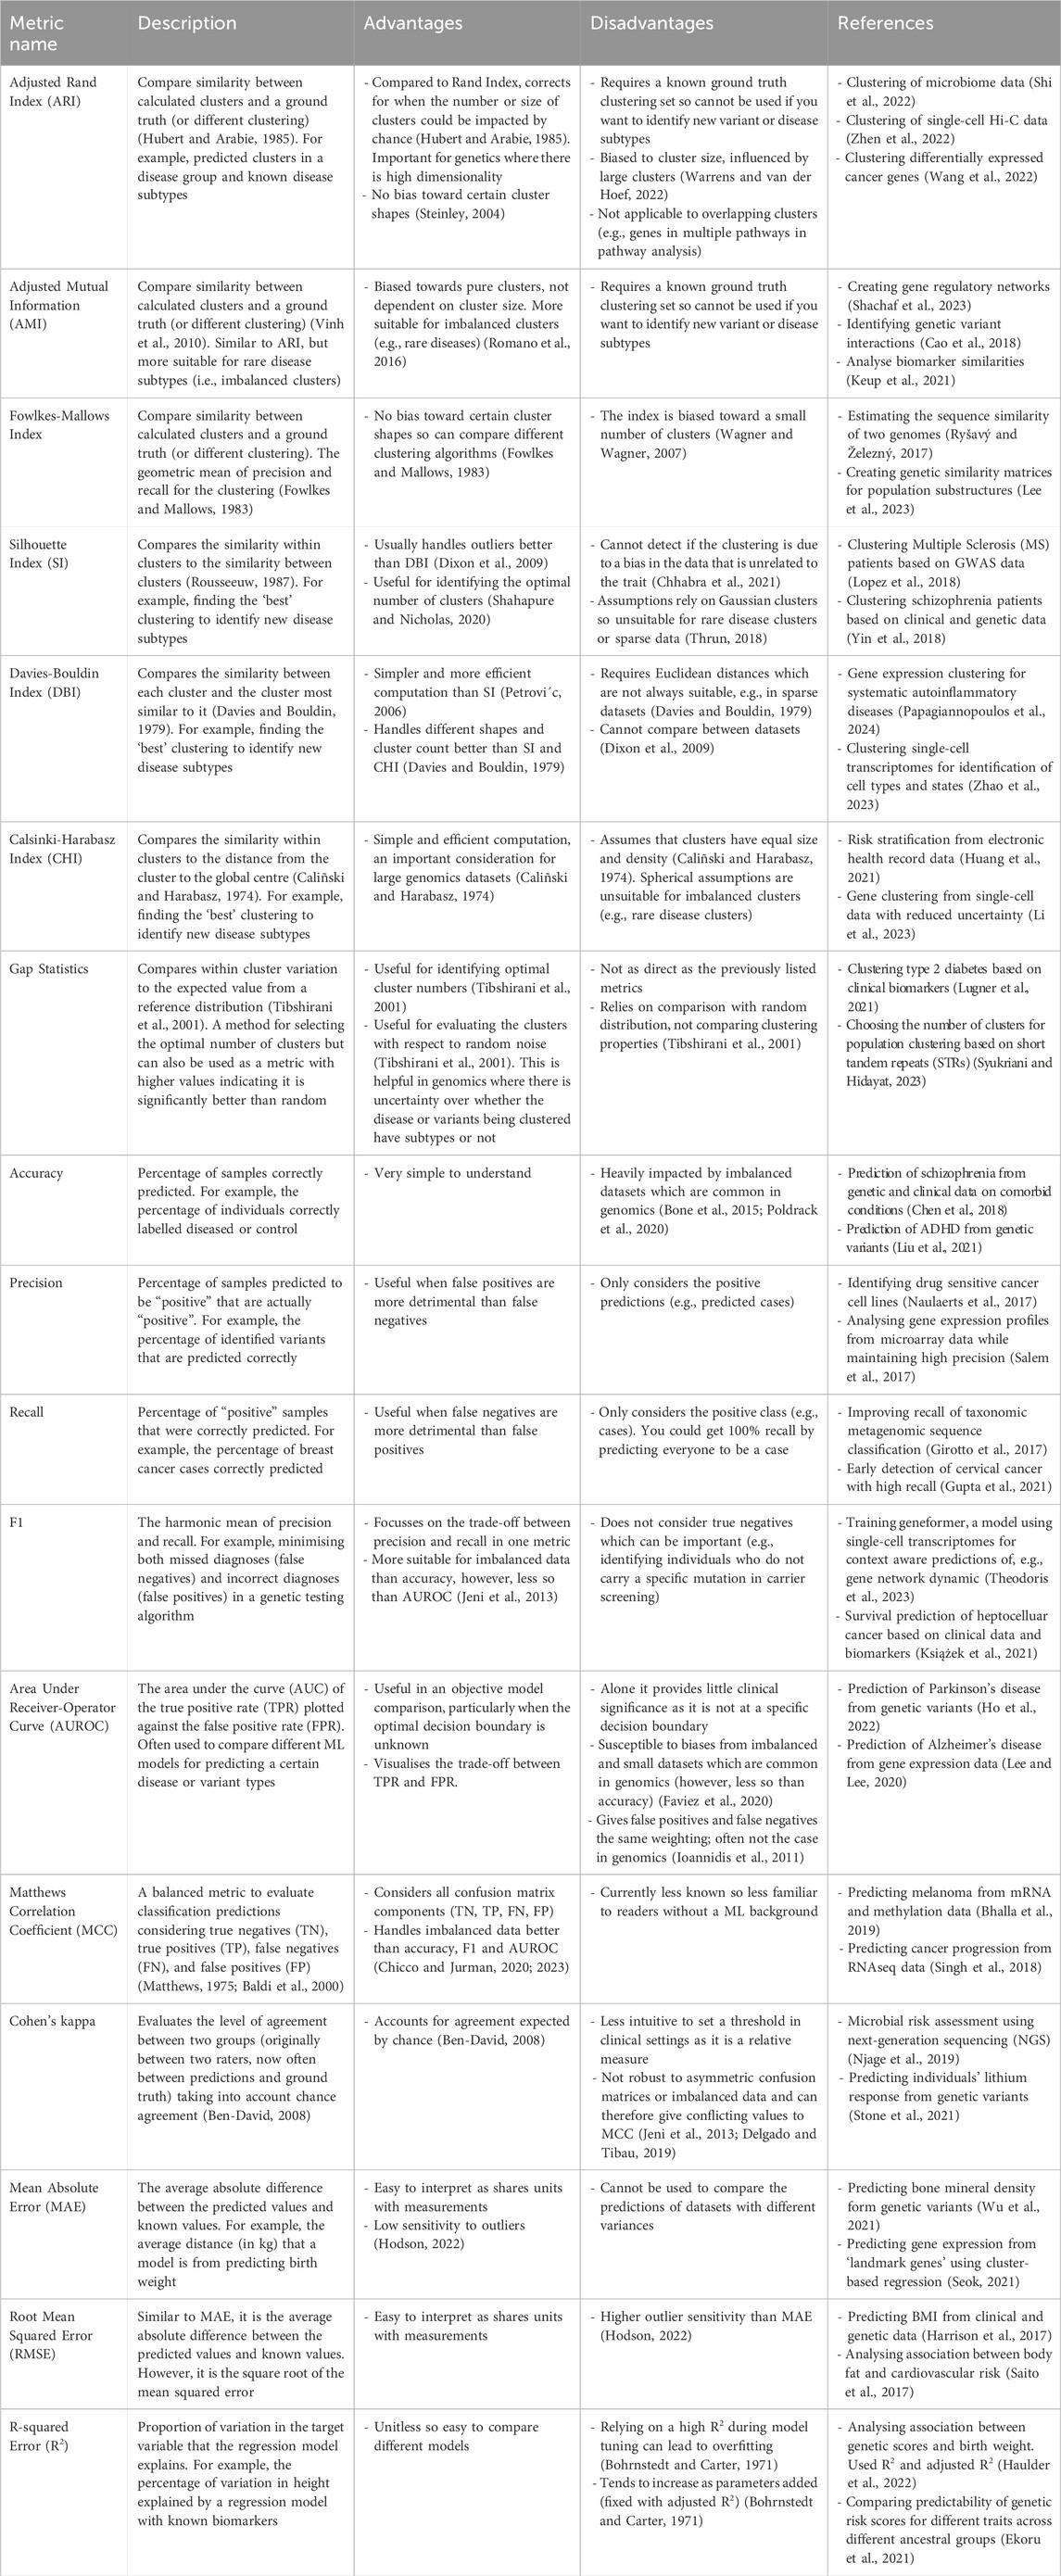
Table 1. Overview of the common clustering, classification, and regression metrics including their advantages, disadvantages, and example uses in genetics and genomics.
3 ML metrics for classification
Classification is the machine learning category most frequently used in genetics and genomics (Al-Tashi et al., 2023; Ho et al., 2022; Lee and Lee, 2020; Trakadis et al., 2019). Whilst the classification method complexity can range from simple logistic regression to complicated deep learning algorithms, the metrics remain predominantly the same. For parametric classifiers, the choice of metric largely depends on (1) the distribution of the data and (2) an understanding of the aim of the study. Nonparametric decision boundaries do not make assumptions about the data’s distribution (e.g., DD-classifier (Li et al., 2012)), however, these are not covered in this paper. Common metrics include: accuracy, area under the receiver-operator curve (AUROC), precision, recall, and F1.
3.1 Accuracy
Accuracy is the simplest classification metric to understand and is often reported in genomics papers (Chen et al., 2018; Trakadis et al., 2019; Liu et al., 2021). Accuracy provides a measure of the percentage of individuals who are correctly classified.
The accuracy metric is used to evaluate how well an algorithm assigns individuals to the correct category (e.g., predicting whether someone has a particular trait or not). However, accuracy is heavily impacted by imbalanced datasets (Bone et al., 2015; Poldrack et al., 2020). For example, if a dataset of 100 individuals contains 10 diseased individuals and 90 healthy, an algorithm could get an accuracy of 90% by predicting everyone to be healthy. This is a real issue for genomic analyses, as they are often imbalanced due to the ease of obtaining data from control in comparison to the affected individuals, especially when dealing with rare traits/diseases (Devarriya et al., 2020; Faviez et al., 2020; Dai et al., 2021). Therefore, it is important to understand the dataset structure to enable an objective assessment of the accuracy measure.
3.2 Precision, recall, and F1
Confusion matrices (Figure 3A) are a simple way to display predictions for a population by separating them into those that were correctly predicted to be controls (true negatives; TN), correctly predicted to be cases (true positives; TP), incorrectly predicted to be controls (false negatives; FN), and incorrectly predicted to be cases (false positives; FP) (Figures 3A, B). The precision, recall, and F1 classification scores can be calculated from these four groups.
Given:
- TP: number of true positives
- FP: number of false positives
- FN: number of false negatives
- P: precision
- R: recall
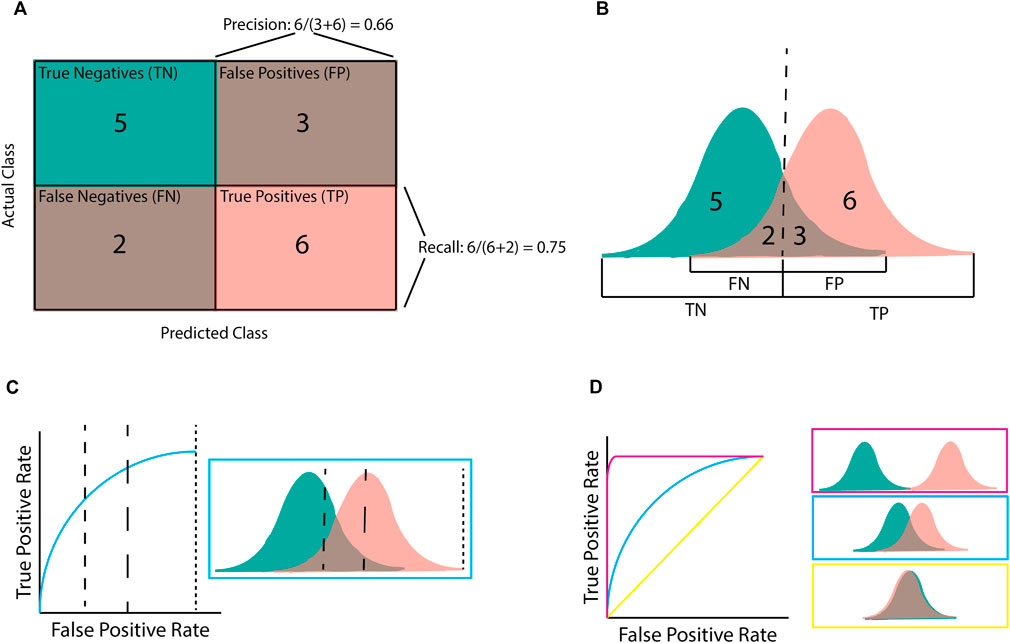
Figure 3. Illustration of classification metrics. (A) Confusion matrix used to calculate precision and recall. (B) the score distribution and threshold that gives the confusion matrix in (A). Every score below the dashed line is assigned to the negative class whilst scores after the dashed line are assigned to the positive class. (C) An Area Under the Receiver-Operator Curve (AUROC) graph for the given score distribution. Different chosen thresholds (dashed lines) give different ratios of FPR to TPR. (D) AUROC graphs for the three distribution patterns. Pink shows complete separation, blue is partial separation, and yellow is complete crossover.
Precision (or positive predictive value [PPV]) refers to the percentage of samples predicted to be “positive” that are actually “positive”; that is, a 100% precision means that there were no samples incorrectly labelled as “positive”. However, precision does not consider positive samples that were incorrectly labelled “negative”. By contrast, recall (or sensitivity) refers to the percentage of “positive” samples that were correctly labelled as positive; that is, a 100% recall score means that no positive samples were incorrectly labelled as negative. The F1 score is the harmonic mean of these precision and recall metrics. Therefore, a high F1 score requires both a high precision and a high recall. The importance of the precision and recall metrics varies according to the problem. For example, if an algorithm has been designed for disease diagnosis, incorrectly labelling an individual as health would be more harmful, making recall more important than precision (Chen et al., 2017). On the contrary, if an algorithm focuses on identifying genetic variants of interest or transcriptional effects, it is more important that the majority of the identified variants are correctly predicted, even at the expense of missed variants (false negatives). In this case precision would be more important than recall (Ioannidis et al., 2011).
3.3 Area under a receiver-operator curve
Area under a Receiver-Operator Curve (AUROC) is a common metric used in genomics as it is helpful for model comparison (Lee and Lee, 2020; Gupta et al., 2022; Ho et al., 2022). AUROC is calculated by plotting the true positive rate (TPR; equivalent to recall) against the false positive rate (FPR) and finding the area underneath this curve (Figures 3C, D). AUROC quantifies how well a model distinguishes between different classes by summarising the model’s performance at all decision boundaries (Box 1) into one value. This is different from other metrics (e.g., accuracy, precision, and recall) that only consider the model at a given decision boundary. However, even though AUROC is commonly used in genomics, it is not always useful on its own as, despite being helpful for model comparison, using AUROC alone provides little measure of clinical significance. For example, AUROC does not provide insight into how well a specific model will perform upon deployment (e.g., for diagnosing a disease) as this requires a decision boundary to have been chosen and validated.
Two keys assumptions limit the use of AUROC. Firstly, AUROC assumes false positives and false negatives are equally undesirable, which is not always the case in genomic analyses where the consequences of incorrectly predicting someone has not got a particular condition (false negative) can be far greater than the consequences of incorrectly predicting that they do (false positives) (Ioannidis et al., 2011). Secondly, AUROC is susceptible to biases from imbalanced and small datasets, both of which are common in genomics, particularly within studies of rare diseases (Faviez et al., 2020). Given these limitations, many studies will report the AUROC metric alongside metrics that include accuracy, precision, and recall, which are calculated at a given decision boundary and thus provide more clinical significance (Gao et al., 2021; Liu et al., 2021).
3.4 Matthew’s correlation coefficient and Cohen’s kappa
The above metrics are a selection of those most commonly used in ML for genomics and are arguably the easiest to understand. However, like with clustering, there are many other metrics available. Two metrics that are increasing in popularity and address some of the disadvantages of the metrics listed above are Matthew’s correlation coefficient (MCC) (Singh et al., 2018; Bhalla et al., 2019; Chicco and Jurman, 2020) and Cohen’s kappa (Ben-David, 2008; Njage et al., 2019; Yu et al., 2019; Stone et al., 2021). Particularly, MCC has been suggested as a preferential metric to the more popular ones discussed in this section due to its increased reliability with imbalanced datasets (Chicco and Jurman, 2020; 2023). Advantages, disadvantages, and use cases for these are listed in Table 1.
4 ML metrics for regression
Regression is less common in genomic studies than classification. However, it is helpful in predicting highly heterogenous traits with known scales such as height, systolic blood pressure, and waist-hip ratio (Bellot et al., 2018; Lello et al., 2018). The choice of regression metric for a particular analysis is also more nuanced than in classification studies, as the advantages and disadvantages of each option are less obvious. However, regression metrics that are commonly used include mean absolute error (Shahid and Singh, 2020), root mean squared error (Shmoish et al., 2021), and R2 (Harrison et al., 2017; Haulder et al., 2022).
4.1 Mean absolute error
Mean absolute error (MAE) is a common method for measuring the average difference between the predicted values and the known values.
Given:
-
-
-
The units for MAE are the same as the data points, making it easier to understand. However, this means it is hard to compare different predictions if the underlying data have different units. For example, Lello et al. (2018) used machine learning to predict height, heel bone density, and educational attainment from the same dataset (UK Biobank). They chose to look at the total variance explained by the model, however, had they chosen MAE as their metric instead, they would not be able to easily compare the predictability of the three traits – due to the different units used to measure each trait.
MAE has several strengths that make it useful, in particular MAE is less sensitive to outliers as it gives equal weight to all errors (Hodson, 2022). However, giving equal weighting to all errors means MAE cannot be used to compare the predictions of datasets with different variances even when these incorporate the same measurement units (e.g., predicting two body measurements in datasets with differing variance).
To take advantage of the strengths and restrict the impact of the limitations associated with the use of MAE, many researchers choose to report MAE alongside other metrics, such as root mean squared error and R2 (see below) (Shahid and Singh, 2020; Shmoish et al., 2021; Zhang et al., 2021).
4.2 Root mean squared error
Root mean squared error (RMSE) is another frequently used metric for measuring the average difference between the predicted values and actual values in regression.
Given:
-
-
-
Similar to MAE, the units for RMSE are the same as those used for the data points. However, RMSE is more sensitive to outliers than MAE. This means RMSE gives larger weightings to these errors (Hodson, 2022). As such, whether MAE or RMSE is a better error metric has been hotly debated. Willmott et al. (2009) argued that sums-of-square-based statistics such as RMSE can not be used to represent average error as they vary in response to both error variability and central location. Chai and Draxler (2014) debated this, using simulations to show that RMSE is not only not ambiguous, but is more valuable than the MAE when the expected error distribution is Gaussian. It has also been suggested that a ratio of the two metrics is a more accurate metric than either option individually (Karunasingha, 2022).
RMSE has been used in genomic studies as a metric for predicting heterogeneous traits (Harrison et al., 2017; Shmoish et al., 2021). However, like MAE, RMSE is typically reported alongside the R2 error, which measures the proportion of variation explained by the model (see below) (Harrison et al., 2017; Shmoish et al., 2021).
4.3 R-squared error
The R-squared error (R2), also known as the coefficient of determination, provides a measure of the proportion of variation in the variable being predicted (target variable) that the regression model explains.
Given:
-
-
-
-
Unlike MAE and RMSE, R2 error is not measured in the same units as the data points but instead varies from 0 (model explains 0% of target variable variance) to 1 (model explains 100% of target variable variance). Because of this, R2 error is easily used to compare different models. A large R2 suggests that the model is a good fit for the data. On the other hand, low R2 values can mean that there is a significant amount of noise compared to signal (i.e., low signal-to-noise ratio). A low R2 is not always bad, however, as it may just be indicative of low effect sizes which are common in complex disease genetics (Marian, 2012). Conversely, a high R2 is not always good. Relying on a high R2 for model tuning can result in overfitting as it is not robust to the number of predictors (Bohrnstedt and Carter, 1971). Notably, R2 tends to increase when new variables are added to the model, even if they do not cause significant improvement(s) (Bohrnstedt and Carter, 1971). This can be compensated for by using the adjusted R2.
Given:
- n = number of data points
- p = number of independent variables/predictors
The adjusted R2 decreases if the additional parameters do not increase the model’s predictability. Therefore, the adjusted R2 is often a more suitable measure for genomic studies, where models frequently use many variables (e.g., many genes, clinical scores, sex, and anthropometric measures) to predict target variables (e.g., birthweight) (Haulder et al., 2022).
5 Common pitfalls that lead to exaggerated metrics
Regardless of the chosen metric, some common pitfalls can result in the wrong conclusions being drawn. This can be particularly problematic in genetic and genomic studies, especially if a published model is thought to be more accurate at predicting a disease than it is. However, overfitting of data is the main cause of exaggerated metrics (England and Cheng, 2019). A model is considered overfit if it predicts extremely well for the training data but is a poor predictor outside the context. The chance of overfitting is greatly reduced by splitting the data into a training and test dataset, however, if enough models are trained on the training dataset, it is possible to find one that performs well on the test dataset by chance. For example, Chekroud et al. (2024) found that a machine learning model designed to predict patient outcomes of individuals in schizophrenia drug trials had high accuracy for predictions within the trial dataset used to train the model. However, in other trials its performance was no better than chance (Chekroud et al., 2024). Therefore, when optimising a model to achieve higher scores in the chosen metrics, it is crucial to remember that the scores are only relevant for the dataset(s) that the model is trained and tested on. This relates to the concept “bias-variance tradeoff” where high bias comes from a simplified model and leads to underfitting whereas high variance comes from a complex model with low training errors, leading to overfitting (Geman et al., 1992). As mentioned in the previous section, some metrics (including R2) are more prone to overfitting, and adjustments can be made to minimise this problem (e.g., adjusted R2). Reproducibility is critical so that the pipeline can be repeated on another dataset to confirm the validity of the model’s claims (Pineau et al., 2021) and identify overfitting.
Another common cause of exaggerated metrics is if the test data does not remain unseen by the model during training. That is, the test data must be kept hidden throughout feature selection and model training. Otherwise the model may learn features from the test dataset that it would not have otherwise learnt. A common mistake is to split the data after feature selection has begun (e.g., after genes or SNPs have been selected based on a statistical test), however, doing so will lead to inflated metrics (Kapoor and Narayanan, 2023). For example, Barnett et al. (2023) found that 44% of the genomic studies they investigated had inflated metrics due to data leakage during feature selection. On average, they saw an AUROC increase of 0.18 because of this data leakage. Unlike with overfitting, all metrics are equally impacted by this bias so care must be taken both during model training and when evaluating the metric scores. Again, reproducibility is essential to confirm the validity of the model’s claims and identify any biases.
Even if an effort is made to ensure the data is not overfit to the training data and the test data remains unseen, it is important to understand the limitations of the dataset. Models created with data from a specific subpopulation may not be meaningful when applied to other populations (De Roos et al., 2009; Gurdasani et al., 2019). For example, an algorithm using SNP information within a European population to predict a disease may not be as accurate when applied to different population groups. Understanding the dataset means it is easier to check for any biases inflating the reported metrics. For a dataset of individuals with and without a particular disease, if there is information on ancestry or sex, a simple check should be performed to confirm that the model remains unbiased toward a specific group. If there is a disparity in metric scores between groups, reporting the metrics for the different groups separately brings awareness to these biases.
A checklist of standards for publishing papers on AI-based science has been created that covers eight sections, including metrics and reproducibility (Kapoor et al., 2023). Specific reproducibility standards for the life sciences have also been published (Heil et al., 2021).
6 Discussion
Machine learning is a powerful tool within genetic and genomic research and has become increasingly accessible to researchers. However, care must be taken when choosing a metric for evaluating model outputs and interpreting the results. There is no one-size-fits-all metric available. We contend that multiple suitable performance metrics should be chosen based on an understanding of the dataset and the research question. Result reproducibility is crucial for readers to trust the reported metrics, as is a discussion of potential biases within the data and model that could have impacted the metrics. After reporting on the model’s performance, biases should be considered. It is best to keep the research question and data context in mind throughout the process to ensure reliable and confident results.
Author contributions
CM: Conceptualization, Visualization, Writing–original draft, Writing–review and editing. TP: Supervision, Writing–review and editing. DN: Supervision, Writing–review and editing. JO’S: Conceptualization, Supervision, Writing–review and editing.
Funding
The author(s) declare that financial support was received for the research, authorship, and/or publication of this article. C Miller was funded by the University of Auckland Doctoral Scholarship. D Nyaga was funded by the Dines Family Foundation.
Conflict of interest
The authors declare that the research was conducted in the absence of any commercial or financial relationships that could be construed as a potential conflict of interest.
Publisher’s note
All claims expressed in this article are solely those of the authors and do not necessarily represent those of their affiliated organizations, or those of the publisher, the editors and the reviewers. Any product that may be evaluated in this article, or claim that may be made by its manufacturer, is not guaranteed or endorsed by the publisher.
References
Ali, M. (2020). PyCaret: an open source, low-code machine learning library in Python. Available at: https://www.pycaret.org.
Al-Tashi, Q., Saad, M. B., Muneer, A., Qureshi, R., Mirjalili, S., Sheshadri, A., et al. (2023). Machine learning models for the identification of prognostic and predictive cancer biomarkers: a systematic review. Int. J. Mol. Sci. 2023, 7781. doi:10.3390/ijms24097781
Alyousef, A. A., Nihtyanova, S., Denton, C., Bosoni, P., Bellazzi, R., and Tucker, A. (2018). Nearest consensus clustering classification to identify subclasses and predict disease. J. Healthc. Inf. Res. 2, 402–422. doi:10.1007/s41666-018-0029-6
Awada, H., Durmaz, A., Gurnari, C., Kishtagari, A., Meggendorfer, M., Kerr, C. M., et al. (2021). Machine learning integrates genomic signatures for subclassification beyond primary and secondary acute myeloid leukemia. Blood 138, 1885–1895. doi:10.1182/blood.2020010603
Babichev, S., Lytvynenko, M. A. T., and Osypenko, V. (2017). “Criterial analysis of gene expression sequences to create the objective clustering inductive technology,” in 2017 IEEE 37th international conference on electronics and nanotechnology (ELNANO) (IEEE).
Baldi, P., Brunak, S., Chauvin, Y., Andersen, C. A. F., and Nielsen, H. (2000). Assessing the accuracy of prediction algorithms for classification: an overview. Bioinformatics 16, 412–424. doi:10.1093/bioinformatics/16.5.412
Barnett, E. J., Onete, D. G., Salekin, A., and Faraone, S. V. (2023). Genomic machine learning meta-regression: insights on associations of study features with reported model performance. IEEE/ACM Trans. Comput. Biol. Bioinform 21, 169–177. doi:10.1109/tcbb.2023.3343808
Bellot, P., de los Campos, G., and Pérez-Enciso, M. (2018). Can deep learning improve genomic prediction of complex human traits? Genetics 210, 809–819. doi:10.1534/genetics.118.301298
Ben-David, A. (2008). Comparison of classification accuracy using Cohen’s Weighted Kappa. Expert Syst. Appl. 34, 825–832. doi:10.1016/j.eswa.2006.10.022
Bhalla, S., Kaur, H., Dhall, A., and Raghava, G. P. S. (2019). Prediction and analysis of skin cancer progression using genomics profiles of patients. Sci. Rep. 9, 15790. doi:10.1038/s41598-019-52134-4
Bohrnstedt, G. W., and Carter, T. M. (1971). Robustness in regression analysis. Sociol. Methodol. 3, 118. doi:10.2307/270820
Bone, D., Goodwin, M. S., Black, M. P., Lee, C.-C., Audhkhasi, K., Narayanan, S., et al. (2015). Applying machine learning to facilitate autism diagnostics: pitfalls and promises. J. Autism Dev. Disord. 45, 1121–1136. doi:10.1007/s10803-014-2268-6
Bracher-Smith, M., Crawford, K., and Escott-Price, V. (2021). Machine learning for genetic prediction of psychiatric disorders: a systematic review. Mol. Psychiatry 26, 70–79. doi:10.1038/s41380-020-0825-2
Caliñski, T., and Harabasz, J. (1974). A dendrite method for cluster analysis. Commun. Statistics 3, 1–27. doi:10.1080/03610927408827101
Cao, X., Yu, G., Liu, J., Jia, L., and Wang, J. (2018). ClusterMI: detecting high-order SNP interactions based on clustering and mutual information. Int. J. Mol. Sci. 19, 2267. doi:10.3390/ijms19082267
Caudai, C., Galizia, A., Geraci, F., Le Pera, L., Morea, V., Salerno, E., et al. (2021). AI applications in functional genomics. Comput. Struct. Biotechnol. J. 19, 5762–5790. doi:10.1016/j.csbj.2021.10.009
Chafai, N., Bonizzi, L., Botti, S., and Badaoui, B. (2024). Emerging applications of machine learning in genomic medicine and healthcare. Crit. Rev. Clin. Lab. Sci. 61, 140–163. doi:10.1080/10408363.2023.2259466
Chai, T., and Draxler, R. R. (2014). Root mean square error (RMSE) or mean absolute error (MAE)? -Arguments against avoiding RMSE in the literature. Geosci. Model Dev. 7, 1247–1250. doi:10.5194/gmd-7-1247-2014
Chekroud, A. M., Hawrilenko, M., Loho, H., Bondar, J., Gueorguieva, R., Hasan, A., et al. (2024). Illusory generalizability of clinical prediction models. Available at: https://www.science.org.383 164–167. doi:10.1126/science.adg8538
Chen, J., Wu, J. shing, Mize, T., Shui, D., and Chen, X. (2018). Prediction of schizophrenia diagnosis by integration of genetically correlated conditions and traits. J. Neuroimmune Pharmacol. 13, 532–540. doi:10.1007/s11481-018-9811-8
Chen, K. M., Wong, A. K., Troyanskaya, O. G., and Zhou, J. (2022). A sequence-based global map of regulatory activity for deciphering human genetics. Nat. Genet. 54, 940–949. doi:10.1038/s41588-022-01102-2
Chen, M., Hao, Y., Hwang, K., Wang, L., and Wang, L. (2017). Disease prediction by machine learning over big data from healthcare communities. IEEE Access 5, 8869–8879. doi:10.1109/ACCESS.2017.2694446
Chhabra, A., Masalkovaite, K., and Mohapatra, P. (2021). An overview of fairness in clustering. IEEE Access 9, 130698–130720. doi:10.1109/ACCESS.2021.3114099
Chicco, D., and Jurman, G. (2020). The advantages of the Matthews correlation coefficient (MCC) over F1 score and accuracy in binary classification evaluation. BMC Genomics 21, 6. doi:10.1186/s12864-019-6413-7
Chicco, D., and Jurman, G. (2023). The Matthews correlation coefficient (MCC) should replace the ROC AUC as the standard metric for assessing binary classification. BioData Min. 16, 4. doi:10.1186/s13040-023-00322-4
Dai, X., Fu, G., Zhao, S., and Zeng, Y. (2021). Statistical learning methods applicable to genome-wide association studies on unbalanced case-control disease data. Genes (Basel) 12, 736. doi:10.3390/genes12050736
Davies, D. L., and Bouldin, D. W. (1979). A cluster separation measure. IEEE Trans. Pattern Anal. Mach. Intell. PAMI- 1, 224–227. doi:10.1109/TPAMI.1979.4766909
Delgado, R., and Tibau, X.-A. (2019). Why Cohen’s Kappa should be avoided as performance measure in classification. PLoS One 14, e0222916. doi:10.1371/journal.pone.0222916
De Roos, A. P. W., Hayes, B. J., and Goddard, M. E. (2009). Reliability of genomic predictions across multiple populations. Genetics 183, 1545–1553. doi:10.1534/genetics.109.104935
Devarriya, D., Gulati, C., Mansharamani, V., Sakalle, A., and Bhardwaj, A. (2020). Unbalanced breast cancer data classification using novel fitness functions in genetic programming. Expert Syst. Appl. 140, 112866. doi:10.1016/j.eswa.2019.112866
Di Giovanni, D., Enea, R., Di Micco, V., Benvenuto, A., Curatolo, P., and Emberti Gialloreti, L. (2023). Using machine learning to explore shared genetic pathways and possible endophenotypes in autism spectrum disorder. Genes (Basel) 14, 313. doi:10.3390/genes14020313
Dixon, S. J., Heinrich, N., Holmboe, M., Schaefer, M. L., Reed, R. R., Trevejo, J., et al. (2009). Use of cluster separation indices and the influence of outliers: application of two new separation indices, the modified silhouette index and the overlap coefficient to simulated data and mouse urine metabolomic profiles. J. Chemom. 23, 19–31. doi:10.1002/cem.1189
Ekoru, K., Adeyemo, A. A., Chen, G., Doumatey, A. P., Zhou, J., Bentley, A. R., et al. (2021). Genetic risk scores for cardiometabolic traits in sub-Saharan African populations. Int. J. Epidemiol. 50, 1283–1296. doi:10.1093/ije/dyab046
England, J. R., and Cheng, P. M. (2019). Artificial intelligence for medical image analysis: a guide for authors and reviewers. Am. J. Roentgenol. 212, 513–519. doi:10.2214/AJR.18.20490
Faviez, C., Chen, X., Garcelon, N., Neuraz, A., Knebelmann, B., Salomon, R., et al. (2020). Diagnosis support systems for rare diseases: a scoping review. Orphanet J. Rare Dis. 15, 94. doi:10.1186/s13023-020-01374-z
Fowlkes, E. B., and Mallows, C. L. (1983). A method for comparing two hierarchical clusterings. J. Am. Stat. Assoc. 78, 553. doi:10.2307/2288117
Gao, X. Y., Amin Ali, A., Shaban Hassan, H., and Anwar, E. M. (2021). Improving the accuracy for analyzing heart diseases prediction based on the ensemble method. Complexity 2021, 2021. doi:10.1155/2021/6663455
Geman, S., Bienenstock, E., and Doursat, R. (1992). Neural networks and the bias/variance dilemma. Neural comput. 4, 1–58. doi:10.1162/neco.1992.4.1.1
Girotto, S., Comin, M., and Pizzi, C. (2017). Higher recall in metagenomic sequence classification exploiting overlapping reads. BMC Genomics 18, 917. doi:10.1186/s12864-017-4273-6
Gupta, A., Anand, A., and Hasija, Y. (2021). “Recall-based machine learning approach for early detection of cervical cancer,” in 2021 6th international conference for convergence in technology (I2CT) (IEEE), 1–5. doi:10.1109/I2CT51068.2021.9418099
Gupta, C., Chandrashekar, P., Jin, T., He, C., Khullar, S., Chang, Q., et al. (2022). Bringing machine learning to research on intellectual and developmental disabilities: taking inspiration from neurological diseases. J. Neurodev. Disord. 14, 28. doi:10.1186/s11689-022-09438-w
Gurdasani, D., Barroso, I., Zeggini, E., and Sandhu, M. S. (2019). Genomics of disease risk in globally diverse populations. Nat. Rev. Genet. 20, 520–535. doi:10.1038/s41576-019-0144-0
Harrison, R. N. S., Gaughran, F., Murray, R. M., Lee, S. H., Cano, J. P., Dempster, D., et al. (2017). Development of multivariable models to predict change in Body Mass Index within a clinical trial population of psychotic individuals. Sci. Rep. 7, 14738. doi:10.1038/s41598-017-15137-7
Haulder, M., Hughes, A. E., Beaumont, R. N., Knight, B. A., Hattersley, A. T., Shields, B. M., et al. (2022). Assessing whether genetic scores explain extra variation in birthweight, when added to clinical and anthropometric measures. BMC Pediatr. 22, 504. doi:10.1186/s12887-022-03554-1
Heil, B. J., Hoffman, M. M., Markowetz, F., Lee, S.-I., Greene, C. S., and Hicks, S. C. (2021). Reproducibility standards for machine learning in the life sciences. Nat. Methods 18, 1132–1135. doi:10.1038/s41592-021-01256-7
Ho, D., Schierding, W., Farrow, S. L., Cooper, A. A., Kempa-Liehr, A. W., and O’Sullivan, J. M. (2022). Machine learning identifies six genetic variants and alterations in the heart atrial appendage as key contributors to PD risk predictivity. Front. Genet. 12, 785436. doi:10.3389/fgene.2021.785436
Ho, D. S. W., Schierding, W., Wake, M., Saffery, R., and O’Sullivan, J. (2019). Machine learning SNP based prediction for precision medicine. Front. Genet. 10, 267. doi:10.3389/fgene.2019.00267
Hodson, T. O. (2022). Root-mean-square error (RMSE) or mean absolute error (MAE): when to use them or not. Geosci. Model Dev. 15, 5481–5487. doi:10.5194/gmd-15-5481-2022
Huang, Y., Liu, Y., Steel, P. A. D., Axsom, K. M., Lee, J. R., Tummalapalli, S. L., et al. (2021). Deep significance clustering: a novel approach for identifying risk-stratified and predictive patient subgroups. J. Am. Med. Inf. Assoc. 28, 2641–2653. doi:10.1093/jamia/ocab203
Hubert, L., and Arabie, P. (1985). Comparing partitions. J. Classif. 2, 193–218. doi:10.1007/bf01908075
Ioannidis, J. P. A., Tarone, R., and McLaughlin, J. K. (2011). The false-positive to false-negative ratio in epidemiologic studies. Epidemiology 22, 450–456. doi:10.1097/EDE.0b013e31821b506e
Jaskowiak, P. A., Campello, R. J. G. B., and Costa, I. G. (2014). On the selection of appropriate distances for gene expression data clustering. BMC Bioinforma. 15, S2. doi:10.1186/1471-2105-15-S2-S2
Jeni, L. A., Cohn, J. F., and De La Torre, F. (2013). “Facing imbalanced data - recommendations for the use of performance metrics,” in Proceedings - 2013 humaine association conference on affective computing and intelligent interaction, ACII 2013, 245–251. doi:10.1109/ACII.2013.47
Kapoor, S., Cantrell, E., Peng, K., Pham, T. H., Bail, C. A., Gundersen, O. E., et al. (2023). REFORMS: reporting standards for machine learning based science. Available at: http://arxiv.org/abs/2308.07832.
Kapoor, S., and Narayanan, A. (2023). Leakage and the reproducibility crisis in machine-learning-based science. Patterns 4, 100804. doi:10.1016/j.patter.2023.100804
Karunasingha, D. S. K. (2022). Root mean square error or mean absolute error? Use their ratio as well. Inf. Sci. (N Y) 585, 609–629. doi:10.1016/j.ins.2021.11.036
Keup, C., Suryaprakash, V., Hauch, S., Storbeck, M., Hahn, P., Sprenger-Haussels, M., et al. (2021). Integrative statistical analyses of multiple liquid biopsy analytes in metastatic breast cancer. Genome Med. 13, 85. doi:10.1186/s13073-021-00902-1
Koumakis, L. (2020). Deep learning models in genomics; are we there yet? Comput. Struct. Biotechnol. J. 18, 1466–1473. doi:10.1016/j.csbj.2020.06.017
Książek, W., Gandor, M., and Pławiak, P. (2021). Comparison of various approaches to combine logistic regression with genetic algorithms in survival prediction of hepatocellular carcinoma. Comput. Biol. Med. 134, 104431. doi:10.1016/j.compbiomed.2021.104431
Lee, S., Hahn, G., Hecker, J., Lutz, S. M., Mullin, K., Hide, W., et al. (2023). A comparison between similarity matrices for principal component analysis to assess population stratification in sequenced genetic data sets. Brief. Bioinform 24, bbac611. doi:10.1093/bib/bbac611
Lee, T., and Lee, H. (2020). Prediction of Alzheimer’s disease using blood gene expression data. Sci. Rep. 10, 3485. doi:10.1038/s41598-020-60595-1
Lello, L., Avery, S. G., Tellier, L., Vazquez, A. I., de los Campos, G., and Hsu, S. D. H. (2018). Accurate genomic prediction of human height. Genetics 210, 477–497. doi:10.1534/genetics.118.301267
Li, J., Cuesta-Albertos, J. A., and Liu, R. Y. (2012). DD-classifier: nonparametric classification procedure based on DD-plot. J. Am. Stat. Assoc. 107, 737–753. doi:10.1080/01621459.2012.688462
Li, Q., Cassese, A., Guindani, M., and Vannucci, M. (2019). Bayesian negative binomial mixture regression models for the analysis of sequence count and methylation data. Biometrics 75, 183–192. doi:10.1111/biom.12962
Li, Z., Zhang, Q., Wang, P., Song, Y., and Wen, C. F. (2023). Uncertainty measurement for a gene space based on class-consistent technology: an application in gene selection. Appl. Intell. 53, 5416–5436. doi:10.1007/s10489-022-03657-3
Libbrecht, M. W., and Noble, W. S. (2015). Machine learning applications in genetics and genomics. Nat. Rev. Genet. 16, 321–332. doi:10.1038/nrg3920
Liu, L., Feng, X., Li, H., Cheng Li, S., Qian, Q., and Wang, Y. (2021). Deep learning model reveals potential risk genes for ADHD, especially Ephrin receptor gene EPHA5. Brief. Bioinform 22, bbab207. doi:10.1093/bib/bbab207
Lopez, C., Tucker, S., Salameh, T., and Tucker, C. (2018). An unsupervised machine learning method for discovering patient clusters based on genetic signatures. J. Biomed. Inf. 85, 30–39. doi:10.1016/j.jbi.2018.07.004
Lottaz, C., Toedling, J., and Spang, R. (2007). Annotation-based distance measures for patient subgroup discovery in clinical microarray studies. Bioinformatics 23, 2256–2264. doi:10.1093/bioinformatics/btm322
Lugner, M., Se, M. L., Gudbjörnsdottir, S., Sattar, N., Svensson, A.-M., Miftaraj, M., et al. (2021). Comparison between data-driven clusters and models based on clinical features to predict outcomes in type 2 diabetes: nationwide observational study. Diabetologia 64, 1973–1981. doi:10.1007/s00125-021-05485-5
Manduchi, E., Romano, J. D., and Moore, J. H. (2022). The promise of automated machine learning for the genetic analysis of complex traits. Hum. Genet. 141, 1529–1544. doi:10.1007/s00439-021-02393-x
Marian, A. J. (2012). Molecular genetic studies of complex phenotypes. Transl. Res. 159, 64–79. doi:10.1016/j.trsl.2011.08.001
Matthews, B. W. (1975). Comparison of the predicted and observed secondary structure of T4 phage lysozyme. Biochimica Biophysica Acta (BBA) - Protein Struct. 405, 442–451. doi:10.1016/0005-2795(75)90109-9
Musolf, A. M., Holzinger, E. R., Malley, J. D., and Bailey-Wilson, J. E. (2022). What makes a good prediction? Feature importance and beginning to open the black box of machine learning in genetics. Hum. Genet. 141, 1515–1528. doi:10.1007/s00439-021-02402-z
Naulaerts, S., Dang, C. C., and Ballester, P. J. (2017). Precision and recall oncology: combining multiple gene mutations for improved identification of drug-sensitive tumours. Oncotarget 8, 97025–97040. doi:10.18632/oncotarget.20923Available at: www.impactjournals.com/oncotarget.
Njage, P. M. K., Henri, C., Leekitcharoenphon, P., Mistou, M. Y., Hendriksen, R. S., and Hald, T. (2019). Machine learning methods as a tool for predicting risk of illness applying next-generation sequencing data. Risk Anal. 39, 1397–1413. doi:10.1111/risa.13239
Pagnuco, I. A., Pastore, J. I., Abras, G., Brun, M., and Ballarin, V. L. (2017). Analysis of genetic association using hierarchical clustering and cluster validation indices. Genomics 109, 438–445. doi:10.1016/j.ygeno.2017.06.009
Papagiannopoulos, O. D., Pezoulas, V. C., Papaloukas, C., and Fotiadis, D. I. (2024). 3D clustering of gene expression data from systemic autoinflammatory diseases using self-organizing maps (Clust3D). Comput. Struct. Biotechnol. J. 23, 2152–2162. doi:10.1016/j.csbj.2024.05.003
Petrovi’c, S. P. (2006). “A comparison between the silhouette index and the davies-bouldin index in labelling IDS clusters,” in Proceedings of the 11th Nordic workshop of secure IT systems, 53–64.
Pineau, J., Vincent-Lamarre, P., Sinha, K., Larivì, V., Beygelzimer, A., D’alché-Buc, F., et al. (2021). Improving reproducibility in machine learning research (A report from the NeurIPS 2019 reproducibility program).
Poldrack, R. A., Huckins, G., and Varoquaux, G. (2020). Establishment of best practices for evidence for prediction: a review. JAMA Psychiatry 77, 534–540. doi:10.1001/jamapsychiatry.2019.3671
Pudjihartono, N., Fadason, T., Kempa-Liehr, A. W., and O’Sullivan, J. M. (2022). A review of feature selection methods for machine learning-based disease risk prediction. Front. Bioinforma. 2, 927312. doi:10.3389/fbinf.2022.927312
Ramyachitra, D., and Manikandan, P. (2014). Imbalanced dataset classification and solutions: a review. Int. J. Comput. Bus. Res. 5.
Romano, S., Xuan Vinh, N., Bailey, J., and Verspoor, K. (2016). Adjusting for chance clustering comparison measures.
Rousseeuw, P. J. (1987). Silhouettes: a graphical aid to the interpretation and validation of cluster analysis. J. Comput. Appl. Math. 20, 53–65. doi:10.1016/0377-0427(87)90125-7
Ryšavý, P., and Železný, F. (2017). “Estimating sequence similarity from contig sets,” in Advances in intelligent data analysis XVI (Cham: Springer), 272–283. doi:10.1007/978-3-319-68765-0_23
Saito, Y., Takahashi, O., Arioka, H., and Kobayashi, D. (2017). Associations between body fat variability and later onset of cardiovascular disease risk factors. PLoS One 12, e0175057. doi:10.1371/journal.pone.0175057
Salem, H., Attiya, G., and El-Fishawy, N. (2017). Classification of human cancer diseases by gene expression profiles. Appl. Soft Comput. 50, 124–134. doi:10.1016/j.asoc.2016.11.026
Seok, H. S. (2021). Enhancing performance of gene expression value prediction with cluster-based regression. Genes Genomics 43, 1059–1064. doi:10.1007/s13258-021-01128-6
Shachaf, L. I., Roberts, E., Cahan, P., and Xiao, J. (2023). Gene regulation network inference using k-nearest neighbor-based mutual information estimation: revisiting an old DREAM. BMC Bioinforma. 24, 84. doi:10.1186/s12859-022-05047-5
Shahapure, K. R., and Nicholas, C. (2020). “Cluster quality analysis using silhouette score,” in 2020 IEEE 7th international conference on data science and advanced analytics (DSAA) (IEEE), 747–748. doi:10.1109/DSAA49011.2020.00096
Shahid, A. H., and Singh, M. P. (2020). A deep learning approach for prediction of Parkinson’s disease progression. Biomed. Eng. Lett. 10, 227–239. doi:10.1007/s13534-020-00156-7
Shi, Y., Zhang, L., Peterson, C. B., Do, K. A., and Jenq, R. R. (2022). Performance determinants of unsupervised clustering methods for microbiome data. Microbiome 10, 25. doi:10.1186/s40168-021-01199-3
Shmoish, M., German, A., Devir, N., Hecht, A., Butler, G., Niklasson, A., et al. (2021). Prediction of adult height by machine learning technique. J. Clin. Endocrinol. Metabolism 106, E2700–E2710. doi:10.1210/clinem/dgab093
Singh, N. P., Bapi, R. S., and Vinod, P. K. (2018). Machine learning models to predict the progression from early to late stages of papillary renal cell carcinoma. Comput. Biol. Med. 100, 92–99. doi:10.1016/j.compbiomed.2018.06.030
Steinley, D. (2004). Properties of the hubert-arable adjusted Rand index. Psychol. Methods 9, 386–396. doi:10.1037/1082-989X.9.3.386
Stone, W., Nunes, A., Akiyama, K., Akula, N., Ardau, R., Aubry, J. M., et al. (2021). Prediction of lithium response using genomic data. Sci. Rep. 11, 1155. doi:10.1038/s41598-020-80814-z
Sun, S., Hood, M., Scott, L., Peng, Q., Mukherjee, S., Tung, J., et al. (2017). Differential expression analysis for RNAseq using Poisson mixed models. Nucleic Acids Res. 45, e106. doi:10.1093/nar/gkx204
Syukriani, Y. F., and Hidayat, Y. (2023). Pinpointing the short-tandem repeats alleles for ethnic inferencing in forensic identification by K-medoids approach. J. Forensic Sci. Med. 9, 347–352. doi:10.4103/jfsm.jfsm_36_23
Theodoris, C. V., Xiao, L., Chopra, A., Chaffin, M. D., Al Sayed, Z. R., Hill, M. C., et al. (2023). Transfer learning enables predictions in network biology. Nature 618, 616–624. doi:10.1038/s41586-023-06139-9
Thrun, M. C. (2018). Projection-based clustering through self-organization and swarm intelligence. Wiesbaden: Springer Vieweg. doi:10.1007/978-3-658-20540-9
Tibshirani, R., Walther, G., and Hastie, T. (2001). Estimating the number of clusters in a data set via the gap statistic. J. R. Stat. Soc. Ser. B Stat. Methodol. 63, 411–423. doi:10.1111/1467-9868.00293
Trakadis, Y. J., Sardaar, S., Chen, A., Fulginiti, V., and Krishnan, A. (2019). Machine learning in schizophrenia genomics, a case-control study using 5,090 exomes. Am. J. Med. Genet. Part B Neuropsychiatric Genet. 180, 103–112. doi:10.1002/ajmg.b.32638
Vinh, N. X., Epps, J., and Bailey, J. (2010). “Information theoretic measures for clusterings comparison: variants, properties, normalization and correction for chance. J. Machi. Lear. Resear 11 (95), 2837–2854. doi:10.5555/1756006.1953024
Vokinger, K. N., Feuerriegel, S., and Kesselheim, A. S. (2021). Mitigating bias in machine learning for medicine. Commun. Med. 1, 25. doi:10.1038/s43856-021-00028-w
Wang, D. (2021). The impact of outliers on regression coefficients: a sensitivity analysis. Int. J. Account. 56. doi:10.1142/S1094406021500141
Wang, M., Jiang, W., and Xie, J. (2022). “The differential gene detecting method for identifying leukemia patients,” 137–146. doi:10.1007/978-3-031-08530-7_12
Warrens, M. J., and van der Hoef, H. (2022). Understanding the adjusted Rand index and other partition comparison indices based on counting object pairs. J. Classif. 39, 487–509. doi:10.1007/s00357-022-09413-z
Whig, P., Gupta, K., Jiwani, N., Jupalle, H., Kouser, S., and Alam, N. (2023). A novel method for diabetes classification and prediction with Pycaret. Microsyst. Technol. 29, 1479–1487. doi:10.1007/s00542-023-05473-2
Willmott, C. J., Matsuura, K., and Robeson, S. M. (2009). Ambiguities inherent in sums-of-squares-based error statistics. Atmos. Environ. 43, 749–752. doi:10.1016/j.atmosenv.2008.10.005
Wu, Q., Nasoz, F., Jung, J., Bhattarai, B., Han, M. V., Greenes, R. A., et al. (2021). Machine learning approaches for the prediction of bone mineral density by using genomic and phenotypic data of 5130 older men. Sci. Rep. 11, 4482. doi:10.1038/s41598-021-83828-3
Yang, L., and Shami, A. (2020). On hyperparameter optimization of machine learning algorithms: theory and practice. Neurocomputing 415, 295–316. doi:10.1016/j.neucom.2020.07.061
Yazdani, A., Yazdani, A., and Boerwinkle, E. (2015). Rare variants analysis using penalization methods for whole genome sequence data. BMC Bioinforma. 16, 405. doi:10.1186/s12859-015-0825-4
Yin, L., Cheung, E. F. C., Chen, R. Y. L., Wong, E. H. M., Sham, P. C., and So, H. C. (2018). Leveraging genome-wide association and clinical data in revealing schizophrenia subgroups. J. Psychiatr. Res. 106, 106–117. doi:10.1016/j.jpsychires.2018.09.010
Yu, H., Samuels, D. C., Zhao, Y. yong, and Guo, Y. (2019). Architectures and accuracy of artificial neural network for disease classification from omics data. BMC Genomics 20, 167–212. doi:10.1186/s12864-019-5546-z
Zhang, J., Liu, J., McGillivray, P., Yi, C., Lochovsky, L., Lee, D., et al. (2020). NIMBus: a negative binomial regression based Integrative Method for mutation Burden Analysis. BMC Bioinforma. 21, 474. doi:10.1186/s12859-020-03758-1
Zhang, K., Liu, X., Xu, J., Yuan, J., Cai, W., Chen, T., et al. (2021). Deep-learning models for the detection and incidence prediction of chronic kidney disease and type 2 diabetes from retinal fundus images. Nat. Biomed. Eng. 5, 533–545. doi:10.1038/s41551-021-00745-6
Zhao, K., Grayson, J. M., and Khuri, N. (2023). Multi-objective genetic algorithm for cluster analysis of single-cell transcriptomes. J. Pers. Med. 13, 183. doi:10.3390/jpm13020183
Zhao, S., Sun, J., Shimizu, K., and Kadota, K. (2018). Silhouette scores for arbitrary defined groups in gene expression data and insights into differential expression results. Biol. Proced. Online 20, 5. doi:10.1186/s12575-018-0067-8
Keywords: metrics, machine learning, genomics prediction, clustering, classification, regression, disease prediction
Citation: Miller C, Portlock T, Nyaga DM and O’Sullivan JM (2024) A review of model evaluation metrics for machine learning in genetics and genomics. Front. Bioinform. 4:1457619. doi: 10.3389/fbinf.2024.1457619
Received: 01 July 2024; Accepted: 27 August 2024;
Published: 10 September 2024.
Edited by:
Keith A. Crandall, George Washington University, United StatesReviewed by:
Piyali Basak, Merck (United States), United StatesAli Taheriyoun, George Washington University, United States
Copyright © 2024 Miller, Portlock, Nyaga and O’Sullivan. This is an open-access article distributed under the terms of the Creative Commons Attribution License (CC BY). The use, distribution or reproduction in other forums is permitted, provided the original author(s) and the copyright owner(s) are credited and that the original publication in this journal is cited, in accordance with accepted academic practice. No use, distribution or reproduction is permitted which does not comply with these terms.
*Correspondence: Catriona Miller, Y2F0cmlvbmEubWlsbGVyQGF1Y2tsYW5kLmFjLm56; Justin O’Sullivan, anVzdGluLm9zdWxsaXZhbkBhdWNrbGFuZC5hYy5ueg==