- 1Genome Competence Center (MF1), Robert Koch Institute, Berlin, Germany
- 2Computational Mathematics Division, Department of Mathematics, Stockholm University, Stockholm, Sweden
- 3Faculty of Science of Tunis, University El Manar, Tunis, Tunisia
- 4Department of Computer Science, University of California, Davis, CA, United States
- 5Maurice Wohl Clinical Neuroscience Institute, King’s College London, London, United Kingdom
- 6Human Genome Sequencing Center, Baylor College of Medicine, Houston, TX, United States
- 7DNAnexus, Mountain View, CA, United States
Motivation: For a number of neurological diseases, such as Alzheimer’s disease, amyotrophic lateral sclerosis, and many others, certain genes are known to be involved in the disease mechanism. A common question is whether a structural variant in any such gene may be related to drug response in clinical trials and how this relationship can contribute to the lifecycle of drug development.
Results: To this end, we introduce VariantSurvival, a tool that identifies changes in survival relative to structural variants within target genes. VariantSurvival matches annotated structural variants with genes that are clinically relevant to neurological diseases. A Cox regression model determines the change in survival between the placebo and clinical trial groups with respect to the number of structural variants in the drug target genes. We demonstrate the functionality of our approach with the exemplary case of the SETX gene. VariantSurvival has a user-friendly and lightweight graphical user interface built on the shiny web application package.
1 Introduction
Neurodegenerative disorders, such as Alzheimer’s disease, Parkinson’s disease, and amyotrophic lateral sclerosis, impose a substantial burden on patients, caregivers, and healthcare systems worldwide (GBD, 2019 Dementia Forecasting Collaborators, 2022; Feigin et al., 2020). Despite decades of research, the underlying mechanisms driving disease progression and variability in patient survival remain incompletely understood (Martin et al., 2017; Robinson et al., 2023). Genetic factors have been increasingly recognized as crucial contributors to the pathogenesis and progression of neurodegeneration. Recent advancements in genomic technologies have enabled the identification of various genetic markers, including single-nucleotide variants, copy number variations, and structural variations, that may play significant roles in disease susceptibility, progression, and prognosis (Langbehn et al., 2019; van Rheenen et al., 2021; Al Khleifat et al., 2022).
An accurate evaluation of patient survival is a critical aspect of clinical trials aimed at assessing the efficacy of therapeutic interventions for neurodegenerative diseases. Traditional survival analysis methods, such as Kaplan–Meier curves (Kaplan and Meier, 1958) and Cox proportional hazards models (Cox, 1972; T. M. Therneau and Grambsch, 2000), have been widely used. However, these approaches often overlook the intricate genetic landscape underlying disease heterogeneity, limiting their ability to capture the full extent of genetic influences on patient survival (Willemse et al., 2022). Thus, there is a compelling need for methodologies that integrate genetic markers to enhance the precision and predictive power of survival assessments in neurodegenerative clinical trials.
Structural variations (SVs) are genomic alterations involving large-scale rearrangements, including deletions, duplications, inversions, and translocations. Emerging evidence suggests that SVs can profoundly impact gene expression and disrupt regulatory elements associated with neurodegeneration (Marshall et al., 2008; Lupski et al., 2010; Carvalho and Lupski, 2016; Marshall et al., 2017). Consequently, these genomic alterations hold substantial potential as prognostic indicators of disease progression and survival outcomes in clinical trials. We have previously shown the correlation between structural variants and survival in neurodegenerative diseases such as amyotrophic lateral sclerosis and frontotemporal dementia, highlighting the importance of testing structural variants in clinical trials (Al Khleifat et al., 2022). Understanding the role of SVs in patient survival may unveil novel insights into the complex genetic architecture of neurodegenerative disorders and aid in the identification of treatment-specific patient subgroups.
To support the clinical trial analysis and interpretation of DNA sequencing data, we have developed VariantSurvival, a clinical genetic framework. VariantSurvival uses NGS data and other phenotypic inputs such as age, sex, and other clinical information to evaluate the associations between genomic variants and survival outcomes. The software links multiple genetic information from neurological and psychiatric conditions to known genes in the disease of interest. Users can upload data of genomic structural variants, select from a list of genes, and view the results in the form of survival functions, Cox regression tables, and other visualizations and data tables. VariantSurvival is user-friendly and accessible to clinicians and other users without a background in genetics.
2 Results
We present VariantSurvival, a new R package, to launch a shiny dashboard (Chang and Ribeiro, 2021; Chang et al., 2022) to visualize and summarize genotype–treatment response for selected medical conditions and target genes. The Supplemental Material of this work contains the Methods section, which describes the statistical models, implementation, and usability in detail. Here, we summarize the application and examine a use case.
Our results demonstrate that VariantSurvival effectively accommodates the analysis of non-implicated genes in the context of neurodegenerative diseases. Despite its primary focus on structural variants, the tool yielded meaningful insights into the impact of the selected non-implicated gene on survival outcomes in the chosen disease dataset. This confirms the tool’s flexibility and its potential to uncover previously unrecognized associations between genes and survival, even when those genes are not conventionally linked to the disease under investigation.
2.1 Usage and data input
VariantSurvival requires two types of formatted input: metadata of the clinical trials (patient ID, clinical trial groups, survival status, and time to event) and structural variant information of all individuals participating in the clinical trial.
The set of structural variants across all individuals of the clinical trial is expected to be formatted in the standard variant call format (VCF) and requires gene annotation for each variant. More precisely, VariantSurvival requires a multi-sample VCF file where each variant record is annotated with gene identifiers according to the Ensembl database (Cunningham et al., 2022). For a given target gene selected by the user, VariantSurvival creates a tally summarizing the number of structural variants affecting the target gene for each individual.
The second mandatory input for VariantSurvival is the metadata. Provided that there is a non-empty set of individuals presenting SVs in the target gene, the application proceeds with associating the corresponding clinical trial group labels with all entries (individuals) of the tally. At this point, VariantSurvival computes and visualizes the survival function of Kaplan–Meier product limit estimates (Kaplan and Meier, 1958). Depending on the extent of the provided metadata, the user can select additional features to be used as independent covariates for a Cox regression model that tests whether these features are associated with the time to event.
Further instructions on how to generate and format the input data, test data in order for the user to familiarize themselves with the dashboard, and instructions on how to install the R package and run the application are available at the GitHub repository of VariantSurvival.
2.2 The dashboard interface
The VariantSurvival shiny application is designed as a standalone dashboard. Its functionality is grouped into three primary web browser-like tabs.
2.2.1 Select Target Gene tab
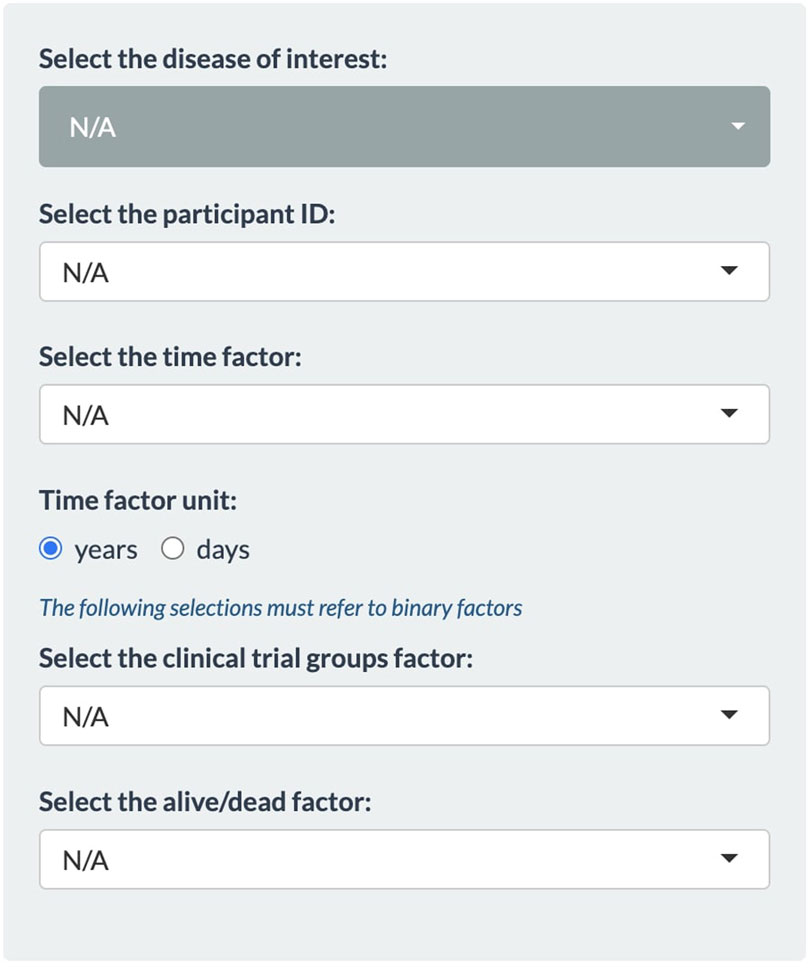
The first tab of the application that is on display by default is Select Target Gene. This tab is primarily designed for user interaction and feature selection from the metadata. On the left panel (Figure 1), the user must select from multiple dropdown menus. The topmost dropdown menu provides a selection of diseases. The initial release of the application is focused on neurodegenerative diseases. The full list of diseases can be found in Section 1.2 of the Supplementary Material. When selecting a disease, the dashboard immediately displays a list of genes that have previously been associated with the disease based on the ClinGen database (Rehm et al., 2015). To continue with an analysis of a certain gene, the user must select the metadata first. This way VariantSurvival can connect the list of genes with a clinical trial group. For the remaining dropdown menus, the user must select the corresponding features from the metadata sheet. Mind that the time factor unit must be set accordingly. The features selected for the trial group factor and dead/alive factor must be binary features in the metadata. An example of feasible features is shown in the section Exemplary case and in the online material.
Once all dropdown menus are set, the Summary panel is filled with data. At the top, a table summarizes the number of patients whose genomes contain SVs in any of the genes associated with the selected neurological condition. A search bar aids the lookup for target genes of interest. At the bottom, the user can select one certain gene of interest associated with the disease. For the selected gene, the panels underneath display quantities, histograms, and sample IDs of patients whose genomes contain SVs in the corresponding gene region. Moreover, a histogram in the Structural Variants Distribution panel shows the quantity of SVs in each patient and treatment group.
2.2.2 Kaplan–Meier tab
The second tab of the dashboard is Kaplan–Meier and displays survival functions according to the Kaplan–Meier product limit estimator (Kaplan and Meier, 1958).
The Kaplan–Meier tab consists of two data panels. The Null model panel shows the survival function of all data points, presenting a baseline survival probability over time. The Multiple model panel shows the data separated by the treatment group and the presence or absence of structural variants in the patients’ target gene.
The small red cogwheel in the top left corner, visible only on the Multiple model panel, provides additional settings to fine-tune data visualization. For instance, the user can constrain the minimum or maximum number of observed variants in a target gene, add confidence intervals, or display a risk table that summarizes the counts of each individual group. Below the plot window, the user can also inspect the life table, listing all numeric values corresponding to the function graphs in detail. The life table is separated into two panels: one for the group of patients with SVs and one for the group of patients without SVs in the target gene.
2.2.3 Cox regression tab
The third tab of the dashboard is Cox regression. In this tab, the user can select numerical and categorical covariates for a Cox proportional hazards model (Cox, 1972). Subsequently, its effect parameters are estimated, and the hazard ratio is reported for every selected covariate. Similar to the Kaplan–Meier product limit estimates, the results are listed and separated into a Standard model and a Multiple model using all patient data or the data are separated by the presence or absence of structural variants in the patients’ target gene. Section 1.1 of the Supplementary Material contains a mathematical description of the SV aware of the Cox proportional hazards model.
2.3 Exemplary case
To demonstrate the functionality and usability of VariantSurvival, we present an exemplary case of investigating one specific target gene in a cohort of anonymized clinical samples. The participants in the clinical trial are separated into a placebo group and treatment group, where the members of each group were either not exposed to a drug treatment or received the drug, respectively. DNA samples from all patients in the study were extracted and sequenced using an Illumina NGS assay. A genomic dataset of paired-end short-read WGS data was provided for each patient. For each genomic dataset in this case study, we generated a set of predicted SVs, detected using the Illumina ExpansionHunter tool (Dolzhenko et al., 2017). In addition, all individual sets of SVs were merged into one joint set of SVs of the entire cohort. Each structural variant in the joint set of SVs is annotated with Ensembl gene identifiers if it matches a corresponding gene region. The online material of VariantSurvival contains documentation on how to replicate this data preparation.
In our case, we investigated the SETX gene, e.g., as found in association with motor neurone disease (Al Khleifat et al., 2022) or the Charcot–Marie–Tooth syndrome (Yoshimura et al., 2019). It should be emphasized that a gene associated with risk does not necessarily imply an effect on survival. First, all the dropdown menus in the Select Target Gene tab are set (Figure 2). We select the Charcot–Marie–Tooth syndrome and select the feature “patient_ID” from the metadata sheets as participant ID. The time factor for the Kaplan–Meier product limit estimator is selected as the “time to death or last follow-up in years” from the metadata features. The time factor unit is set to years accordingly. The binary metadata features “Phenotype” and “survival.status_bin” are selected for the clinical trial group factor and alive/dead factor, respectively.
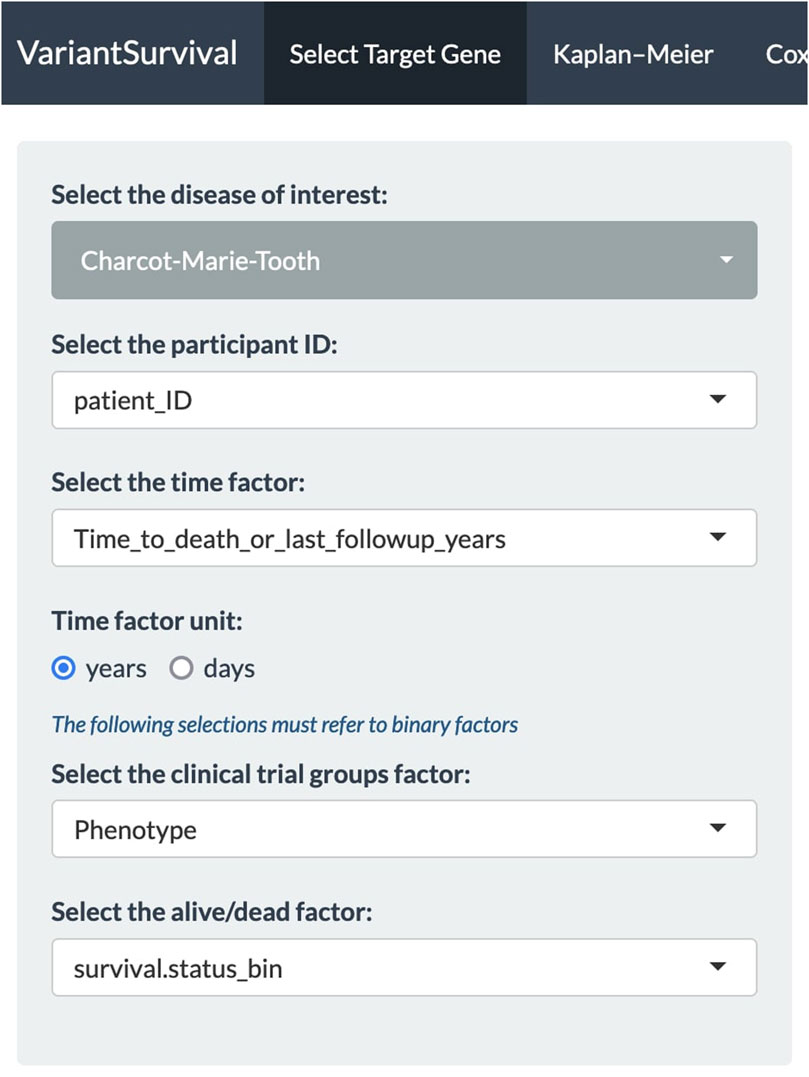
FIGURE 2. Panel of dropdown menus with selected features to investigate the Charcot–Marie–Tooth syndrome.
With all the dropdown menus properly set, the Select Target Gene tab displays a table of associated biomarkers. From the column of gene symbols, we can choose and focus on one gene and select it in the dropdown menu below. In this exemplary case, the SETX gene is selected (Figure 3). The information summary reports 43 participants from the clinical trial that carry a variant allele in the SETX gene, including seven participants from the placebo group and 36 participants from the treatment group.
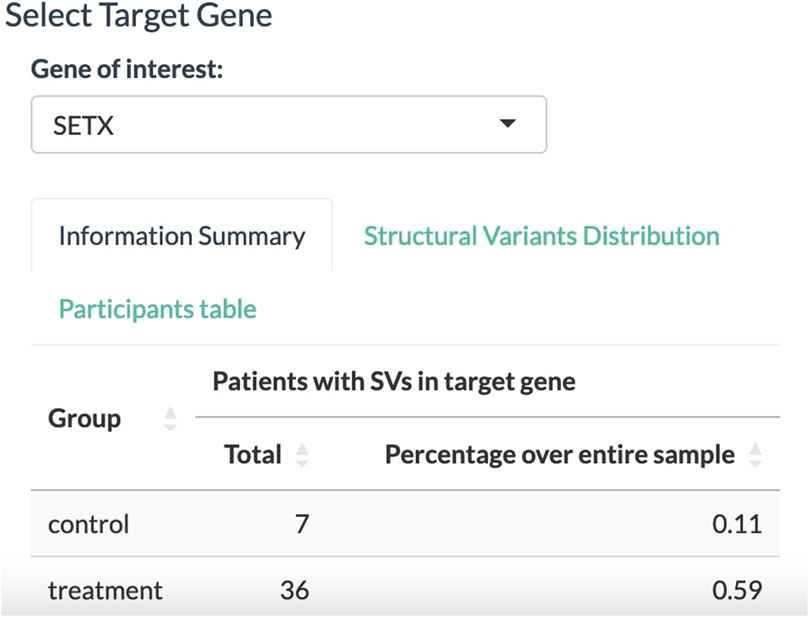
FIGURE 3. Select Target Gene panel to select a gene associated with the disease of interest. The tally displays the absolute number and relative proportion of participants affected by SVs in the target gene for the placebo and treatment groups.
In the Structural Variants Distribution panel (Figure 4), the dashboard displays a histogram with the number of patients for each SV found in the SETX gene. Here, 36 out of 50 participants in the treatment group have at least three SVs in the SETX gene.
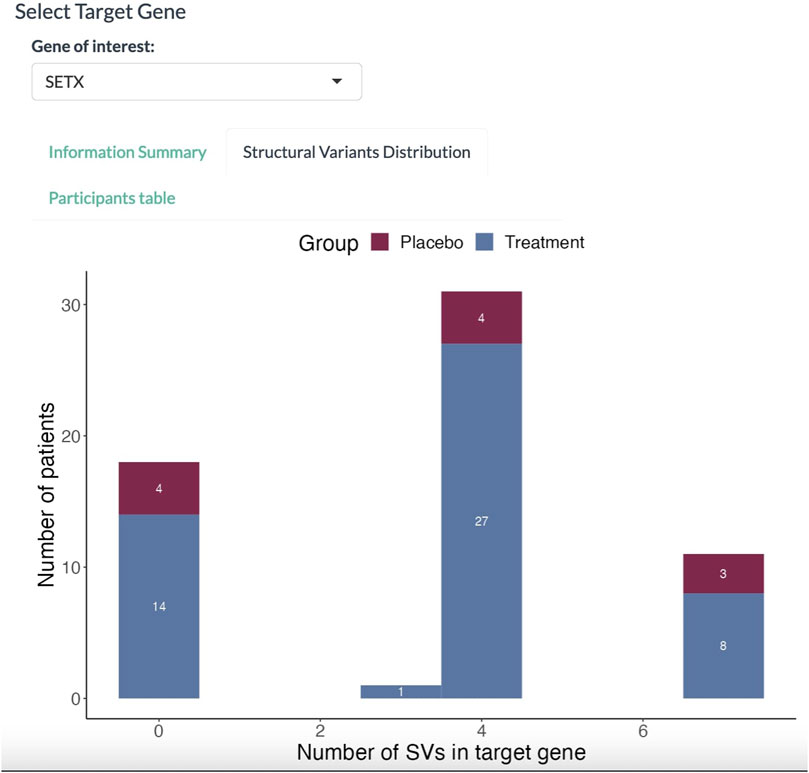
FIGURE 4. Histogram of participants affected with SVs. The abscissa denotes the number of SVs in the target gene. The proportion in red denotes the placebo group; the proportion in blue denotes the treatment group.
The second tab of the dashboard, i.e., Kaplan–Meier, displays the survival functions (Figure 5). For both the placebo and treatment groups, two survival functions are computed for the subgroups of participants as either carrying or not carrying SVs in the selected SETX gene. The graphs indicate two factors of longevity according to the clinical trial data. First, from the participants of the placebo group who were affected by SVs in the target gene, none survived longer than 5 years after their medical condition was reported. In contrast, the corresponding treatment group contains participants (three as listed in the table) surviving longer than 5 years. Second, participants in the placebo group that are not affected by SVs in the target gene have a higher survival probability of more than 5 years after the condition was reported than the participants in the placebo group affected by SVs in the target gene. Moreover, a minor drop in treatment efficiency can be observed between the treatment groups. Altogether, the observations from the data indicate a positive response to treatment compared to the baseline placebo effect as well as an obtrusive effect of SVs in the target gene on the response to treatment.

FIGURE 5. Survival functions according to the Kaplan–Meier product limit estimates. The four functions represent participants of the placebo group not affected by SVs in the target gene (pink), participants of the placebo group affected by SVs (teal), participants of the treatment group not affected by SVs (purple), and participants of the treatment group affected by SVs (blue).
With the Cox regression tab, we can investigate the impact of the selected features on survival. Here, we investigate whether the age at onset is an explanatory numerical covariate. As shown in Figure 6, the age at onset has a hazard ratio of 1.02 in the group of participants with SVs affecting the target gene. For a continuous covariate, the hazard ratio indicates the change in the risk of death with a change in the reference unit by 1 (Zwiener et al., 2011). Here, the reference unit is time in years, i.e., an increase by 1 year in age at onset increases the risk of death by two percent.
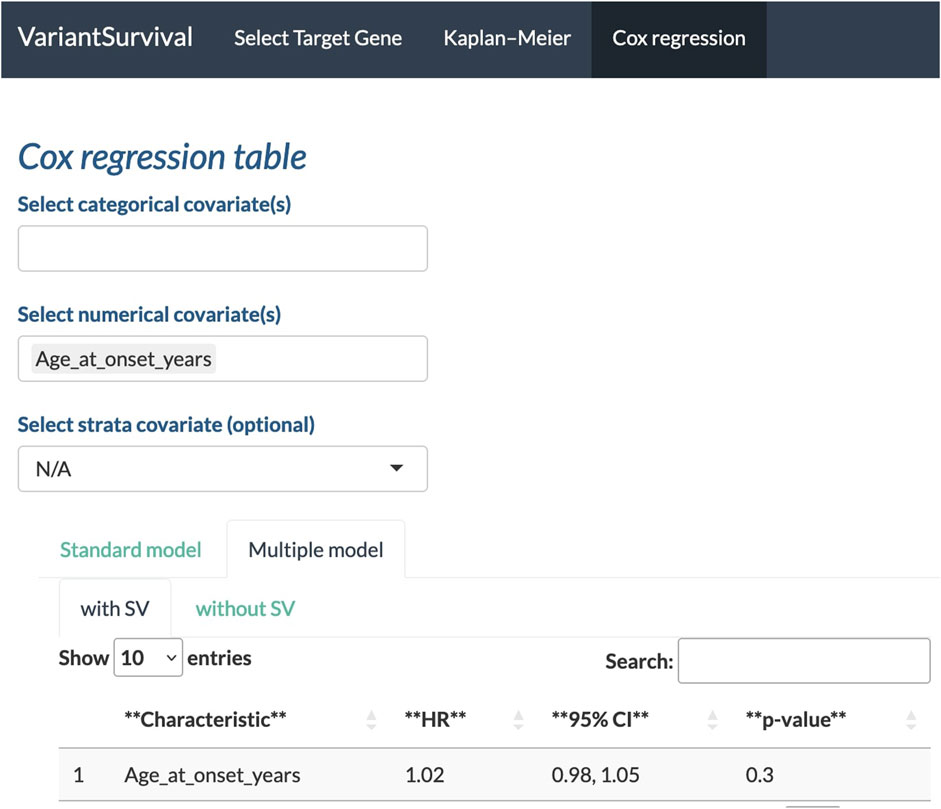
FIGURE 6. Age at onset in years selected as a feature to determine the Cox proportional hazards ratio.
It is important to mention that this particular exemplary case is presented on simulated data (Gaastra et al., 2016) to solely demonstrate the functionality of VariantSurvival. The treatment groups of participants were assigned to simulate a successful clinical trial. The numbers, figures, and data shown in this section should not be used for medical recommendations or decision-making.
3 Discussion
3.1 Summary
VariantSurvival is a lightweight and user-friendly dashboard that allows the exploration of the prognostic potential of genes and gene sets in a broad range of neurological conditions. This will assist in developing markers to predict treatment response in clinical trials that might lead to the identification of specific treatment groups.
The ability of VariantSurvival to assess the effects of non-implicated genes on survival outcomes in neurodegenerative diseases highlights its adaptability and broader utility. Researchers can use the tool to explore novel gene–survival relationships, potentially leading to new insights and hypotheses in the field of neurodegenerative research. This versatility makes VariantSurvival a valuable resource, not only for studying structural variants but also for investigating various gene contributions to survival in diverse disease contexts.
3.2 Limitations
The current version (v0.1.1) of the application is limited to neurodegenerative diseases. Furthermore, the dashboard is currently designed and tailored to solely process large genomic structural variants from input data.
3.3 Outlook
Future directions for the extension of VariantSurvival include the support for additional types of variants (SNVs and indels) and omics data (methylation assay, RNA data, and the retrovirus database (Pačes et al., 2002)). Furthermore, our aim is to extend the scope of VariantSurvival to address other types of medical conditions (cancer, psychological disorders, etc.). Together with an extended spectrum of medical conditions, we aim to automate the updates of target gene lists and to move on from manual batch updates.
Data availability statement
The original contributions presented in the study are included in the article/Supplementary Material; further inquiries can be directed to the corresponding author.
Ethics statement
The studies involving human participants were reviewed and approved by the Research Ethics Board at each respective recruiting site within the Project MinE consortium as previously described (van Rheenen et al., 2018). The studies were conducted in accordance with the local legislation and institutional requirements. The participants provided their written informed consent to participate in this study.
Author contributions
TK: formal analysis, investigation, methodology, software, writing–original draft, and writing–review and editing. MSa: data curation, formal analysis, methodology, software, and writing–original draft. HB: formal analysis, investigation, methodology, and writing–original draft. MSh: data curation, formal analysis, investigation, methodology, software, and writing–original draft. AI: writing–review and editing. AA-C: resources and writing–review and editing. FS: funding acquisition, resources, supervision, and writing–review and editing. BB: funding acquisition, resources, supervision, and writing–review and editing. AA: conceptualization, data curation, formal analysis, funding acquisition, methodology, software, supervision, and writing–review and editing.
Funding
The author(s) declare that financial support was received for the research, authorship, and/or publication of this article. AA was funded by the ALS Association Milton Safenowitz Research Fellowship (grant number 22-PDF-609; DOI: 10.52546/pc.gr.150909), the Motor Neurone Disease Association (MNDA) Fellowship (AK/Oct21/975-799), the Darby Rimmer Foundation, and the NIHR Maudsley Biomedical Research Centre. This project was also funded by the MND Association and the Wellcome Trust. This is an EU Joint Programme—Neurodegenerative Disease Research (JPND) project. The project was supported through the following funding organizations under the aegis of JPND—www.jpnd.eu (the United Kingdom Medical Research Council (MR/L501529/1 and MR/R024804/1) and the Economic and Social Research Council (ES/L008238/1)). AA-C was a NIHR Senior Investigator. CS and AA-C received salary support from the National Institute for Health Research (NIHR) Dementia Biomedical Research Unit at South London and the Maudsley NHS Foundation Trust and King’s College London. The work leading up to this publication was funded by the European Community’s Health Seventh Framework Program (FP7/2007–2013; grant agreement number 259867) and the Horizon 2020 Programme (H2020-PHC-2014-two-stage; grant agreement number 633413).
Acknowledgments
The authors thank the Baylor College of Medicine, DNAnexus, PacBio, Nanopore, and Rice University for hosting and sponsoring the Pan-Structural Variation Hackathon. They also thank the NCBI for co-advertising and the involvement of personnel. The samples used in this research were obtained from the UK National DNA Bank for MND Research, funded by the MND Association and the Wellcome Trust. They thank MND patients and their families for their participation in this project. They also acknowledge the sample management undertaken by Biobanking Solutions funded by the Medical Research Council at the Centre for Integrated Genomic Medical Research, The University of Manchester.
Conflict of interest
Author BB was employed by the company DNAnexus.
The remaining authors declare that the research was conducted in the absence of any commercial or financial relationships that could be construed as a potential conflict of interest.
Publisher’s note
All claims expressed in this article are solely those of the authors and do not necessarily represent those of their affiliated organizations, or those of the publisher, the editors, and the reviewers. Any product that may be evaluated in this article, or claim that may be made by its manufacturer, is not guaranteed or endorsed by the publisher.
Supplementary material
The Supplementary Material for this article can be found online at: https://www.frontiersin.org/articles/10.3389/fbinf.2023.1277923/full#supplementary-material
References
Al Khleifat, A., Iacoangeli, A., van Vugt, J. J. F. A., Bowles, H., Zwamborn, R. A. J., Moisse, M., et al. (2022). Structural variation analysis of 6,500 whole genome sequences in amyotrophic lateral sclerosis. Npj Genomic Med. 7 (1), 8. doi:10.1038/s41525-021-00267-9
Carvalho, C. M. B., and Lupski, J. R. (2016). Mechanisms underlying structural variant formation in genomic disorders. Nat. Rev. Genet. 17 (4), 224–238. doi:10.1038/nrg.2015.25
Chang, W., Cheng, J., Allaire, J. J., Sievert, C., Schloerke, B., Xie, Y., et al. (2022). shiny: web Application Framework for R.
Cox, D. R. (1972). Regression models and life-tables. J. R. Stat. Soc. Ser. B Methodol. 34 (2), 187–202. doi:10.1111/j.2517-6161.1972.tb00899.x
Cunningham, F., Allen, J. E., Allen, J., Alvarez-Jarreta, J., Amode, M. R., Armean, I. M., et al. (2022). Ensembl 2022. Nucleic Acids Res. 50 (D1), D988–D995. doi:10.1093/nar/gkab1049
Dolzhenko, E., Vugt, J. J. F. A. v., Shaw, R. J., Bekritsky, M. A., Blitterswijk, M. v., Narzisi, G., et al. (2017). Detection of long repeat expansions from PCR-free whole-genome sequence data. Genome Res. 27 (11), 1895–1903. doi:10.1101/gr.225672.117
Feigin, V. L., Vos, T., Nichols, E., Owolabi, M. O., Carroll, W. M., Dichgans, M., et al. (2020). The global burden of neurological disorders: translating evidence into policy. Neurology 19 (3), 255–265. doi:10.1016/S1474-4422(19)30411-9
Gaastra, B., Shatunov, A., Pulit, S., Jones, A. R., Sproviero, W., Gillett, A., et al. (2016). Rare genetic variation in UNC13A may modify survival in amyotrophic lateral sclerosis. Amyotroph. Lateral Scler. Frontotemporal Degener. 17 (7–8), 593–599. doi:10.1080/21678421.2016.1213852
GBD2019 Dementia Forecasting Collaborators Steinmetz, J. D., Vollset, S. E., Fukutaki, K., Chalek, J., Abd-Allah, F., et al. (2022). Estimation of the global prevalence of dementia in 2019 and forecasted prevalence in 2050: an analysis for the global burden of disease study 2019. Lancet Public Health 7 (2), e105–e125. doi:10.1016/S2468-2667(21)00249-8
Kaplan, E. L., and Meier, P. (1958). Nonparametric estimation from incomplete observations. J. Am. Stat. Assoc. 53 (282), 457–481. doi:10.1080/01621459.1958.10501452
Langbehn, D. R., Stout, J. C., Gregory, S., Mills, J. A., Durr, A., Leavitt, B. R., et al. TRACK-HD and Track-On HD Groups (2019). Association of CAG repeats with long-term progression in huntington disease. JAMA Neurol. 76 (11), 1375–1385. doi:10.1001/jamaneurol.2019.2368
Lupski, J. R., Reid, J. G., Gonzaga-Jauregui, C., Rio Deiros, D., Chen, D. C. Y., Nazareth, L., et al. (2010). Whole-genome sequencing in a patient with Charcot-Marie-Tooth neuropathy. N. Engl. J. Med. 362 (13), 1181–1191. doi:10.1056/NEJMoa0908094
Marshall, C. R., Howrigan, D. P., Merico, D., Thiruvahindrapuram, B., Wu, W., Greer, D. S., Antaki, D., Shetty, A., Holmans, P. A., Pinto, D., Gujral, M., Brandler, W. M., Malhotra, D., Wang, Z., Fajarado, K. V. F., Maile, M. S., Ripke, S., Agartz, I., Albus, M., et al. CNV and Schizophrenia Working Groups of the Psychiatric Genomics Consortium (2017). Contribution of copy number variants to schizophrenia from a genome-wide study of 41,321 subjects. Nat. Genet. 49 (1), 27–35. doi:10.1038/ng.3725
Marshall, C. R., Noor, A., Vincent, J. B., Lionel, A. C., Feuk, L., Skaug, J., et al. (2008). Structural variation of chromosomes in autism spectrum disorder. Am. J. Hum. Genet. 82 (2), 477–488. doi:10.1016/j.ajhg.2007.12.009
Martin, S., Al Khleifat, A., and Al-Chalabi, A. (2017). What causes amyotrophic lateral sclerosis? F1000Res 6, 371. doi:10.12688/f1000research.10476.1
Pačes, J., Pavlíček, A., and Pačes, V. (2002). HERVd: database of human endogenous retroviruses. Nucleic Acids Res. 30 (1), 205–206. doi:10.1093/nar/30.1.205
Rehm, H. L., Berg, J. S., Brooks, L. D., Bustamante, C. D., Evans, J. P., Landrum, M. J., et al. (2015). ClinGen the clinical genome resource. N. Engl. J. Med. 372 (23), 2235–2242. doi:10.1056/NEJMsr1406261
Robinson, J. L., Xie, S. X., Baer, D. R., Suh, E., Van Deerlin, V. M., Loh, N. J., et al. (2023). Pathological combinations in neurodegenerative disease are heterogeneous and disease-associated. Brain A J. Neurology 146 (6), 2557–2569. doi:10.1093/brain/awad059
Therneau, T. M., and Grambsch, P. M. (2000). Modeling survival data: Extending the Cox model. Springer.
van Rheenen, W., van der Spek, R. A. A., Bakker, M. K., van Vugt, J. J. F. A., Hop, P. J., Zwamborn, R. A. J., et al. (2021). Common and rare variant association analyses in amyotrophic lateral sclerosis identify 15 risk loci with distinct genetic architectures and neuron-specific biology. Nat. Genet. 53 (12), 1636–1648. doi:10.1038/s41588-021-00973-1
Wickham, H. (2016). ggplot2: Elegant graphics for data analysis. Springer-Verlag New York. https://ggplot2.tidyverse.org.
Willemse, S. W., Roes, K. C. B., Van Damme, P., Hardiman, O., Ingre, C., Povedano, M., et al. (2022). Lithium carbonate in amyotrophic lateral sclerosis patients homozygous for the C-allele at SNP rs12608932 in UNC13A: protocol for a confirmatory, randomized, group-sequential, event-driven, double-blind, placebo-controlled trial. Trials 23 (1), 978. doi:10.1186/s13063-022-06906-5
Yoshimura, A., Yuan, J. H., Hashiguchi, A., Ando, M., Higuchi, Y., Nakamura, T., et al. (2019). Genetic profile and onset features of 1005 patients with Charcot-Marie-Tooth disease in Japan. J. Neurol Neurosurg Psychiatry 90 (2), 195–202. doi:10.1136/jnnp-2018-318839
Keywords: structural variants, survival analysis, clinical trials, personalized medicine, Kaplan–Meier, Cox regression, R shiny
Citation: Krannich T, Sarrias MH, Ben Aribi H, Shokrof M, Iacoangeli A, Al-Chalabi A, Sedlazeck FJ, Busby B and Al Khleifat A (2023) VariantSurvival: a tool to identify genotype–treatment response. Front. Bioinform. 3:1277923. doi: 10.3389/fbinf.2023.1277923
Received: 15 August 2023; Accepted: 22 September 2023;
Published: 11 October 2023.
Edited by:
Dario Pescini, University of Milano-Bicocca, ItalyReviewed by:
Alberto Brusati, Italian Auxological Institute (IRCCS), ItalyJan Zaucha, AstraZeneca Computational Pathology GmbH, Germany
Copyright © 2023 Krannich, Sarrias, Ben Aribi, Shokrof, Iacoangeli, Al-Chalabi, Sedlazeck, Busby and Al Khleifat. This is an open-access article distributed under the terms of the Creative Commons Attribution License (CC BY). The use, distribution or reproduction in other forums is permitted, provided the original author(s) and the copyright owner(s) are credited and that the original publication in this journal is cited, in accordance with accepted academic practice. No use, distribution or reproduction is permitted which does not comply with these terms.
*Correspondence: Ahmad Al Khleifat, YWhtYWQuYWxfa2hsZWlmYXRAa2NsLmFjLnVr
†These authors have contributed equally to this work and share first authorship
 Thomas Krannich
 Marina Herrera Sarrias2†
 Hiba Ben Aribi
 Moustafa Shokrof
 Alfredo Iacoangeli
 Ammar Al-Chalabi
 Fritz J. Sedlazeck
 Ahmad Al Khleifat