 Cagla Kettner
 Bernd Stetter
 Thorsten Stein
- 1BioMotion Center, Institute of Sports and Sports Science, Karlsruhe Institute of Technology (KIT), Karlsruhe, Germany
- 2Sports Orthopedics, Institute of Sports and Sports Science, Karlsruhe Institute of Technology (KIT), Karlsruhe, Germany
The footwear market contains a wide variety of running shoe solutions aiming at optimizing performance and minimizing injuries. Stack height is one of the most highly discussed design features of running shoes, but its effects are not yet well understood. This study investigated the effects of different shoes differing mainly in their stack heights (High: 50 mm, Medium: 35 mm and Low: 27 mm) on running style and stability during treadmill running at 10 and 15 km/h. A total of 17 healthy experienced runners participated. The kinematic data were recorded with a 3D motion capturing system. The running style was investigated with duty factor (DF) and leg length normalized to step frequency (SFnorm). Additionally, the ratio of landing to take-off duration, the lower body joint angle time series in the sagittal and frontal planes, the vertical center of mass oscillation (COMosc), and the stiffness parameters (kver and kleg) were compared for different conditions. The stability was analyzed using linear (i.e., discrete frontal ankle parameters) and nonlinear methods (i.e., Maximum Lyapunov Exponent for local dynamic stability of head, trunk, hip, and foot, and detrended fluctuation analysis of stride time). High resulted in longer ground contact relative to stride time (i.e., DF) compared to Low. The higher the stack height, the higher was the COMosc. Furthermore, High led to a longer foot eversion during stance compared to Medium. In addition, the local dynamic stability of the hip decreased with High in comparison with Low. The higher stack heights (≥35 mm) led to a lower SFnorm at 15 km/h but not at 10 km/h. The remaining shoe effects were independent of running speed. Findings showed that changes in stack height can affect running style. Furthermore, the highest stack height resulted in changes related with instabilities (i.e., longer foot eversion and lower hip dynamic stability) which may be a critical issue in terms of injuries and performance. However, this study did not include joint load analysis or running performance measures such as VO2. Future studies may benefit from combination of analysis approaches to better understand stack height effects on running injuries and performance.
1 Introduction
The footwear market is flooded with running shoe solutions that combine various features, such as midsole stiffness, shape of toe box, stack height and heel-to-toe drop. Ultimately, running shoes should be optimized to help improve running performance as well as avoid injuries (Hoitz et al., 2020; Mai et al., 2023). Despite a high number of studies, there is still an ongoing debate on what effects different shoe features have on running performance and injuries (Burns and Tam, 2020; Willwacher and Weir, 2023). On this basis, it is crucial to evaluate the effects of different shoe features in detail to understand their biomechanical function (Mai et al., 2023).
Stack height, or the thickness of the sole, is a highly discussed feature of running shoes, especially since it is limited by the World Athletics Regulations (World Athletic Council, 2022). According to the World Athletic Shoe Regulations (approved on the 22.12.2021 and effective from 01.01.2022), the thickness of a shoe sole cannot be greater than 40 mm for none-spikes shoes. The measurements are done at the center of the forefoot and heel, which are located at 12% and 75% of the internal length of a shoe, respectively. This regulation was introduced to avoid the possible performance benefits by use of advanced footwear technologies (Burns and Tam, 2020; Ruiz-Alias et al., 2023a). However, the actual effects of stack height on running performance and injuries are not yet well understood (Barrons et al., 2023a; 2023b; Hoogkamer, 2020; Ruiz-Alias et al., 2023a; Ruiz-Alias et al., 2023b; Willwacher and Weir, 2023). Various studies reported that increased stack height may lead to performance increases, particularly due to elongated effective leg length (e.g., Burns and Tam, 2020; Ruiz-Alias et al., 2023a). An increase in effective leg length can lead to an increase in stride length, which may ultimately help to increase running speed and finish a race faster (Burns and Tam, 2020). However, there are also studies suggesting that stack height changes alone cannot be sufficient to increase running performance (Bertschy et al., 2023). Furthermore, the added mass due to a higher stack height may also impair performance by decreasing economy (Burns and Tam, 2020; Hoogkamer, 2020). Besides the running economy perspective, higher stack heights may also decrease ankle frontal plane stability (e.g., Hoogkamer, 2020; Ruiz-Alias et al., 2023a), which may be a critical issue in terms of running performance and injuries. With respect to stack height, optimum levels possibly exist for certain conditions (e.g., running speed, stiffness of the ground material, etc.). However, there is still no clear consensus on where the optimum is and how to determine it (Hoogkamer, 2020). One reason for this may be that the combined effects of individual features are difficult to decompose (Burns and Tam, 2020). For example, even if only stack height is increased, the amount of material increases, and inevitably the mass also increases. Another challenge is the non-standardized measurement and reporting protocols both with respect to the shoes (e.g., measurement of the stack height or reporting the shoe features) and study design (e.g., self-selected speed instead of a fixed one) that make the results difficult to compare (Frederick, 2020; Hannigan and Pollard, 2020).
Running style, defined as the “visually distinguishable movement pattern of a runner” (van Oeveren et al., 2021) was suggested to be important in terms of running performance as well as injuries (Barnes and Kilding, 2015; Floría et al., 2024; Folland et al., 2017; Mann et al., 2015; Nijs et al., 2022; Saunders et al., 2004). In a synthesis paper on the biomechanics of running and running styles, step frequency normalized to leg length (SFnorm) and duty factor (DF) were proposed as sufficient to provide an overview of a running style (van Oeveren et al., 2021). However, while spatiotemporal characteristics provide fundamental information on running style, they may still not be enough to understand it completely. For example, TenBroek et al. (2014) focused on various discrete joint angle variables and showed that running style changed when wearing shoes with different stack heights. In addition, a recent study (Koegel et al., 2024) aimed to investigate individual biomechanical running responses and clustered runners into three groups with distinct running patterns. Their study showed that leg stiffness (kleg) and vertical center of mass oscillation (COMosc) contributed most to the clustering. This finding underlined the distinguishing characteristic of these variables (Koegel et al., 2024). Additionally, a decreased COMosc was associated with a better running economy (Folland et al., 2017). The studies focusing mainly on the effects of shoe stack height during running reported that a higher stack height may increase the effective leg length, therefore increase the step length as well as stance time (Burns and Tam, 2020; TenBroek et al., 2014); but a comprehensive analysis with respect to running style has not yet been conducted. Furthermore, while stiffness and center of mass (COM) movement changes due to different shoes have been analyzed in a few studies (Chambon et al., 2014; Kulmala et al., 2018), none focused on stack height, especially on the higher height (i.e., ≥35 mm). Further data here may help to improve understanding of stack height effects. More concretely, Kulmala et al. (2018) compared two different running shoes which differed in multiple features and showed that high cushioning shoes increase impact loading especially at a higher speed. Chambon et al. (2014) analyzed running shoes with stack heights only up to 16 mm and found increased stance time with increasing stack height but no effects on ground reaction force or tibial acceleration. Consequently, there still exists a research gap in the study of higher stack heights in relation to running style.
In addition to running style, running stability is a commonly discussed issue, as it is crucial in terms of running performance as well as injuries (Barrons et al., 2023a; Bruijn et al., 2013; Frank et al., 2019; Hoenig et al., 2019; Promsri et al., 2024; Schütte et al., 2018), especially with respect to stack height (Barrons et al., 2023a; Esculier et al., 2015). In dynamic systems, stability is defined as the ability to compensate for perturbations (Strogatz, 2015). In the context of running, stability can be defined as the ability to maintain functional running movement (e.g., without falls) despite the presence of perturbations (e.g., fatigue or different shoes (Frank et al., 2019; Schütte et al., 2018)). Stability can be subdivided into orbital, local and global stability in the context of running (Dingwell and Kang, 2007), although several studies overlooked this distinguishment. A gait pattern can be locally unstable but still maintain orbital or global stability (Riva et al., 2013; Santuz et al., 2020a).
Maximum Lyapunov Exponent (MLE), which is a nonlinear method, has often been applied to operationalize the local dynamic stability of body regions or joint angles in running studies (Winter et al., 2024). It was shown that expertise level, running speed and fatigue affect local stability (Frank et al., 2019; Hoenig et al., 2019; Mehdizadeh et al., 2014). Another study on the effects of the shoe on stability showed that minimalist shoes did not differ from traditional shoes, but higher stack heights were not investigated (Frank et al., 2019). Another approach is to analyze the stability of a more global variable (i.e., stride interval) by looking into their long-range correlations using detrended fluctuation analysis (DFA) (Agresta et al., 2019; Hausdorff et al., 1996). The rationale behind this approach is that the inherent variability in gait data is not a random fluctuation but is a part of long-range power-law correlations. From a practical point of view, it means that the fluctuations in strides are related to variations in much earlier strides (Hausdorff et al., 1996). An increase in these long-range correlations [e.g., due to manipulations in footwear or foot strike patterns (Fuller et al., 2016)] is interpreted as a decreased ability to adapt running strides to a changed external condition, and therefore a reduced global stability (Agresta et al., 2019; Jordan et al., 2006).
Besides MLE and DFA, linear approaches have been used in various studies to operationalize the stability - particularly based on the movement of the ankle joint in the frontal plane (Barrons et al., 2023a; Isherwood et al., 2021). Thereby, discrete variables such as peak eversion/inversion foot angle or total eversion duration during stance are used to operationalize ankle stability or to assess the risk of running-related injuries (Barrons et al., 2023a; 2024; Becker et al., 2017; 2018; Hannigan and Pollard, 2020; Isherwood et al., 2021; Kuhman et al., 2016; TenBroek et al., 2014). For example, Barrons and colleagues (2023a) reported a higher peak eversion angle for recreational runners with a higher stack height (45 mm vs. 35 mm), which was interpreted as a lower local stability of ankle. Since the studies analyzing stability mostly focus on one analysis approach [e.g., either linear (Law et al., 2019) or nonlinear analysis (Frank et al., 2019)], it becomes difficult to build a comprehensive understanding which combines results from different analysis approaches.
Addressing the above-mentioned research gaps, this study investigated the effects of shoes with different stack heights on running style and stability during level running at different speeds. It was hypothesized that the shoes with higher stack heights (≥35 mm) lead to changes in running style (H1) and reduced stability (H2). Additionally, it was expected that a higher running speed (i.e. 15 km/h) leads to more pronounced changes compared to a lower speed condition (i.e. 10 km/h) (H3).
2 Materials and methods
2.1 Participants
Seventeen experienced healthy male runners participated in this study (age: 25.7 ± 3.9 years, height: 1.77 ± 0.04 m, mass: 68.1 ± 6.0 kg, shoe size: EU 42-43, running activity per week: 4.2 ± 1.8 days and 33.7 ± 22.4 km). All participants provided written informed consent prior to the measurements. The study was approved by the ethics committee of the Karlsruhe Institute of Technology (KIT).
2.2 Experimental protocol
The measurements were conducted on a treadmill (h/p/cosmos Saturn, Nussdorf-Traunstein, Germany). The experimental protocol began with a warm-up and familiarization to the treadmill and three slope conditions (0%, −10% and 10%) by running at self-selected speed with their own shoes for 5 min in total (Paquette et al., 2024). This study focuses only on the 0% condition. Then, the measurement blocks were repeated for three running shoes with different stack heights tested in this study (High: 50 mm, Medium: 35 mm and Low: 27 mm, measured at the heel, US men size 9) in a parallelized order (Table 1; Figure 1). High and Medium were made out of the same materials and included curved carbon infused rods (Barrons et al., 2023a) but Low had only TORSIONRODS to increase force transfer (Adidas Adizero RC4). For each shoe condition, the protocol began with a familiarization to the current shoes by running at self-selected speed for 3 min and walking at 5 km/h for 2 min in the level condition (0%) (Paquette et al., 2024). Afterwards, a total of six running trials with different slope and speed conditions were performed. For each slope condition, first the slow than the fast running condition was performed. For the 0% condition, 10 km/h and 15 km/h were chosen based on the test measurements and previous studies (Fadillioglu et al., 2022; Kulmala et al., 2018; Selvakumar et al., 2023). Each of the six running trials lasted 90 s. Before each trial the participants ran for 25–40 s until the treadmill reached the target speed. There were 1 min walking breaks between the slow and fast running conditions and a 2 min standing break between the slope conditions to prevent exhaustion. A Borg scale (Borg, 1998) was used before each running trial to control the exhaustion level (i.e., the next trial did not begin unless the Borg score was <12 on a 6–20 scale). After each pair of shoes, a visual analogue scaled comfort questionnaire for the stability, cushioning and comfort in a range of 0%–100% (from low to high) was collected (Fadillioglu et al., 2024).
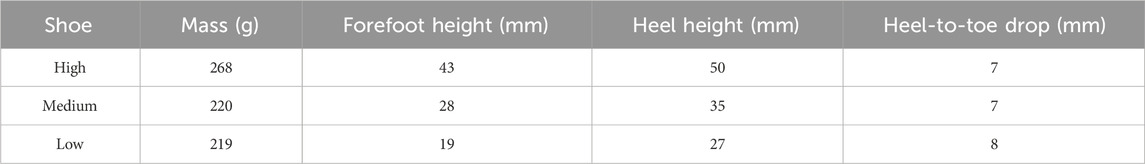
Table 1. Features of the tested running shoes.
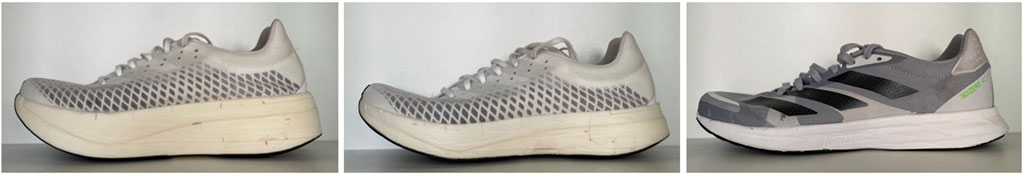
Figure 1. The tested shoes. On the left side High, in the middle Medium and on the right side Low.
2.3 Data acquisition, data processing and biomechanical modelling
A 3D motion capture system (Vicon Motion Systems; Oxford Metrics Group, Oxford, UK; 200 Hz) with 65 reflective markers was used to capture full body kinematics. Raw kinematic data were processed offline with Vicon Nexus V2.12 to reconstruct the 3D coordinates of the markers. Further data processing was performed in MATLAB (2023a, MathWorks Inc., Natick, United States). Marker data were filtered using a low pass Butterworth filter (fourth order, cut-off frequency 10 Hz (Gullstrand et al., 2009). A full-body model (modified version of the OpenSim Hamner Running Model (Delp et al., 2007; Hamner et al., 2010) was used to calculate joint kinematics using the OpenSim. The model was iteratively scaled for each subject separately until the maximum marker error was less than 2 cm and the root mean square error less than 1 cm. The weights for all markers were equal. The initial contact events were detected based on the local minimum in velocity curves of the mean of heel and toe markers (Leitch et al., 2011) and the toe-off events based on the maximum extension in sagittal knee angles (Fellin et al., 2010). The parameters for linear and nonlinear analyses were determined for 20 and 100 running strides, respectively, of the left side (Ogaya et al., 2021; Riazati et al., 2019). For the linear analysis, the 20 strides were selected from the first ∼15–35% of the 90 s recording period to minimize the number of missing markers during labelling of data, as some markers fell off due to the dynamic characteristic of running or sweating towards the end of the trials. For the nonlinear analysis, the 100 strides were selected from the ∼5–85% of the 90 s recording period.
2.4 Data analysis
2.4.1 Running style
The SFnorm was calculated based on initial contacts, and normalized to leg length (l0) (Equation 1) (Hof, 1996; van Oeveren et al., 2021).
The DF was calculated as the ratio of stance time to the twice the sum of stance and flight time (Equation 2) (Fadillioglu et al., 2022; van Oeveren et al., 2021).
The results of SFnorm and DF are based on the dual-axis framework for running style (van Oeveren et al., 2021).
The braking and propulsion timings during stance were estimated using the maximum knee flexion event (Ciacci et al., 2010). The ratio of braking to propulsion duration (L2T) was calculated (Equation 3) to estimate the braking to propulsion asymmetries (da Rosa et al., 2019).
Frontal and sagittal angle time series of the ankle, knee and hip joints were time-normalized to stance phase (101 points) for each cycle separately using a cubic spline interpolation (Möhler et al., 2022). The individual time series were compared with each other across different shoe and speed conditions.
COMosc was calculated for the stance phase by the range of motion of COM in vertical direction. Vertical stiffness (kver) and leg stiffness (kleg) were estimated using Equations 4, 5, respectively (Garofolini et al., 2022; Morin et al., 2005).
2.4.2 Running stability.
In the linear analysis, the following were calculated: total time at eversion normalized to stance time (teversion), maximum eversion (MAXeversion) and maximum inversion (MAXinversion) angles during stance phase, and ankle frontal angle at initial contact (ICinversion) (Barrons et al., 2023a; 2024; Hannigan and Pollard, 2020; Isherwood et al., 2021; TenBroek et al., 2014).
In the nonlinear analysis, the local dynamic stability of foot, hip, trunk and head in the vertical axis were determined using MLE of marker clusters (each consisting of four markers) attached to the corresponding body regions (Ekizos et al., 2018; Hunter et al., 2023; Jordan et al., 2009; Look et al., 2013; Winter et al., 2024). Time series data of 100 strides were normalized to 10,000 points (100 strides x 100 points) (Hoenig et al., 2019; Raffalt et al., 2019). Embedding dimension (m) was determined based on the false nearest neighbor method for all trials (Stergiou, 2016; Wallot and Mønster, 2018). The largest m over all trials was used for each region (
A DFA of stride time was performed to assess long-range correlations of running stride (Hunter et al., 2023; Jordan and Newell, 2008; Mann et al., 2015). First, the data series
If the data show power law scaling characteristics, then a logarithmic (i.e., log-log) plot of F (∆n) vs. ∆n is expected to be linear (Equation 9). The slope of this curve gives the scaling component DFA-α which is used to quantify the long-range correlations of data. If the DFA-α lies between 0.5 and 1, the data show a self-similarity characteristic (e.g., a short stride is more likely to follow a short stride). In this range, the larger the DFA-α, the higher the persistence of data, which is interpreted as reduced stability (Agresta et al., 2019; Jordan et al., 2009).
2.5 Statistics
2.5.1 Running style
The statistical tests for discrete parameters were performed in SPSS (Version 29.0, SPSS Inc., IBM, Armonk, NY, United States). The average of the 20 cycles in each running trial was calculated for comparisons. The normality and sphericity were checked by the Kolmogorov-Smilnov and Mauchly tests, respectively. Greenhouse-Geisser estimates were used to correct for violations of sphericity. Repeated measurements analyses of variance (rmANOVAs) were performed to compare conditions where the independent factors were the shoe (High, Medium, Low) and speed (10 km/h, 15 km/h). Eta squared (η2) was calculated to estimate the sizes of the main effects (small η2 ≤ 0.06; medium 0.06 < η2 < 0.14; large 0.14 ≤ η2). Paired t-tests with Bonferroni-Holm corrections were calculated as post-hoc tests. In the case of a global shoe effect, the mean data at 10 km/h and 15 km/h were used in post-hoc tests, whereas in the case of a significant interaction effect, the post-hoc tests were performed for 10 km/h and 15 km/h separately. Cohen’s d was calculated to estimate the effect sizes for post-hoc tests (small d ≤ 0.50; medium 0.50 < d < 0.80; large 0.80 ≤ d) (Cohen, 1988). The significance level was set a priori to α = 0.05.
The angle time series within each joint dimension were compared using the statistical parametric mapping (SPM) toolbox in MATLAB (spm1d toolbox) (Pataky et al., 2019). Normality was checked using the normality tests provided in the toolbox. In the case of non-normality, nonparametric alternatives were conducted with 1,000 iterations. In the case of significant effects, the paired t-tests were calculated as post-hoc tests. The significance level was set a priori to α = 0.05.
2.5.2 Running stability
The statistical tests were also performed in SPSS. For the comparisons of linear analysis, the average of the 20 cycles in each running trial was calculated. Within the nonlinear analysis, a single value was obtained for 100 cycles of each running trial. The Kolmogorov-Smilnov and Mauchly tests were used to check the normality and sphericity, respectively. rmANOVAs were performed to compare conditions with the independent factors shoe (High, Medium, Low) and speed (10 km/h, 15 km/h). In the case of a global shoe effect, paired t-tests with Bonferroni-Holm corrections were performed as post-hoc tests in which the mean data of 10 km/h and 15 km/h were used to compare shoe conditions independent of the speed effects. η2 and d were calculated to estimate the effects sizes as explained above. The significance level was set a priori to α = 0.05.
3 Results
3.1 Running style
The discrete parameters used for running style analysis are represented in Table 2. Figure 2 visualizes the results for SFnorm and DF in the dual-axis framework. The SFnorm showed significant interaction between shoes and speed (p = 0.001). The post-hoc analysis showed that the SFnorm of Low was significantly higher than High (p = 0.046) and Medium (p = 0.012); and that of High was higher compared to Medium (p = 0.038) at 15 km/h.
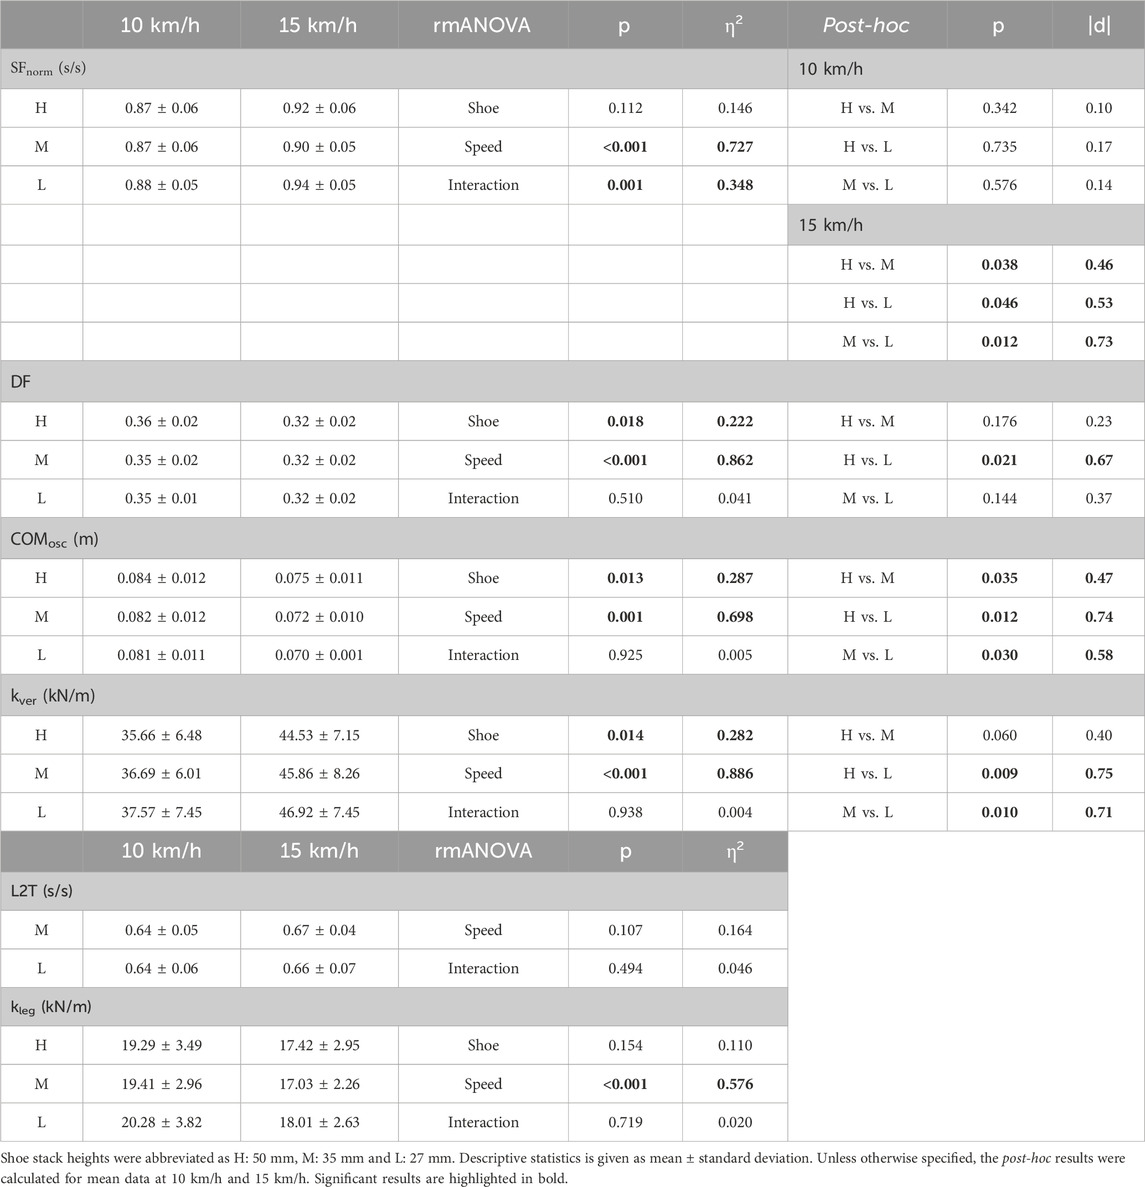
Table 2. The discrete parameters used for running style analysis: step frequency normalized to leg length (SFnorm), duty factor (DF), ratio of braking to propulsion duration (L2T), vertical center of mass oscillation (COMosc), vertical stiffnes (kver) and leg stiffness (kleg).

Figure 2. Running style analysis based on the dual-axis framework (van Oeveren et al., 2021) for different shoes (stack height, H: 50 mm, M: 35 mm and L: 27 mm) and running speeds (10 km/h and 15 km/h). The symbols indicate the mean values of each shoe and the error bars show standard deviations.
The DF was significantly different between shoes (p = 0.018). According to the post-hoc analysis, the DF was higher for High compared to Low independent of speed (p = 0.021). The L2T showed no significant effects (Table 2).
The ankle, knee and hip joint time series are shown in Figures 3, 4 for the sagittal and frontal planes, respectively. The SPM analysis revealed significant shoe effects for the sagittal and frontal ankle angles. The hip and knee angles did not differ significantly between the shoes. No interaction effects were detected. Post-hoc SPM t-tests revealed that Medium led to significantly higher inversion compared to High and Low (both p < 0.001). Post-hoc results in the sagittal plane did not reach the significance level.
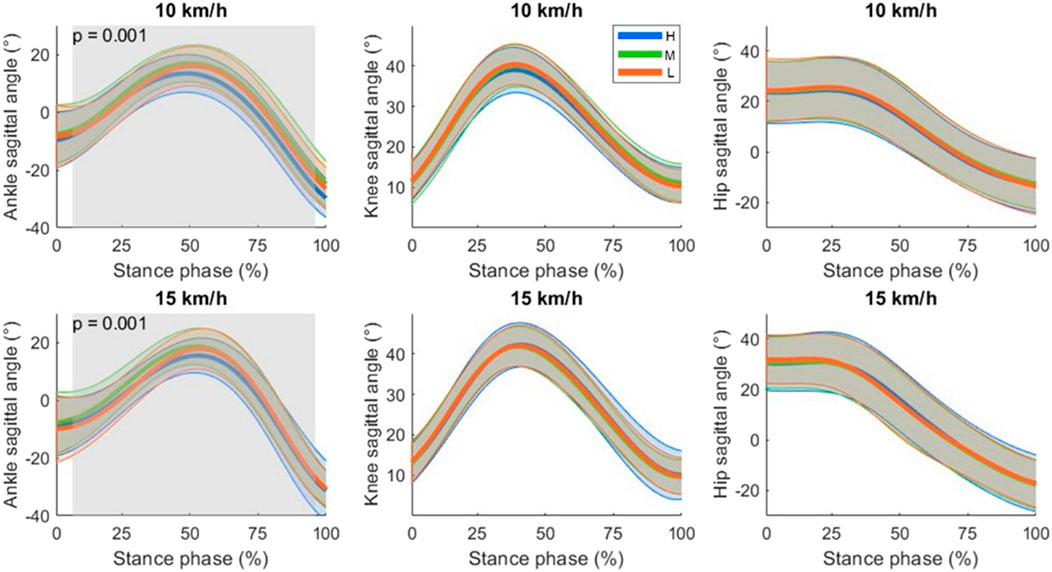
Figure 3. Sagittal plane joint angle time series for ankle, knee and hip as mean (thicker lines) ± standard deviations (upper and lower thinner lines). By convention, a positive angle indicated a flexion for all the joints (dorsiflexion in case of the ankle). Significant shoe differences independent of the running speed are highlighted with shaded areas. The corresponding cluster p-values are also displayed. Shoe stack heights were abbreviated as H: 50 mm, M: 35 mm and L: 27 mm.
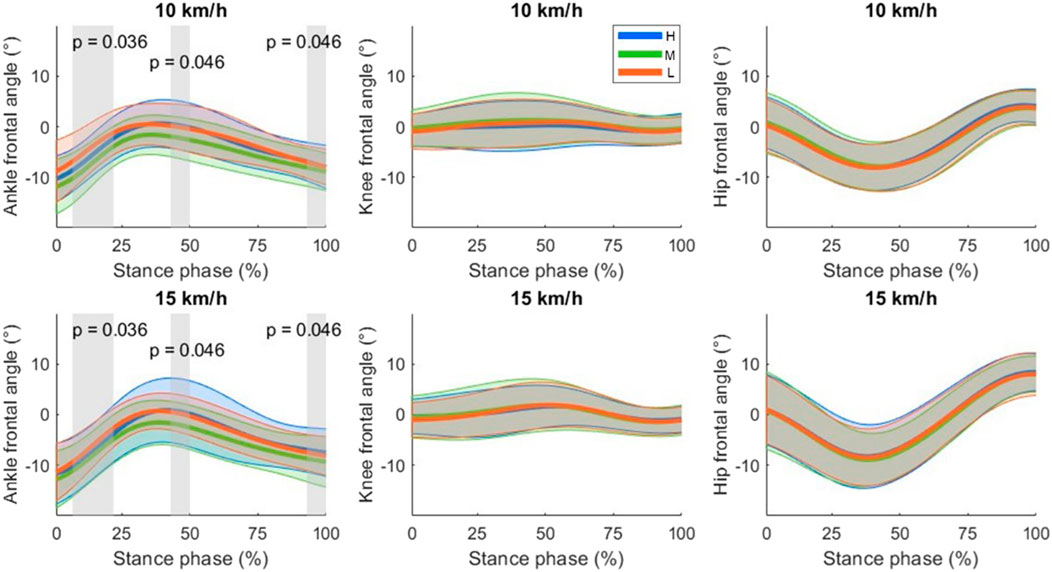
Figure 4. Frontal plane joint angle time series for ankle, knee and hip as mean (thicker lines) ± standard deviations (upper and lower thinner lines). By convention, a positive angle indicated an abduction for the knee and hip, and an eversion for the ankle. Significant shoe differences independent of the running speed are highlighted with shaded areas. The corresponding cluster p-values are also displayed. Shoe stack heights were abbreviated as H: 50 mm, M: 35 mm and L: 27 mm.
The COMosc, kver and kleg results are shown in Table 2; Figure 5. The COMosc differed significantly between the shoes (p = 0.013). The post-hoc tests revealed that all pairwise comparisons between shoes were significant (Table 2). The kver showed significant shoe effects (p = 0.014). The post-hoc tests revealed that Low had the highest kver.
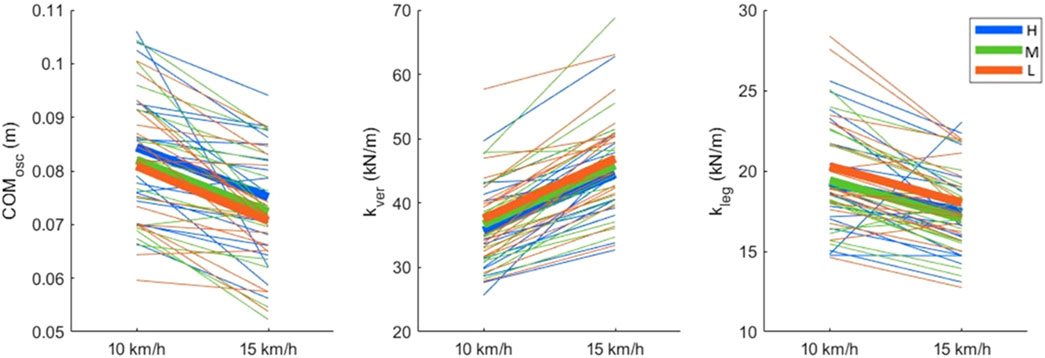
Figure 5. Vertical oscillation of the center of mass (COMosc), vertical stiffness (kver) and leg stiffness (kleg) results. Thicker lines show mean values for each shoe, whereas thinner lines show each participant separately. Shoe stack heights were abbreviated as H: 50 mm, M: 35 mm and L: 27 mm.
3.2 Running stability
3.2.1 Linear analysis
The results are summarized in Table 3. The teversion differed between the shoes (p = 0.035). The post-hoc tests revealed that Medium spent less time in eversion compared with High (p = 0.006) and Low (p = 0.046) independent of the running speed (Table 3). MAXeversion showed significant effects for shoes (p = 0.006). The post-hoc tests showed that MAXeversion during stance was lower in Medium compared to both High (p = 0.002) and Low (p = 0.010). The results of MAXinversion showed significant differences for shoes (p = 0.005). According to the post-hoc tests, the MAXinversion during stance was lower (higher in amount) in Medium compared to both High (p = 0.002) and Low (p = 0.004).
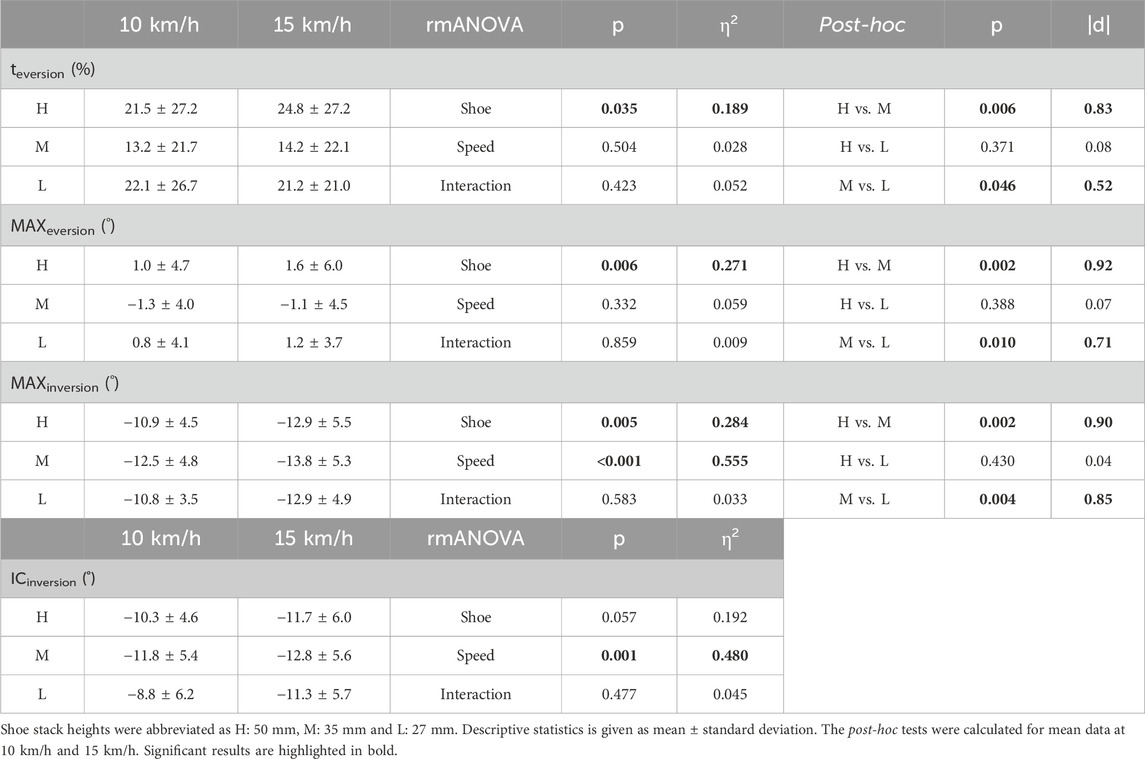
Table 3. The parameters used in the linear analysis of running stability: total time at eversion normalized to stance time (teversion), maximum eversion (MAXeversion) and maximum inversion (MAXinversion) angles during stance phase, and ankle frontal angle at initial contact (ICinversion).
3.2.2 Nonlinear analysis
The results are summarized in Table 4. The λhip showed significant effects for the factor shoe (p = 0.040). The post-hoc results showed a reduced local stability in the hip for High compared to Low (p = 0.027). Head, trunk and foot did not show significant effects.
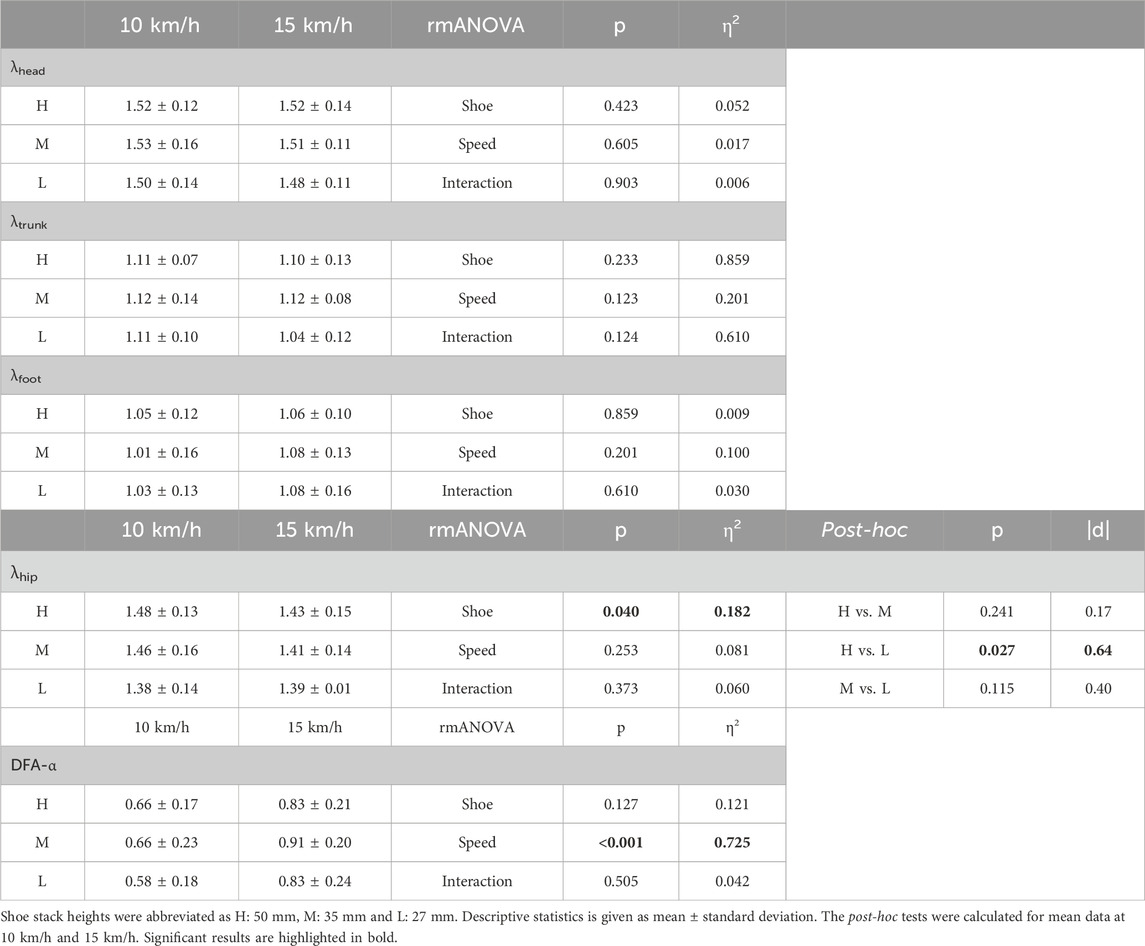
Table 4. The parameters used in the nonlinear analysis of running stability: local dynamic stability of head (λhead), trunk (λtrunk), hip (λhip) and foot (λfoot); detrended fluctuation scaling component of stride time (DFA-α).
4 Discussion
This study aimed to understand the effects of different shoe stack heights on running style and stability during treadmill running at two different speeds. The results showed that the higher stack heights can affect running style (i.e., SFnorm, DF, COMosc, kver, sagittal and frontal ankle angles) and reduce stability (i.e., teversion MAXeversion, MAXinversion and λhip), in line with our first and second hypotheses. More concretely, High resulted in longer ground contacts relative to the stride time compared to Low. Furthermore, the higher the stack height, the lower was the COMosc, whereas the kver was the highest for Low with no differences between Medium and High. The ankle was longer in an everted position with High compared to Medium. In addition, the local dynamic stability of the hip during running was lower with High compared to Low. The higher stack heights (≥35 mm) led to a lower step frequency normalized to leg length at 15 km/h but not at 10 km/h. Except for SFnorm, the findings were not speed dependent but global effects, which contradicts to our third hypothesis.
4.1 Higher shoe stack height leads to changes in running style parameters
Running style is important for economy and performance (Folland et al., 2017). It was hypothesized here that different shoe stack heights modulate the running style (H1). This study revealed that, at a greater speed, the higher stack heights (High and Medium) led to a lower SFnorm compared to the lowest stack height. This can be interpreted as a shift of the running style to the direction of the “push” style associated with longer steps (van Oeveren et al., 2021). In addition, independent of running speed, the highest stack height led to higher DF compared with the lowest stack height, which can be interpreted as a running style shifted to the direction of a “stick” style associated with longer stance time relative to stride time (van Oeveren et al., 2021). When it comes to the ratio of braking to propulsion durations (i.e., L2T), the results showed that the braking phase had a shorter duration than the propulsion, but L2T remained unaffected by different shoes and running speeds. To sum up, the highest stack height altered the running style in line with our first hypothesis and led to longer steps (based on SFnorm) with longer ground contacts relative to the stride time (based on DF), especially compared to the lowest stack height and faster speed. However, it should be added that the differences between shoe conditions were 2%–4% for SFnorm and 1.5% for DF. This study does not address whether these changes can translate into performance differences.
Further analysis revealed that COMosc increased with increasing stack height. This finding may indicate a decreased running economy for the highest stack height condition, since a larger COMosc is associated with worse running economy (Folland et al., 2017; Saunders et al., 2004). Nevertheless, it should be noted that running economy was not directly measured therefore this is not necessarily true. For example, Fletcher et al. (2008) detected differences in COMosc but not in running economy. Therefore, this interpretation should be treated with caution. Furthermore, kver was the highest for Low with no differences between Medium and Heigh.
The results of kleg showed significant speed effects but no shoe effects. This secondary finding is surprising since kleg takes effective leg length into account, thereby eliminating the speed dependency; unlike kver which increases with running speed. Normally, it is expected that kleg remains relatively stable across different running speeds (Brughelli and Cronin, 2008) which was not the case in the current study. Possibly, it is because the stiffness parameters were estimated based on kinematics without any force measurements, therefore possibly they are less reliable compared to measures based on kinetics. However, the kinematics-based method has also been used in various other studies to estimate stiffness (e.g., Burns et al., 2021; Morin et al., 2005).
Finally, the analysis of joint angle time series of the lower limb showed that the different stack heights affect joint kinematics to a certain extent. In the frontal plane, the middle stack height shoes led to a decreased frontal ankle angle (shift to inversion) compared to other shoes, whereas in the sagittal plane there were no significant effects in the post-hoc tests. These results indicated that the different shoe stack heights affect mainly the ankle but not the more proximal joints of the lower body (i.e., the knee and hip).
4.2 Reduced running stability with highest stack height
In this study, it was hypothesized that the shoes with higher stack heights lead to less stability (H2), in line with previous findings (Hoogkamer, 2020; Ruiz-Alias et al., 2023a). Both linear and nonlinear analyses were carried out in a comprehensive approach. Linear measures provide essential information such as mean and standard deviation on the analyzed parameters but they assume that the output of the system is directly proportional to the input although biological systems are inherently nonlinear (McCamley and Harrison, 2016). Therefore, nonlinear analysis complements linear analysis by providing deeper insights to biological systems without simple linearity assumptions. The linear analysis of joint angles based on discrete parameters revealed that Medium led to a lower MAXinversion and MAXeversion during stance. It is important to note that MAXeversion values were partially still in the region of an inversion (Figure 4). Together with the joint angle time series data, it can be concluded that Medium shifted the frontal ankle angle to a more inverted position compared to High and Low. The teversion results revealed that High led to a longer duration in an everted foot position compared to Medium, which may be indicator for a decreased stability and a higher risk of injury (Becker et al., 2018; Hannigan and Pollard, 2020). However, it should be noted that the shoes with the highest stack were not less stable compared to the lowest stack height shoes. This may be attributed to the missing advanced footwear technology elements in Low. Possibly, the advanced footwear technology elements (i.e., curved carbon infused rods) help to increase ankle stability but extremely high stack heights (i.e. 50 mm) counterbalance the advantages of these technologies. Thereby, the linear analysis results partially supported our second hypothesis. These findings were in line with those from Barrons et al. (2023a) but not fully matched them. In their study, the shoes with 35 mm stack height decreased ankle eversion compared with 45 mm but not with 50 mm. It should also be noted that the frontal ankle angle values were slightly different from those in this study, even though the tendencies due to different shoes were similar. These differences were probably due to different marker sets and inverse kinematics models used. Previous studies reported that the kinematics results may change, especially in the non-sagittal planes, when different setups are used for gait analysis (Roelker et al., 2017; Trinler et al., 2019; Wouda et al., 2018).
The nonlinear analysis indicated that local stability of the hip based on MLE was lower with High compared to Low. In this context, hip stability can be seen as the most important location since the fundamental goal of locomotion is to transport the COM (Evans et al., 2022) and the hip can be used to approximate the COM during running (Napier et al., 2020). The MLE results indicated that stabilization of the hip became more difficult with the highest stack height compared to the lowest, which thereby supported our second hypothesis. The DFA of stride time indicated a self-similarity characteristic (e.g., a short stride is more likely to follow a short stride). In contrast to MLE, the DFA of stride time did not show any significant shoe differences, which was against our second hypothesis. One explanation may be that the shoes provide only small perturbations for the system (Prejean and Ricard, 2019). Therefore, they do not modulate the global stability.
In this study, one of the goals was to operationalize stability from different perspectives to gain a better understanding of stack height effects on stability. First, the discrete frontal ankle angles indicated a higher portion of eversion during stance for High compared to Medium. Secondly, the local dynamic stability of the hip during running was lower with High compared to Low. These results are in line with the perceived stability results of the data used in this study (Fadillioglu et al., 2024) as well as with previous studies suggesting that increasing stack height may lead to instabilities (Hoogkamer, 2020; Ruiz-Alias et al., 2023a). Based on these findings, it can be suggested that high stack height (i.e. 50 mm) lead to instabilities in frontal ankle angle and hip local stability. But it is important to note that High and Medium had curved carbon infused rods but Low did not. The detected differences may partially be attributed to the carbon rods and not solely to the higher stack heights. It should be added that High had a stack height larger than the allowed limit (40 mm) by World Athletics regulation (World Athletic Council, 2022). On this basis, in terms of the stability concerns, the findings of this study support this regulation restricting the stack height to 40 mm. However, the current study does not address whether the observed decreased instability can be translated into a decreased running performance. Therefore, further research is needed. Furthermore, it should be noted that not all parameters supported this statement. For example, the local dynamic stability of the foot did not change. Nevertheless, this is not in conflict with the frontal ankle angle results since linear and nonlinear analyses do not have the same assumptions (McCamley and Harrison, 2016).
4.3 Stack height changes were largely independent of running speed
In general, higher running speeds may represent more challenging task conditions than lower speeds (Santuz et al., 2020b), thereby increase the influence of stack heights. In this study, it was hypothesized that the effects of different stack heights would be pronounced at higher speeds (H3).
The detected shoe effects did not change between the two running speeds, and only SFnorm had significant interaction effect between the factors speed and shoe. More concretely, the shoe effects were visible at a higher speed only for SFnorm. Based on these findings, it can be suggested that the detected shoe effects were mostly global effects, which means that they were independent of the tested running speeds, with the exception of the running style parameter SFnorm. Therefore, our third hypothesis should be rejected with the exception of the SFnorm.
4.4 Limitations
This study has some limitations that must be mentioned. Firstly, the shoes differed mainly in their stack heights but not all the remaining shoe features were identical. Major limitation was that High and Medium included advanced footwear technology elements (carbon curved rods) but Low did not contain these elements. The changes between High and Medium can mainly be attributed to stack height changes whereas the changes compared to Low can be additionally due to infused carbon rods in the shoe soles (e.g., local stability changes of the hip). Furthermore, the weight of the shoes slightly differed but the difference between the lightest and heaviest ones was only 49 g (Table 1). It has previously been shown that an added mass of 50 g resulted in limited biomechanical changes (Rodrigo-Carranza et al., 2020). Secondly, the experiments were done on a treadmill at two constant running speeds. Even if it is done in a similar way in many comparable studies also (e.g., Barrons et al., 2023a; Chambon et al., 2014; Udin et al., 2023), it should be kept in mind that this is a very controlled experimental condition. It is possible that larger additional perturbations to the system (e.g., higher running speed, uneven ground and fatigue) will increase the shoe effects. Thirdly, the participants were healthy experienced runners and the findings cannot be directly translated to other expertise levels (Fadillioglu et al., 2022; Möhler et al., 2020). Fourthly, the initial contact and toe-off events were detected based on kinematics in the current study. Even if the validation studies reported the difference between gold standard and proposed methods to be low for treadmill running (error ≤20 m (Fellin et al., 2010; King et al., 2019; Leitch et al., 2011), the kinetic-based methods are more accurate. Lastly, the used dual-axis framework (van Oeveren et al., 2021) was proposed to provide an overview of running style with fundamental differences between conditions. However, this framework is not enough to describe a running style completely but proper normalization for individual characteristics is required.
5 Conclusion
The purpose of this study was to investigate how three shoes with different stack heights affect running style and stability during treadmill running at different speeds. The key findings of this study were: 1) changes in stack height can affect running style. Particularly, the shoes with the highest stack height resulted in longer ground contacts relative to the stride time compared to the lowest stack. Furthermore, the higher the stack height, the higher was the vertical oscillation of the COM 2) The ankle spent longer in an everted position with the highest stack compared to the middle heigh. In addition, the local dynamic stability of the hip during running was lower with the highest stack compared to the lowest one. Both results indicated that the highest stack height (50 mm) reduce stability. However, not all stability parameters indicated decreased stability for the highest stack height. 3) The higher stack heights (≥35 mm) led to a lower step frequency normalized to leg length at 15 km/h but not at 10 km/h. The remaining shoe effects were independent of the running speed.
Shoe stack height is a highly discussed topic especially since the introduction of a stack height regulation by World Athletics. The findings of the study are in line with the statement “more is not always better” when it comes to the stack height. This study has found another piece of puzzle in understanding the effects of stack heights on running style and stability. Future studies may focus on running coordination as well as analysis of joint loads and muscle activities to better understand stack height effects.
Data availability statement
The raw data supporting the conclusions of this article will be made available by the authors, without undue reservation.
Ethics statement
The studies involving humans were approved by the ethics committee of the Karlsruhe Institute of Technology (KIT). The studies were conducted in accordance with the local legislation and institutional requirements. The participants provided their written informed consent to participate in this study.
Author contributions
CK: Conceptualization, Data curation, Formal Analysis, Investigation, Methodology, Software, Visualization, Writing–original draft. BS: Conceptualization, Writing–review and editing. TS: Conceptualization, Funding acquisition, Methodology, Project administration, Resources, Supervision, Writing–review and editing.
Funding
The author(s) declare that financial support was received for the research, authorship, and/or publication of this article. Adidas AG provided financial and material support for this study. The funder had no role in study design, data collection andanalysis, decision to publish, or preparation of the manuscript.
Acknowledgments
We acknowledge support by the KIT-Publication Fund of the Karlsruhe Institute of Technology. A preprint version of this work is available at BioRxiv (Kettner et al., 2024).
Conflict of interest
The authors declare that the research was conducted in the absence of any commercial or financial relationships that could be construed as a potential conflict of interest.
The author(s) declared that they were an editorial board member of Frontiers, at the time of submission. This had no impact on the peer review process and the final decision.
Generative AI statement
The author(s) declare that no Generative AI was used in the creation of this manuscript.
Publisher’s note
All claims expressed in this article are solely those of the authors and do not necessarily represent those of their affiliated organizations, or those of the publisher, the editors and the reviewers. Any product that may be evaluated in this article, or claim that may be made by its manufacturer, is not guaranteed or endorsed by the publisher.
References
Agresta, C. E., Goulet, G. C., Peacock, J., Housner, J., Zernicke, R. F., and Zendler, J. D. (2019). Years of running experience influences stride-to-stride fluctuations and adaptive response during step frequency perturbations in healthy distance runners. Gait Posture 70, 376–382. doi:10.1016/j.gaitpost.2019.02.034
Barnes, K. R., and Kilding, A. E. (2015). Running economy: measurement, norms, and determining factors. Sports Med. - Open 1 (1), 8–15. doi:10.1186/s40798-015-0007-y
Barrons, Z. B., Wannop, J. W., and Stefanyshyn, D. J. (2023a). The influence of footwear midsole thickness on running economy and frontal plane ankle stability. Footwear Sci. 15 (3), 155–160. doi:10.1080/19424280.2023.2218321
Barrons, Z. B., Wannop, J. W., and Stefanyshyn, D. J. (2023b). The influence of midsole thickness on running biomechanics and performance in female and male runners, does size matter? Footwear Sci. 15 (Suppl. 1), S8–S9. doi:10.1080/19424280.2023.2199257
Barrons, Z. B., Wannop, J. W., and Stefanyshyn, D. J. (2024). The influence of midsole thickness on running turns. Footwear Sci. 16 (2), 87–91. doi:10.1080/19424280.2024.2316345
Becker, J., James, S., Wayner, R., Osternig, L., and Chou, L.-S. (2017). Biomechanical factors associated with achilles tendinopathy and medial tibial stress syndrome in runners. Am. J. Sports Med. 45 (11), 2614–2621. doi:10.1177/0363546517708193
Becker, J., Nakajima, M., and Wu, W. F. W. (2018). Factors contributing to medial tibial stress syndrome in runners: a prospective study. Med. Sci. Sports Exerc. 50 (10), 2092–2100. doi:10.1249/MSS.0000000000001674
Bertschy, M., Lino, H., Healey, L., and Hoogkamer, W. (2023). Effects of midsole stack height and foam on the metabolic cost of running. Footwear Sci. 15 (Suppl. 1), S180–S181. doi:10.1080/19424280.2023.2202942
Brughelli, M., and Cronin, J. (2008). A review of research on the mechanical stiffness in running and jumping: Methodology and implications. Scand. J. Med. Sci. Sports 18 (4), 417–426. doi:10.1111/j.1600-0838.2008.00769.x
Bruijn, S. M., Meijer, O. G., Beek, P. J., and Van Dieen, J. H. (2013). Assessing the stability of human locomotion: a review of current measures. J. R. Soc. Interface 10 (83), 20120999. doi:10.1098/rsif.2012.0999
Bryce, R. M., and Sprague, K. B. (2012). Revisiting detrended fluctuation analysis. Sci. Rep. 2, 315. doi:10.1038/srep00315
Burns, G. T., Gonzalez, R., Zendler, J. M., and Zernicke, R. F. (2021). Bouncing behavior of sub-four minute milers. Sci. Rep. 11 (1), 10501–10515. doi:10.1038/s41598-021-89858-1
Burns, G. T., and Tam, N. (2020). Is it the shoes? A simple proposal for regulating footwear in road running. Br. J. Sports Med. 54 (8), 439–440. doi:10.1136/bjsports-2018-100480
Chambon, N., Delattre, N., Guéguen, N., Berton, E., and Rao, G. (2014). Is midsole thickness a key parameter for the running pattern? Gait Posture 40 (1), 58–63. doi:10.1016/j.gaitpost.2014.02.005
Ciacci, S., Di Michele, R., and Merni, F. (2010). Kinematic analysis of the braking and propulsion phases during the support time in sprint running. Gait Posture 31 (2), 209–212. doi:10.1016/j.gaitpost.2009.10.007
Cohen, J. (1988). Statistical power analysis for the behavioral sciences. 2nd edn. Lawrence Erlbaum Associates, 20–27. doi:10.4324/9780203771587
da Rosa, R. G., Oliveira, H. B., Gomeñuka, N. A., Bienert Masiero, M. P., Da Silva, E. S., Janner Zanardi, A. P., et al. (2019). Landing-takeoff asymmetries applied to running mechanics: a new perspective for performance. Front. Physiology 10 (MAR), 415–418. doi:10.3389/fphys.2019.00415
Delp, S. L., Anderson, F. C., Arnold, A. S., Loan, P., Habib, A., John, C. T., et al. (2007). OpenSim: open-source software to create and analyze dynamic simulations of movement. IEEE Trans. Biomed. Eng. 54 (11), 1940–1950. doi:10.1109/TBME.2007.901024
Dingwell, J. B., and Kang, H. G. (2007). Differences between local and orbital dynamic stability during human walking. J. Biomechanical Eng. 129 (4), 586–593. doi:10.1115/1.2746383
Ekizos, A., Santuz, A., and Arampatzis, A. (2017). Transition from shod to barefoot alters dynamic stability during running. Gait Posture 56 (April), 31–36. doi:10.1016/j.gaitpost.2017.04.035
Ekizos, A., Santuz, A., Schroll, A., and Arampatzis, A. (2018). The maximum Lyapunov exponent during walking and running: reliability assessment of different marker-sets. Front. Physiology 9 (AUG), 1101–1111. doi:10.3389/fphys.2018.01101
Esculier, J. F., Dubois, B., Dionne, C. E., Leblond, J., and Roy, J. S. (2015). A consensus definition and rating scale for minimalist shoes. J. Foot Ankle Res. 8 (1), 42–49. doi:10.1186/s13047-015-0094-5
Evans, S. A., James, D., Rowlands, D., and Lee, J. B. (2022). Variability of the center of mass in trained triathletes in running after cycling: a preliminary study conducted in a real-life setting. Front. Sports Act. Living 4 (June), 852369. doi:10.3389/fspor.2022.852369
Fadillioglu, C., Möhler, F., Reuter, M., and Stein, T. (2022). Changes in key biomechanical parameters according to the expertise level in runners at different running speeds. Bioengineering 9 (616), 1–10. doi:10.3390/bioengineering9110616
Fadillioglu, C., Stetter, B. J., and Stein, T. (2024). “Effects of stack height on running biomechanics during level, uphill and downhill running at different speeds,”. ISBS 2024 conference proceedings. Editors J. Holder, I. Fessl, E. Harbour, and H. Schwameder (Artikel: International Society of Biomechanics in Sports), 45. (ISBS).
Fellin, R. E., Rose, W. C., Royer, T. D., and Davis, I. S. (2010). Comparison of methods for kinematic identification of footstrike and toe-off during overground and treadmill running. J. Sci. Med. Sport 13 (6), 646–650. doi:10.1016/j.jsams.2010.03.006
Fletcher, G., Bartlett, R., Romanov, N., and Fotouhi, A. (2008). Pose® method technique improves running performance without economy changes. Int. J. Sports Sci. and Coach. 3 (3), 365–380. doi:10.1260/174795408786238506
Floría, P., Harrison, A. J., Rojo-Álvarez, J. L., Melgarejo-Meseguer, F. M., and Sanchez-Sixto, A. (2024). Joint movement patterns differ among male recreational runners with different running style. Sports Biomech. 00 (00), 1–12. doi:10.1080/14763141.2023.2298947
Folland, J. P., Allen, S. J., Black, M. I., Handsaker, J. C., and Forrester, S. E. (2017). Running technique is an important component of running economy and performance. Med. Sci. Sports Exerc. 49 (7), 1412–1423. doi:10.1249/MSS.0000000000001245
Frank, N. S., Prentice, S. D., and Callaghan, J. P. (2019). Local dynamic stability of the lower extremity in novice and trained runners while running in traditional and minimal footwear. Gait Posture 68 (April 2018), 50–54. doi:10.1016/j.gaitpost.2018.10.034
Frederick, E. C. (2020). No evidence of a performance advantage attributable to midsole thickness. Footwear Sci. 12 (1), 1–2. doi:10.1080/19424280.2019.1690327
Fuller, J. T., Amado, A., Emmerik, R. E. A. van, Hamill, J., Buckley, J. D., Tsiros, M. D., et al. (2016). The effect of footwear and footfall pattern on running stride interval long-range correlations and distributional variability. Gait Posture 44, 137–142. doi:10.1016/j.gaitpost.2015.12.006
Garofolini, A., Mickle, K. J., McLaughlin, P., and Taylor, S. B. (2022). Insight into the hierarchical control governing leg stiffness during the stance phase of running. Sci. Rep. 12 (12123), 1–11. doi:10.1038/s41598-022-16263-7
Garofolini, A., Mickle, K. J., Mclaughlin, P., and Taylor, S. B. (2024). Assessing the effects of foot strike patterns and shoe types on the control of leg length and orientation in running. Sci. Rep., 14 (2220), 1–12. doi:10.1038/s41598-024-52446-0
Gullstrand, L., Halvorsen, K., Tinmark, F., Eriksson, M., and Nilsson, J. (2009). Measurements of vertical displacement in running, a methodological comparison. Gait Posture 30 (1), 71–75. doi:10.1016/j.gaitpost.2009.03.001
Hamner, S. R., Seth, A., and Delp, S. L. (2010). Muscle contributions to propulsion and support during running. J. Biomechanics 43 (14), 2709–2716. doi:10.1016/j.jbiomech.2010.06.025
Hannigan, J. J., and Pollard, C. D. (2020). Differences in running biomechanics between a maximal, traditional, and minimal running shoe. J. Sci. Med. Sport 23 (1), 15–19. doi:10.1016/j.jsams.2019.08.008
Hausdorff, J. M., Purdon, P. L., Peng, C., Ladin, Z., Wei, J. Y., Goldberger Charles, A. A. L., et al. (1996). Fractal dynamics of human gait: stability of long-range correlations in stride interval fluctuations. J. Appl. Physiol. 80 (5), 1448–1457. doi:10.1152/jappl.1996.80.5.1448
Hoenig, T., Hamacher, D., Braumann, K. M., Zech, A., and Hollander, K. (2019). Analysis of running stability during 5000 m running. Eur. J. Sport Sci. 19 (4), 413–421. doi:10.1080/17461391.2018.1519040
Hof, A. L. (1996). Scaling gait data to body size. Gait and Posture, 4(3), 222–223. doi:10.1016/0966-6362(95)01057-2
Hoitz, F., Mohr, M., Asmussen, M., Lam, W. K., Nigg, S., and Nigg, B. (2020). The effects of systematically altered footwear features on biomechanics, injury, performance, and preference in runners of different skill level: a systematic review. Footwear Sci. 12 (3), 193–215. doi:10.1080/19424280.2020.1773936
Hoogkamer, W. (2020). More isn’t always better. Footwear Sci. 12 (2), 75–77. doi:10.1080/19424280.2019.1710579
Hunter, B., Karsten, B., Greenhalgh, A., Burnley, M., and Muniz-Pumares, D. (2023). The Application of non-linear methods to quantify changes to movement dynamics during running: a scoping review. J. Sports Sci. 41 (5), 481–494. doi:10.1080/02640414.2023.2225014
Isherwood, J., Wang, H., and Sterzing, T. (2021). Running biomechanics and running shoe perception of Chinese men and women. Footwear Sci. 13 (1), 55–67. doi:10.1080/19424280.2020.1853827
Jordan, K., Challis, J. H., Cusumano, J. P., and Newell, K. M. (2009). Stability and the time-dependent structure of gait variability in walking and running. Hum. Mov. Sci. 28 (1), 113–128. doi:10.1016/j.humov.2008.09.001
Jordan, K., Challis, J. H., and Newell, K. M. (2006). Long range correlations in the stride interval of running. Gait Posture 24 (1), 120–125. doi:10.1016/j.gaitpost.2005.08.003
Jordan, K., Challis, J. H., and Newell, K. M. (2007). Speed influences on the scaling behavior of gait cycle fluctuations during treadmill running. Hum. Mov. Sci. 26 (1), 87–102. doi:10.1016/j.humov.2006.10.001
Jordan, K., and Newell, K. M. (2008). The structure of variability in human walking and running is speed-dependent. Exerc. Sport Sci. Rev. 36 (4), 200–204. doi:10.1097/JES.0b013e3181877d71
Kettner, C., Stetter, B. J., and Stein, T. (2024). The effects of running shoe stack height on running style and stability during level running at different running speeds. BioRxiv, 2024.11. doi:10.1101/2024.11.19.624278
King, D. L., McCartney, M., and Trihy, E. (2019). Initial contact and toe off event identification for rearfoot and non-rearfoot strike pattern treadmill running at different speeds. J. Biomechanics 90, 119–122. doi:10.1016/j.jbiomech.2019.04.023
Koegel, J., Huerta, S., Gambietz, M., Ullrich, M., Heyde, C., Dorschky, E., et al. (2024). Clustering runners ’ response to different midsole stack heights: a field study. Sensors 24 (4694), 4694. doi:10.3390/s24144694
Kuhman, D. J., Paquette, M. R., Peel, S. A., and Melcher, D. A. (2016). Comparison of ankle kinematics and ground reaction forces between prospectively injured and uninjured collegiate cross country runners. Hum. Mov. Sci., 47, 9–15. doi:10.1016/j.humov.2016.01.013
Kulmala, J. P., Kosonen, J., Nurminen, J., and Avela, J. (2018). Running in highly cushioned shoes increases leg stiffness and amplifies impact loading. Sci. Rep. 8 (1), 17496–17498. doi:10.1038/s41598-018-35980-6
Law, M. H. C., Choi, E. M. F., Law, S. H. Y., Chan, S. S. C., Wong, S. M. S., Ching, E. C. K., et al. (2019). Effects of footwear midsole thickness on running biomechanics. J. Sports Sci. 37 (9), 1004–1010. doi:10.1080/02640414.2018.1538066
Leitch, J., Stebbins, J., Paolini, G., and Zavatsky, A. B. (2011). Identifying gait events without a force plate during running: a comparison of methods. Gait Posture 33 (1), 130–132. doi:10.1016/j.gaitpost.2010.06.009
Look, N., Arellano, C. J., Grabowski, A. M., McDermott, W. J., Kram, R., and Bradley, E. (2013). Dynamic stability of running: the effects of speed and leg amputations on the maximal lyapunov exponent. Chaos 23 (4), 043131. doi:10.1063/1.4837095
Mai, P., Robertz, L., Robbin, J., Bill, K., Weir, G., Kurz, M., et al. (2023). Towards functionally individualised designed footwear recommendation for overuse injury prevention: a scoping review. BMC Sports Sci. Med. Rehabilitation 15 (152), 1–19. doi:10.1186/s13102-023-00760-x
Mann, R., Malisoux, L., Nührenbörger, C., Urhausen, A., Meijer, K., and Theisen, D. (2015). Association of previous injury and speed with running style and stride-to-stride fluctuations. Scand. J. Med. Sci. Sports 25 (6), e638–e645. doi:10.1111/sms.12397
McCamley, J., and Harrison, S. J. (2016). “Introduction,” in Nonliear analysis for human movement variability. Editor N. Stergiou (Florida: CRC Press), 1–28.
Mehdizadeh, S., Arshi, A. R., and Davids, K. (2014). Effect of speed on local dynamic stability of locomotion under different task constraints in running. Eur. J. Sport Sci. 14 (8), 791–798. doi:10.1080/17461391.2014.905986
Möhler, F., Fadillioglu, C., Scheffler, L., Müller, H., and Stein, T. (2022). Running-induced fatigue changes the structure of motor variability in novice runners. Biology 11 (942), 1–12. doi:10.3390/biology11060942
Möhler, F., Marahrens, S., Ringhof, S., Mikut, R., and Stein, T. (2020). Variability of running coordination in experts and novices: a 3D uncontrolled manifold analysis. Eur. J. Sport Sci. 20 (9), 1187–1196. doi:10.1080/17461391.2019.1709561
Morin, J. B., Dalleau, G., Kyröläinen, H., Jeannin, T., and Belli, A. (2005). A simple method for measuring stiffness during running. J. Appl. Biomechanics 21 (2), 167–180. doi:10.1123/jab.21.2.167
Napier, C., Jiang, X., MacLean, C. L., Menon, C., and Hunt, M. A. (2020). The use of a single sacral marker method to approximate the centre of mass trajectory during treadmill running. J. Biomechanics 108, 109886. doi:10.1016/j.jbiomech.2020.109886
Nijs, A., Roerdink, M., and Beek, P. J. (2022). Running-style modulation: effects of stance-time and flight-time instructions on duty factor and cadence. Gait Posture 98 (September), 283–288. doi:10.1016/j.gaitpost.2022.10.002
Ogaya, S., Suzuki, M., Yoshioka, C., Nakamura, Y., Kita, S., and Watanabe, K. (2021). The effects of trunk endurance training on running kinematics and its variability in novice female runners. Sports Biomech. 00 (00), 997–1008. doi:10.1080/14763141.2021.1906938
Paquette, M. R., Melaro, J. A., Smith, R., and Moore, I. S. (2024). Time to stability of treadmill running kinematics in novel footwear with different midsole thickness. J. Biomechanics 164, 111984. doi:10.1016/j.jbiomech.2024.111984
Pataky, T. C., Vanrenterghem, J., Robinson, M. A., and Liebl, D. (2019). On the validity of statistical parametric mapping for nonuniformly and heterogeneously smooth one-dimensional biomechanical data. J. Biomechanics 91 (xxxx), 114–123. doi:10.1016/j.jbiomech.2019.05.018
Prejean, B. J., and Ricard, M. D. (2019). A quantification of lower-limb coordinative variability during running with different levels of midsole cushioning. Footwear Sci. 11 (2), 93–104. doi:10.1080/19424280.2019.1593515
Promsri, A., Deedphimai, S., Promtheo, P., and Champamuang, C. (2024). Effects of different wearable resistance placements on running stability. Sports 12, 45. doi:10.3390/sports12020045
Raffalt, P. C., Kent, J. A., Wurdeman, S. R., and Stergiou, N. (2019). Selection procedures for the largest lyapunov exponent in gait biomechanics. Ann. Biomed. Eng. 47 (4), 913–923. doi:10.1007/s10439-019-02216-1
Riazati, S., Caplan, N., and Hayes, P. R. (2019). The number of strides required for treadmill running gait analysis is unaffected by either speed or run duration. J. Biomechanics 97, 109366. doi:10.1016/j.jbiomech.2019.109366
Richert, F. C., Stein, T., Ringhof, S., and Stetter, B. J. (2019). The effect of the heel-to-toe drop of standard running shoes on lower limb biomechanics. Footwear Sci. 11 (3), 161–170. doi:10.1080/19424280.2019.1630016
Riva, F., Bisi, M. C., and Stagni, R. (2013). Orbital stability analysis in biomechanics: a systematic review of a nonlinear technique to detect instability of motor tasks. Gait Posture 37 (1), 1–11. doi:10.1016/j.gaitpost.2012.06.015
Rodrigo-Carranza, V., González-Mohíno, F., Santos-Concejero, J., and González-Ravé, J. M. (2020). Influence of shoe mass on performance and running economy in trained runners. Front. Physiology 11 (September), 573660. doi:10.3389/fphys.2020.573660
Roelker, S. A., Caruthers, E. J., Baker, R. K., Pelz, N. C., Chaudhari, A. M. W., and Siston, R. A. (2017). Interpreting musculoskeletal models and dynamic simulations: causes and effects of differences between models. Ann. Biomed. Eng. 45 (11), 2635–2647. doi:10.1007/s10439-017-1894-5
Rosenstein, M. T., Collins, J. J., and De Luca, C. J. (1993). A practical method for calculating largest Lyapunov exponents from small data sets. Phys. D. Nonlinear Phenom., 65(1), 117–134. doi:10.1016/0167-2789(93)90009-P
Ruiz-Alias, S. A., Jaén-Carrillo, D., Roche-Seruendo, L. E., Pérez-Castilla, A., Soto-Hermoso, V. M., and García-Pinillos, F. (2023a). A review of the potential effects of the World Athletics stack height regulation on the footwear function and running performance. Appl. Sci. Switz. 13 (21), 11721. doi:10.3390/app132111721
Ruiz-Alias, S. A., Pérez-Castilla, A., Soto-Hermoso, V. M., and García-Pinillos, F. (2023b). Influence of the World Athletics stack height regulation on track running performance. J. Strength Cond. Res. 37 (11), 2260–2266. doi:10.1519/JSC.0000000000004523
Santuz, A., Brüll, L., Ekizos, A., Schroll, A., Eckardt, N., Kibele, A., et al. (2020a). Neuromotor dynamics of human locomotion in challenging settings. IScience 23 (1), 100796. doi:10.1016/j.isci.2019.100796
Santuz, A., Ekizos, A., Kunimasa, Y., Kijima, K., Ishikawa, M., and Arampatzis, A. (2020b). Lower complexity of motor primitives ensures robust control of high-speed human locomotion. Heliyon 6 (10), e05377. doi:10.1016/j.heliyon.2020.e05377
Saunders, P. U., Pyne, D. B., Telford, R. D., and Hawley, J. A. (2004). Factors affecting running economy in trained distance runners. Sports Med. 34 (7), 465–485. doi:10.2165/00007256-200434070-00005
Schütte, K. H., Seerden, S., Venter, R., and Vanwanseele, B. (2018). Influence of outdoor running fatigue and medial tibial stress syndrome on accelerometer-based loading and stability. Gait Posture 59, 222–228. doi:10.1016/j.gaitpost.2017.10.021
Selvakumar, S., Li, S. M., Fahey, P., and Cheung, R. T. H. (2023). Effect of surface inclination on vertical loading rate and footstrike pattern in trail and road runners. Sports Biomech. 00 (00), 1–10. doi:10.1080/14763141.2023.2278163
Stergiou, N. (2016). Nonlinear analysis for human movement variability. Boca Raton: CRC Press. doi:10.1201/9781315370651
Strogatz, S. H. (2015). Nonlinear dynamics and chaos: with applications to physics, biology, chemistry, and engineering 2nd edn. Boulder: Westview Press, a member of the Perseus Books Group.
TenBroek, T. M., Rodrigues, P. A., Frederick, E. C., and Hamill, J. (2014). Midsole thickness affects running patterns in habitual rearfoot strikers during a sustained run. J. Appl. Biomechanics 30 (4), 521–528. doi:10.1123/jab.2012-0224
Trinler, U., Schwameder, H., Baker, R., and Alexander, N. (2019). Muscle force estimation in clinical gait analysis using AnyBody and OpenSim. J. Biomechanics 86, 55–63. doi:10.1016/j.jbiomech.2019.01.045
Udin, G., Fernandez Menendez, A., Hoyois, J., Chevalier, M., and Malatesta, D. (2023). Time course of muscle activation, energetics and mechanics of running in minimalist and traditional cushioned shoes during level running. Sci. Rep. 13 (1), 5007–5014. doi:10.1038/s41598-023-31984-z
van Oeveren, B. T., Ruiter, C. J.De, Beek, P. J., and Dieën, J. H. V. (2021). The biomechanics of running and running styles: a synthesis. Sports Biomech. 00 (00), 1–39. doi:10.1080/14763141.2021.1873411
Wallot, S., and Mønster, D. (2018). Calculation of Average Mutual Information (AMI) and false-nearest neighbors (FNN) for the estimation of embedding parameters of multidimensional time series in matlab. Front. Psychol. 9 (1679), 1–10. doi:10.3389/fpsyg.2018.01679
Willwacher, S., and Weir, G. (2023). The future of footwear biomechanics research. Footwear Sci. 0 (0), 145–154. doi:10.1080/19424280.2023.2199011
Winter, L., Taylor, P., Bellenger, C., Grimshaw, P., and Robert, G. (2024). The application of the Lyapunov Exponent to analyse human performance: a systematic review. J. Sports Sci. 00 (00), 1994–2013. doi:10.1080/02640414.2024.2308441
World Athletic Council (2022). “Book C - C2.1A athletic shoe regulations,” in Book of rules. World Athletics.
Wouda, F. J., Giuberti, M., Bellusci, G., Maartens, E., Reenalda, J., Van Beijnum, B. J. F., et al. (2018). On the validity of different motion capture technologies for the analysis of running. Proceedings of the IEEE RAS and EMBS international conference on biomedical robotics and biomechatronics, 1175–1180. doi:10.1109/BIOROB.2018.8487210
Keywords: joint kinematics, midsole thickness, advanced footwear technology, stability, nonlinear analysis, maximum lyapunov exponent (MLE), detrended fluctuation analysis (DFA)
Citation: Kettner C, Stetter B and Stein T (2025) The effects of running shoe stack height on running style and stability during level running at different running speeds. Front. Bioeng. Biotechnol. 13:1526752. doi: 10.3389/fbioe.2025.1526752
Received: 12 November 2024; Accepted: 17 January 2025;
Published: 21 February 2025.
Edited by:
Tony Lin-Wei Chen, Hong Kong Polytechnic University, Hong Kong SAR, ChinaReviewed by:
Brian Hanley, Leeds Beckett University, United KingdomQichang Mei, Ningbo University, China
Copyright © 2025 Kettner, Stetter and Stein. This is an open-access article distributed under the terms of the Creative Commons Attribution License (CC BY). The use, distribution or reproduction in other forums is permitted, provided the original author(s) and the copyright owner(s) are credited and that the original publication in this journal is cited, in accordance with accepted academic practice. No use, distribution or reproduction is permitted which does not comply with these terms.
*Correspondence: Cagla Kettner, Y2FnbGEua2V0dG5lckBraXQuZWR1