 Xinhai Yue
 Ju Liu
- Department of Mechanics and Aerospace Engineering, Southern University of Science and Technology, Shenzhen, Guangdong, China
Introduction: Abdominal aortic aneurysm (AAA) is a life-threatening disease marked by localized dilatations of the infrarenal aortic wall. While clinical guidelines often use the aneurysm diameter as an indicator for surgical intervention, this metric alone may not reliably predict rupture risks, underscoring the need for detailed biomechanical analyses to improve risk assessments.
Methods: We investigate the effects of the multi-layered tissue architecture and the intraluminal thrombus (ILT) on the wall stress distribution of AAA. Using fluid-structure interaction, we analyze the biomechanical responses of fusiform and saccular AAAs under three conditions: without ILT, with ILT but no tissue degradation, and with both ILT and tissue degradation.
Results: The findings show that the media is the primary load-bearing layer, and the multi-layered model yields a more accurate stress profile than the single-layered tissue model. The ILT substantially reduces overall stress levels in the covered tissue, although its impact on the location of peak stress varies across different scenarios. Media degradation increases the stress in the intima and adventitia, but the cushioning effect of ILT largely mitigates this impact.
Discussion: The results underscore the importance of incorporating the multi-layered tissue architecture and ILT in patient-specific analyses of AAA. These factors may improve the predictive capabilities of biomechanical assessments for rupture risk.
1 Introduction
Abdominal aortic aneurysms (AAAs) are focal dilatations of the infrarenal aortic wall, often caused by localized weakening of the vessel wall. While most AAAs are asymptomatic, progressive expansion can lead to rupture with severe, life-threatening medical consequences. Untreated, a ruptured aneurysm carries a mortality rate as high as 85%, and even with timely medical intervention, the mortality rate exceeds 30% (Kent, 2014). This underscores the critical importance of accurately assessing AAA rupture risk. Clinically, the maximum diameter is used as an indicator for rupture potential and surgical intervention. This criterion is known to underestimate the rupture risk of small AAAs, especially in female patients (Moll et al., 2011). Additionally, for some patients with large AAAs, the risks associated with surgery may outweigh the risk of aneurysm rupture (Lederle et al., 2002). Consequently, a comprehensive risk assessment of AAAs based on multiple factors is essential for optimized patient management.
The arterial wall consists of three distinct layers: the intima, media, and adventitia, each playing a critical role in maintaining vascular function and regulating hemodynamic forces (Holzapfel et al., 2000). The intima, composed primarily of endothelial cells, provides a smooth surface for blood flow; the media, rich in smooth muscle cells, elastin, and collagen, modulates vascular diameter and elasticity, enabling the vessel to endure arterial pressure; the adventitia, composed of loose connective tissue, provides tensile strength and flexibility, thereby maintaining the structural integrity of vessels. Vascular smooth muscle cells within the media play a crucial role in processing the extracellular matrix, including the formation of elastin and collagen fibers. The degradation of these fibers and the reduction of the smooth muscle cells significantly contribute to the progression of AAAs.
To describe the material properties of arterial walls, Holzapfel et al. proposed using an isotropic model to represent the non-fibrous matrix and employed an exponential function to describe the fiber behavior (Holzapfel et al., 2000). Building on that, Gasser et al. introduced a fiber dispersion factor, capturing the symmetric fiber distribution around a mean orientation (Gasser et al., 2006). Holzapfel et al. later refined this model by incorporating a non-symmetric orientation density function, offering a more detailed representation of fiber distributions (Holzapfel et al., 2015). Several experimental studies have applied these models, or their variants, to determine layer-specific material parameters for both healthy and aneurysmal vessel walls (Weisbecker et al., 2012; Sassani et al., 2015; Niestrawska et al., 2016).
Intraluminal thrombus (ILT) refers to blood clots formed within vessels. Approximately 75% of AAAs contain thrombi (Tong and Holzapfel, 2015). While ILT typically functions to stop bleeding and repair blood vessels as part of the normal physiological process, it complicates the rupture risk assessment. Some studies suggest that aneurysm rupture may be correlated with increased ILT volume (Hans et al., 2005; Haller et al., 2018). A thicker ILT may lead to hypoxia in the adjacent AAA tissue, which may result in the degradation of the extracellular matrix and a significant reduction of wall strength (Vorp et al., 2001). Additionally, ILT may promote vascular smooth muscle cell apoptosis, leading to a thinner vascular wall beneath it (Koole et al., 2013). As a result, ILT can contribute significantly to AAA growth and elevate the rupture risk. Conversely, from a biomechanical standpoint, the thrombi also reduce the stress on the underlying AAA tissue, which may lower the rupture risk (Wang et al., 2002; Di Martino and Vorp, 2003; Throop et al., 2022). As a result, when assessing the rupture risk of AAA, the impact of ILT needs to be thoroughly studied.
Finite element analysis and fluid-structure interaction (FSI) are valuable tools for assessing the rupture risks of AAAs and understanding the biomechanical impact of ILT by evaluating the wall stress of AAAs. Traditional finite element analysis employs an idealized geometry and applies uniform internal pressure to simulate the load exerted by blood flows. Although this method offers computational simplicity, it fails to account for the pulsatile nature of blood flow, a critical factor in both AAA rupture and ILT formation. Consequently, this simplification may lead to an incomplete assessment of rupture risk. FSI offers more realistic simulation results by integrating the interaction between fluid (e.g., blood) and structure (e.g., arterial wall and ILT). It is noted that the enhanced accuracy of FSI comes at the cost of increased modeling complexities. Early studies relied on idealized geometric models and isotropic material assumptions for both the aneurysm and ILT (Di Martino and Vorp, 2003; Scotti et al., 2005). Although these models provided valuable insights, they lacked the fidelity to accurately represent the patient-specific geometries and physiologically realistic material properties.
With advancements in medical imaging, patient-specific geometries of AAAs and ILTs have been incorporated into both finite element and FSI analyses, enabling more accurate predictions of wall stress distribution (Maier et al., 2010). This enhanced modeling capability is crucial for assessing rupture risk, particularly when combined with the spatial distribution of wall strength. Given the anisotropic nature of vascular tissues, contemporary analyses have increasingly adopted anisotropic material models (Rodríguez et al., 2009; Riveros et al., 2015; Rissland et al., 2009; Xenos et al., 2010; Xenos et al., 2015). Studies have demonstrated that stress magnitudes derived from anisotropic models are significantly higher than those from isotropic models, underscoring the importance of incorporating anisotropic models to accurately represent material properties (Rodríguez et al., 2009; Rissland et al., 2009). Moreover, accounting for the layered tissue structure allows for a more refined transmural stress distribution, as each layer exhibits distinct mechanical behaviors essential for a comprehensive understanding of AAA biomechanics (Simsek and Kwon, 2015; de Lucio et al., 2021). Notably, degeneration of the media has been incorporated to explore mechanisms underlying AAA initiation and progression (Simsek and Kwon, 2015). Regarding the impact of ILT on AAA stress conditions, most studies indicated that ILT significantly affects the stress distribution on the aneurysm wall, with the maximum wall stress typically occurring in regions where the ILT is thinnest (Riveros et al., 2015). Interestingly, one study noted that while ILT affects stress magnitude, it does not significantly alter the site of the peak stress (Xenos et al., 2015).
Given these inconsistent findings, it is evident that current models may not fully capture the complexities of AAA biomechanics. Our research aims to address these gaps by developing a more comprehensive approach that incorporates the layered structure of the vascular wall, anisotropic material properties, ILT, and ILT-induced media degradation. To achieve these objectives, this work is organized as follows. Section 2.1 presents the geometric modeling method for ILT and the layered architecture of the AAA wall. It also details the procedure for generating a local coordinate system for the solid mesh, which facilitates the description of the anisotropic tissue models. Section 2.2 presents the FSI formulations employed in this study, including the physiological boundary conditions for the simulations. Section 2.3 introduces the material models applied in the simulations, including the anisotropic hyperelastic model for the AAA tissue and the isotropic hyperelastic model for the ILT. Section 3 presents the FSI analyses conducted on both fusiform and saccular AAAs. For cases with multi-layered tissue model, layer-specific material parameters are used to describe the intima, media, and adventitia of the AAA wall. We compare the maximum principal stress (MPS) distribution, focusing on layer-specific stress distributions under three conditions: (1) without ILT, (2) with ILT but no tissue degradation, and (3) with both ILT and degradation. We discuss our findings in Section 4 and draw conclusions in Section 5. Limitations of this study is discussed in Section 6.
2 Methods
2.1 Geometric modeling
We start by presenting an image-based geometric modeling pipeline for AAA with ILT. The geometric model is essential for the subsequent FSI analysis. The process begins by identifying the pathline for the lumen of interest from medical images. Along the pathline, two-dimensional segmentations are employed on the planes perpendicular to the pathline to extract the contour lines for the lumen. The contour lines are represented by closed B-spline curves, defined by a series of control points. Lofting these contour lines along the pathline results in a smooth tubular spline surface. It describes the luminal surface and is also regarded as the interior tissue wall surface without the presence of ILT. To construct the exterior tissue wall surface, a new set of contour control points is generated. These points are collinear with the lumen centroid and the interior surface contour control points, with their distance to the centroid increased by a thickness value
To account for the multi-layered architecture of vascular tissues, we extend the above procedure to construct additional contour lines that delineate the intima, media, and adventitia. As shown in Figure 1, starting from the contour lines of the lumen surface, three new sets of contour lines are generated using the thickness
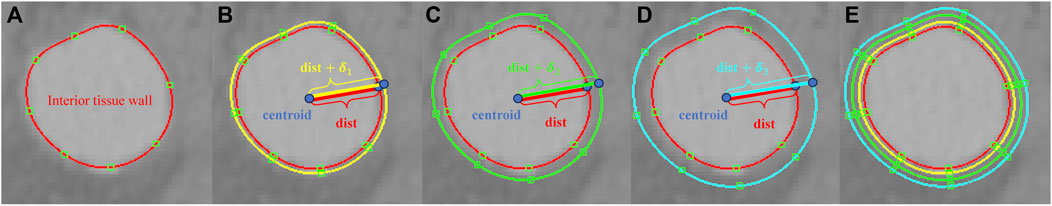
Figure 1. (A) A contour line for the lumen surface on a 2D slide of a medical image; (B) the contour line for the exterior surface of the intima generated by scaling with the thickness
When the vascular vessel contains ILT, the lumen wall surface differs from the interior tissue wall surface, necessitating a refinement of the above procedures. On planes perpendicular to the pathline, we extract the contour lines for both the lumen wall and the interior wall surface of the tissue (Figure 2). These contours are lofted to generate the lumen surface and interior tissue surface, respectively. With the inlet and outlet surfaces closed, we obtain two distinct tubular volumes based on the two wall surfaces. A boolean subtraction operation is then performed to isolate the ILT volume, preparing it for mesh generation.
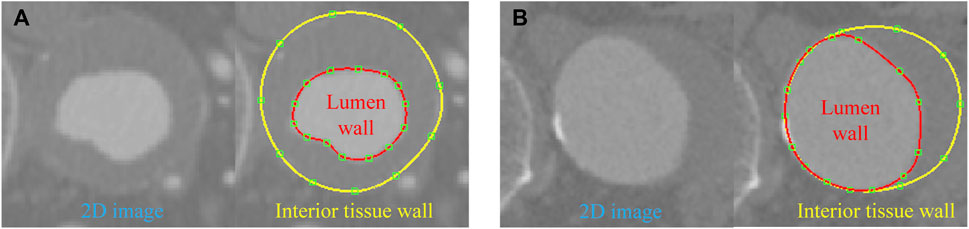
Figure 2. Contour lines delineated for the lumen and interior tissue wall surfaces in two cases: (A) ILT completely covers the aneurysm wall; (B) ILT covers a portion of the aneurysm wall.
With the geometric representation established, a mesh generation algorithm can be applied for discretization. We start by generating the mesh for the luminal domain, and a boundary layer mesh may be created using the advancing layer method. Once the lumen mesh is obtained, we proceed to create the mesh for the ILT, if present; otherwise we generate the mesh for the intima. At this stage, the discrete B-Rep is strictly adhered to, meaning that the luminal mesh remains unmodified. In doing so, the meshes of both domains match across their interface. In FSI analysis, the matching interface property conveniently ensures the proper coupling conditions (Sun et al., 2025b). Analogously, with the mesh of the intima, one may proceed to generate the mesh for the media which conforms to the intima mesh. Finally, the mesh for the adventitia can be generated with a conforming discrete representation of the interface between adventitia and media.
To characterize the anisotropic behavior of the tissue, we define the local radial, circumferential, and axial directions using a morphology-based approach introduced in Sun et al. (2025a). Here we briefly outline the procedures for a single layer, and one needs to repeat the procedures for each layer. We first compute the outward normal vectors for the mesh nodes on both the interior and exterior wall surfaces of the tissue layer. This can be achieved using mature algorithms developed for polygon surfaces. For a generic point
where the weights
respectively. Next, we extract the centerline of the lumen. For the point
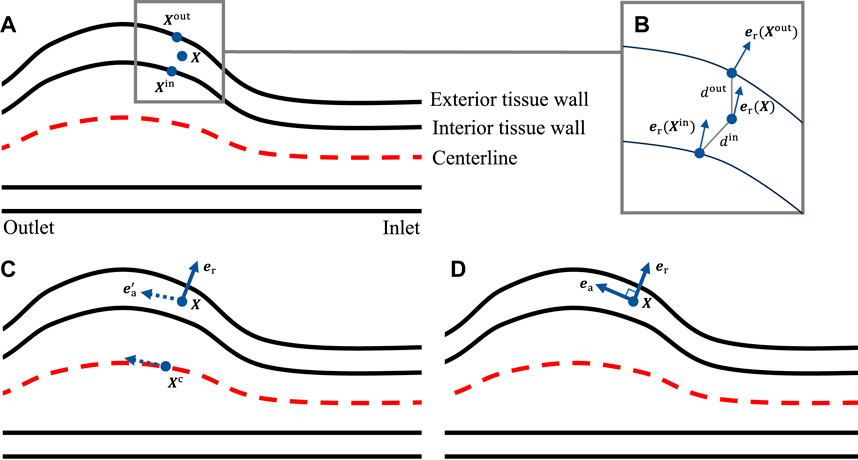
Figure 3. (A) Locating the closest points on the interior and exterior tissue wall; (B) evaluating the local radial direction; (C) identifying the closest point on the centerline to get the pseudo-local axial direction; (D) evaluating the local axial direction.
In this study, CT images from VMR (2024) are used to construct the geometries of two aneurysmal models: a fusiform (fAAA) and a saccular (sAAA) model1. The fAAA is taken from a 70-year-old male, with a maximum diameter of 3.65 cm. The sAAA is taken from a 48-year-old male, with a maximum diameter of 5.0 cm. Both contain ILT. It should be note that the CT images do not provide information on the tissue thickness. Therefore, the thickness values from the literature are adopted in this study. For geometries based on the single-layered tissue model, the tissue thickness is set to 2.69 mm. For the multi-layered tissue model, the intima, media, and adventitia thicknesses are set to 0.68 mm, 0.94 mm, and 1.07 mm, respectively (Weisbecker et al., 2012; de Lucio et al., 2021). The multi-layered geometric models are shown in Figure 4. For geometries with ILT, we first construct the original ILT volume using the aforesaid procedure. Two additional geometries, each with a smaller ILT volume, are created by virtually enlarging the lumen contours. The lumen and ILT geometries are shown in Figure 5. The mesh is generated using linear tetrahedral elements. After mesh generation, the local basis vectors are established, with the local circumferential and axial directions shown in Figure 6.
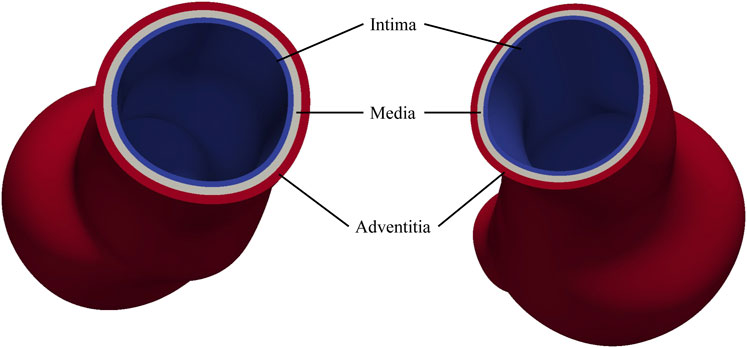
Figure 4. Multi-layered AAA geometric models.
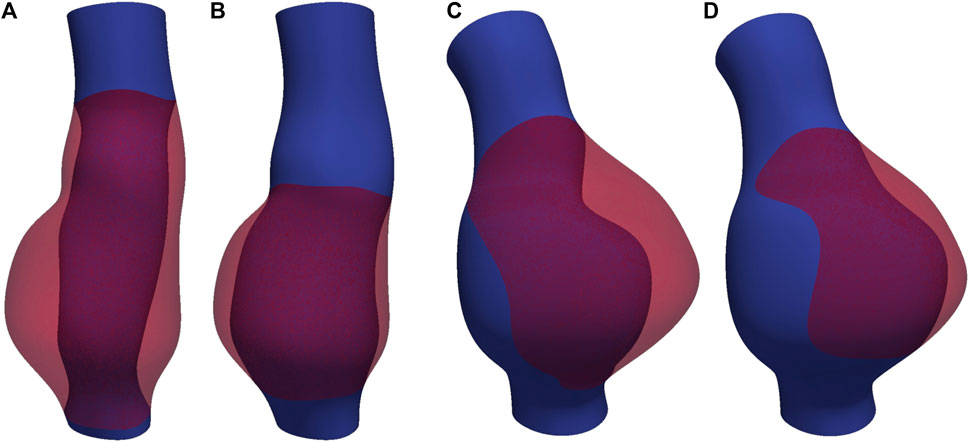
Figure 5. The lumen and ILT of (A) fAAA with the original volume of ILT, (B) fAAA with a smaller volume of ILT, (C) sAAA with the original volume of ILT, and (D) sAAA with a smaller volume of ILT.
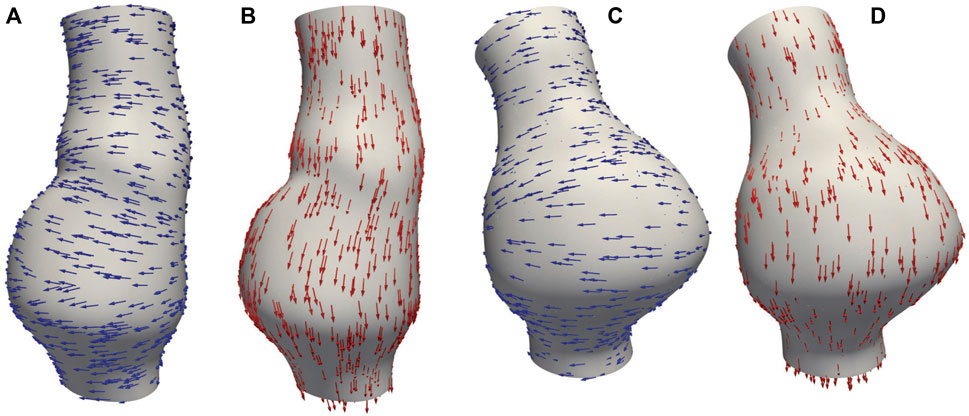
Figure 6. (A) Circumferential basis vectors of fAAA; (B) axial basis vectors of fAAA; (C) circumferential basis vectors of sAAA; (D) axial basis vectors of sAAA.
2.2 Formulation of the FSI problem
In this section, we start by introducing the governing equations for both the solid and fluid subproblems. The time interval of interest is
2.2.1 Governing equations
The fluid subproblem characterizes the blood flow and is governed by the incompressible Navier-Stokes equations written in the arbitrary Lagrangian-Eulerian formulation (Liu and Marsden, 2018). Regarding the tissue and ILT, we treat them as elastic materials with distinct properties. We introduce a superscript
for
and the constitutive relations for
respectively. The forms of the free energies
2.2.2 Coupling conditions
The fluid-solid interface is the intersection between the fluid subdomain and the union of all solid subdomains. The
Second, the dynamic coupling condition demands the traction exerted by both domains on their interface must be equal in magnitude but opposite in direction. Again, with the mesh continuity, the continuity of the test functions across the interfaces leads to the satisfaction of the dynamic coupling condition in the variational sense. It needs to be pointed out that this condition results in a pressure jump across the interfaces. To properly account for the pressure discontinuity, a set of additional pressure nodes needs to be introduced over the interfaces (Sun et al., 2025b).
2.2.3 Numerical settings
In the numerical treatment of the FSI problem, we employ equal-order interpolations for both the velocity and pressure. The variational multiscale formulation is invoked to provide the mechanisms of large eddy simulation and pressure stabilization (Liu and Marsden, 2018). Regarding the temporal discretization, the JWH-generalized-
In the FSI analysis, the vessel wall on the inlet and outlet plane surfaces is fully clamped. The exterior wall surface of the vessel is set to be traction-free. A parabolic velocity profile is applied at the inlet with a pulsatile flow rate. On the outlet, a lumped parameter model is introduced to mimic the response of the downstream vasculature. In this work, we adopt the resistance model for the single-outlet problem, and it is given by
2.3 Material models
In this study, both the ILT and AAA tissue are modeled as quasi-incompressible hyperelastic materials. We momentarily ignore the superscript
with
It is worth mentioning that (Equation 3) is related to the volumetric energy
The ILT is modeled by an isotropic hyperelastic material (Di Martino and Vorp, 2003; Rodríguez et al., 2009) with the energy
where
In this model,
The unit-length vectors
Combined with the local basis vectors generated in Section 2.1, we may define the mean orientations of the two fiber families at each quadrature point for a patient-specific model.
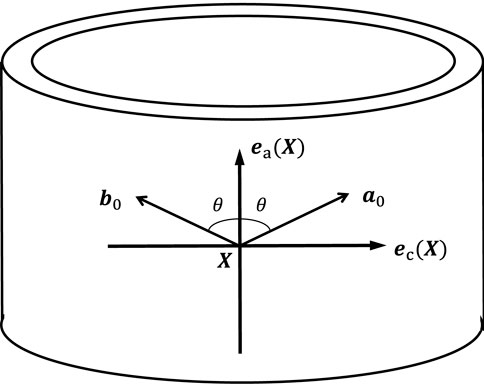
Figure 7. Illustration of the mean orientations of the two fiber families within the plane spanned by
3 Results
In this section, we perform FSI analysis and discuss the results. Section 3.1 compares the results obtained with single-layered versus multi-layered wall models; Section 3.2 examines the influence of ILT using multi-layered wall model by comparing cases with and without ILT; in Section 3.3, we investigate the media degradation caused by ILT by virtually introducing a degradation zone in the media. In all three sections, the average MPS is calculated to capture the overall stress distribution in the region of interest, enabling comparisons across cases. In Sections 3.1, 3.2, we also identify the location of the maximum MPS, which is essential for determining the regions within the highest rupture risk. Comparing these high-stress locations across cases, we gain insights into the influence of different factors on wall stress distribution.
In this study, the fluid density is set to
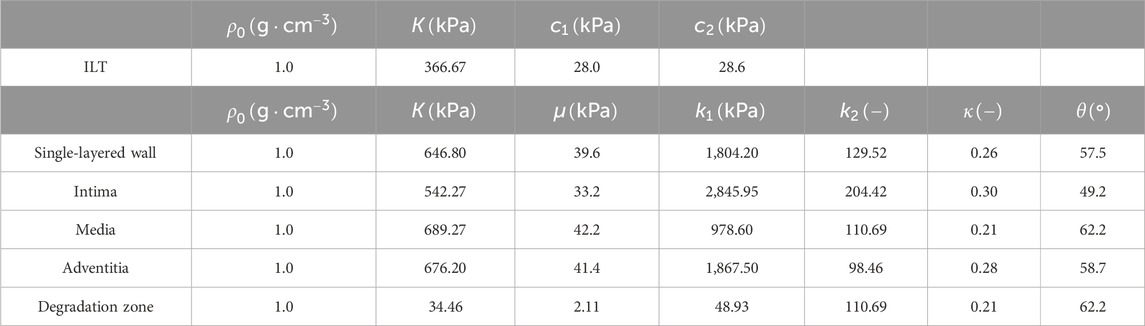
Table 1. The material parameters of ILT, intima, media, adventitia, and single-layered AAA wall.
To gain insights into the above material models and parameters, we consider a thin-walled tube problem as a preliminary analytical test of the anisotropic material model (Gasser et al., 2006). Assuming incompressibility, the internal pressure
where
where the invariants
Solving (Equations 5, 6) with a series of prescribed values of
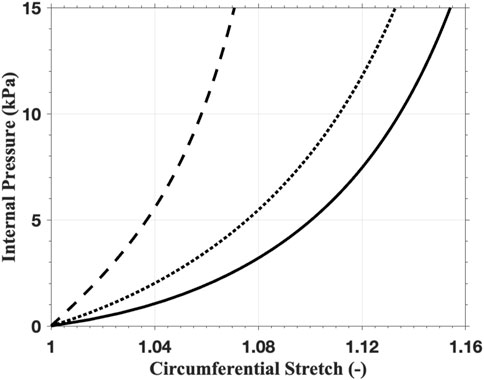
Figure 8. The mechanical response of the thin-walled tube with the anisotropic material model using the parameters of intima (solid line), media (dashed line), and adventitia (dotted line).
In the FSI analysis, the inlet flow boundary condition is depicted in Figure 9. The Vascular Model Repository provides the original inlet flow boundary condition at the proximal end of the descending aorta (VMR, 2024). The original flow rate is scaled based on the blood flow distribution ratio to determine the inlet flow rate of the AAAs. In this study, the distribution ratio is taken as 28.2% for both AAA models. The parameters for the outflow boundary condition are listed in Table 2. The parameters of the lumped parameter model are determined through parameter tuning, ensuring that the outlet pressure remains within the physiological range. The outlet pressure curves, shown in Figure 10, follow a similar pattern across all cases in this study, with the pressure value ranging from 70 mmHg (diastolic pressure) to 105 mmHg (systolic pressure), reflecting typical physiological conditions.
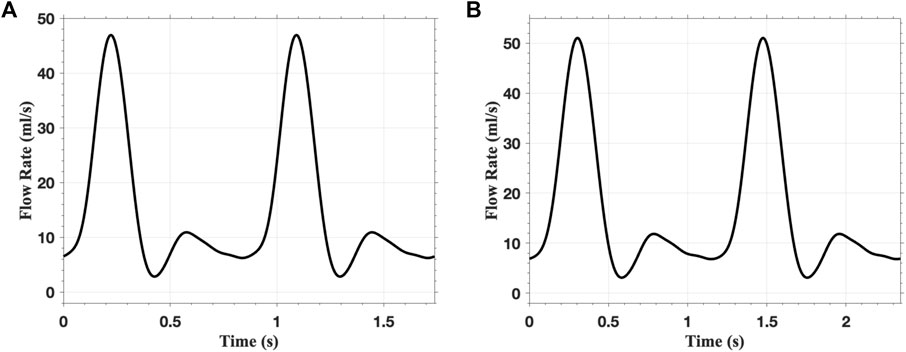
Figure 9. The flow rate applied at the inlet of (A) fAAA and (B) sAAA for two cardiac cycles.
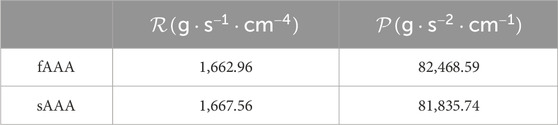
Table 2. The parameters for resistance boundary condition at the outlet.
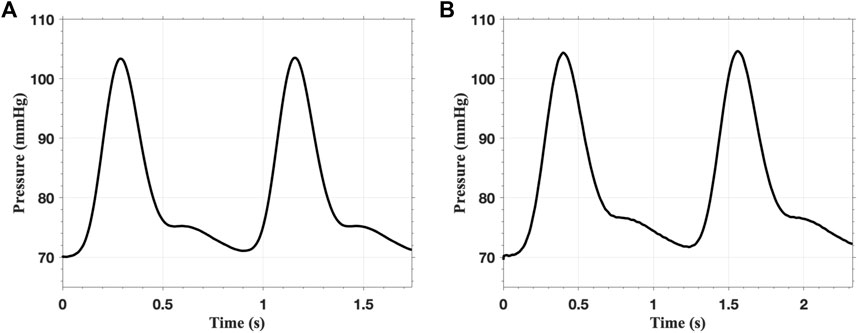
Figure 10. The pressure on the outlet of (A) single-layered fAAA and (B) single-layered sAAA for two cardiac cycles.
For the fAAA (sAAA) cases, the time step size is set to be
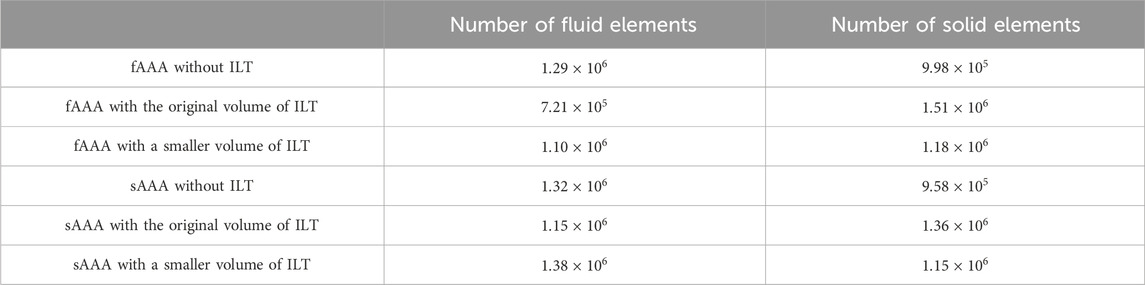
Table 3. The spatial discretization for different cases.
3.1 Multi-layered AAA tissue model
We compare the FSI analysis results of AAAs with the vessel wall modeled as either multi-layered or single-layered tissue. The MPS distributions are shown in Figure 11. Note that both sides of the cross-sectional plane are illustrated in the visualization of the stress distribution in this and subsequent figures. The single-layered model exhibits a smooth transmural stress distribution, with the stress decreasing from the interior side to the exterior side of the tissue wall. In contrast, the multi-layered model indicates that the stress is significantly higher in the media compared to the rest two layers. For fAAA, the single-layered model predicts an average stress of
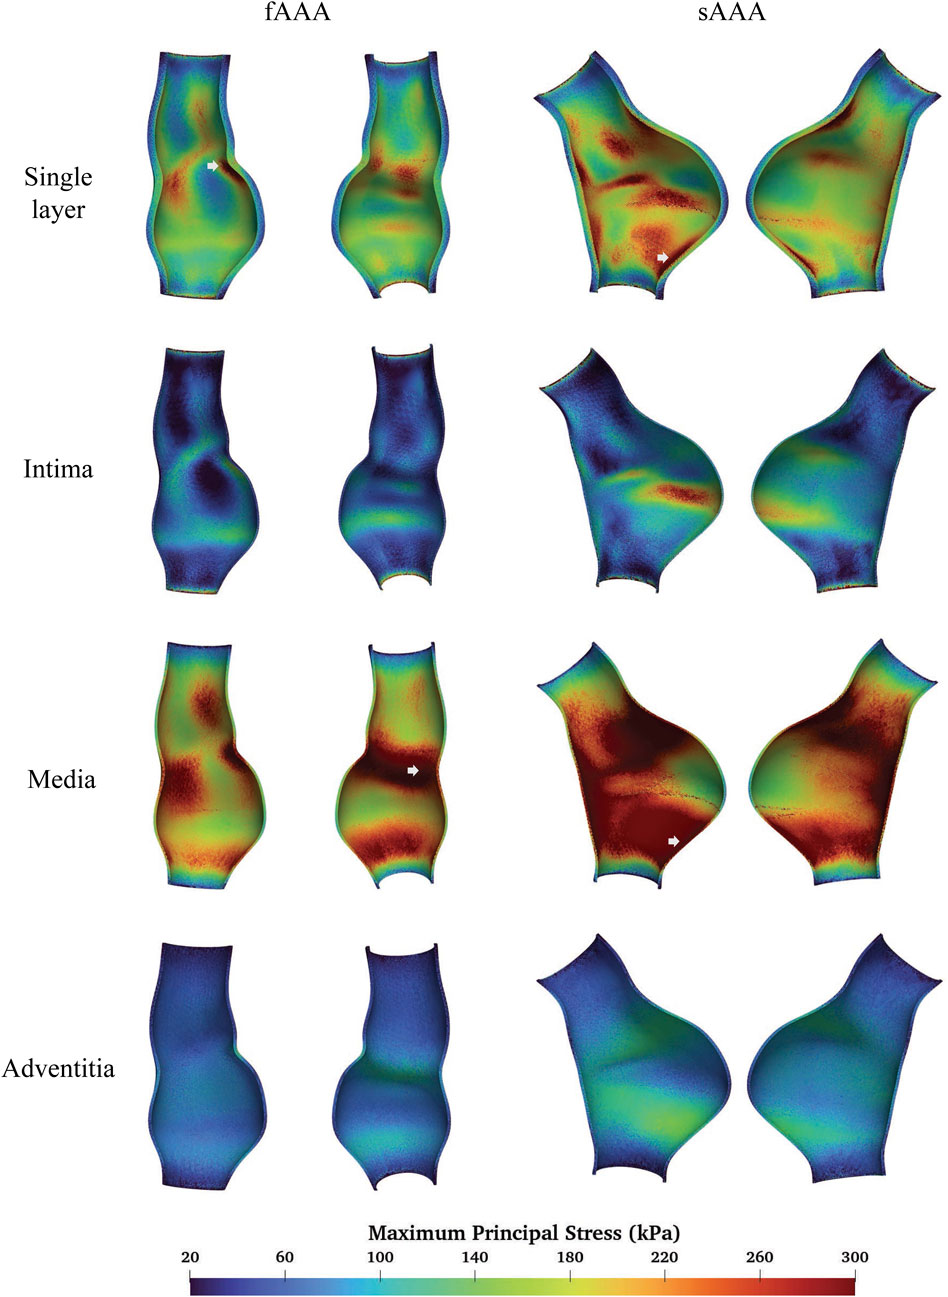
Figure 11. The MPS given by the single-layered and multi-layered tissue models and the location of maximum MPS.
When predicting the region of high stress, both single-layered and multi-layered models yield similar results, with high-stress areas primarily located near the proximal and distal ends of the aneurysms and lower stress observed within the aneurysms themselves. Figure 11 highlights the regions of the maximum MPS with arrows, showing that both models predict the location of these high-stress regions similarly. For fAAA (sAAA), the maximum MPS is
3.2 ILT
To study the impact of ILT on the aneurysm, we consider the following four cases:
fAAAw1: fusiform AAA with the original volume of ILT;
fAAAw2: fusiform AAA with a reduced volume of ILT;
sAAAw1: saccular AAA with the original volume of ILT;
sAAAw2: saccular AAA with a reduced volume of ILT.
Figures 12, 13 depict the distribution of the MPS in both the ILT and aneurysm tissue. It can be observed that the MPS within the ILT is relatively low, decreasing smoothly from the luminal surface towards the abluminal surface. Table 4 presents the average MPS in the ILT and different tissue layers across the different cases. As shown in the table, the average stress level in the ILT is lower than that in the intima and adventitia. Again, the media exhibits the highest stress among the three layers.
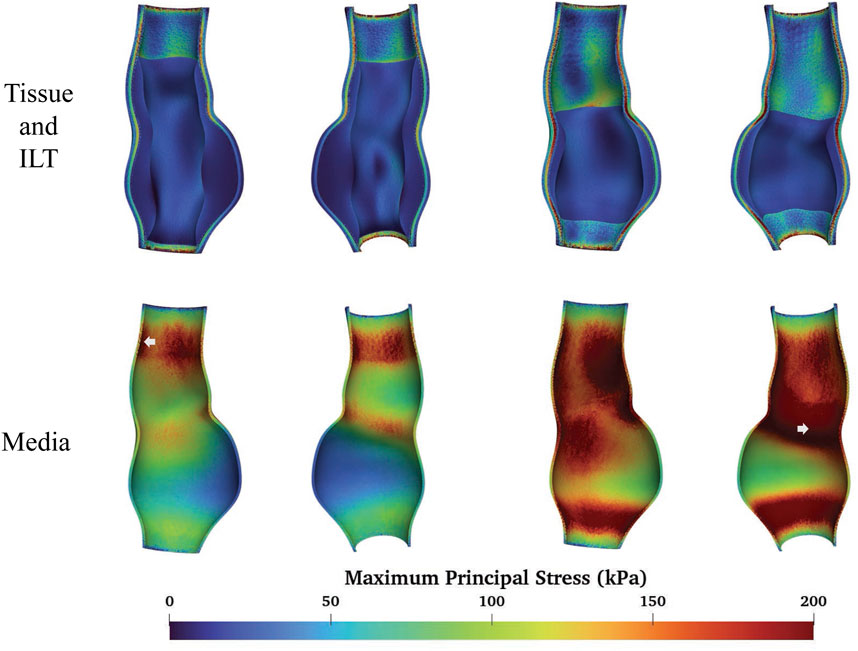
Figure 12. The MPS of fAAAs with ILT and the location of maximum MPS.

Figure 13. The MPS of sAAAs with ILT and the location of maximum MPS.
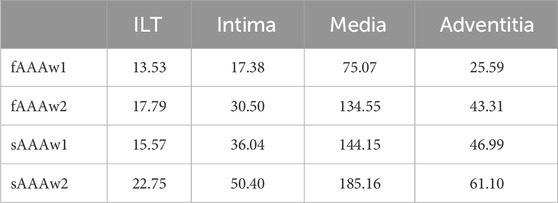
Table 4. The average MPS of ILT, intima, media, and adventitia, with units in
As shown in Figures 12, 13, compared to the results of Section 3.1, the presence of ILT significantly reduces the stress within the aneurysm tissue, leading to decreases in average stress in the media by
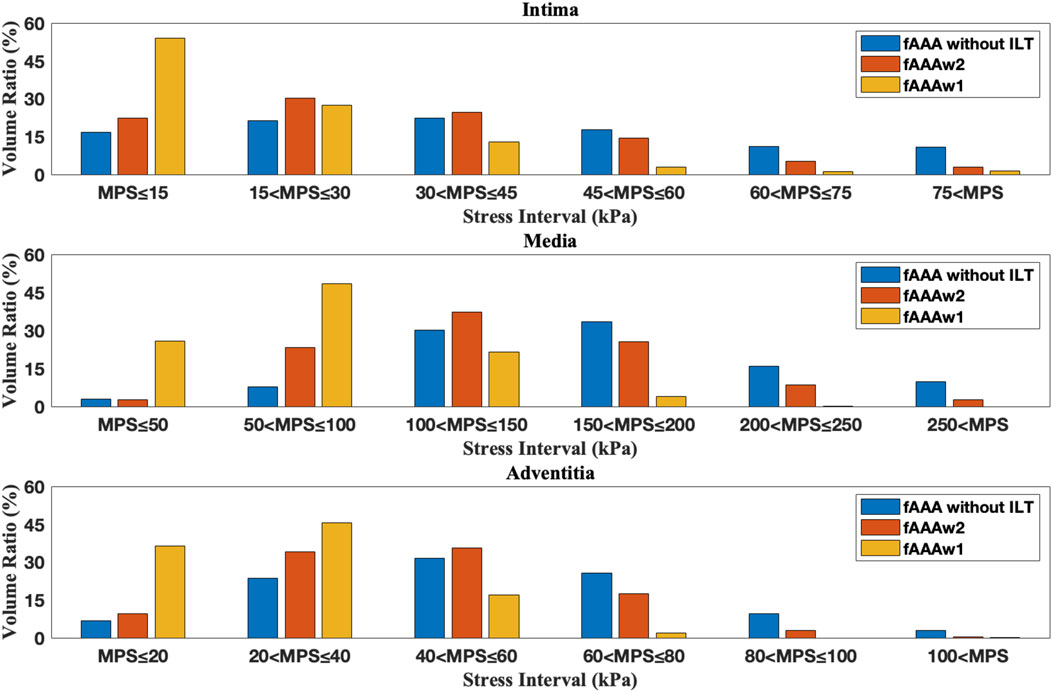
Figure 14. The volume ratio of stress intervals for multi-layered fAAA without ILT, fAAAw1, and fAAAw2.
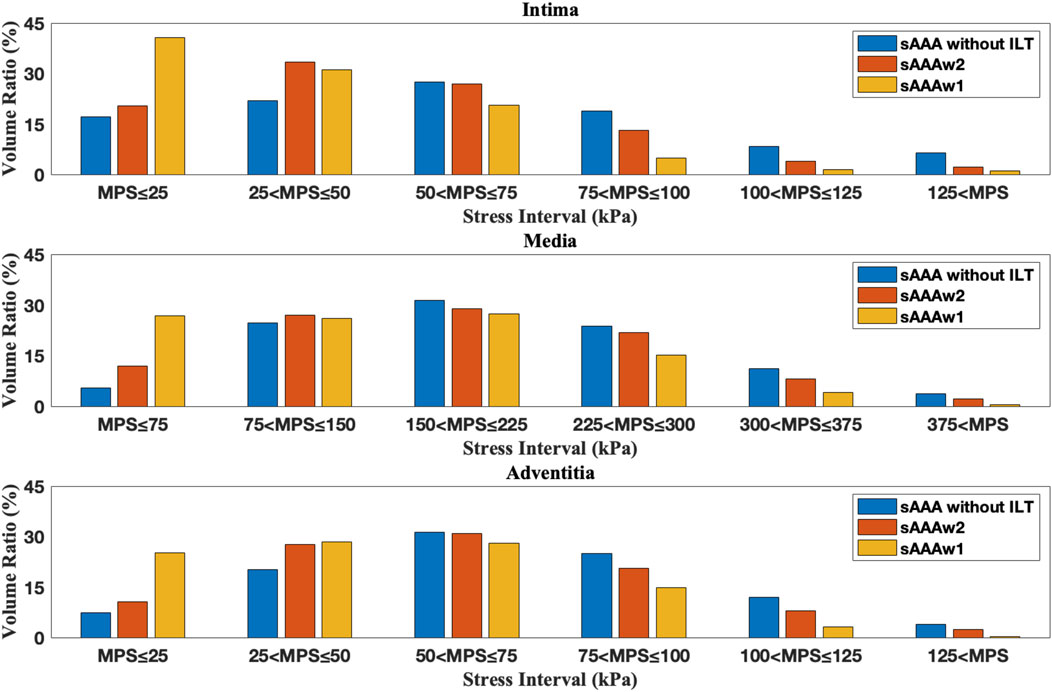
Figure 15. The volume ratio of stress intervals for multi-layered sAAA without ILT, sAAAw1, and sAAAw2.
3.3 Media degradation
We further examine the degradation of the media induced by ILT. In regions with thick ILT, degradation zones are virtually designated in the media. The examples in this section, named fAAAd1, fAAAd2, sAAAd1, and sAAAd2, correspond to the cases fAAAw1, fAAAw2, sAAAw1, and sAAAw2 from Section 3.2, with the introduction of degradation zones. As shown in Figure 16, the stress within the degradation zones of the media is significantly lower than that in the surrounding areas. In contrast, for the intima and adventitia, the stress within the degradation zones is slightly higher than in the neighboring areas. Table 5 presents the average MPS values for each tissue layer before and after introducing the degradation zones, along with the respective differences. The results indicate that the stress in the media significantly decreases in the degradation zones, while the stress in the rest two layers increase. Additionally, Table 6 presents the maximum MPS values for intima and adventitia before and after introducing the degradation zones, along with the respective differences. Tables 5, 6 show that, in cases with larger ILT volumes, the stress increase in the intima and adventitia is smaller than in cases with smaller ILT volumes. This suggests that, under similar degradation conditions, a thicker ILT mitigates the weakening effect on the tissue caused by degradation. Additionally, we further investigate the influence of the degradation zone on the volume ratios. Figures 17, 18 show that media degradation has minimal effect on the volume ratios across all three tissue layers. Consequently, the impact of the degradation zone is localized.
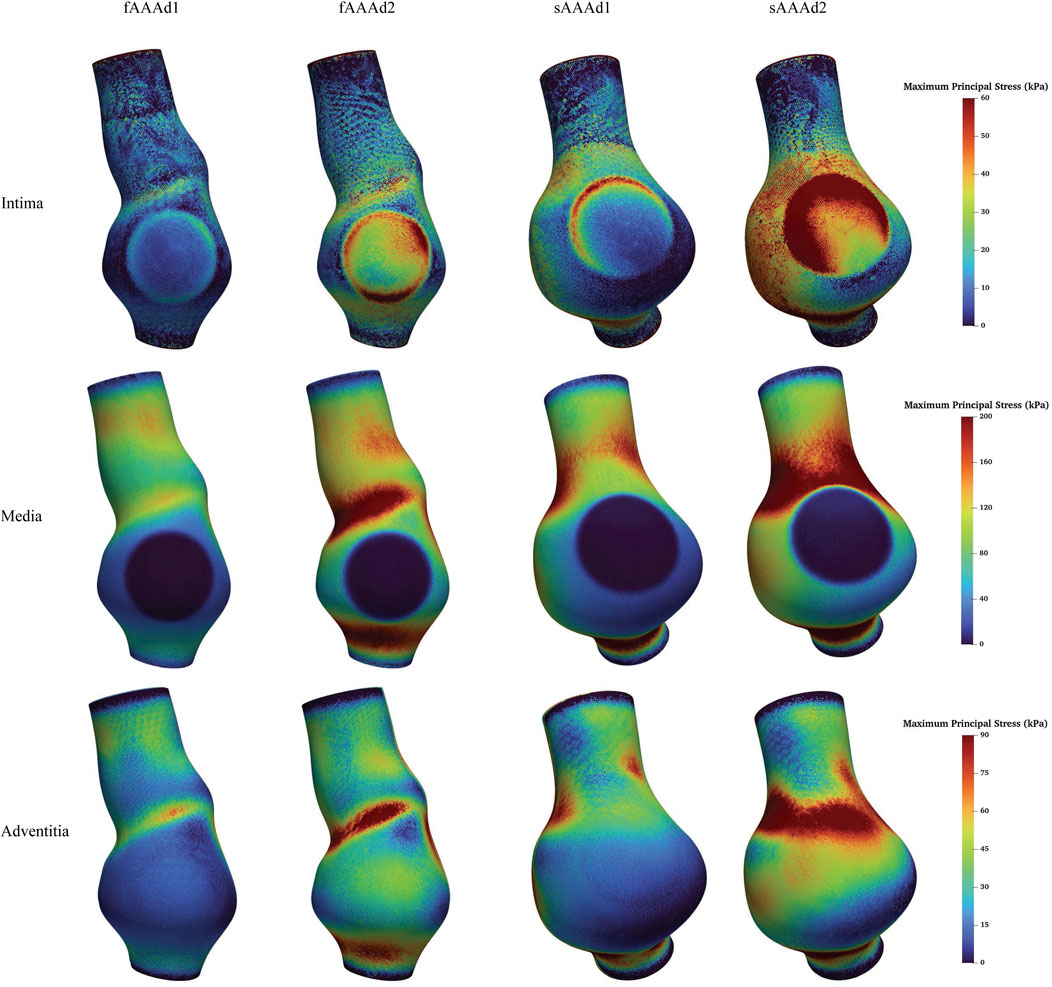
Figure 16. The MPS in the cases with media degradation.
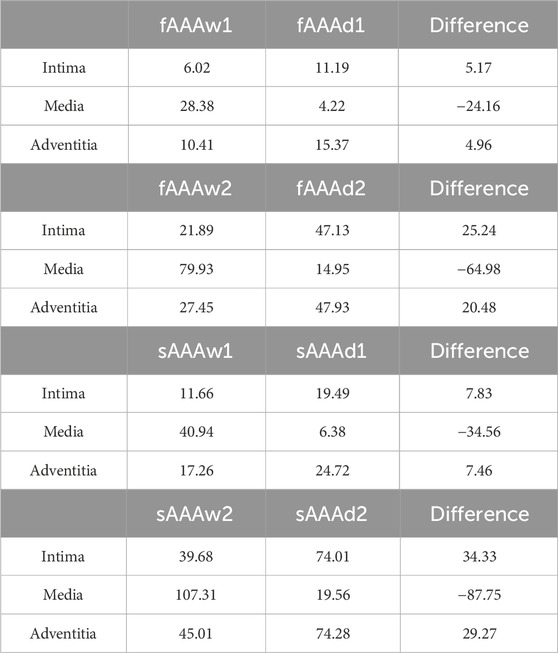
Table 5. The average MPS of intima, media, and adventitia in the media degradation cases, with units in
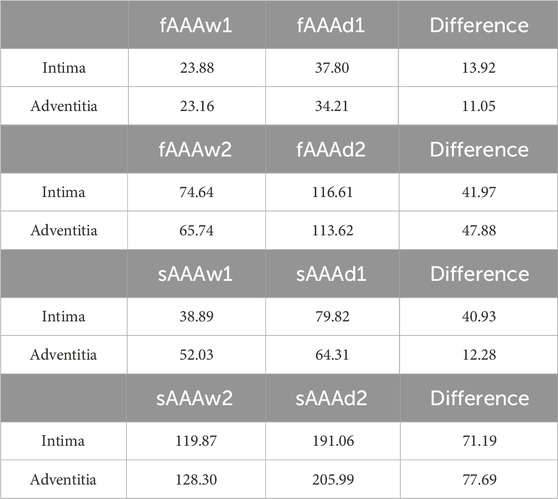
Table 6. The maximum MPS of intima and adventitia in the media degradation cases, with units in
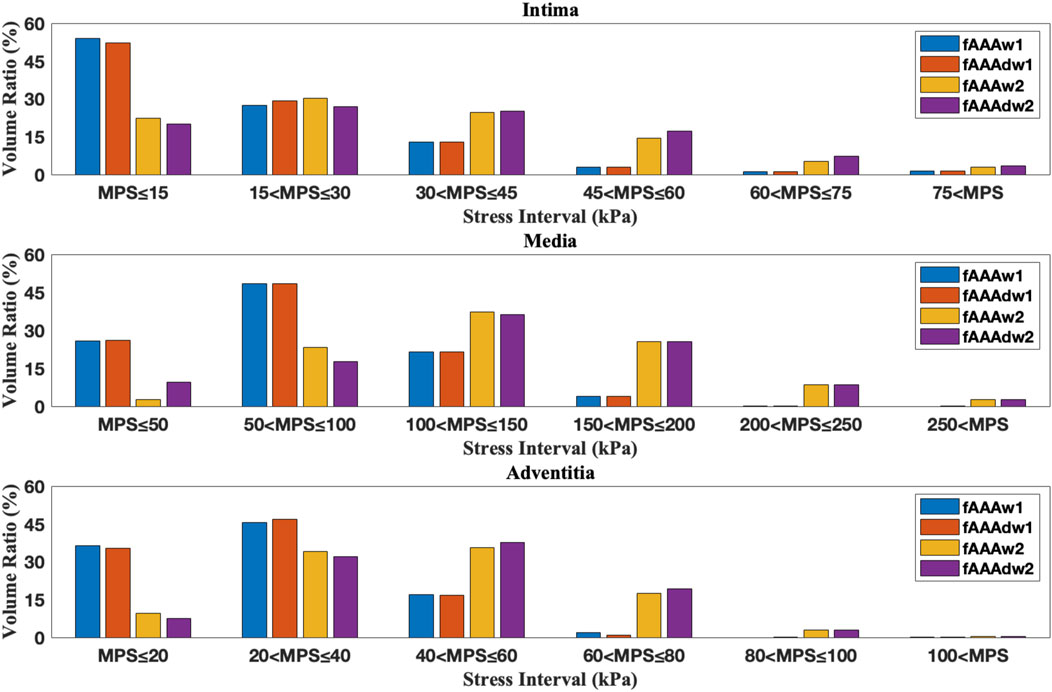
Figure 17. The volume ratio of stress intervals for fAAAw1, fAAAw2, fAAAdw1, and fAAAdw2.
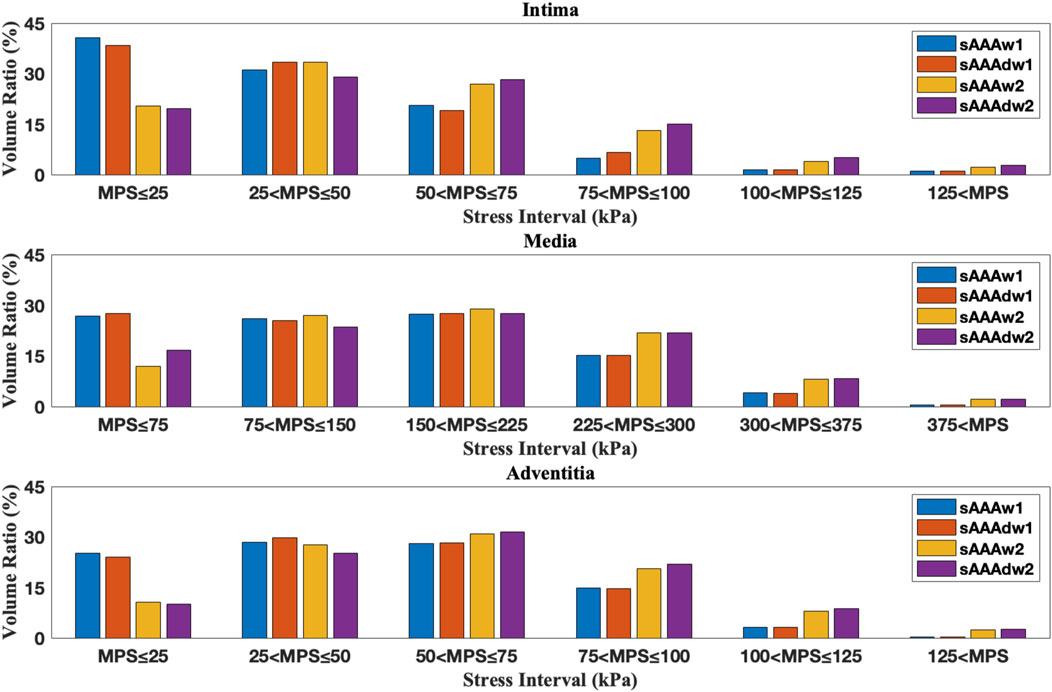
Figure 18. The volume ratio of stress intervals for sAAAw1, sAAAw2, sAAAdw1, and sAAAdw2.
4 Discussion
Previous studies have applied layered models for stress analysis in cardiovascular diseases, and they reported similar stress distributions across the tissue layers, with the media experiencing the highest stress, followed by the adventitia, and then the intima (Gao et al., 2013; Simsek and Kwon, 2015; Fan et al., 2024). This suggests that the media serves as the primary load-bearing layer of the vessel under physiological loading. Likewise, the work of Simsek suggests that when the media degrades, the intima and adventitia take on a greater load (Simsek and Kwon, 2015), aligning well with our findings. According to Sassani, in the case of three-layered wall rupture, the stress in the adventitia exceeds that in the media, with both layers bearing higher stress than the intima. This highlights the adventitia’s role in maintaining vascular structural integrity when the media degrades (Sassani et al., 2015). From this discussion, it is clear that compared to single-layered tissue models, multi-layered tissue models provide valuable insights into the biomechanical responses of the individual layers and their distinct roles in bearing physiological loads. Therefore, when analyzing stress distributions in vascular tissues, a physiologically detailed model should be considered. However, we also note that there is no significant difference in the time-averaged wall shear stress between the single-layered and multi-layered models, indicating that hemodynamic forces are less sensitive to the choice of the tissue model. This is consistent with our prior study (Sun et al., 2025a).
Numerous studies have investigated the biomechanical effects of ILT, especially regarding its impact on the location of the maximum stress. Throop et al. emphasized that it can significantly alter the location of the peak stress (Throop et al., 2022). Riveros et al. found that the region of the maximum stress often coincides with the thinnest part of the ILT (Riveros et al., 2015). Conversely, Xenos et al. reported that ILT had little impact on the location of the maximum stress (Xenos et al., 2015). Our findings suggest that whether ILT affects the location of the maximum MPS depends on whether the ILT sufficiently covers the area of the peak stress. These varying results underscore the complex role ILT plays in aneurysm biomechanics and highlight the need for further patient-specific studies to better understand its effects on stress distribution and rupture risk.
Our study demonstrates that, under equivalent conditions of degradation, a thinner ILT provides significantly less biomechanical protection to the affected region compared to a thicker ILT. However, in the specific cases analyzed in this study, even with increased stress levels observed in the intima and adventitia after degradation, the stress levels remained lower compared to the failure stress reported by Sassani et al. (2015), which are 276.8 kPa (axial) and 511.1 kPa (circumferential) for intima, 957.5 kPa (axial) and 1728.2 kPa (circumferential) for adventitia, even when the ILT was relatively thin. This suggests that, in these scenarios, the presence of a thinner ILT does not substantially increase the rupture risk. Since our model constructed the degradation regions virtually, we believe that more sophisticated models are needed to explore the impact ILT might have on aneurysm rupture. This should include accounting for the local thickness of the ILT (Vorp et al., 2001) and the age of ILT formation (Tong et al., 2011). These factors are crucial for accurately predicting the protective or detrimental effects of ILT on aneurysm stability.
5 Conclusion
In this study, we investigated the biomechanical behavior of AAA by incorporating the layered architecture of the vascular wall, anisotropic material properties, and the effects of ILT, particularly its role in media degradation. Through detailed FSI analysis of both fusiform and saccular AAAs, we compared the MPS distribution under various conditions: with ILT, with ILT but no degradation, and with both ILT and degradation. The results offer valuable insights into the stress variations within each layer of the aneurysm wall, enhancing our understanding of AAA biomechanics and the potential impact of ILT on aneurysm progression.
The multi-layered AAA tissue model, compared to the single-layer model, offers a more detailed transmural stress distribution, with the media serving as the primary load-bearing component of the aneurysm tissue. Moreover, the presence of ILT significantly reduces the stress levels in the aneurysm wall beneath it. However, ILT does not necessarily affect the location of the maximum stress. Degradation of the media increases stress levels in both the intima and adventitia.
In the future, we will build upon the current multi-layered anisotropic hyperelastic model by incorporating a viscoelastic model to better capture the biomechanical properties of vascular tissues. By combining this approach with existing FSI tools, we will be able to more accurately model cardiovascular and cerebrovascular diseases, thereby enhancing our understanding of the biomechanical mechanisms underlying these conditions.
6 Limitations
The sample size used in the experiments is relatively small. While the data collected provide valuable insights into the studied topic, the limited sample size may affect the generalizability of the findings to a broader population. Specifically, the small sample size introduces a risk of bias due to individual differences. For instance, AAAs with a maximum diameter exceeding 5.5 mm were not included in this study, which may limit the applicability of our results to small AAAs. Nevertheless, the main conclusions of this study remain consistent with findings from existing studies (Simsek and Kwon, 2015; Xenos et al., 2015; Riveros et al., 2015).
Furthermore, for the purpose of using FSI to diagnose AAA, obtaining additional patient-specific information, such as material properties, is essential and challenging. In this study, we used the same material parameters derived from experimental data to describe ILT and AAA tissue (Di Martino and Vorp, 2003; Sassani et al., 2015). However, as the results obtained using the multi-layered model align with both the functional roles of different layers (Holzapfel et al., 2000) and the experimental findings (Sassani et al., 2015), the conclusions of this study remain reliable.
Data availability statement
The raw data supporting the conclusions of this article will be made available by the authors, without undue reservation.
Ethics statement
The studies involving humans were approved by Southern University of Science and Technology Institutional Review Board. The studies were conducted in accordance with the local legislation and institutional requirements. Written informed consent for participation was not required from the participants or the participants’ legal guardians/next of kin in accordance with the national legislation and institutional requirements.
Author contributions
XY: Conceptualization, Data curation, Investigation, Methodology, Software, Validation, Visualization, Writing–original draft. JH: Writing–review and editing. JL: Conceptualization, Funding acquisition, Software, Supervision, Writing–review and editing.
Funding
The author(s) declare that financial support was received for the research, authorship, and/or publication of this article. This work is supported by the National Natural Science Foundation of China [Grant Numbers 12172160, 12472201], Shenzhen Science and Technology Program [Grant Number JCYJ20220818100600002], Southern University of Science and Technology [Grant Number Y01326127], and the Department of Science and Technology of Guangdong Province [2021QN020642]. Computational resources are provided by the Center for Computational Science and Engineering at the Southern University of Science and Technology.
Conflict of interest
The authors declare that the research was conducted in the absence of any commercial or financial relationships that could be construed as a potential conflict of interest.
Generative AI statement
The author(s) declare that no Generative AI was used in the creation of this manuscript.
Publisher’s note
All claims expressed in this article are solely those of the authors and do not necessarily represent those of their affiliated organizations, or those of the publisher, the editors and the reviewers. Any product that may be evaluated in this article, or claim that may be made by its manufacturer, is not guaranteed or endorsed by the publisher.
Footnotes
1The names of the fAAA and sAAA models are 0040_H_ABAO_AAA and 0042_H_ABAO_AAA, respectively, in the Vascular Model Repository.
References
de Lucio, M., García, M. F., García, J. D., Rodríguez, L. E. R., and Marcos, F. Á. (2021). On the importance of tunica intima in the aging aorta: a three-layered in silico model for computing wall stresses in abdominal aortic aneurysms. Comput. Methods Biomechanics Biomed. Eng. 24 (5), 467–484. doi:10.1080/10255842.2020.1836167
Di Martino, E. S., and Vorp, D. A. (2003). Effect of variation in intraluminal thrombus constitutive properties on abdominal aortic aneurysm wall stress. Ann. Biomed. Eng. 31 (7), 804–809. doi:10.1114/1.1581880
Fan, X., Zhang, A., Zheng, Q., Li, P., Wang, Y., He, L., et al. (2024). The biomechanical effects of different membrane layer structures and material constitutive modeling on patient-specific cerebral aneurysms. Front. Bioeng. Biotechnol. 11, 1323266. doi:10.3389/fbioe.2023.1323266
Gao, F., Ueda, H., Li, G., and Okada, H. (2013). Fluid structure interaction simulation in three-layered aortic aneurysm model under pulsatile flow: comparison of wrapping and stenting. J. Biomechanics 46 (7), 1335–1342. doi:10.1016/j.jbiomech.2013.02.002
Gasser, T. C., Ogden, R. W., and Holzapfel, G. A. (2006). Hyperelastic modelling of arterial layers with distributed collagen fibre orientations. J. R. Soc. Interface 3 (6), 15–35. doi:10.1098/rsif.2005.0073
Haller, S. J., Crawford, J. D., Courchaine, K. M., Bohannan, C. J., Landry, G. J., Moneta, G. L., et al. (2018). Intraluminal thrombus is associated with early rupture of abdominal aortic aneurysm. J. Vasc. Surg. 67 (4), 1051–1058.e1. doi:10.1016/j.jvs.2017.08.069
Hans, S. S., Jareunpoon, O., Balasubramaniam, M., and Zelenock, G. B. (2005). Size and location of thrombus in intact and ruptured abdominal aortic aneurysms. J. Vasc. Surg. 41 (4), 584–588. doi:10.1016/j.jvs.2005.01.004
Holzapfel, G. A., Gasser, T. C., and Ogden, R. W. (2000). A new constitutive framework for arterial wall mechanics and a comparative study of material models. J. Elast. 61, 1–48. doi:10.1007/0-306-48389-0_1
Holzapfel, G. A., Niestrawska, J. A., Ogden, R. W., Reinisch, A. J., and Schriefl, A. J. (2015). Modelling non-symmetric collagen fibre dispersion in arterial walls. J. R. Soc. Interface 12 (106), 20150188. doi:10.1098/rsif.2015.0188
Jansen, K. E., Whiting, C. H., and Hulbert, G. M. (2000). A generalized-α method for integrating the filtered Navier-Stokes equations with a stabilized finite element method. Comput. Methods Appl. Mech. Eng. 190 (3), 305–319. doi:10.1016/s0045-7825(00)00203-6
Kent, K. C. (2014). Abdominal aortic aneurysms. N. Engl. J. Med. 371 (22), 2101–2108. doi:10.1056/nejmcp1401430
Koole, D., Zandvoort, H. J., Schoneveld, A., Vink, A., Vos, J. A., van den Hoogen, L. L., et al. (2013). Intraluminal abdominal aortic aneurysm thrombus is associated with disruption of wall integrity. J. Vasc. Surg. 57 (1), 77–83. doi:10.1016/j.jvs.2012.07.003
Lederle, F. A., Johnson, G. R., Wilson, S. E., Ballard, D. J., Jordan, Jr W. D., Blebea, J., et al. (2002). Rupture rate of large abdominal aortic aneurysms in patients refusing or unfit for elective repair. JAMA 287 (22), 2968–2972. doi:10.1001/jama.287.22.2968
Liu, J., and Marsden, A. L. (2018). A unified continuum and variational multiscale formulation for fluids, solids, and fluid-structure interaction. Comput. Methods Appl. Mech. Eng. 337, 549–597. doi:10.1016/j.cma.2018.03.045
Maier, A., Gee, M. W., Reeps, C., Eckstein, H. H., and Wall, W. A. (2010). Impact of calcifications on patient-specific wall stress analysis of abdominal aortic aneurysms. Biomechanics Model. Mechanobiol. 9 (5), 511–521. doi:10.1007/s10237-010-0191-0
Moll, F. L., Powell, J. T., Fraedrich, G., Verzini, F., Haulon, S., Waltham, M., et al. (2011). Management of abdominal aortic aneurysms clinical practice guidelines of the European society for vascular surgery. Eur. J. Vasc. Endovascular Surg. 41, S1–S58. doi:10.1016/j.ejvs.2010.09.011
Niestrawska, J. A., Viertler, C., Regitnig, P., Cohnert, T. U., Sommer, G., and Holzapfel, G. A. (2016). Microstructure and mechanics of healthy and aneurysmatic abdominal aortas: experimental analysis and modelling. J. R. Soc. Interface 13 (124), 20160620. doi:10.1098/rsif.2016.0620
Rissland, P., Alemu, Y., Einav, S., Ricotta, J., and Bluestein, D. (2009). Abdominal aortic aneurysm risk of rupture: patient-specific FSI simulations using anisotropic model. J. Biomechanical Eng. 131 (3), 031001. doi:10.1115/1.3005200
Riveros, F., Martufi, G., Gasser, T. C., and Rodriguez-Matas, J. F. (2015). On the impact of intraluminal thrombus mechanical behavior in AAA passive mechanics. Ann. Biomed. Eng. 43 (9), 2253–2264. doi:10.1007/s10439-015-1267-x
Rodríguez, J. F., Martufi, G., Doblaré, M., and Finol, E. A. (2009). The effect of material model formulation in the stress analysis of abdominal aortic aneurysms. Ann. Biomed. Eng. 37 (11), 2218–2221. doi:10.1007/s10439-009-9767-1
Sassani, S. G., Kakisis, J., Tsangaris, S., and Sokolis, D. P. (2015). Layer-dependent wall properties of abdominal aortic aneurysms: experimental study and material characterization. J. Mech. Behav. Biomed. Mater. 49, 141–161. doi:10.1016/j.jmbbm.2015.04.027
Scotti, C. M., Shkolnik, A. D., Muluk, S. C., and Finol, E. A. (2005). Fluid-structure interaction in abdominal aortic aneurysms: effects of asymmetry and wall thickness. Biomed. Eng. Online 4 (64), 64. doi:10.1186/1475-925x-4-64
Simsek, F. G., and Kwon, Y. W. (2015). Investigation of material modeling in fluid-structure interaction analysis of an idealized three-layered abdominal aorta: aneurysm initiation and fully developed aneurysms. J. Biol. Phys. 41 (2), 173–201. doi:10.1007/s10867-014-9372-x
Sun, Y., Huang, J., Lu, Q., Yue, X., Huang, X., He, W., et al. (2025a). Modeling fibrous tissue in vascular fluid-structure interaction: a morphology-based pipeline and biomechanical significance. Int. J. Numer. Methods Biomed. Eng. 41 (1), e3892. doi:10.1002/cnm.3892
Sun, Y., Lu, Q., and Liu, J. (2025b). A parallel solverfram ework for fully implicit monolithic fluid-structure interaction. Acta Mech. Sin. 41 (2), 324074. doi:10.1007/s10409-024-24074-x
Throop, A., Bukac, M., and Zakerzadeh, R. (2022). Prediction of wall stress and oxygen flow in patient-specific abdominal aortic aneurysms: the role of intraluminal thrombus. Biomechanics Model. Mechanobiol. 21 (6), 1761–1779. doi:10.1007/s10237-022-01618-w
Tong, J., Cohnert, T., Regitnig, P., and Holzapfel, G. A. (2011). Effects of age on the elastic properties of the intraluminal thrombus and the thrombus-covered wall in abdominal aortic aneurysms: biaxial extension behaviour and material modelling. Eur. J. Vasc. Endovascular Surg. 42 (2), 207–219. doi:10.1016/j.ejvs.2011.02.017
Tong, J., and Holzapfel, G. A. (2015). Structure, mechanics, and histology of intraluminal thrombi in abdominal aortic aneurysms. Ann. Biomed. Eng. 43 (7), 1488–1501. doi:10.1007/s10439-015-1332-5
VMR (2024). Vascular model repository. Available at: www.vascularmodel.com.
Vorp, D. A., Lee, P. C., Wang, D. H., Makaroun, M. S., Nemoto, E. M., Ogawa, S., et al. (2001). Association of intraluminal thrombus in abdominal aortic aneurysm with local hypoxia and wall weakening. J. Vasc. Surg. 34 (2), 291–299. doi:10.1067/mva.2001.114813
Wang, D. H., Makaroun, M. S., Webster, M. W., and Vorp, D. A. (2002). Effect of intraluminal thrombus on wall stress in patient-specific models of abdominal aortic aneurysm. J. Vasc. Surg. 36 (3), 598–604. doi:10.1067/mva.2002.126087
Weisbecker, H., Pierce, D. M., Regitnig, P., and Holzapfel, G. A. (2012). Layer-specific damage experiments and modeling of human thoracic and abdominal aortas with non-atherosclerotic intimal thickening. J. Mech. Behav. Biomed. Mater. 12, 93–106. doi:10.1016/j.jmbbm.2012.03.012
Xenos, M., Labropoulos, N., Rambhia, S., Alemu, Y., Einav, S., Tassiopoulos, A., et al. (2015). Progression of abdominal aortic aneurysm towards rupture: refining clinical risk assessment using a fully coupled fluid-structure interaction method. Ann. Biomed. Eng. 43 (1), 139–153. doi:10.1007/s10439-014-1224-0
Keywords: fluid-structure interaction, abdominal aortic aneurysm, intraluminal thrombus, multi-layered anisotropic tissue model, patient-specific modeling
Citation: Yue X, Huang J and Liu J (2025) Fluid-structure interaction analysis for abdominal aortic aneurysms: the role of multi-layered tissue architecture and intraluminal thrombus. Front. Bioeng. Biotechnol. 13:1519608. doi: 10.3389/fbioe.2025.1519608
Received: 30 October 2024; Accepted: 03 January 2025;
Published: 11 February 2025.
Edited by:
Yonghui Qiao, Northwestern Polytechnical University, ChinaReviewed by:
Mauro Malvè, Public University of Navarre, SpainXueying Huang, Xiamen University, China
Copyright © 2025 Yue, Huang and Liu. This is an open-access article distributed under the terms of the Creative Commons Attribution License (CC BY). The use, distribution or reproduction in other forums is permitted, provided the original author(s) and the copyright owner(s) are credited and that the original publication in this journal is cited, in accordance with accepted academic practice. No use, distribution or reproduction is permitted which does not comply with these terms.
*Correspondence: Ju Liu, bGl1ajM2QHN1c3RlY2guZWR1LmNu