 Edwin Lok
 Olivia Liang1,2
 Monika Haack
 Eric T. Wong
- 1Brain Tumor Center & Neuro-Oncology Unit, Beth Israel Deaconess Medical Center, Boston, MA, United States
- 2Division of Hematology/Oncology, Departments of Medicine, Brown University Health & Rhode Island Hospital, Providence, RI, United States
- 3Department of Neurology, Beth Israel Deaconess Medical Center, Boston, MA, United States
- 4Departments of Neurology, Medicine, Neurosurgery & Radiation Oncology, Brown University Health & Rhode Island Hospital, Providence, RI, United States
Purpose: Tumor Treating Fields (TTFields) are delivered by transducer arrays applied to scalp or body surface for treatment of multiple malignancies. Dermatologic complications are thought to be related to hydrogel situated between the electrodes and scalp or skin to facilitate electric field penetration. High intensity of TTFields on these surfaces may also be a contributing factor. We explored conductivity changes in the hydrogel and skin to improve TTFields coverage and penetration.
Methods: Magnetic resonance imaging datasets from 12 glioblastoma patients and attenuation-corrected positron emission tomography–computed tomography datasets from 3 non-small cell lung and 2 ovarian carcinoma patients were used to segment anatomic structures. Finite element mesh models were generated and solved for distribution of applied electric fields, rate of energy deposition, and current density at the gross tumor volume (GTV) and clinical target volume (CTV). Electric field-volume, specific absorption rate–volume, and current density-volume histograms were generated, by which plan quality metrics were used to evaluate relative differences in field coverage between models at various hydrogel and skin conductivities.
Results: By varying conductivity of hydrogel, TTFields coverage at GTV or CTV increased up to 0.5 S/m for head and 1.0 S/m for thorax and pelvis models, and no additional increase was observed beyond these saturation points. Although scalp hotspots increased or decreased by +1.5%, −0.1%, and −0.9% in E5%, SAR5%, and CD5%, the skin hotspots increased by as much as +23.5%, +45.7%, and +20.6%, respectively. When altering conductivity of the entire scalp, TTFields coverage peaked near 1 S/m at the GTV or CTV for the head models. TTFields coverage in both the GTV and scalp increased up to 1 S/m for the head models but plateaued thereafter. Contouring under the scalp increased scalp hotspots by +316% in E5% at 1 S/m compared to altering the conductivity of the entire scalp. GTV hotspots decreased by +17% in E5% at 1 S/m.
Conclusion: TTFields delivery can be modulated by the conductivity of hydrogel and scalp/skin at the transducer-scalp or transducer-skin interface. Optimizing this aspect of TTFields delivery may increase tumor control while minimizing toxicity at the scalp or skin.
Introduction
Tumor Treating Fields (TTFields) therapy is the standard-of-care for patients with newly-diagnosed and recurrent glioblastomas (Stupp et al., 2017; Stupp et al., 2012). Its anti-cancer efficacy is derived from alternating electric fields tuned to a frequency of 200 kHz, which disrupt tumor cells in mitosis, cause double strand DNA breaks, and impose other types of cellular stress response resulting in secondary autophagy, immunogenic cell death or both (Gera et al., 2015; Karanam et al., 2017; Shteingauz et al., 2018; Voloshin et al., 2020). TTFields are delivered continuously to the patient’s head via two pairs of orthogonally positioned transducer arrays (Swanson et al., 2016). Daily compliance at ≥75% or continuous use for ≥18 h is an important determinant of treatment efficacy (Toms et al., 2019). Furthermore, TTFields are approved for the treatment of mesothelioma and 4 arrays are placed on the patient’s chest wall (Ceresoli et al., 2019). Randomized clinical trials also showed improved efficacy in patients with advanced staged non-small cell lung cancer when combined with immune checkpoint inhibitor (Leal et al., 2023), and those with 1–10 brain metastases when integrated with radiosurgery (Mehta et al., 2024). Therefore, TTFields will likely be incorporated as an adjuvant treatment for other malignancies in the future.
A major complication associated with continuous use of TTFields is localized breakdown of scalp or skin (Lacouture et al., 2020; Lacouture et al., 2014). These dermatologic complications, which include erythema, pruritis, and secondary infection (Lacouture et al., 2020), are thought to be a result of allergic reactions to hydrogel, which is situated between the electrodes and scalp or skin to facilitate electric field penetration, rather than from TTFields themselves emanating from the electrodes. High ambient temperature and hyperhidrosis are also modifying factors that may alter the severity of these complications (Lacouture et al., 2020). However, we postulated that the dermatologic complications are unrelated to hydrogel allergy but associated with the intensity of TTFields, and therefore we explored the possibility of optimizing the delivery of TTFields by minimizing field intensity on the scalp while maximizing it within the tumor. First, we analyzed 12 patient models (7 head models from glioblastoma patients, 3 thorax models from non-small cell carcinoma patients, and 2 pelvis models from ovarian cancer patients) and investigated the TTFields’ coverage effects on scalp/skin, skull and target(s) under different hydrogel electric conductivities. We found that there is a general difference in the optimum conductivity between head and body (thorax and pelvis) models; but variability also exists among individual patients within each anatomic treatment site. Second, to mitigate scalp irritation, we performed simulation studies by varying hydrogel and whole scalp conductivities, with the latter mimicking the effect of applying topical agents on the scalp. Changes in TTFields coverage in the scalp, skull, and target volumes were systematically explored using 17 patient models (12 glioblastoma, 3 non-small cell carcinoma, and 2 ovarian cancer patients). Finally, alterations in TTFields penetration were also investigated by varying the electric conductivity only in the region of the skin layer directly beneath the hydrogels, and we noted improved TTFields penetration into the brain when gadolinium and other non-reactive, highly conductive mixtures were injected into the scalp layer.
Materials and methods
Magnetic resonance imaging (MRI) data from 12 glioblastoma patients, who underwent TTFields therapy, as well as positron emission tomography-computed tomography (PET-CT) imaging data from 3 lung carcinoma and 2 ovarian carcinoma patients, were used to segment intracranial, intrathoracic, and intrapelvic anatomic structures under an institutional review board approved protocol at the Dana Farber Cancer Institute. T1 post-gadolinium MR sequences were used as previously described to delineate gross tumor volumes in the brain tumor models (Lok et al., 2017). PET data were used to define the FDG-positive gross tumor volume (GTV) in the lung and pelvic models, where a uniform 3 mm expansion around the GTV was conducted to create the clinical target volume (CTV), as previously described (Lok et al., 2023; Lok et al., 2021). A 3-dimensional finite element mesh was then generated for each model in ScanIP (Synopsys, Mountain View, CA) and then imported into COMSOL Multiphysics 5.5 (COMSOL, Burlington, MA) for finite element analysis. Sensitivity analysis as a function of hydrogel electric conductivity was achieved by varying the electric conductivity parameter in log unit intervals between 0.001 and 1000 S/m for each model. The nominal value for hydrogel electric conductivity was 0.1 S/m as previously used across multiple modeling studies (Lok et al., 2017; Timmons et al., 2017; Wenger et al., 2015). Additionally, the nominal value used in this study for the scalp and skin conductivity was 0.00105 S/m. Head models were developed with hydrogel electric conductivity up to 10 S/m due to a lower propensity of electric field saturation, compared to thorax and pelvis models that had conductivity values beyond 10 S/m and up to 1000 S/m due to their greater axial diameters for electric field penetration. The electric conductivity of the whole scalp in the head was modeled from 0.001 to 10 S/m, while the electric conductivity of the skin on the body was modeled from 0.001 to 100 S/m. Furthermore, conductive fluids in the regions within the scalp or skin directly underneath each hydrogel layer were modeled in log unit increments from 0.001 to 100 S/m.
Appropriate material properties and boundary conditions were specified as previously described, and magnetic fields were assumed to be negligible at the frequency range for the operation of TTFields (Lok et al., 2017; Lok et al., 2021). The AC/DC module from COMSOL Multiphysics was used to solve for the electric field distribution in each model. To quantify the distributions as a function of hydrogel, skin, scalp, and conductive fluids, plan quality metrics (PQMs) derived from each model’s respective volume histograms, were used to make comparisons within Excel 2019 (Microsoft, Redmond, WA). PQMs included 95% coverage metrics such as E95%, SAR95%, and CD95%, which are electric fields strength, specific absorption rate (or the rate at which energy is absorbed), and current density received by 95% volume of a particular tissue, respectively. Median coverage for electric field, SAR and current density were also utilized to quantitatively compare between models, denoted by E50%, SAR50%, and CD50%, respectively. The 5% metrics such as E5%, SAR5%, CD5% were used to quantify hotspots, specifically the intensity of each metric within 5% of tissue.
Results
TTFields distribution metrics saturate according to hydrogel electric conductivity
Our study revealed that there are important saturation points at which increasing the hydrogel electric conductivity beyond a certain value resulted in no further increase in TTFields coverage at the GTV or CTV. This saturation point appears to be different between the head and body models. For the head models, the saturation point is near 0.5 S/m and increasing the hydrogel conductivity from the nominal value of 0.1–0.5 S/m resulted an average increase of +3.4% in E95%, +3.6% in SAR95%, and +4.1% in CD95% at the GTV (Figure 1A; Supplementary Figures 1A, 2A). There was negligible change in 95% TTFields coverage beyond 0.5 S/m. Similarly, the median coverage at the GTV increased on average by +2.0% in E50%, +5.2% in SAR50%, and +2.4% in CD50% (Figure 1E; Supplementary Figures 1E, 2E). The GTV hotspots, denoted by E5%, SAR5%, and CD5%, increased by an average of +2.8%, +6.2%, and +3.6%, respectively (Figure 1I; Supplementary Figures 1I, 2I). Similar saturation characteristics were noted for necrotic core (Figure 1; Supplementary Figures 1, 2).
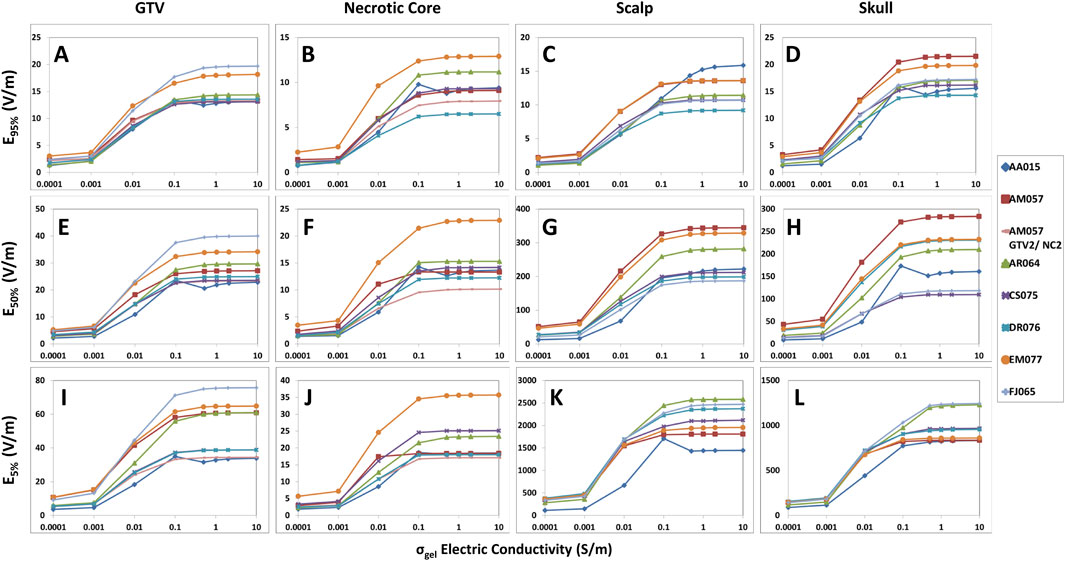
Figure 1. Differences in the hydrogel conductivity saturation characteristics among GTV, necrotic core, scalp and skull of the head models represented by E95%, E50%, and E5% coverage metrics. When increasing hydrogel electric conductivity from 0.0001 to 10.0 S/m, E95% (A–D), E50% (E–H), and E5% (I–L) metrics increased and saturated at 0.5 S/m. No significant increase was noted thereafter.
Within the scalp, the median coverage, represented by E50%, SAR50%, and CD50%, increased on average by +5.8%, +14.0%, and +6.0%, respectively (Figure 1G; Supplementary Figures 1G, 2G). The 95% coverage to the scalp followed a similar pattern of increase in intensity as a function of hydrogel electric conductivity and exhibited saturation points near 0.5 S/m (Figure 1C; Supplementary Figures 1C, 2C). However, there was negligible change in the hotspots (5%) coverage of TTFields beyond 0.5 S/m. Similar saturation characteristics were noted for skull (Figure 1; Supplementary Figures 1, 2).
For the thorax and pelvis models, a different saturation point for hydrogel conductivity was observed near 1.0 S/m and increasing the hydrogel conductivity from 0.1 to 1.0 S/m yielded an average increase of +20.5% in E95%, +47.7% in SAR95%, and +43.1% in CD95% at the CTV (Figure 2A; Supplementary Figures 3A, 4A). There was negligible change in 95% TTFields coverage beyond 1.0 S/m. The average increase in median coverage at the CTV was +22.5% for E50%, +50.4% for SAR50%, and +24.4% for CD50% (Figure 2C; Supplementary Figures 3C, 4C). The CTV hotspots, denoted by E5%, SAR5%, and CD5%, increased by an average of +26.6%, +51.0%, and +21.7%, respectively (Figure 2E; Supplementary Figures 3E, 4E). In addition, the skin hotspots, denoted by E5%, SAR5%, and CD5%, increased by +22.8%, +45.7%, and +20.6%, respectively (Figure 2F; Supplementary Figures 3F, 4F). The 95% and median (50%) coverage to the skin also followed suit (Figures 2B, D; Supplementary Figures 3B, D, 4B, D). Collectively, these data indicate that the conductivity saturation points for the thorax and pelvis models are higher by an order of magnitude compared to the head models, and this difference has potential implications for the penetration of TTFields.
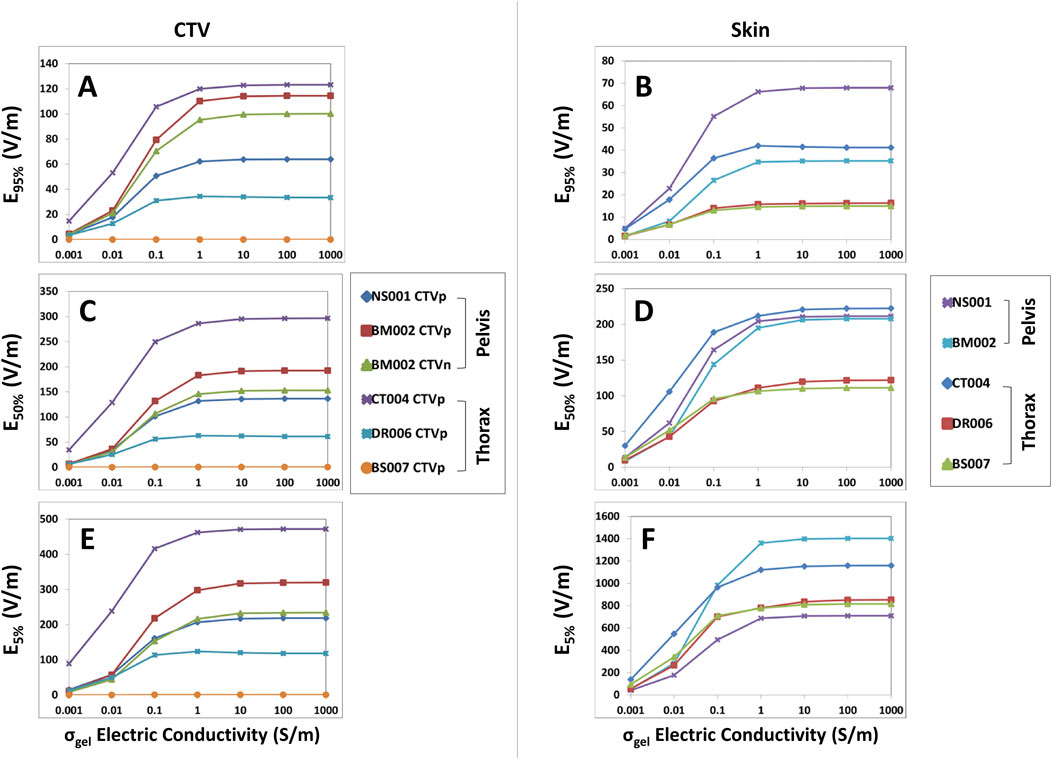
Figure 2. E95%, E50%, and E5% coverage metrics for CTV and skin of the thoracic and pelvic models with respect to increasing hydrogel conductivity. When increasing hydrogel electric conductivity from 0.001 to 1,000.0 S/m, E95% (A, B), E50% (C, D), and E5% (E, F) metrics increased and reached saturation points of 1.0 S/m. No significant increase was noted thereafter.
TTFields distribution metrics peak in targets with respect to whole scalp/skin electric conductivity
When altering the scalp/skin electric conductivity, the TTFields coverage, SAR and current density peaked at around 1.0 S/m and then decreased after 1.0 S/m. Specifically, in the head models (n = 12), the average increase in TTFields coverage at the GTVs was +212.3%, +168.7% and +150.7% for E95%, E50%, and E5%, respectively (Figures 3A, E, I). Additionally, the average increase for the SAR95%, SAR50%, and SAR5% were +1,005.9%, +737.9%, and +589.4%, respectively (Supplementary Figures 5A, E, I). Lastly, the average increase for the CD95%, CD50%, and CD5% were +177.1%, +169.4%, and +150.7%, respectively (Supplementary Figures 6A, E, I). Similar characteristics were noted in necrotic core and skull, except for scalp where all electric field metrics other than for E95% decreased with increasing conductivity and both SAR and current density increased progressively (Figure 3; Supplementary Figures 5, 6).
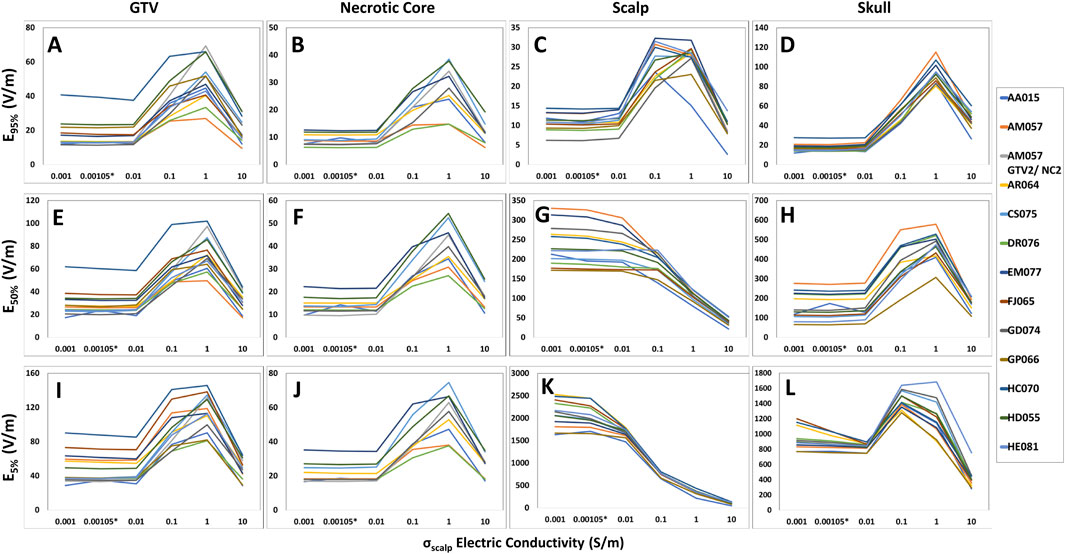
Figure 3. Differences in E95%, E50%, and E5% coverage metrics among GTV, necrotic core, scalp and skull of the head models with respect to skin conductivity alterations. For the GTV, necrotic core, and skull, the E95% (A, B, D), E50% (E, F, H), and E5% (I, J, L) metrics increased as the scalp conductivity increased from 0.001 to 1.0 S/m. However, a decrease was noted beyond 1.0 S/m. Comparatively, the E95% (C) for the scalp followed the same pattern, whereas the E50% (G) and E5% (K) metrics decreased entirely when the scalp conductivity increased from 0.001 to 10.0 S/m.
Compared to the head models, the average increase for the thoracic GTVs (n = 3) were much lower at +3.5%, +6.6%, and +3.4% for E95%, E50%, and E5%, respectively (Figures 4A, C, E); no GTVs were modeled in the pelvic body models. Similarly, SAR95%, SAR50%, and SAR5% increased +6.5%, +10.9%, and +10.7%, respectively (Supplementary Figures 7A, C, E), while the CD95%, CD50%, and CD5% increased +2.5%, +6.4%, and +3.6% (Supplementary Figures 8A, C, E). The average increase for the CTVs (n = 6) in both thoracic and pelvic body models were +8.9%, +8.0%, and +3.7% for E95%, E50%, and E5%, respectively (Figures 4A, C, E). Interestingly, the average increase in the SAR95% and SAR50% were +27.0% and +17.3%, but there was an average decrease of −4.5% in the SAR5% (Supplementary Figures 7A, C, E). The average CD metrics, CD95%, CD50%, and CD5%, increased by +16.1%, +7.8%, and +3.1%, respectively (Supplementary Figures 8A, C, E). Together, both the thoracic and pelvis models demonstrate that E, SAR and CD at the GTV/CTV can be maximized at 1 S/m. But this maximum is much lower compared to the head models.
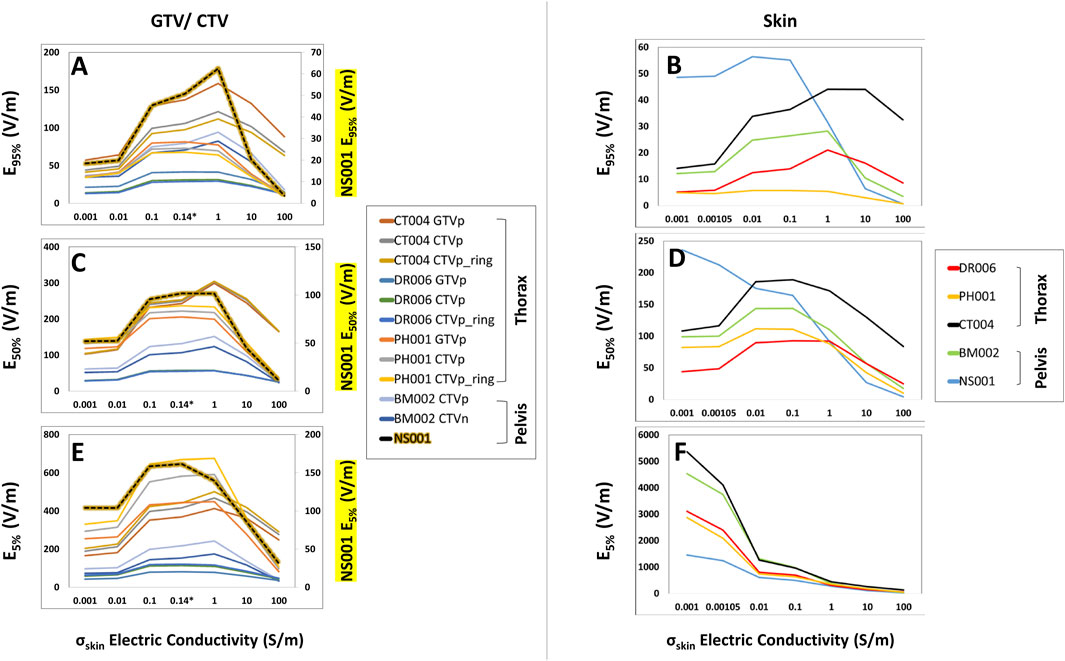
Figure 4. E95%, E50%, and E5% coverage metrics of the GTV/CTV and skin of the body models with respect to increasing skin conductivity. As the skin conductivity increased from 0.001 to 1 S/m, the GTV/CTV and skin E95%, E50%, and E5% coverage metrics (A–E) increased until 1.0 S/m and then decreased thereafter, with the exception of the skin E5% metric that decreased with increasing conductivity (F). It is also notable that the CTV from model NS001 had distinct E95%, E50%, and E5% coverages, of which its values are displayed on the secondary axis.
Whole skin optimization maximizes target coverage while minimizing skin dose
When comparing electric field coverage for the GTV, CTV, and scalp/skin, we observed that there are individual minimum conductivity thresholds of the whole scalp or the entire skin that can maximize TTFields coverage to the GTV while minimizing exposure on the skin (Figure 5). Importantly, maximum coverage to the GTV can be achieved with whole skin conductivity set at 1.0 S/m to minimize TTFields exposure on the skin. From the baseline conductivity of 0.00105 to 1.0 S/m, the average E95% for the GTV within the head models increased approximately +212.3% while the E95% of the scalp increased +163.8% (Figure 5A). More profound differences are shown in the E50% and E5%, such that the average E50% and E5% for the GTV increased +168.7% and +150.7%, respectively, while the average E50% and E5% for the scalp decreased by −53.0% and −82.8%, respectively (Figures 5B, C). Similar trends are observed in the body models, with average E95% coverage for the skin, GTV, and CTV increased +6.3%, +3.5%, and +8.9%, respectively, as the skin electric conductivity increased from 0.00105 to 1.0 S/m (Figure 5D). The average E50% increased by +6.6% and +8.0% for the GTV and CTV, respectively, while the skin E50% decreased by −19.6% (Figure 5E). The average E5% for the GTV and CTV increased +3.4% and +3.7% for the GTV and CTV, respectively, while the skin E5% decreased by −52.0% (Figure 5F). Similar trends can be seen for the SAR and current density parameters (Supplementary Figures 9, 10). In aggregate, setting the scalp or skin conductivity to 1.0 S/m maximizes target coverage while minimizing electric field exposure at the scalp or skin layers.

Figure 5. Average E95%, E50%, and E5% coverage metrics between the GTV/CTV and scalp/skin with respect to varying scalp electric conductivity. Individual minimum conductivity thresholds of the whole scalp/skin and maximum coverage to the GTV/CTV are shown at the intersecting points and largest GTV to scalp/skin differences, respectively. An average of the E95%, E50%, and E5% metrics of the head models are displayed with the average percent change from 0.00105 to 1.0 S/m (A–C) while the body models are displayed in (D–F).
Optimized TTFields distribution with respect to locally injected conductive fluids compared with whole scalp conductivity changes
Changes in coverage metrics due to locally injected fluids within the scalp, particularly in the volume of tissue directly below each hydrogel layer were investigated and subsequently compared with coverage metrics from whole scalp conductivity changes as previously described (Figure 6). As a result, TTFields distribution was shown to saturate in the head models at approximately 1.0 S/m for both the GTV and scalp, with negligible change beyond 1.0 S/m. This saturation point was consistent across the EVH, CDVH, and SARVH 95%, median or 50%, and hotspot or 5% coverages (Figure 7; Supplementary Figures 11, 12). Notably, the E95%, E50%, and E5% coverages at the GTV increased with averages of +107.3%, +89.7%, and +85.1%, respectively, when increasing the conductivity from 0.00105 to 1.0 S/m. In contrast, the E50% and E5% coverages at the scalp decreased at averages of −4.0% and −25.6% respectively, although the E95% increased by +93.2%.
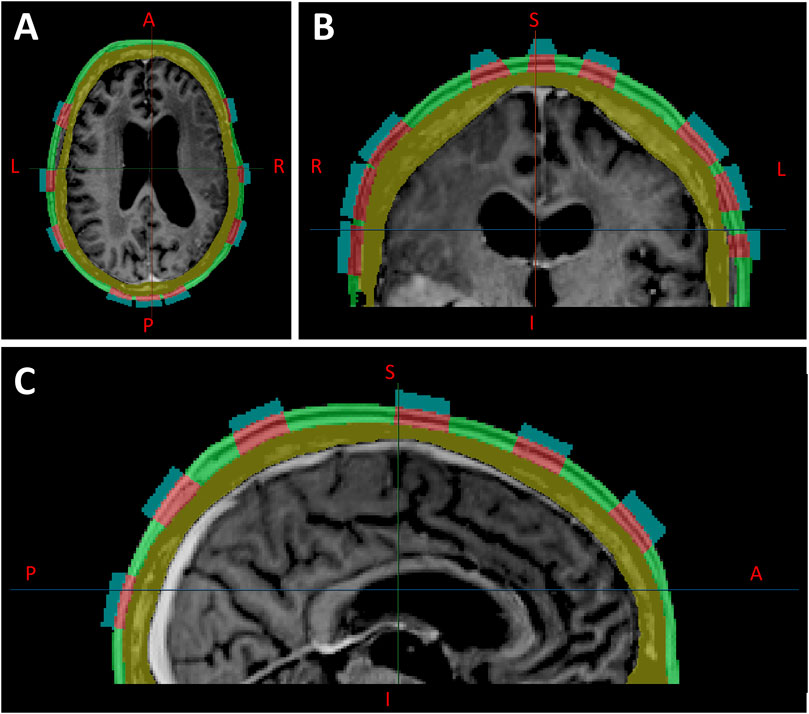
Figure 6. Locally injected fluids within the scalp (green layer), segmented directly below each hydrogel layer, shown in axial (A), coronal (B), and sagittal (C) planes.
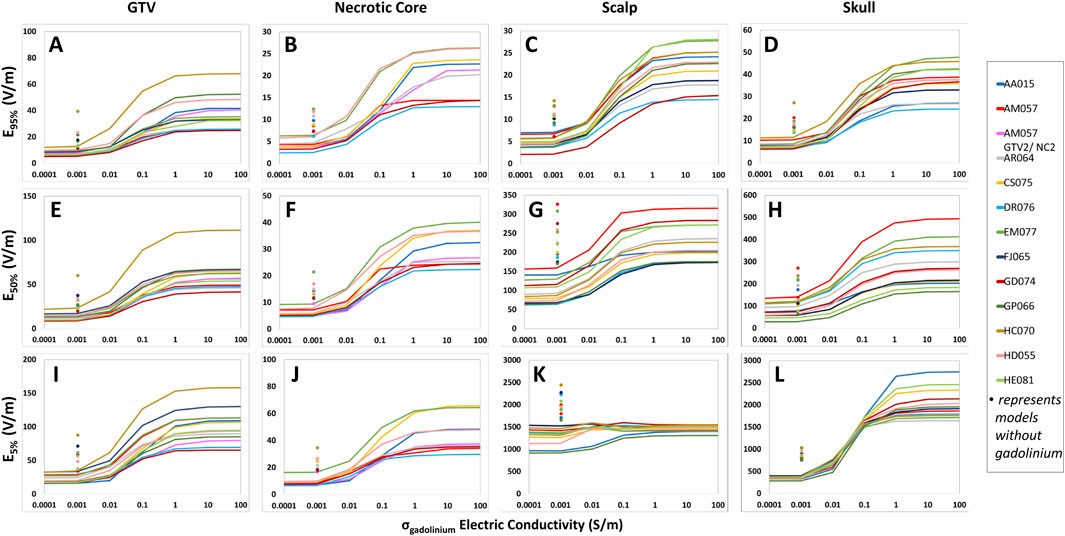
Figure 7. Differences in the conductive fluid conductivity saturation characteristics among GTV, necrotic core, scalp and skull of the head models according to E95%, E50%, and E5% coverage metrics. For each measured structure, E95% (A–D), E50% (E–H), and E5% (I–L) increased as the scalp electric conductivity rose from 0.1 to 1.0 S/m, but no further increase was noted beyond 1.0 S/m. Additionally, each point at 0.00105 S/m displays the electric field coverages at the baseline scalp electrical conductivity without the presence of gadolinium.
In comparison to whole scalp conductivity alteration, at the conductivity saturation point of 1.0 S/m, the average E95%, E50%, and E5% of the GTV increased by +44.6%, +34.4%, and +23.9%, respectively (Table 1). At approximately 3.0 S/m, through linear interpolation, the GTV increased +23.9%, +16.0%, and +7.1% in E95%, E50%, and E5%. As for the scalp at 1.0 S/m, E95% increased +40.3% but decreased −50.6% and −75.8% for E50% and E5% at 1.0 S/m, respectively. At 3.0 S/m, the scalp increased +18.5% at E95% but decreased −57.6% and −79.7% for E50% and E5%, respectively. Tables 2, 3 showed average SAR95%, SAR50%, SAR5%, CD95%, CD50%, and CD5%, respectively.
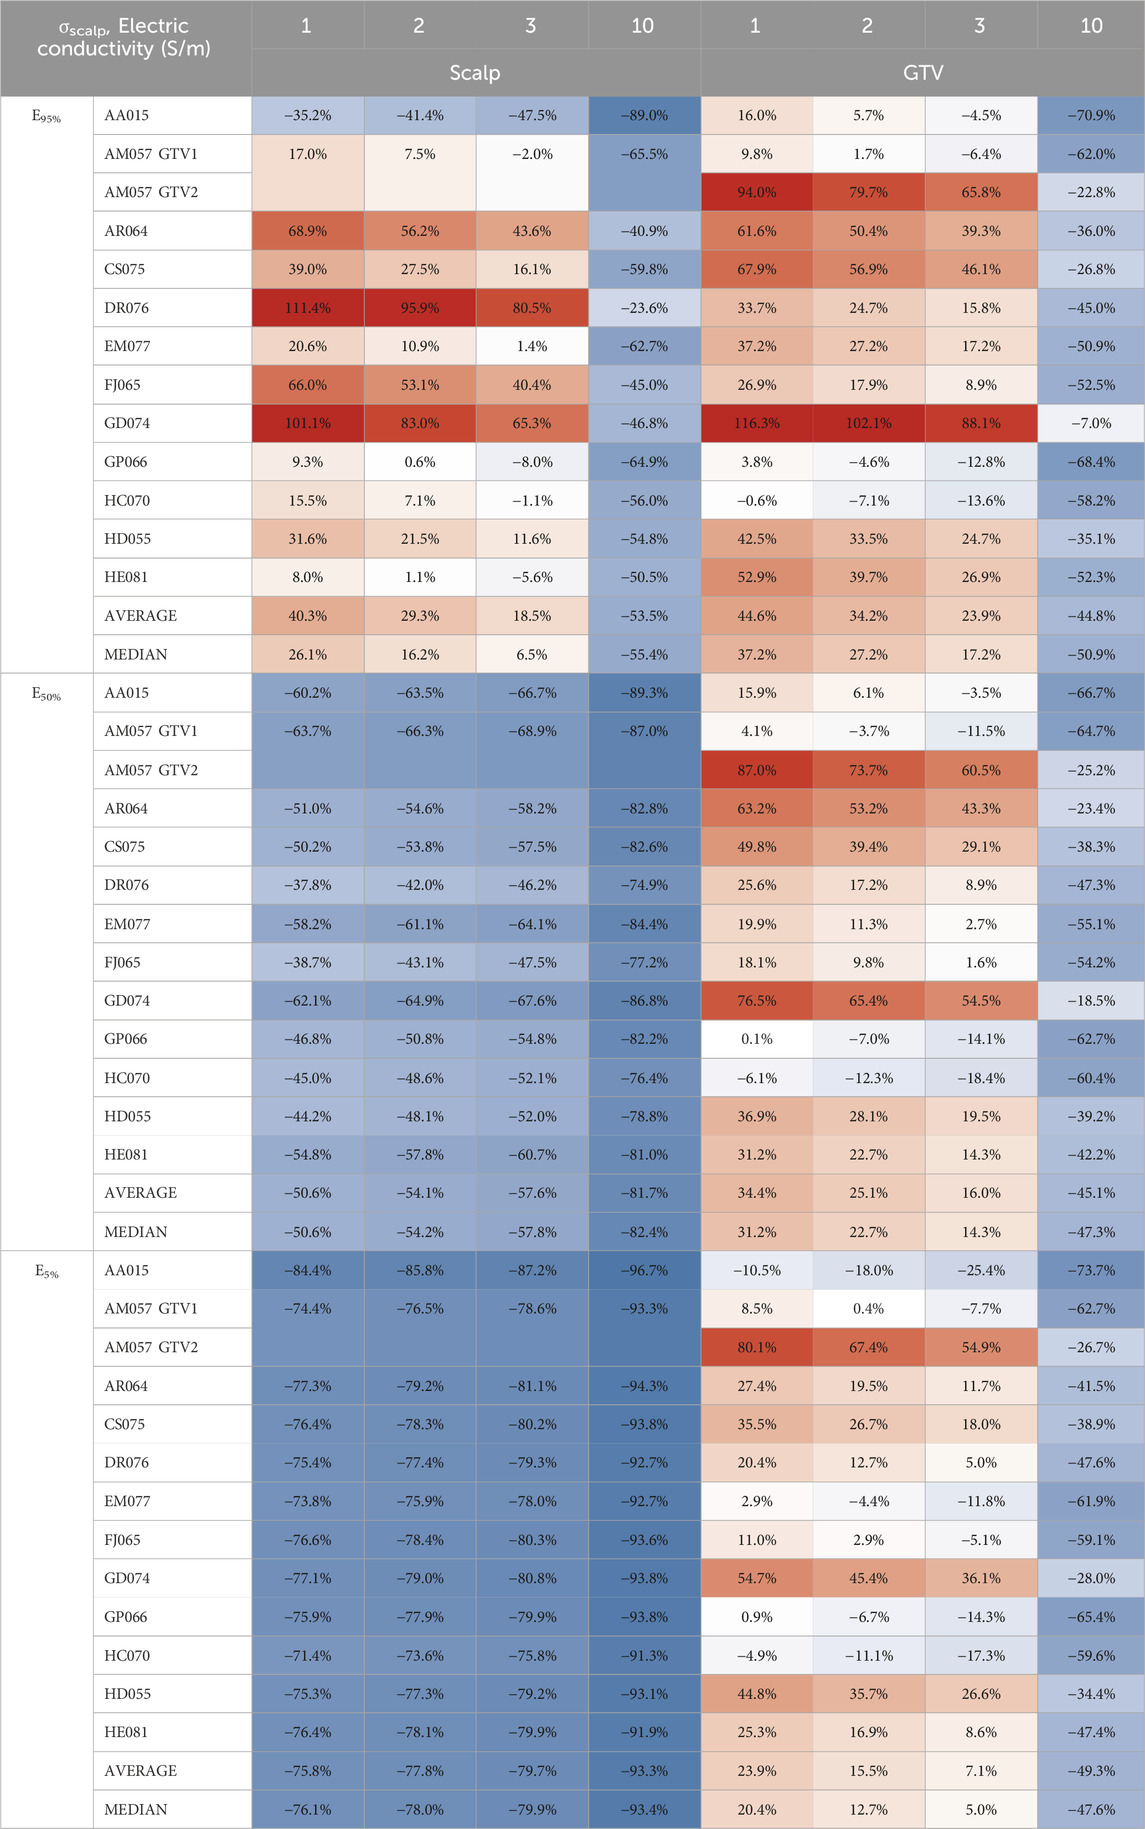
Table 1. Average E95%, E50%, and E5% scalp and GTV percent change from locally injected fluids within the scalp to whole scalp conductivity change.
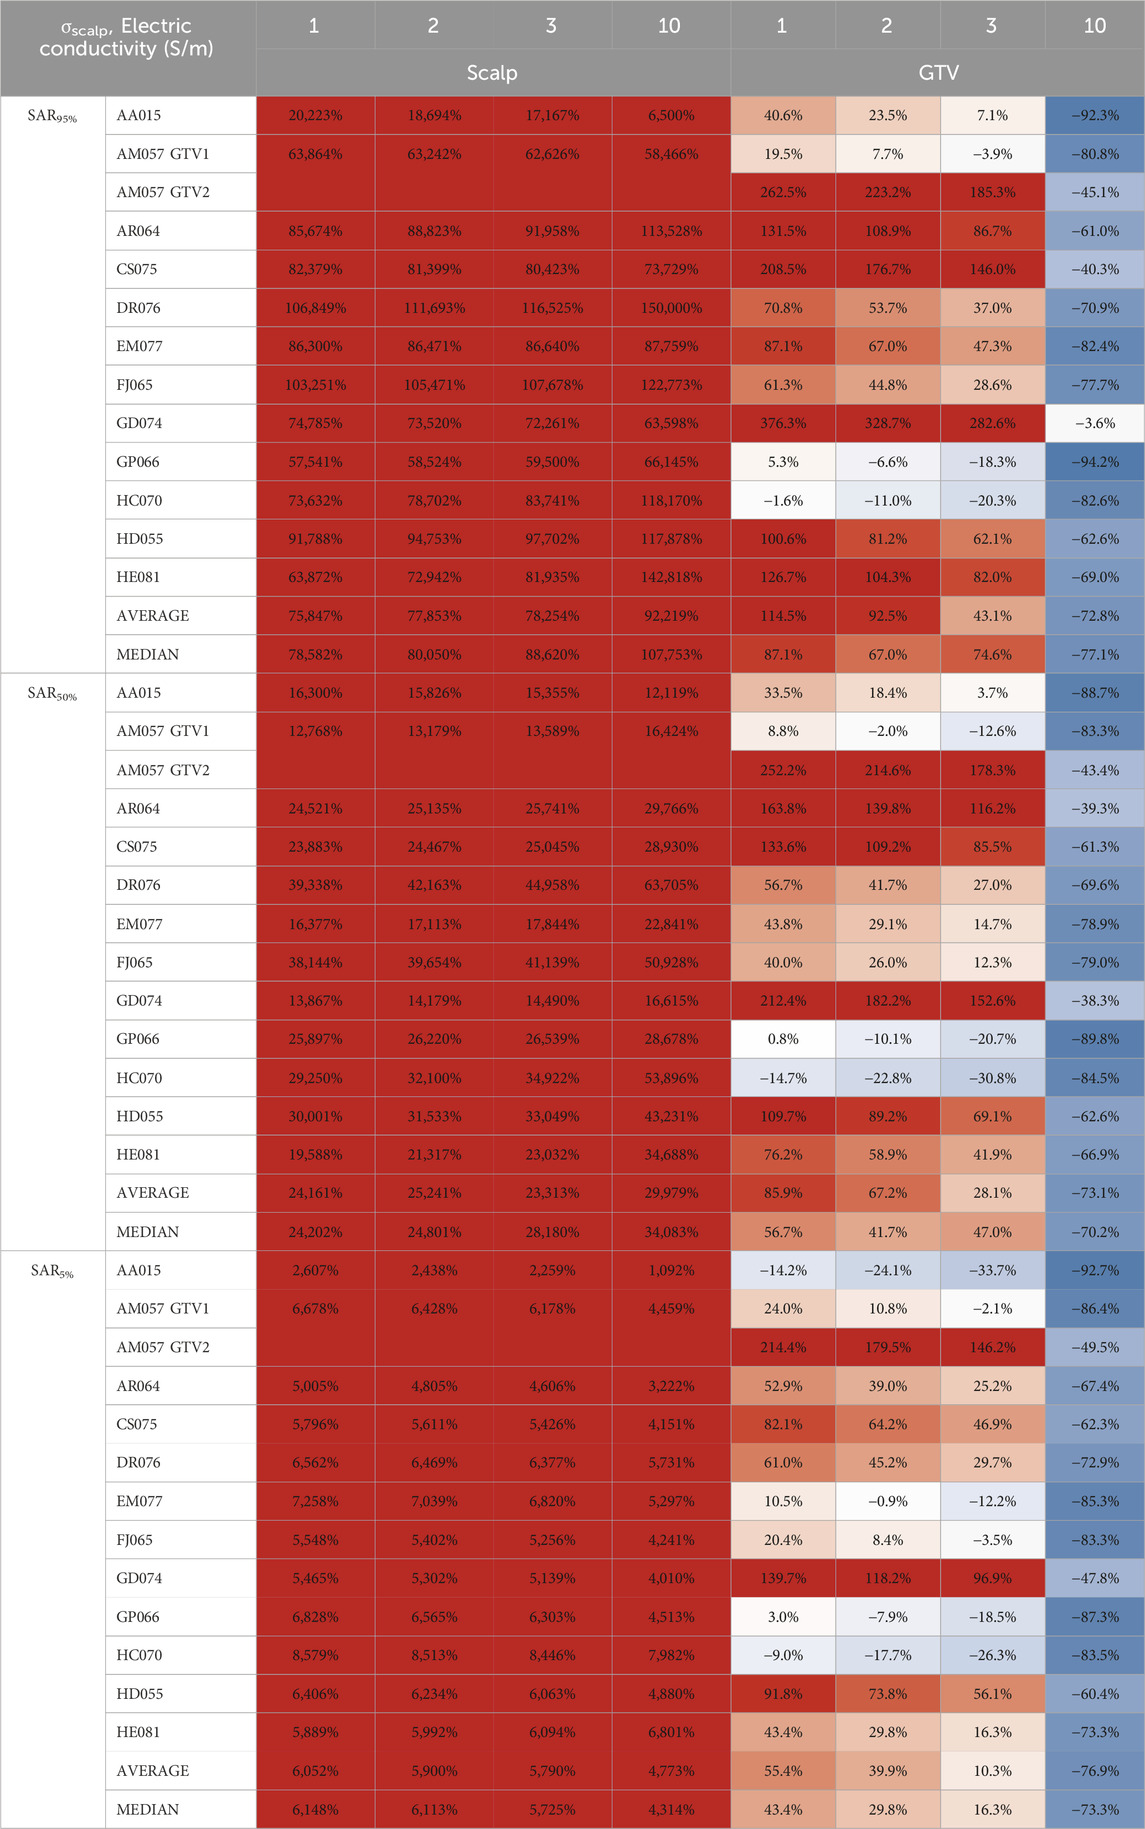
Table 2. Average SAR95%, SAR50%, and SAR5% scalp and GTV percent change from to locally injected fluids within the scalp to whole scalp conductivity change.
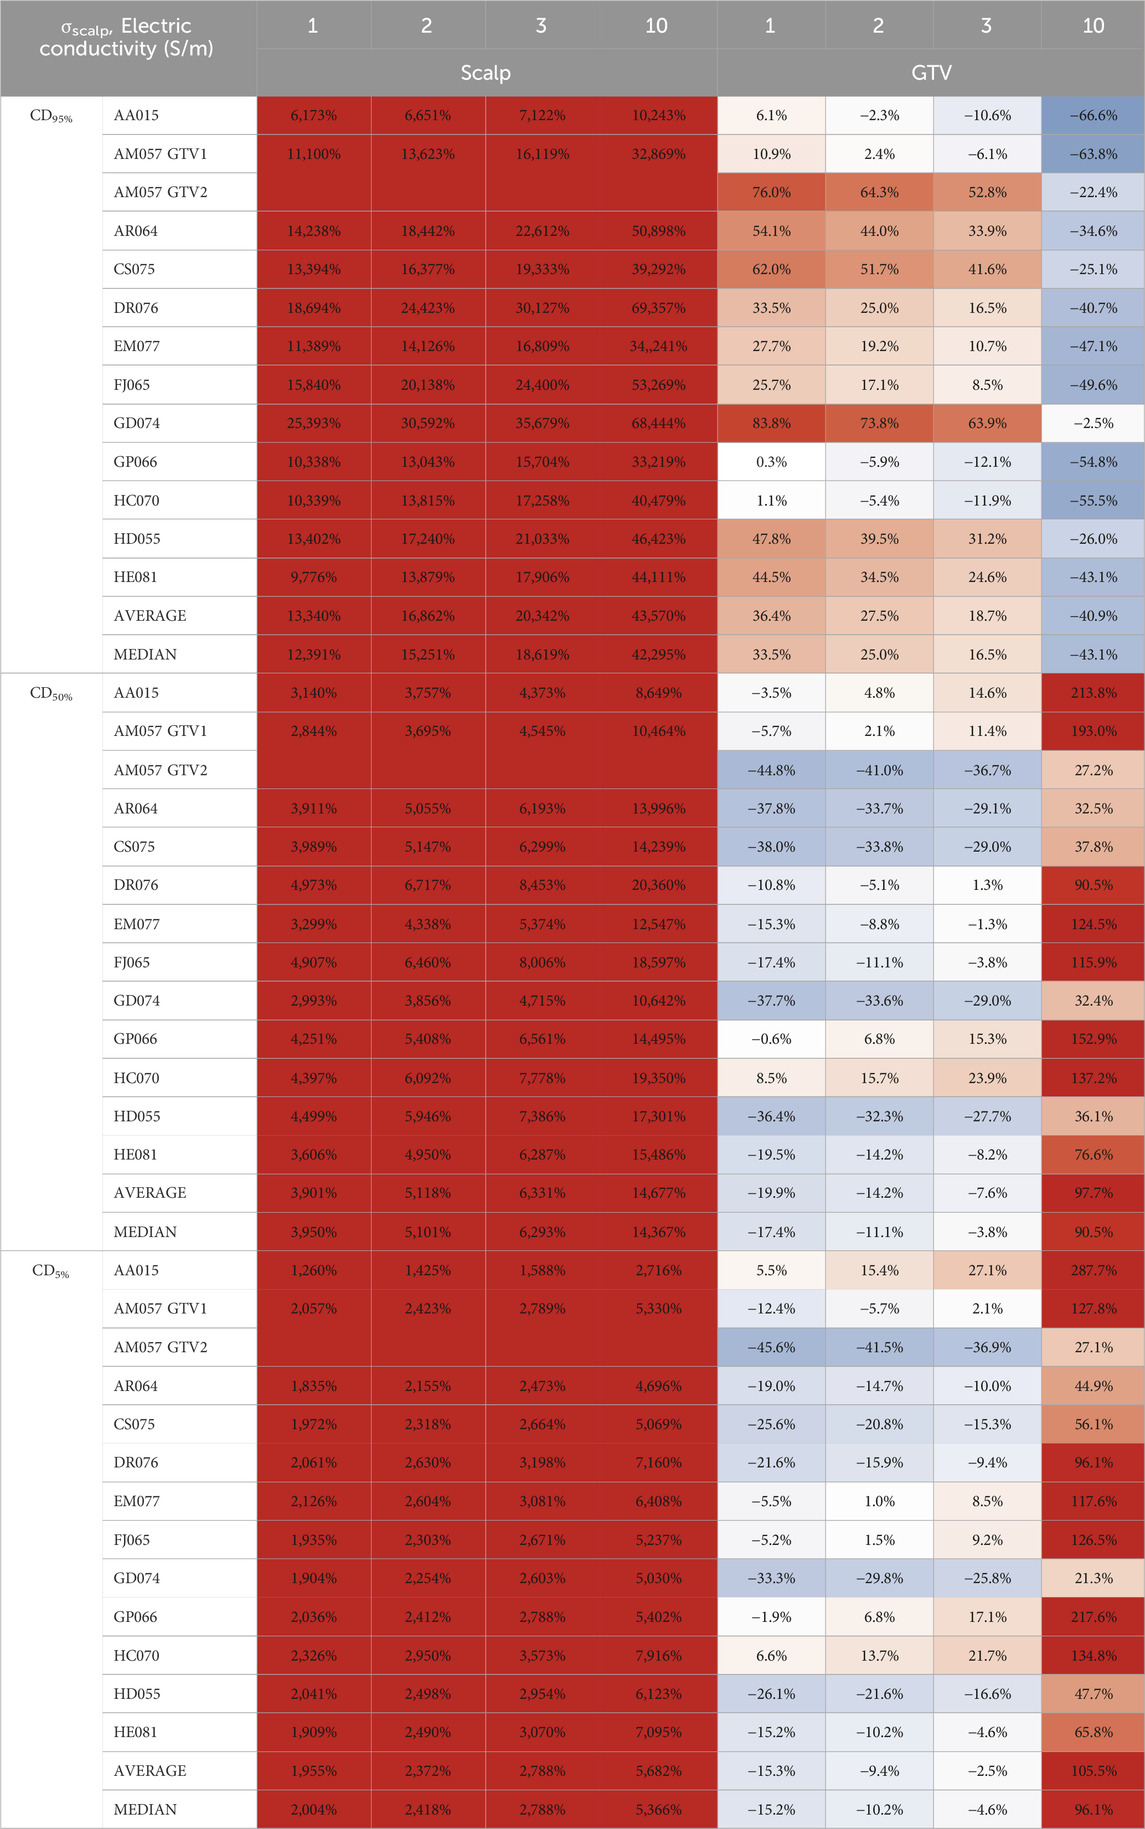
Table 3. Average CD95%, CD50%, and CD5% scalp and GTV percent change from locally injected fluids within the scalp to whole scalp conductivity change.
Discussion
We found that the hydrogel-scalp or hydrogel-skin interface is critical for the penetration of TTFields into the intracranial space or other body cavities, respectively. Kirson et al. found that higher TTFields intensity correlated with increased percent of tumor cell kill in experimental cell culture models (Kirson et al., 2007). To optimize delivery of TTFields for the treatment of cancer, the penetrating dose at the tumor volume(s) in the brain or torso should be maximized while the hotspots on the scalp or skin surface minimized. The conductivity of the hydrogel as well as the skin or scalp itself is speculated to alter TTFields coverage at both GTV and/or CTV as well as the hotspot on the scalp or skin. This may occur under the conditions of high ambient temperature and increased humidity. Indeed, as we increased the conductivity of hydrogel or volume of scalp directly below each hydrogel layer, TTFields intensity at the GTV or CTV reached a maximum beyond which no further increase occurred, suggesting that the scalp or other skin surface may function as a variable conductor to mitigate these effects. Interestingly, increasing the conductivity of the entire scalp or skin resulted in a peak electric-field intensity characteristics within the GTV, with a corresponding decrease in field intensity at the scalp or skin. Therefore, optimal delivery is possible by altering the conductivity of the entire scalp or skin.
The observed saturation characteristics is likely due to a relationship between electric conductivity and the response of charge carriers under the influence of time-dependent alternating electric fields. This relationship is determined by the concentration and allowable motion of charges that determine a material’s electric conductivity according to field intensity and the quantity of electric charges within an enclosed space according to Gauss’ Law. As the conductivity of the hydrogel approaches large values, its electrical response behaves similar to that of metals, where the charge carrier density can then be calculated according to the Drude model (Dressel and Scheffler, 2006). Charge carrier density is typically constant for a particular material in specific states of matter and, therefore, can only conduct a certain amount of electric charge. As we increase the electric conductivity of hydrogel, the charge carrier density increases. However, since the electric conductivity of the anatomical structures throughout the rest of the head models remains constant in this study, the intrinsic charge carrier densities are also unchanged. Therefore, increasing the conductivity of hydrogel results in saturation of electric field, SAR and CD intensities within the head models. A similar explanation is also applicable to the body models.
The saturation point for electric fields coverage as a function of hydrogel conductivity is twice as high for thorax and pelvis models compared to the head models (Wenger et al., 2015). This may be due to the higher output from the NovoTTF-100L device for the thorax and pelvis (https://www.accessdata.fda.gov/cdrh_docs/pdf18/H180002C.pdf) compared to the NovoTTF-100A or NovoTTF-200A for the head. Specifically, the maximum intensity for NovoTTF-100L is 1,414 mA while the maximum for NovoTTF-100A or NovoTTF-200A is 900 mA, or a ratio of 1.6. In addition, each NovoTTF-100L array includes up to 20 ceramic electrodes arranged in a 4 × 4 rectangular configuration with 2 additional electrodes at either side of the long axis (https://www.accessdata.fda.gov/cdrh_docs/pdf18/H180002D.pdf), compared to the 9 electrodes in a rectangular 3 × 3 configuration for NovoTTF-100A or NovoTTF-200A (https://www.accessdata.fda.gov/cdrh_docs/pdf10/P100034c.pdf). Furthermore, the girth of body cavities is larger than the head and thus requiring higher injected current for deeper penetration. Therefore, the combination of higher electric output, greater number of electrodes, and increased required current injection could contribute to the higher saturation point for hydrogel conductivity in the thoracic and pelvic models.
One of the limitations of our study is that we did not discern between the basal and the dermal skin layers, both of which have unique physical and physiological properties that may account for differences in electric field interactions. Skin dosimetry within radiation oncology has been a continued challenge from the perspective of determining toxicity and their associated effects such as erythema, desquamation, and necrosis (Lee et al., 2022; Hoppe et al., 2008). In fact, the International Commission on Radiological Protection (ICRP) recommends evaluating the skin dose at both the basal and dermal layers separately at different depths (ICRP, 1977; ICRP, 1982; ICRP, 1992). Although ionizing radiotherapy and TTFields interact with biological tissue differently, treatments from both modalities have been reported to generate varying amounts of erythema in different patients (Lok et al., 2015; Lukas et al., 2017; Butcher and Williamson, 2021). These differences and varying effects would warrant further studies dedicated to identifying the specific interaction of TTFields at different layers of the skin. From a biologic perspective, scalp and skin could respond by hypervascularization to counteract increasing doses of applied TTFields. Hyper-vascularized scalp or skin could shunt the electric fields away from the depth of skin beneath the electrodes, causing the fields to scatter tangentially away from the point of contact rather than penetrating perpendicularly into the scalp or skin. In our prior report, scalp erythema was noted in a lateral or tangential fashion rather than localized just underneath the electrodes (Lok et al., 2015). It is probable to employ a simple approach that may be readily available, which is by applying local topicals to increase moisturization, especially using products with higher concentrations of glycerin, within the stratum corneum of the skin (Verdier-Sévrain and Bonté, 2007; Crowther et al., 2008; Loden, 2012). That is, by increasing moisturization within the epidermis, wetter skin has demonstrated increased electric conductivity and thus allow increased penetration of TTFields while minimizing charge retention within the epidermis (Wickett and Damjanovic, 2017; Li et al., 2001; Zhang et al., 2005).
There are differences in the PQMs for electric field, SAR and CD among individual head, thorax, and pelvis models. This type of individual variability indicates that TTFields coverage at the GTV or CTV are modulated by other parameters, including the geometry or location of the tumor, presence or absence of a necrotic core, association with cerebral edema, and proximity to a source of fluid such as the ventricles or bladder. First, tumors possessing asymmetry and angulated geometry have higher electric field values compared to those with symmetry and less angulation (Lok et al., 2017). This is most likely from charges accumulating at the sharp corners resulting in a higher electric force in certain regions of the tumor and therefore achieving a greater anti-tumor effect. Second, the presence of a necrotic core concentrates the electric fields to this intra-tumoral fluid-filled space and thus enabling the GTV to accumulate a greater amount of TTFields (Lok et al., 2017). Lastly, when the tumor is adjacent to ventricles or bladder, higher charges within these fluid-filled cavities may concentrate TTFields to the respective GTV or CTV (Lok et al., 2017; Lok et al., 2021). Consequently, tumor-associated or organ-specific characteristics modulate the distribution of TTFields within the intracranial, intrathoracic and intrapelvic sites.
There are potential variables that may alter TTFields distribution in the real-world patient population. Scalp thickness may be different among patients and scalp health, such as dandruff, velocity of hair growth, and diseases such as psoriasis and dermatitis, may alter penetration of TTFields from the surface. Tissue anisotropy may be another factor. However, the skull is a more significant attenuator of TTFields than the scalp. We believe that our approach in individualized modeling coupled with sensitivity analysis helps to mitigate these variables. Furthermore, there is a tradeoff between accuracy in individualized patient models and efficiency in modeling larger samples using an idealized brain or body segment (Ballo et al., 2019). We believe that personalized treatment or personalized TTFields planning is the best strategy to identify individual patient variabilities, and this will lead to a more accurate result. Our series that included 12 glioblastoma, 3 lung carcinoma and 2 ovarian carcinoma patients is still one of the largest in patient-specific models for the analysis of TTFields.
Conclusion
TTFields delivery for the treatment of cancer can be modulated by the conductivity of the hydrogel and skin/scalp at the transducer-scalp or transducer-skin interface. Optimizing this aspect of TTFields delivery may increase tumor control while minimizing toxicity at the surface. Electrically conductive topical applications to the epidermis may reduce scalp or skin irritations while simultaneously maximizing delivery of TTFields to the tumor.
Data availability statement
The raw data supporting the conclusions of this article will be made available by the authors, without undue reservation.
Author contributions
EL: Writing–original draft, Writing–review and editing. OL: Writing–original draft, Writing–review and editing. MH: Writing–original draft, Writing–review and editing. EW: Writing–original draft, Writing–review and editing.
Funding
The author(s) declare that financial support was received for the research, authorship, and/or publication of this article. This research was supported in part by The Musella Foundation for Brain Tumor Research & Information. EW thanks Luciana Ethier for administrative assistance in manuscript preparation.
Conflict of interest
The authors declare that the research was conducted in the absence of any commercial or financial relationships that could be construed as a potential conflict of interest.
Publisher’s note
All claims expressed in this article are solely those of the authors and do not necessarily represent those of their affiliated organizations, or those of the publisher, the editors and the reviewers. Any product that may be evaluated in this article, or claim that may be made by its manufacturer, is not guaranteed or endorsed by the publisher.
Supplementary material
The Supplementary Material for this article can be found online at: https://www.frontiersin.org/articles/10.3389/fbioe.2025.1484317/full#supplementary-material
References
Ballo, M. T., Urman, N., Lavy-Shahaf, G., Grewal, J., Bomzon, Z., and Toms, S. (2019). Correlation of Tumor Treating Fields dosimetry to survival outcomes in newly diagnosed glioblastoma: a large-scale numerical simulation-based analysis of data from the phase 3 EF-14 randomized trial. Int. J. Radiat. Oncol. Biol. Phys. 104 (5), 1106–1113. doi:10.1016/j.ijrobp.2019.04.008
Butcher, K., and Williamson, K. (2021). Management of erythema and skin preservation; advice for patients receiving radical radiotherapy to the breast: a systematic literature review. J. Radiotherapy Pract. 11 (1), 44–54. doi:10.1017/s1460396910000488
Ceresoli, G. L., Aerts, J. G., Dziadziuszko, R., Ramlau, R., Cedres, S., van Meerbeeck, J. P., et al. (2019). Tumour Treating Fields in combination with pemetrexed and cisplatin or carboplatin as first-line treatment for unresectable malignant pleural mesothelioma (STELLAR): a multicentre, single-arm phase 2 trial. Lancet Oncol. 20 (12), 1702–1709. doi:10.1016/s1470-2045(19)30532-7
Crowther, J. M., Sieg, A., Blenkiron, P., Marcott, C., Matts, P. J., Kaczvinsky, J. R., et al. (2008). Measuring the effects of topical moisturizers on changes in stratum corneum thickness, water gradients and hydration in vivo. Br. J. Dermatology 159 (3), 567–577. doi:10.1111/j.1365-2133.2008.08703.x
Dressel, M., and Scheffler, M. (2006). Verifying the Drude response. Ann. Phys. 15 (7-8), 535–544. doi:10.1002/andp.200510198
Gera, N., Yang, A., Holtzman, T. S., Lee, S. X., Wong, E. T., and Swanson, K. D. (2015). Tumor treating fields perturb the localization of septins and cause aberrant mitotic exit. PLoS One 10 (5), e0125269. doi:10.1371/journal.pone.0125269
Hoppe, B., Laser, B., and Kowalski, A. (2008). Acute skin toxicity following stereotactic body radiation therapy for stage 1 non-small cell lung cancer: who's at risk? Int. J. Radiat. Oncol. Biol. Phys. 75 (5). doi:10.1016/j.ijrobp.2008.08.036
ICRP (1977). Recommndations of the international commission on radiological protection. ICRP publication 26. Ann. ICRP 1 (3).
ICRP (1982). Protection of the patient in diagnostic radiology. ICRP publication 34. Ann. ICRP 9 (2-3).
ICRP (1992). The biological basis for dose limitation in the skin. ICRP publication 59. Ann. ICRP 22 (2).
Karanam, N. K., Srinivasan, K., Ding, L., Sishc, B., Saha, D., and Story, M. D. (2017). Tumor-treating fields elicit a conditional vulnerability to ionizing radiation via the downregulation of BRCA1 signaling and reduced DNA double-strand break repair capacity in non-small cell lung cancer cell lines. Cell Death Dis. 8 (3), e2711. doi:10.1038/cddis.2017.136
Kirson, E. D., Dbalý, V., Tovaryš, F., Vymazal, J., Soustiel, J. F., Itzhaki, A., et al. (2007). Alternating electric fields arrest cell proliferation in animal tumor models and human brain tumors. Proc. Natl. Acad. Sci. U. S. A. 104 (24), 10152–10157. doi:10.1073/pnas.0702916104
Lacouture, M. E., Anadkat, M. J., Ballo, M. T., Iwamoto, F., Jeyapalan, S. A., La Rocca, R. V., et al. (2020). Prevention and management of dermatologic adverse events associated with tumor treating fields in patients with glioblastoma. Front. Oncol. 10 (1045), 1045. doi:10.3389/fonc.2020.01045
Lacouture, M. E., Elizabeth Davis, M., Elzinga, G., Butowski, N., Tran, D., Villano, J. L., et al. (2014). Characterization and management of dermatologic adverse events with the NovoTTF-100A system, a novel anti-mitotic electric field device for the treatment of recurrent glioblastoma. Seminars Oncol. 41, S1–S14. doi:10.1053/j.seminoncol.2014.03.011
Leal, T., Kotecha, R., Ramlau, R., Zhang, L., Milanowski, J., Cobo, M., et al. (2023). Tumor Treating Fields therapy with standard systemic therapy versus standard systemic therapy alone in metastatic non-small cell lung cancer following progression on or after platinum-based therapy (LUNAR): a randomised, open-label, pivotal phase 3 study. Lancet Oncol. 24 (9), P1002–P1017. doi:10.1016/s1470-2045(23)00344-3
Lee, N., Chuang, C., Quivey, J., Phillips, T. L., Akazawa, P., Verhey, L. J., et al. (2022). Skin toxicity due to intensity-modulated radiotherapy for head-and-neck carcinoma. Int. J. Radiat. Oncol. Biol. Phys. 53 (3), 630–637. doi:10.1016/s0360-3016(02)02756-6
Li, F., Conroy, E., Visscher, M., and Wickett, R. R. (2001). The ability of electrical measurements to predict skin moisturization. I. Effects of NaCl and glycerin on short-term measurements. J. Cosmet. Sci. 52 (1), 13–22.
Loden, M. (2012). Effect of moisturizers on epidermal barrier function. Clin. Dermatology 20 (3), 286–296. doi:10.1016/j.clindermatol.2011.08.015
Lok, E., Hua, V., and Wong, E. T. (2015). Computed modeling of alternating electric fields therapy for recurrent glioblastoma. Cancer Med. 4 (11), 1697–1699. doi:10.1002/cam4.519
Lok, E., Liang, O., Malik, T., and Wong, E. T. (2023). Computational analysis of tumor treating fields for non-small cell lung cancer in full thoracic models. Adv. Radiat. Oncol. 8 (4), 101203. doi:10.1016/j.adro.2023.101203
Lok, E., San, P., Hua, V., Phung, M., and Wong, E. T. (2017). Analysis of physical characteristics of Tumor Treating Fields for human glioblastoma. Cancer Med. 6 (6), 1286–1300. doi:10.1002/cam4.1095
Lok, E., San, P., White, V., Liang, O., Widick, P. C., Reddy, S. P., et al. (2021). Tumor treating Fields for ovarian carcinoma: a modeling study. Adv. Radiat. Oncol. 6 (4), 100716. doi:10.1016/j.adro.2021.100716
Lukas, R., Ratermann, K., Wong, E. T., and Villano, J. L. (2017). Skin toxicities associated with tumor treating fields: case based review. J. Neuro-Oncology 135, 593–599. doi:10.1007/s11060-017-2612-8
Mehta, M. P., Gondi, V., Ahluwalia, M. S., Roberge, D., Ilic, R., Sio, T. T. W., et al. (2024). Results from METIS (EF-25), an international, multicenter phase III randomized study evaluating the efficacy and safety of tumor treating fields (TTFields) therapy in NSCLC patients with brain metastases. J. Clin. Oncol. 42 (Suppl. 16), 2008. doi:10.1200/jco.2024.42.16_suppl.2008
Shteingauz, A., Porat, Y., Voloshin, T., Schneiderman, R. S., Munster, M., Zeevi, E., et al. (2018). AMPK-dependent autophagy upregulation serves as a survival mechanism in response to Tumor Treating Fields (TTFields). Cell Death Dis. 9 (11), 1074. doi:10.1038/s41419-018-1085-9
Stupp, R., Taillibert, S., Kanner, A., Read, W., Steinberg, D. M., Lhermitte, B., et al. (2017). Effect of Tumor-Treating Fields plus maintenance temozolomide vs maintenance temozolomide alone on survival in patients with glioblastoma. JAMA 318 (23), 2306–2316. doi:10.1001/jama.2017.18718
Stupp, R., Wong, E. T., Kanner, A. A., Steinberg, D., Engelhard, H., Heidecke, V., et al. (2012). NovoTTF-100A versus physician’s choice chemotherapy in recurrent glioblastoma: a randomised phase III trial of a novel treatment modality. Eur. J. Cancer 48 (14), 2192–2202. doi:10.1016/j.ejca.2012.04.011
Swanson, K. D., Lok, E., and Wong, E. T. (2016). An overview of alternating electric fields therapy (NovoTTF therapy) for the treatment of malignant glioma. Curr. Neurol. Neurosci. Rep. 16, 8. doi:10.1007/s11910-015-0606-5
Timmons, J. J., Lok, E., San, P., Bui, K., and Wong, E. T. (2017). End-to-end workflow for finite element analysis of tumor treating fields in glioblastomas. Phys. Med. Biol. 62 (21), 8264–8282. doi:10.1088/1361-6560/aa87f3
Toms, S. A., Kim, C. Y., Nicholas, G., and Ram, Z. (2019). Increased compliance with tumor treating fields therapy is prognostic for improved survival in the treatment of glioblastoma: a subgroup analysis of the EF-14 phase III trial. J. Neurooncol 141 (2), 467–473. doi:10.1007/s11060-018-03057-z
Verdier-Sévrain, S., and Bonté, F. (2007). Skin hydration: a review on its molecular mechanisms. J. Cosmet. Dermatology 6 (2), 75–82. doi:10.1111/j.1473-2165.2007.00300.x
Voloshin, T., Kaynan, N., Davidi, S., Porat, Y., Shteingauz, A., Schneiderman, R. S., et al. (2020). Tumor-treating fields (TTFields) induce immunogenic cell death resulting in enhanced antitumor efficacy when combined with anti-PD-1 therapy. Cancer Immunol. Immunother. 69 (7), 1191–1204. doi:10.1007/s00262-020-02534-7
Wenger, C., Salvador, R., Basser, P. J., and Miranda, P. C. (2015). The electric field distribution in the brain during TTFields therapy and its dependence on tissue dielectric properties and anatomy: a computational study. Phys. Med. Biol. 60 (18), 7339–7357. doi:10.1088/0031-9155/60/18/7339
Wickett, R. R., and Damjanovic, B. (2017). Quantitation of 24-Hour moisturization by electrical measurements of skin hydration. J. Wound, Ostomy Cont. Nurs. 44 (5), 487–491. doi:10.1097/won.0000000000000363
Keywords: hydrogel, TTFields, cancer, toxicity, scalp, skin
Citation: Lok E, Liang O, Haack M and Wong ET (2025) Hydrogel and scalp/skin conductivities impact dose from tumor treating fields. Front. Bioeng. Biotechnol. 13:1484317. doi: 10.3389/fbioe.2025.1484317
Received: 21 August 2024; Accepted: 16 January 2025;
Published: 24 February 2025.
Edited by:
Silviya Petrova Zustiak, Saint Louis University, United StatesReviewed by:
Nikhil Pandey, University of Maryland, United StatesSharanabasava V. Ganachari, KLE Technological University, India
Copyright © 2025 Lok, Liang, Haack and Wong. This is an open-access article distributed under the terms of the Creative Commons Attribution License (CC BY). The use, distribution or reproduction in other forums is permitted, provided the original author(s) and the copyright owner(s) are credited and that the original publication in this journal is cited, in accordance with accepted academic practice. No use, distribution or reproduction is permitted which does not comply with these terms.
*Correspondence: Edwin Lok, ZWxvazJAYnJvd25oZWFsdGgub3Jn; Eric T. Wong, ZXdvbmcxQGJyb3duaGVhbHRoLm9yZw==