 Sicheng Zhang1†
 Jun Yao
 Minwei Zhang
95% of researchers rate our articles as excellent or good
Learn more about the work of our research integrity team to safeguard the quality of each article we publish.
Find out more
ORIGINAL RESEARCH article
Front. Bioeng. Biotechnol. , 02 August 2024
Sec. Biosensors and Biomolecular Electronics
Volume 12 - 2024 | https://doi.org/10.3389/fbioe.2024.1444846
This article is part of the Research Topic FEAST of biosensors: Food, environmental, and agricultural sensing techniques (FEAST) View all 5 articles
Excessive residue of metronidazole (MNZ) in food is harmful to the human body. There is an urgent demand to develop a portable tool for MNZ detection on-site. In this study, fifteen aptamers were prepared through targeted base mutation. Apt1-3 with the highest enrichment was chosen for further study. Its affinity was characterized by molecular docking simulation, AuNPs colorimetric assay, graphene oxide (GO) fluorescence assay, and exonuclease assay. Kd was determined by GO fluorescence assay (Kd: 92.60 ± 25.59 nM). Its specificity was also characterized by an exonuclease assay. A novel aptasensor was constructed by using the newly identified aptamer combined with the smartphone dark box. The principle of color change is caused by the aggregation state of AuNPs. Smartphones act as reading instruments. The detection can be completed in just a few seconds without the aid of instruments, achieving a detection limit of 0.15 nmol/mL and a range of 6.7–44.4 nmol/mL (R2 = 0.9810). Therefore, the constructed smartphone colorimetric sensor based on mutant aptamers has important applications in food detection.
Aptamers, which bind targets with high affinity and specificity, are short, single-stranded DNA or RNA sequences isolated from random oligonucleotide libraries through an in vitro approach called exponential enrichment (SELEX) (Ellington and Szostak, 1990; Tuerk and Gold, 1990). The unique advantages of low cost, easy modification, high stability, and long shelf life make them suitable for the construction of biosensors (Nimjee et al., 2005; Dunn et al., 2017). SELEX is a high-throughput method for screening aptamers. Unfortunately, the screened aptamers need to be modified to improve efficiency (Khoshbin and Housaindokht, 2021). Thus, there is room for improvement in sensitivity, specificity, and affinity in the aptamers acquired through the SELEX. In addition, aptamer optimization is extremely important. So far, the base mutation strategy is an effective method to enhance aptamer affinity. The base mutation changes the hydrogen bond and van der Waals forces between the molecule and the target substance, and it also affects the spatial structure of the aptamer (Ma et al., 2022; Manuel et al., 2022). However, the workload of a completely randomized mutation design would be cumbersome. It was shown that the aptamer stem-loop low-energy A-T bases transformed into high-energy G-C bases that could affect the affinity of the aptamer with the target, obtaining high-affinity aptamers (Kimoto et al., 2016). And single-base A-G and T-C mutations have the same effect (Sha et al., 2023).
Over the past three decades, the field of aptamer-based sensing has evolved considerably. Apt-based biosensor detection technologies are characterized by ease of operation, high sensitivity, and automation and have been widely used in the fields of food safety detection, cell physiology, drug targeting, and disease diagnosis (Kwon et al., 2014; Nguyen et al., 2018; Wang et al., 2019; Zhu et al., 2024). Aptamer biosensors include fluorescent aptasensors, colorimetric aptasensors, electrochemical sensors, and surface plasmon resonance aptasensors (Bhalla et al., 2016; Mehlhorn et al., 2018; Guo et al., 2021; Chen et al., 2024). Among these, the aptasensors constructed based on the colorimetric method have the advantage of visualization (Geleta, 2022). However, the naked eye is not sensitive enough to color changes, which limits the application of colorimetric sensors on POCT platforms (Kim and Cho, 2022). To solve this problem, a smartphone-based color-pickup device was designed. It is currently being used in paper-based colorimetry (Jiang et al., 2023), gold nanoparticle lateral flow assay (LFA) (Ruppert et al., 2019), disease diagnosis, environmental monitoring, food safety (Zahra et al., 2022), and other areas (Huang et al., 2021). This device is based on the principle of converting experimental data into RGB parameters. The RGB color model is an additive color model that superimposes red, green, and blue light in various ways to form various colors. In the RGB color model, any color in the tertiary color space can be specified by its color coordinates (Fernandes et al., 2020; Laddha et al., 2022). Thus, it was used to build colorimetric ranges (Ciaccheri et al., 2023). The RGB Color Picker software on your smartphone takes a digital image of the area to be measured, identifies subtle differences in the hue of the image, and performs chromaticity value analysis by determining a linear or non-linear relationship between the concentration of the sample and the chromaticity value. Therefore, this sensor built on a smartphone’s colorimetric methodology has significant value on Point of Care Testing (POCT) platforms (Zhang et al., 2020).
In this work, novel aptamers based on Apt0 were obtained by using single-base alterations in A-G, T-C, and C-G, G-C (Wei et al., 2020). Through secondary structure analysis and three-dimensional molecular docking, the binding and structural properties before and after the aptamer mutation were examined and characterized. Additionally, the binding affinity of MNZ to the aptamers was validated by exonuclease, GO fluorescence, and AuNPs colorimetry techniques (Figure 1). Then, the smartphone-based colorimetric aptasensor of MNZ was optimized using the aptamer with the greatest affinity. To raise the assay’s detection sensitivity under ideal detection circumstances. Using both original and mutant aptamers, the aptasensor’s sensitivity, specificity, and accuracy were evaluated. Lastly, the suggested colorimetric-sensitive smartphone sensor was used one more time to find the MNZ content in actual food samples. This work used the mutant aptamer to construct a fast and sensitive smartphone test based on the colorimetric approach to detect MNZ in milk. The assay has a lot of potential applications in the field of food safety detection.
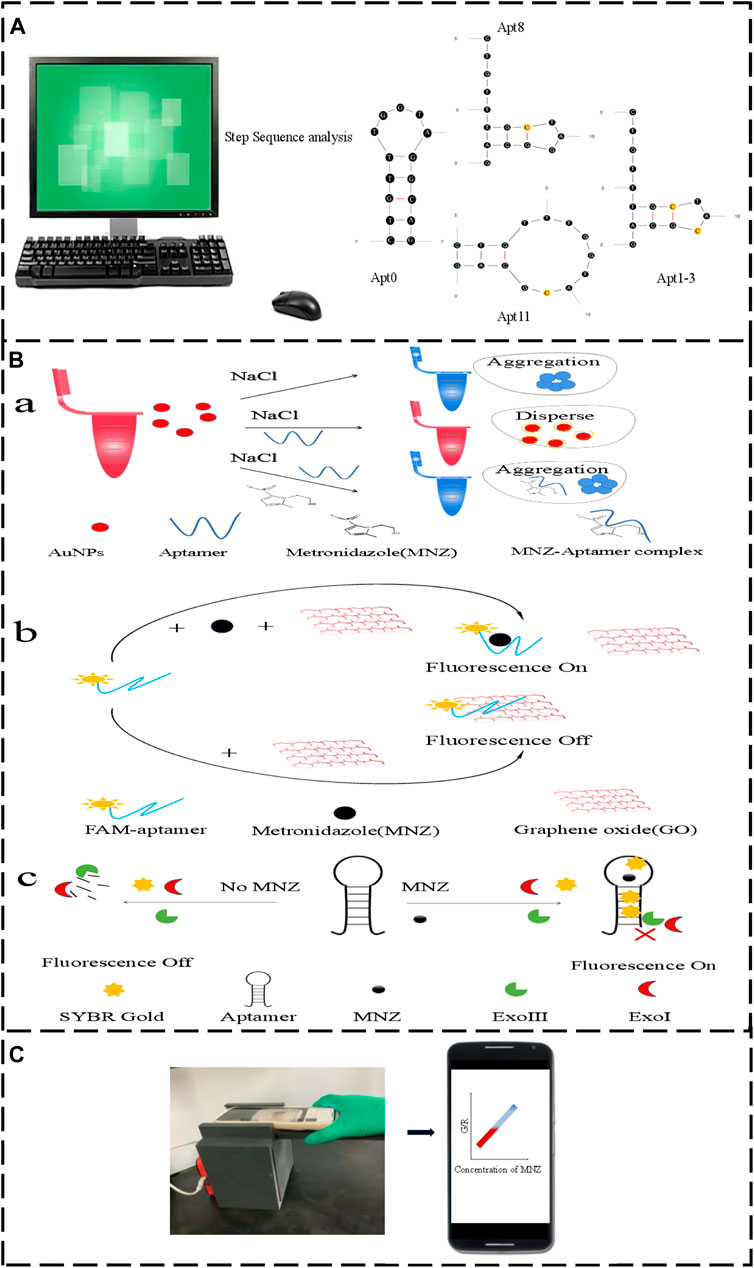
Figure 1. (A) The original aptamer-Apt0 was mutated to Apt8, Apt11 and Apt1-3. (B,a) Aptamer AuNPs schematic. (B,b) Graphene oxide fluorescence method schematic diagram. (B,c) Exonuclease schematic diagram. (C) Smartphone Dark box colorimetric device.
DNA probes (see Supplementary Tables S1, S2 for detailed sequences) were purchased from Shanghai Sangon Biotechnology Co., Ltd. (China). HAuCl4·3H2O, graphene oxide, ornidazole, tetracycline, norfloxacin, tobramycin sulfate, Tris-HCL (pH 6.8, pH 7.0, pH 7.4, pH 8.0, pH 8.8) buffer, acetonitrile, sodium carbonate, and NaCl were from Shanghai Macklin Biochemical Co., Ltd. (China). Metronidazole was purchased from Shanghai CATO Biochemical Co., Ltd. (China). Trisodium citrate dihydrate was obtained from Tianjin Yongsheng Fine Chemical Company (China). Dimethyl sulfoxide was purchased from Shanghai Biosharp Biochemical Co., Ltd. (China). Exonuclease Ⅰ and Exonuclease Ⅲ were from Wuhan ABclonal Biotechnology Co., Ltd. (China). SYBR Gold was obtained from Shanghai Thermo Fisher Scientific Co., Ltd. (China). Milk was obtained at the local market. All experimental water was Wahaha aquatic products in Hangzhou.
The UV-vis spectrophotometer SHIMADZU UV-2700 (SHIMADZU Co., Ltd.) was used. The transmission electron microscope JEM-2100 (JEOL Japan Electronics Co., Ltd.) was used. A chilled centrifuge, KDC-2044 (Zhongke Instrument Co., Ltd.), was used. An ultrasonic nicator, KQ3200DE (Kunshan Instrument Co., Ltd.), was used. Incubator shaker ZHWY2102C (Analytical Instrument Manufacturing Co., Ltd.) was used. Atomic Force Microscopy (AFM) Dimension ICON (Bruker AXS Co., Ltd.) was used. The fluorescence intensity was measured on an INFINITE 200Rro. (Tecan Trading Co., Ltd.). The mass weighing was obtained from the METTLER TOLEDO ABB5-S (Kaiwei Measurement Technology Co., Ltd.). The vortex mixer MS3BS25 (IKA Co., Ltd.) was used to fully mix the solution.
The three-dimensional structure of the small molecule MNZ was obtained from the PubChem database (https://pubchem.ncbi.nlm.nih.gov). The chemicals that were downloaded were optimized and converted to mol2 format using Chem3D. Atomic charges and designated atom kinds were imported together with small molecule compounds into the Auto Dock Tools program. Every flexible key point has rotatable defaults. Ultimately, the optimal conformation was maintained as the docking ligand in the pdbqt format. Aptamer structures were predicted using the nucleic acid structure modeling service RNAComposer (https://rnacomposer.cs.put.poznan.pl/), which substitutes base T with U (Jeddi and Saiz, 2017). The molecular dynamics software Amber20 was used to repair the U of the aptamers’ structures to T. The force field used was Amber14SB, and it used minimal energy. In the end, it was kept as a docking aptamer. Using AutoDock4.2, the binding free energy of MNZ with aptamers was determined. The Lamarckian genetic technique was used to compute molecular docking. The final docking structure was assessed using binding free energy. Pymol 2.1 was used to process the docking findings.
The Amber 2020 was used to perform molecular dynamics simulations of the aptamer-MNZ complexes. For the aptamers, the AMBER14SB force field characteristics were utilized, and for MNZ, the standard general force field parameters were employed. With atoms in the aptamer at least 1.0 nm away from the water box’s border, the TIP3P dominating water model was selected. Ions of either sodium or chloride were used to balance the system charge. The process of simulating molecular dynamics involved four stages: energy minimization, production kinetics simulation, equilibration, and heating. Using the MMPBSA approach, the free energy of binding between aptamer and MNZ was calculated.
The following was the colorimetric analysis process: 300 μL of AuNPs and 200 μL of aptamer (0.06 μM) were combined and incubated at 25°C for 5 min. Following this, 200 µL of MNZ solution at several concentrations was added to the mixture, which was then reacted at 25°C for 25 min. Finally, 200 µL of 40 mM NaCl was added to mix evenly. The color of the solution was examined at various concentrations, and the spectrogram was quantified in the 400–800 nm ultraviolet spectrum region to determine a detectable linear range and LOD (LOD = 3σ/S, where σ is the standard deviation of the assay value for 11 blank samples and S is the linear slope).
The Kd values were determined with GO fluorescence (Chen et al., 2014). To measure the Kd values of aptamers binding to MNZ. The aptamer with FAM modified at the 5′end was denatured at 95 °C for 10 min, followed immediately by an ice bath for 10 min. Then, the 0–250 nM aptamer (100 μL) was shaken with 100 μL (1.5 μM) MNZ for 2 h. In the end, GO with a (GO/aptamer) mass ratio of 200/1 (200 μL, 2 mg/mL) was added, waiting 30 min to observe the fluorescence intensity. The fluorescence intensity was recorded (excitation and emission wavelengths were 485 nm and 520 nm). The affinity (Kd value) of the aptamer to MNZ can be effectively calculated. According to the equation ΔF = Bmax*ssDNA/(Kd + ssDNA) fitting by software Oring 2022 (ΔF = F - F0; F stands for the experimental group’s fluorescence intensity, F0 for the negative control group’s fluorescence intensity, ssDNA for the additional aptamer’s concentration, and Bmax for the maximum fluorescence intensity).
Exonuclease digestion was used to further verify the affinity of aptamers (Alkhamis et al., 2023; Canoura et al., 2023). 100 μL aptamer and 100 μL MNZ (0.25 μM) were incubated at 25°C for 30 min, and 100 μL (15 U/mL) exonuclease was incubated at 25°C for 60 min. In the end, 300 µL mixed solution was injected into 100 μL (0.2 X SYBR Gold) and reacted at 25°C for 25 min. The fluorescence intensity was recorded (490 nm was the excitation wavelength and 540 nm was the emission wavelength).
A 3D dark box with an attached tape inside which was printed entirely in black polylactic acid (PLA) was designed to use CAD drawing combined with 3D printing technology. The box was lined with a black absorbent material. There, a smartphone dark box colorimetric device was established. For MNZ solution preparation, refer to Section 2.4.1. Colorimetric aptasensor. Firstly, the prepared MNZ solution was placed on the sample plate. Then, the sample plate was placed in the dark box. Finally, the smartphone was used for color. The G/R values were used to characterize the content of MNZ and to establish a detectable linear range with a limit of detection.
To test the proprietary nature of the MNZ sensing system, the system was tested using four MNZ analogs, tobramycin sulfate (TS), ornidazole (ONZ), norfloxacin (NFX) and tetracycline (Tet). These analogs were added to the established smartphone colorimetric sensor. Selective analysis based on the △R of G/R (△R = G/R with analogs - G/R with blank).
2 mL milk was prepared. Then 11.5 mL acetonitrile and trichloroacetic acid aqueous solution (9:1, v: v) were added to remove protein, and Na2CO3 aqueous solution (500 μL, 1.0 mol/L) was added to precipitate Ca2 +. Then shake for 10 min, ultrasound for 15 min, and stand for 20 min. Finally, The mixture was then centrifuged at 12,000 rpm for 15 min. The supernatant was transferred to an extraction column (HLB). The filtrate was collected and drynessed at 40°C under a stream of nitrogen. The residue was collected and dissolved for use.
Base mutations can alter the force of interaction between the aptamer and the target, thereby increasing the affinity of the aptamer (Ma et al., 2022; Manuel et al., 2022). Therefore, although the affinity and specificity of the original Apt0 were basically satisfactory, there is still potential to enhance its affinity by mutating specific bases.
To reduce the cost of detection and improve affinity and performance, seven aptamers were obtained using A-G and T-C base mutations. To make a preliminary assessment of the affinity of the mutant aptamers, molecular docking was used to analyze the binding energies of the seven aptamers. The results showed that (Supplementary Table S3), the binding energy of the aptamers to MNZ was not greatly altered and was even lower than the original aptamer. Thus, eight new aptamers were obtained using C-G and G-C base mutations. The results showed that Apt8 and Apt11 had a good binding effect with MNZ, and the binding energies were −4.02 and −3.48 kcal/mol, respectively. Further, A new idea emerged: combining the superior Apt8 and Apt11 mutations to obtain a new aptamer, would its affinity be further enhanced? Therefore, a new Apt1-3 was obtained by combining Apt8 and Apt11. The results showed that Apt1-3 had a better binding effect with MNZ than Apt8 and Apt11, and the binding energy was −4.32 kcal/mol (Supplementary Table S3). The result was as expected. Next, the binding mechanisms of these four aptamers were further explored. The base residues that MNZ bound to the aptamer can be seen. The residues of MNZ interacting with Apt1-3 were C-8, A-10, T-9, T-5, G-12, C-11, etc. Among them, MNZ can interact with C-11 and A-10 through hydrogen bonds. There was a strong hydrogen bond interaction; the average hydrogen bond distance was 2.0 Å, and the length was less than 3.5 Å. It has a strong binding ability and plays an important role in stabilizing MNZ in the pocket of the Apt1-3 site. In addition, the five-membered nitrogen heterocyclic ring of MNZ formed a pi-pi conjugate interaction with the base part of the T-9 residue, which also made an important contribution to the stability of MNZ. Combined with Figure 2A, it can be found that MNZ matched well with the Apt1-3 site, which was conducive to the formation of a stable complex between MNZ and Apt1-3 (the secondary structures of the mutant aptamers are shown in Figure 1A; Supplementary Figure S1).
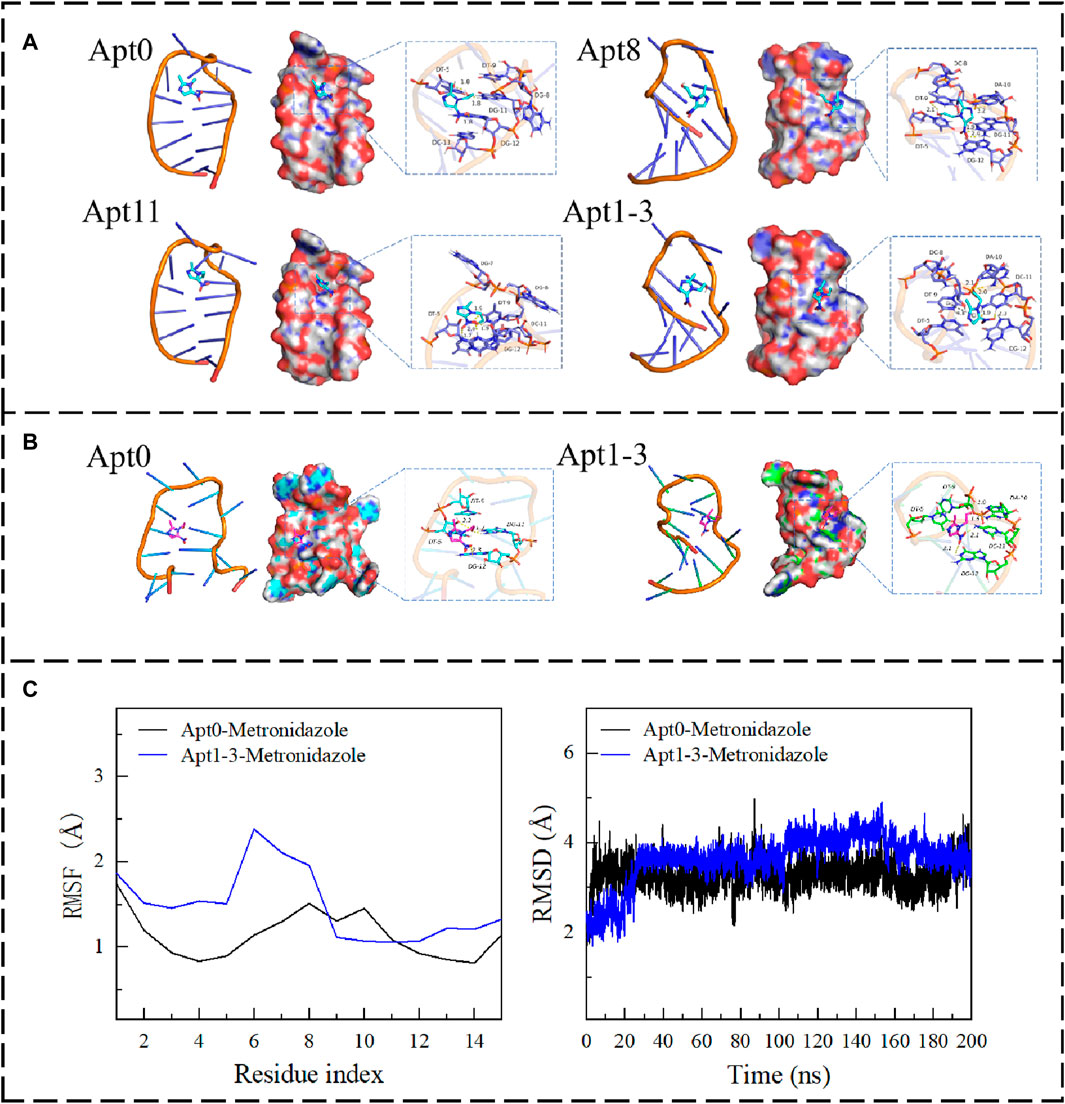
Figure 2. (A) The binding mode of Apt0, Apt8, Apt11, and Apt1-3 with MNZ. (B) The binding mode of Apt0 and Apt1-3 with MNZ after MD. (C) The RMSF and RMSD of Apt0 and Apt3 after 200 ns of molecular dynamics.
To explore the changes in the affinity of the aptamers. The kinetic simulation was used to compare the original aptamer with the aptamer with the highest binding energy, which revealed all of them had changes in conformation for binding to MNZ, but all of them (Figure 2B) were able to form stable complexes with MNZ. The binding free energy was used for analyzing changes in aptamer binding modes by measuring the thermodynamic properties of the aptamer. Negative values of binding free energy (ΔGbinding energy) highlighted the stability of the system, while positive values showed instability. Electrostatic interactions had a high performance in stabilizing MNZ, followed by van der Waals interactions. The free energy of binding of MNZ to Apt1-3 aptamer was −28.52 ± −0.35 kJ/mol, where electrostatic occupied a major role (−22.32 ± −2.78 kcal/mol), which indicated that MNZ was able to remain stably in the aptamer site pocket with strong electrostatic interactions with the surrounding residues. In addition, MNZ formed effective van der Waals interactions with the surrounding residues (−17.25 ± −0.38 kcal/mol) due to a better fit to Apt1-3. The free energy of binding of MNZ to the Apt0 aptamer was −22.91 ± −0.76 kJ/mol, which was a weaker affinity than that of MNZ and Apt1-3, mainly because the electrostatic and van der Waals interactions between MNZ and Apt0 were weaker than those between MNZ and Apt1-3 (Figure 2C). In summary, MNZ and Apt1-3 had a strong affinity, and these affinities can lead to the formation of stable complexes between MNZ and aptamer, thus exerting active effects.
The colorimetric method has been shown to measure aptamer affinity and is based on the fact that MNZ is bound specifically to the aptamer. It caused the AuNPs to aggregate at high NaCl concentrations. The solution would be from red to blue (Du et al., 2021) (Figure 3A). AuNPs were synthesized based on previous studies (Qin et al., 2022). In short, a 100 mL boiling solution of HAuCl4 (1 mM) was quickly injected with 10 mL of sodium citrate solution (38.8 mM) while being vigorously stirred. After 10 minutes of boiling and stirring, the heat was turned off, and the mixture was stirred for another 10 min. After reaching room temperature, the resultant wine-red solution was kept in dark glass bottles at 4°C for later use. AuNPs were subjected to transmission electron microscopy (TEM) scanning. From Figures 3B, C, its UV absorption peak is at 520 nm. According to Haiss et al. (Haiss et al., 2007; Zhao et al., 2008), it can be deduced that the molar concentration of AuNPs was approximately 3.52 × 10⁻⁹ mol/L. And, from Figure 3D, AuNPs had an average diameter of 13 nm. Overall, the above results indicate that the synthesis of AuNPs was successful.
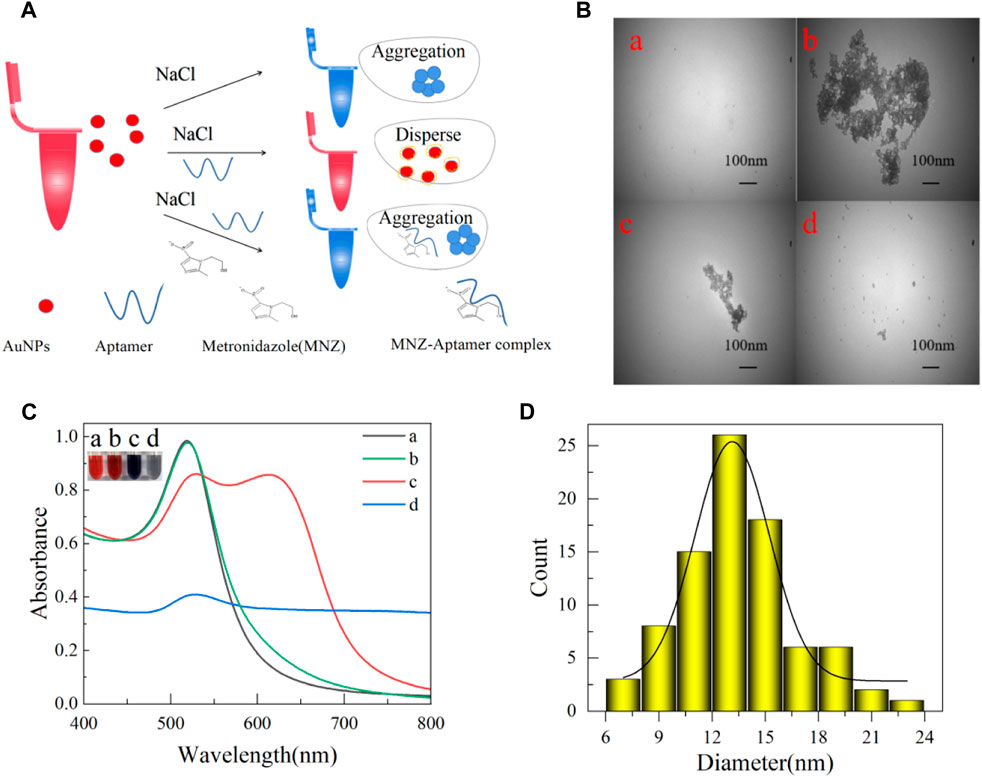
Figure 3. (A) AuNPs colorimetric schematic. (B) Transmission electron microscopy (TEM) of AuNPs in different states of 100 nm. (C) Spectrograms of AuNPs in different states (a: newly prepared AuNPs; b: 0.06 μM aptamer and 40 mM NaCl were added; c: added 0.06 μM aptamer, 40 μM MNZ, and 40 mM NaCl; d: added 40 mM NaCl). (D) AuNPs size distribution map.
The performance of the established MNZ test was significantly impacted by NaCl concentration, aptamer concentration, the incubation time of AuNPs and aptamer, the reaction time of aptamer and MNZ, the pH of Tris-HCL buffer solution, and temperature throughout incubation. However, AuNPs will aggregate with the increase in NaCl concentration, and the color will change from red to blue. Therefore, optimization of the concentration of NaCl was preferred for the reliability of the assay. Different concentrations of 200 μL of NaCl were added to 700 μL of AuNPs, and as the concentration of NaCl increased (Supplementary Figures S2A, B), the solution changed from red to blue, and the ratio of A650/A520 also increased. When the concentration of NaCl increased to 40 mM, the ratio was almost unchanged. The addition of NaCl at this point caused the AuNPs to aggregate almost completely, so the optimal concentration of NaCl was 40 mM. Then, to determine the optimal concentration of aptamer to protect AuNPs from high NaCl concentrations, 200 μL of aptamer of different concentrations was added to the AuNPs system. As the aptamer concentration increased, the solution changed from blue to red, and the ratio decreased. When the aptamer concentration increased to 0.06 μM, the ratio was almost unchanged (Supplementary Figures S2C, D). The amount of aptamer added at this point can completely adsorb and protect the surface of the AuNPs from high NaCl concentrations, so the optimal concentration was 0.06 μM. However, the protective effect was also influenced by the incubation time; with the increased incubation time of aptamer and AuNPs, the ratio decreased. When the incubation time increased to 5 min, the ratio tended to be stable, the aptamer was well absorbed on the surface of the AuNPs, and the incubation time was 5 min (Supplementary Figure S2E). Similarly, the reaction of MNZ with aptamer was also affected by time. As the reaction time of aptamer and MNZ increased, the ratio increased. When the time increased to 25 min, the ratio tended to be stable; MNZ had completely combined with the aptamer, so the incubation time was 25 min (Supplementary Figure S2F). The temperature and pH of the buffer will affect the system. For the temperature, with the increase in temperature in the system, the △RA650/A520 increased and then decreased. When the temperature was 25 °C, the △RA650/A520 was the highest. And the system was more sensitive. Therefore, 25 °C was selected as the optimal temperature (Supplementary Figure S2G). For the pH of the Tris-HCL buffer solution, with the increase of the pH of the Tris-HCL buffer solution of the aptamer in the system, the △RA650/A520 in the system increased first and then decreased. When pH was 7.0, the △R A650/A520 was the largest and most sensitive. Thus, the pH of the buffer solution was 7.0, which was the optimal pH (Supplementary Figure S2H) (△RA650/A520 = A650/520 with MNZ-A650/520 blank).
After the optimization of the experimental parameters to identify the high-affinity aptamer, the quantification performance of the MNZ colorimetric aptasensor was validated using a series of MNZ solutions with different concentrations, respectively. Among them, Apt8, Apt11, and Apt1-3 aptamers had a better performance. The UV-vis absorption spectrum of the MNZ colorimetric aptasensor against different MNZ concentrations was recorded in Supplementary Figure S3, S4 (other mutant aptamers of molecular docking binding energies and colorimetric results were analyzed in Supplementary Table S3). The aptasensor results showed that the detection line of Apt0 was 0.67 nmol/mL, Apt8 was 0.50 nmol/mL, Apt11 was 0.60 nmol/mL, and Apt1-3 was 0.12 nmol/mL. The aptasensors of Apt1-3 were nearly six times more sensitive compared to the aptasensors of Apt0. Consistent with the molecular docking results.
To further validate the affinity, the GO fluorescence method was used to determine the dissociation constants (Xing et al., 2012). The 2D surface structure of GO and the excellent energy transfer (FRET) mechanism combine with aptamers to produce the effect of fluorescence quenching. The aptamer was not adsorbed by GO when the target was present (Figure 4A) (Zhang et al., 2017; Meng et al., 2022). To determine if the GO was a single layer. The characterization of the GO used from the AFM image (Figures 4B, a) showed that the thickness of the GO sheet was 2.55 nm (Figures 4B, b), which was within the expected range for monolayer GO. Meanwhile, the amount of GO added was optimized to make sure that the added GO could completely adsorb the aptamer that was not bound to the target. It can be seen from the figure (Figures 4B, c) that gradual fluorescence quenched with the addition of GO. When the mass ratio of the aptamer to GO is 1/50, the aptamer can be completely adsorbed by GO. Kd values of Apt0, Apt8, Apt11, and Apt1-3 were measured under optimized conditions. As the concentration of the aptamer increased, the fluorescence was enhanced, and the results are shown in Figure 4C. The content of the aptamer was directly proportional to the fluorescence intensity. Apt1-3 has a lower Kd value of 92.60 ± 25.58 nM, which means it has the highest affinity for MNZ.
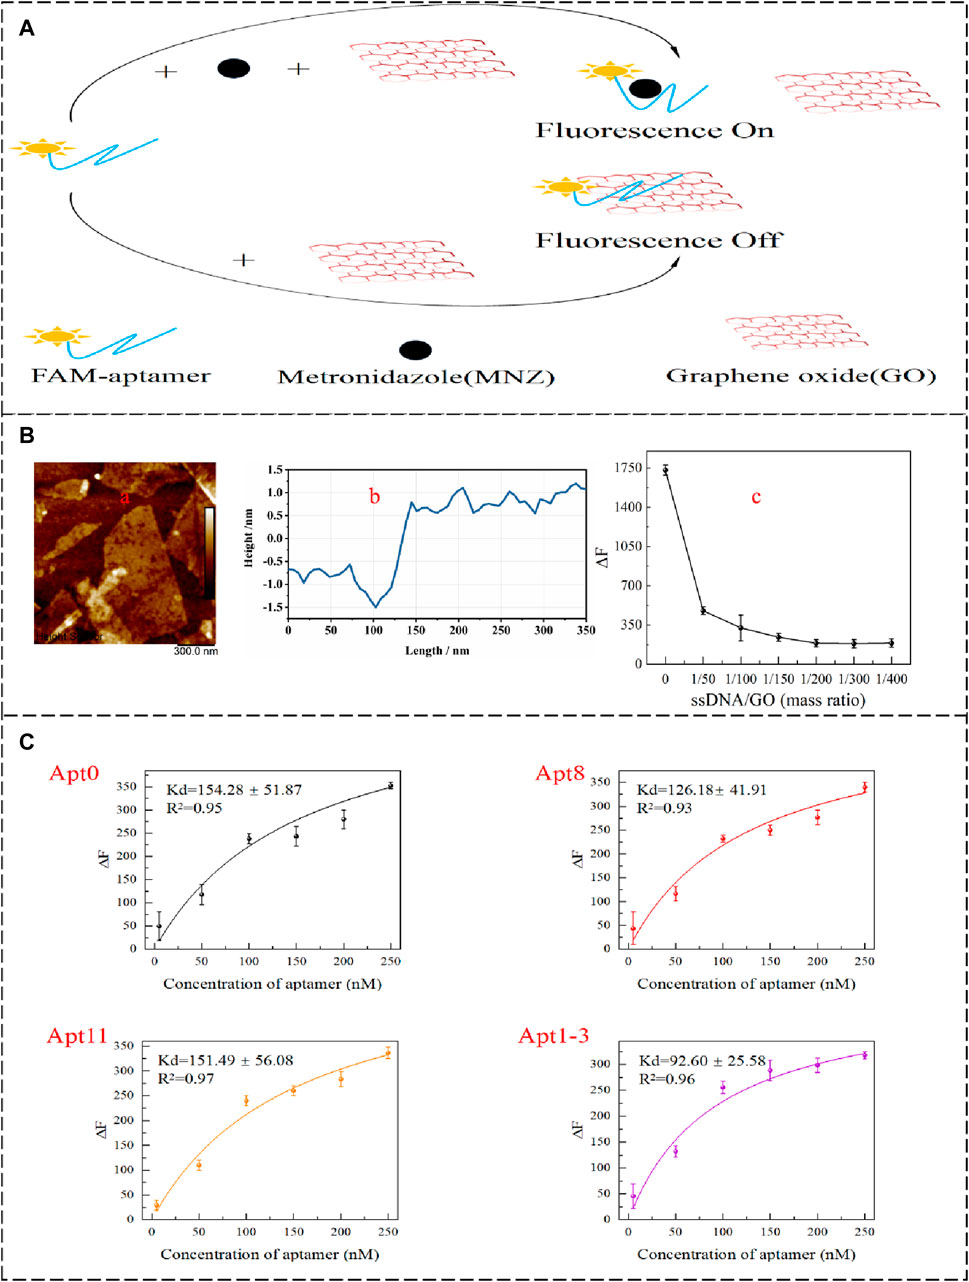
Figure 4. (A) GO-based fluorescence method to detect the affinity of aptamer schematic diagram. (B,a,b) The AFM images of GO. (B,c) Effect of GO addition concentration on △F. (C) Apt0, Apt8, Apt11, and Apt1-3 Kd value fitting curve.
To verify the affinity of the aptamer even further. Exonuclease digestion can be used to assess aptamer affinity (Alkhamis et al., 2023; Canoura et al., 2023). Exonucleases can digest aptamers, and the digested single-stranded DNA cannot be stained. In the presence of the target, it can prevent the digestion of aptamers. SYBR Gold can dye single-stranded DNA and show strong fluorescence. The affinity of the aptamer can be evaluated by this fluorescence alteration (Figure 5A). In this experiment, exonuclease Ⅰ and exonuclease Ⅲ were in equal proportion optimized (Figures 5B, a). Different concentrations of exonuclease (100 μL) were added to the 100 nM aptamer. The fluorescence intensity decreased significantly. When the concentration of exonuclease was increased to 15 U/mL, the fluorescence intensity hardly changed. It demonstrated that the aptamer was completely digested. When MNZ (0.25 μM) was added, as the concentration of aptamer increased, the fluorescence intensity was enhanced, and the results showed that Apt1-3 has a higher affinity for MNZ (Figures 5B, b).
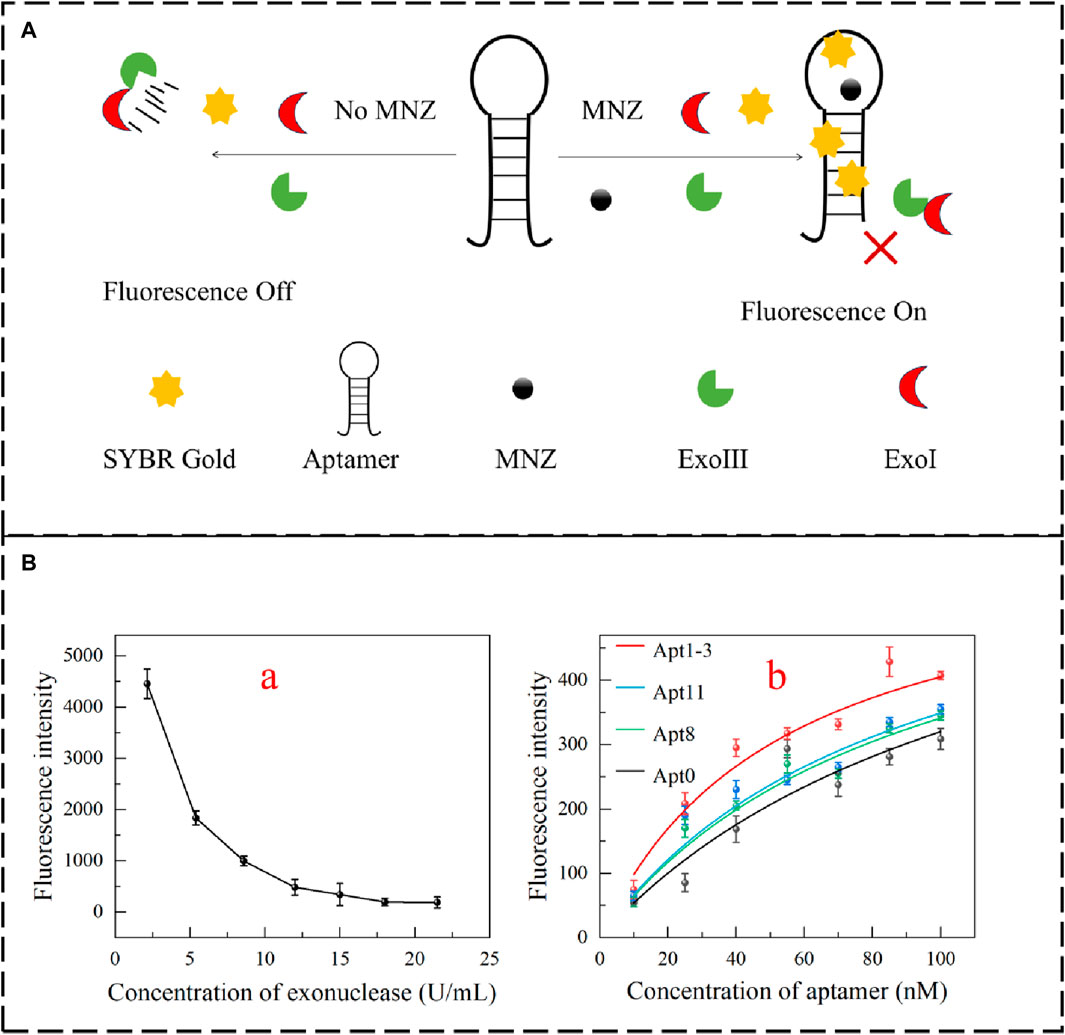
Figure 5. (A) Schematic diagram for detecting the affinity of aptamers based on the exonuclease fluorescent method. (B,a) Optimization of exonuclease incorporation. (B,b) Apt0, Apt8, Apt11 and Apt1-3 fluorescence intensity fitting.
To improve the convenience of the testing method, an RGB model-based smartphone device was established. It read the color change of the detection system and worked by analyzing the RGB value through smartphone software. Besides, to avoid the effects of environmental factors, 3D printing technology was used to design a dark box with tape inside, which was completely printed with black polylactic acid. The dark box was lined with black absorbing material, which can block the internal random reflection from visible light to infrared light (250–2000 nm), and the hemisphere reflectivity was less than 1%. It can effectively prevent the interference of stray light and internal reflection in the color selection process. The design drawing of the 3D dark box and its physical display are shown in Figure 6A and Supplementary Figure S5. It was perfectly combined with the smartphone colorimetric software F Color Picker (version 1.2.2). Different concentrations of MNZ were added to the sample plate for color-taking and counting. The experimental results showed that the G/R value was linearly related to the concentration of MNZ in the range 6.7–44.4 nmol/mL (R2 = 0.9810), and the limit of detection (LOD) was 0.15 nmol/mL (Figure 6B). The final concentration obtained from the proposed smartphone platform was in good agreement with the UV result.
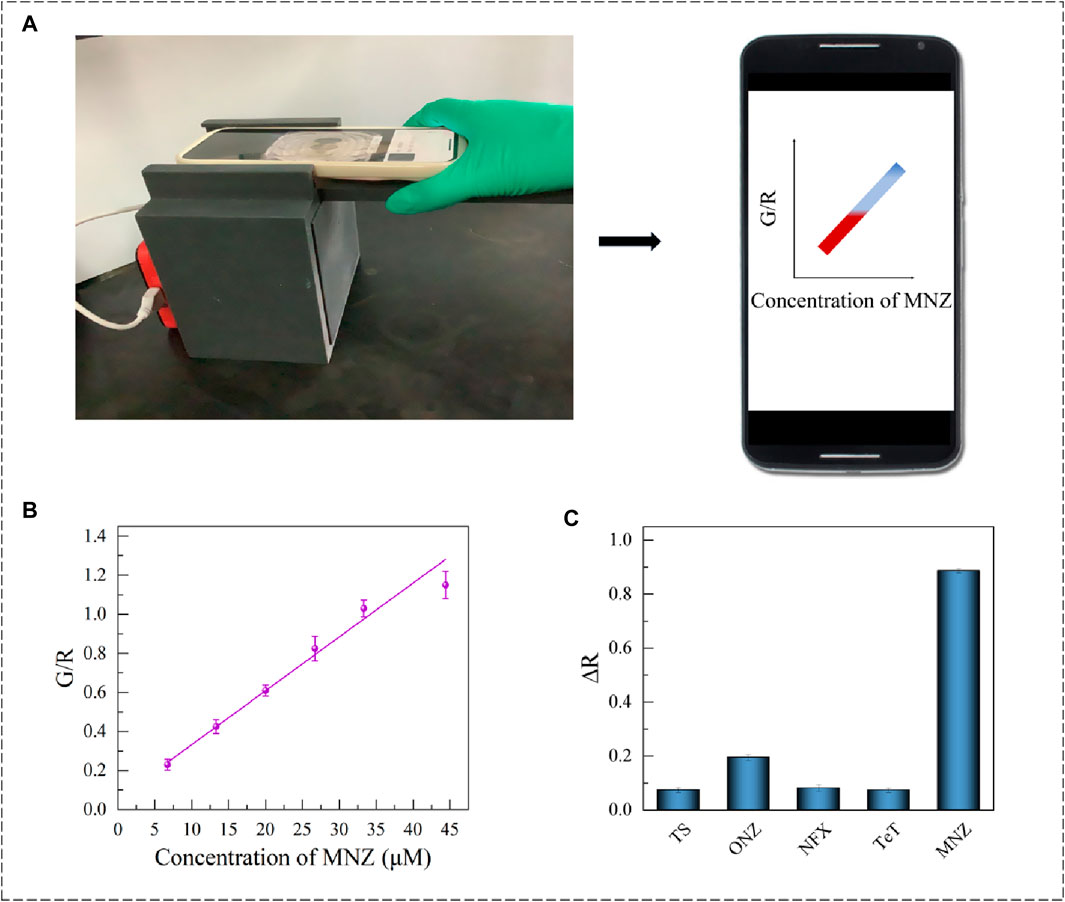
Figure 6. (A) Smartphone colorimetric device diagram and chart. (B) Apt1-3 Smartphone colorimetric linear range. (C) Apt1-3 proprietary validation chart.
To investigate the specificity of the established installation, 200 μL (20 μM) of tobramycin sulfate (TS), ornidazole (ONZ), norfloxacin (NFX), and tetracycline (Tet) were added to the smartphone sensor system separately. After spass software calculation and analysis (p < 0.05) (Figure 6C), it was suggested that the proposed smartphone colorimetry assay presented excellent selectivity to distinguish MNZ from its analogues.
To confirm the feasibility of the smartphone sensor in real samples, 10 μM, 20 μM, and 30 μM MNZ were spiked into the milk sample. The spiked recoveries can be calculated according to the equation: spiked recovery = (spiked sample measured value - sample measured value)/spiked volume*100%. The results are presented in Table 1. The recoveries of Apt1-3 were in the range of 92.5%–100.4%, which demonstrated that the developed assay showed satisfactory performance for the detection of MNZ in real samples. Compared with the existing detection methods (see Table 2), the designed detector performed well. It is noteworthy that the actual concentration output can be accomplished in seconds without tedious steps. The method offers potential applications for POCT platforms.
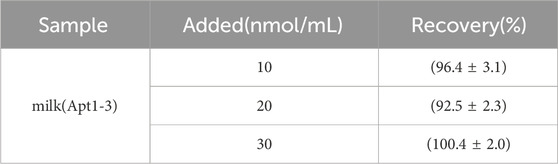
Table 1. Recovery of Apt1-3 in milk.
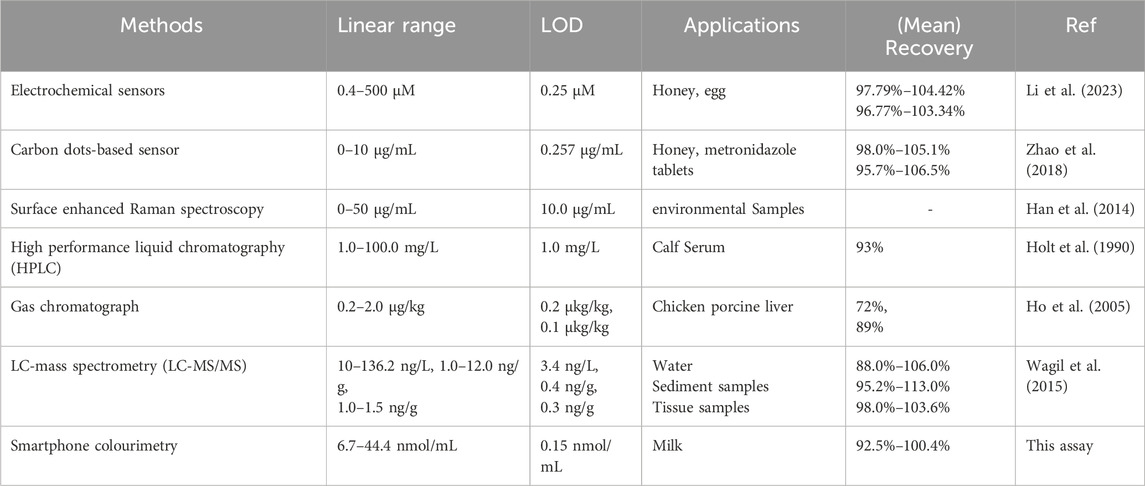
Table 2. Comparison table of metronidazole assay methods.
In this study, 15 aptamers were obtained by base-directed mutation using computer simulation, the colorimetric method, the GO fluorescence method, and the nucleic acid exonuclease method to find the Apt1-3 aptamer with high affinity. In addition, we present a portable, low-cost biosensor based on the combination of a smartphone and a 3D box for the detection of MNZ in milk. The determination of MNZ was achieved by analyzing the RGB values through the software F color picker (version 1.2.2) on the smartphone. This portable device has no restriction on the place of use. All the experimental results showed that this portable biosensor has a good ability to detect MNZ with an LOD of 0.15 nmol/mL. It demonstrates the great potential for drug residue detection. In conclusion, smartphone colorimetry will be applied in the biomedical field with its unique advantages and bring great benefits to mankind.
The original contributions presented in the study are included in the article/Supplementary Material, further inquiries can be directed to the corresponding authors.
SZ: Investigation, Methodology, Writing–original draft. YQ: Data curation, Formal Analysis, Writing–original draft. JiY: Validation, Visualization, Writing–original draft. YW: Resources, Validation, Writing–original draft. JuY: Conceptualization, Funding acquisition, Supervision, Validation, Writing–review and editing. MZ: Data curation, Validation, Writing–review and editing.
The author(s) declare that financial support was received for the research, authorship, and/or publication of this article. This work was supported by the Xinjiang Autonomous Region Natural Science Foundation Project (2022D01B153), the central government guides local science and technology development projects (ZYYD 2023B11) and Xinjiang Uygur Autonomous Region Graduate Student Research and Innovation Project Grants (XJ 2024G190).
The authors declare that the research was conducted in the absence of any commercial or financial relationships that could be construed as a potential conflict of interest.
All claims expressed in this article are solely those of the authors and do not necessarily represent those of their affiliated organizations, or those of the publisher, the editors and the reviewers. Any product that may be evaluated in this article, or claim that may be made by its manufacturer, is not guaranteed or endorsed by the publisher.
The Supplementary Material for this article can be found online at: https://www.frontiersin.org/articles/10.3389/fbioe.2024.1444846/full#supplementary-material
Alkhamis, O., Canoura, J., Ly, P. T., and Xiao, Y. (2023). Using exonucleases for aptamer characterization, engineering, and sensing. Acc. Chem. Res. 56 (13), 1731–1743. doi:10.1021/acs.accounts.3c00113
Bhalla, N., Jolly, P., Formisano, N., and Estrela, P. (2016). Introduction to biosensors. Essays Biochem. 60 (1), 1–8. doi:10.1042/EBC20150001
Canoura, J., Alkhamis, O., Liu, Y., Willis, C., and Xiao, Y. (2023). High-throughput quantitative binding analysis of DNA aptamers using exonucleases. Nucleic Acids Res. 51 (4), e19. doi:10.1093/nar/gkac1210
Chen, L., Yang, G., and Qu, F. (2024). Advances of aptamer-based small-molecules sensors in body fluids detection. Talanta 268, 125348. doi:10.1016/j.talanta.2023.125348
Chen, X., Huang, Y., Duan, N., Wu, S., Xia, Y., Ma, X., et al. (2014). Screening and identification of DNA aptamers against T-2 toxin assisted by graphene oxide. J. Agric. Food Chem. 62 (42), 10368–10374. doi:10.1021/jf5032058
Ciaccheri, L., Adinolfi, B., Mencaglia, A. A., and Mignani, A. G. (2023). Smartphone-Enabled colorimetry. Sensors 23 (12), 5559. doi:10.3390/s23125559
Du, Y., Liu, D., Wang, M., Guo, F., and Lin, J. S. (2021). Preparation of DNA aptamer and development of lateral flow aptasensor combining recombinase polymerase amplification for detection of erythromycin. Biosens. Bioelectron. 181, 113157. doi:10.1016/j.bios.2021.113157
Dunn, M., Jimenez, R., and Chaput, J. (2017). Analysis of aptamer discovery and technology. Nat. Rev. Chem. 1 (10), 0076. doi:10.1038/s41570017-0076
Ellington, A., and Szostak, J. (1990). In vitro selection of rna molecules that bind specific ligands. Nature 346 (6287), 818–822. doi:10.1038/346818a0
Fernandes, G. M., Silva, W. R., Barreto, D. N., Lamarca, R. S., Lima Gomes, P. C. F., Petruci, J. F. da S., et al. (2020). Novel approaches for colorimetric measurements in analytical chemistry - a review. Anal. Chim. Acta 1135, 187–203. doi:10.1016/j.aca.2020.07.030
Geleta, G. S. (2022). A colorimetric aptasensor based on gold nanoparticles for detection of microbial toxins: an alternative approach to conventional methods. Anal. Bioanal. Chem. 414 (24), 7103–7122. doi:10.1007/s00216-022-04227-9
Guo, W., Zhang, C., Ma, T., Liu, X., Chen, Z., Li, S., et al. (2021). Advances in aptamer screening and aptasensors’ detection of heavy metal ions. J. Nanobiotechnol 19 (1), 166. doi:10.1186/s12951-021-00914-4
Haiss, W., Thanh, N. T. K., Aveyard, J., and Fernig, D. G. (2007). Determination of size and concentration of gold nanoparticles from UV−Vis spectra. Anal. Chem. 79 (11), 4215–4221. doi:10.1021/ac0702084
Han, C., Chen, J., Wu, X., Huang, Y., and Zhao, Y. (2014). Detection of metronidazole and ronidazole from environmental Samples by surface enhanced Raman spectroscopy. Talanta 128, 293–298. doi:10.1016/j.talanta.2014.04.083
Ho, C., Sin, D. W. M., Wong, K. M., and Tang, H. P. O. (2005). Determination of dimetridazole and metronidazole in poultry and porcine tissues by gas chromatography–electron capture negative ionization mass spectrometry. Anal. Chim. Acta 530 (1), 23–31. doi:10.1016/j.aca.2004.09.004
Holt, D. E., De Louvois, J., Hurley, R., and Harvey, D. (1990). A high performance liquid chromatography system for the simultaneous assay of some antibiotics commonly found in combination in clinical samples. J. Antimicrob. Chemoth 26 (1), 107–115. doi:10.1093/jac/26.1.107
Huang, J., Koroteev, D. D., and Zhang, M. (2021). Smartphone-based study of cement-activated charcoal coatings for removal of organic pollutants from water. Constr. Build. Mater 300, 124034. doi:10.1016/j.conbuildmat.2021.124034
Jeddi, I., and Saiz, L. (2017). Three-dimensional modeling of single stranded DNA hairpins for aptamer-based biosensors. Sci. Rep. 7, 1178. doi:10.1038/s41598-017-01348-5
Jiang, C., Ye, S., Xiao, J., Tan, C., Yu, H., Xiong, X., et al. (2023). Hydride generation-smartphone RGB readout and visual colorimetric dual-mode system for the detection of inorganic arsenic in water samples and honeys. Food Chem. X 18, 100634. doi:10.1016/j.fochx.2023.100634
Khoshbin, Z., and Housaindokht, M. R. (2021). Computer-Aided aptamer design for sulfadimethoxine antibiotic: step by step mutation based on MD simulation approach. J. Biomol. Struct. Dyn. 39 (9), 3071–3079. doi:10.1080/07391102.2020.1760133
Kim, S.-C., and Cho, Y.-S. (2022). Predictive system implementation to improve the accuracy of urine self-diagnosis with smartphones: application of a confusion matrix-based learning model through RGB semiquantitative analysis. Sensors 22 (14), 5445. doi:10.3390/s22145445
Kimoto, M., Nakamura, M., and Hirao, I. (2016). Post-ExSELEX stabilization of an unnatural-base DNA aptamer targeting VEGF 165 toward pharmaceutical applications. Nucleic Acids Res. 44 (15), 7487–7494. doi:10.1093/nar/gkw619
Kwon, Y. S., Raston, N. H. A., and Gu, M. B. (2014). An ultra-sensitive colorimetric detection of tetracyclines using the shortest aptamer with highly enhanced affinity. Chem. Commun. 50 (1), 40–42. doi:10.1039/c3cc47108j
Laddha, H., Yadav, P., Agarwal, M., and Gupta, R. (2022). Quick and hassle-free smartphone’s RGB-based color to photocatalytic degradation rate assessment of malachite green dye in water by fluorescent Zr–N–S co-doped carbon dots. Environ. Sci. Pollut. Res. 29 (37), 56684–56695. doi:10.1007/s11356-022-19808-5
Li, Y.-Y., Guo, F., Yang, J., and Ma, J.-F. (2023). Efficient detection of metronidazole by a glassy carbon electrode modified with a composite of a cyclotriveratrylene-based metal–organic framework and multi-walled carbon nanotubes. Food Chem. 425, 136482. doi:10.1016/j.foodchem.2023.136482
Ma, P., Ye, H., Guo, H., Ma, X., Yue, L., and Wang, Z. (2022). Aptamer truncation strategy assisted by molecular docking and sensitive detection of T-2 toxin using SYBR Green I as a signal amplifier. Food Chem. 381, 132171. doi:10.1016/j.foodchem.2022.132171
Manuel, B. A., Sterling, S. A., Sanford, A. A., and Heemstra, J. M. (2022). Systematically modulating aptamer affinity and specificity by guanosine-to-inosine substitution. Anal. Chem. 94 (17), 6436–6440. doi:10.1021/acs.analchem.2c00422
Mehlhorn, A., Rahimi, P., and Joseph, Y. (2018). Aptamer-based biosensors for antibiotic detection: a review. Biosens.-Basel 8 (2), 54. doi:10.3390/bios8020054
Meng, F., Qin, Y., Zhang, W., Chen, F., Zheng, L., Xing, J., et al. (2022). Amplified electrochemical sensor employing Ag NPs functionalized graphene paper electrode for high sensitive analysis of Sudan I. Food Chem. 371, 131204. doi:10.1016/j.foodchem.2021.131204
Nguyen, N.-V., Yang, C.-H., Liu, C.-J., Kuo, C.-H., Wu, D.-C., and Jen, C.-P. (2018). An aptamer-based capacitive sensing platform for specific detection of lung carcinoma cells in the microfluidic chip. Biosens.-Basel 8 (4), 98. doi:10.3390/bios8040098
Nimjee, S., Rusconi, C., and Sullenger, B. (2005). Aptamers: an emerging class of therapeutics. Annu. Rev. Med. 56, 555. doi:10.1146/annurev.med.56.062904.144915
Qin, Y., Bubiajiaer, H., Yao, J., and Zhang, M. (2022). Based on unmodified aptamer-gold nanoparticles colorimetric detection of dexamethasone in food. Biosens.-Basel 12 (4), 242. doi:10.3390/bios12040242
Ruppert, C., Phogat, N., Laufer, S., Kohl, M., and Deigner, H.-P. (2019). A smartphone readout system for gold nanoparticle-based lateral flow assays: application to monitoring of digoxigenin. Microchim. Acta 186 (2), 119. doi:10.1007/s00604-018-3195-6
Sha, J., Lin, H., Zhang, Z., and Sui, J. (2023). Preparation and validation of ultra-sensitive aptamers by computer simulation and site-specific mutation. Food Anal. Method 16 (1), 215–224. doi:10.1007/s12161-022-02396-y
Tuerk, C., and Gold, L. (1990). Systematic evolution of ligands by exponential enrichment: RNA ligands to bacteriophage T4 DNA polymerase. Science 249 (4968), 505–510. doi:10.1126/science.2200121
Wagil, M., Maszkowska, J., Białk-Bielińska, A., Caban, M., Stepnowski, P., and Kumirska, J. (2015). Determination of metronidazole residues in water, sediment and fish tissue samples. Chemosphere 119, S28–S34. doi:10.1016/j.chemosphere.2013.12.061
Wang, T., Chen, C., Larcher, L. M., Barrero, R. A., and Veedu, R. N. (2019). Three decades of nucleic acid aptamer technologies: lessons learned, progress and opportunities on aptamer development. Biotechnol. Adv. 37 (1), 28–50. doi:10.1016/j.biotechadv.2018.11.001
Wei, H., Cai, R., Yue, H., Tian, Y., and Zhou, N. (2020). Screening and application of a truncated aptamer for high-sensitive fluorescent detection of metronidazole. Anal. Chim. Acta 1128, 203–210. doi:10.1016/j.aca.2020.07.003
Xing, X.-J., Liu, X.-G., Luo, Q.-Y., Tang, H.-W., and Pang, D.-W. (2012). Graphene oxide based fluorescent aptasensor for adenosine deaminase detection using adenosine as the substrate. Biosens. Bioelectron. 37 (7), 61–67. doi:10.1016/j.bios.2012.04.037
Zahra, Q. U. A., Mohsan, S. A. H., Shahzad, F., Qamar, M., Qiu, B., Luo, Z., et al. (2022). Progress in smartphone-enabled aptasensors. Biosens. Bioelectron. 215, 114509. doi:10.1016/j.bios.2022.114509
Zhang, Y.-J., Guo, L., Yu, Y.-L., and Wang, J.-H. (2020). Photoacoustic-based miniature device with smartphone readout for point-of-care testing of uric acid. Anal. Chem. 92 (24), 15699–15704. doi:10.1021/acs.analchem.0c03470
Zhang, Z., Oni, O., and Liu, J. (2017). New insights into a classic aptamer: binding sites, cooperativity and more sensitive adenosine detection. Nucleic Acids Res. 45 (13), 7593–7601. doi:10.1093/nar/gkx517
Zhao, J., Pan, X., Sun, X., Pan, W., Yu, G., and Wang, J. (2018). Detection of metronidazole in honey and metronidazole tablets using carbon dots-based sensor via the inner filter effect. Luminescence 33 (4), 704–712. doi:10.1002/bio.3467
Zhao, W., Brook, M. A., and Li, Y. (2008). Design of gold nanoparticle-based colorimetric biosensing assays. ChemBioChem 9 (15), 2363–2371. doi:10.1002/cbic.200800282
Keywords: aptamer, colorimetric, metronidazole, base mutation, smartphone
Citation: Zhang S, Qin Y, Yuan J, Wang Y, Yao J and Zhang M (2024) Based on mutated aptamer-smartphone colorimetric detection of metronidazole in milk. Front. Bioeng. Biotechnol. 12:1444846. doi: 10.3389/fbioe.2024.1444846
Received: 06 June 2024; Accepted: 19 July 2024;
Published: 02 August 2024.
Edited by:
Hua Zhang, Chinese Academy of Sciences (CAS), ChinaCopyright © 2024 Zhang, Qin, Yuan, Wang, Yao and Zhang. This is an open-access article distributed under the terms of the Creative Commons Attribution License (CC BY). The use, distribution or reproduction in other forums is permitted, provided the original author(s) and the copyright owner(s) are credited and that the original publication in this journal is cited, in accordance with accepted academic practice. No use, distribution or reproduction is permitted which does not comply with these terms.
*Correspondence: Jun Yao, eHlkeWFvanVuQDE2My5jb20=; Minwei Zhang, emhhbmc3ODA4OTY4MEBzaW5hLmNvbQ==
†These authors have contributed equally to this work
Disclaimer: All claims expressed in this article are solely those of the authors and do not necessarily represent those of their affiliated organizations, or those of the publisher, the editors and the reviewers. Any product that may be evaluated in this article or claim that may be made by its manufacturer is not guaranteed or endorsed by the publisher.
Research integrity at Frontiers
Learn more about the work of our research integrity team to safeguard the quality of each article we publish.