 Yuyao Liu
 Ronglei Sun1,2,3*
- 1Institute of Medical Equipment Science and Engineering, Huazhong University of Science and Technology, Wuhan, China
- 2State Key Laboratory of Intelligent Manufacturing Equipment and Technology, Huazhong University of Science and Technology, Wuhan, China
- 3School of Mechanical Science and Engineering, Huazhong University of Science and Technology, Wuhan, China
Introduction: The ankle-foot exoskeleton has been demonstrated to help users resist anterior perturbation in the horizontal pelvis plane. However, its effects on perturbations in other directions remain unclear. This paper focuses on how the ankle-foot exoskeleton helps people resist perturbations coming from forward directions within the fan-shaped region in the pelvis horizontal plane.
Methods: Firstly, we proposed and validated a hypothesis that the human torque ratio of inversion to plantar flexion torque would change with the perturbation directions of anterior (dir0) and 45° deviating from anterior to left (dir45). Subsequently, based on the regulation demand, we developed an ankle-foot exoskeleton that can adjust the torque ratio delivered to the human body by controlling the forces on two cross-arranged cables. Finally, we evaluated and compared the assistance performance of three powered assistive modes (NM, medBD, and latBD) with the unpowered one (UN) by setting different force pairs in two cables.
Results: The results showed that, with the assistance, the margin of stability was increased and the standard deviations of ankle-foot segmental movements were decreased. Meanwhile, the biological inversion torque has a significant difference among the three assistive modes. Compared to the UN, the latBD was shown to reduce the biological inversion torque by 15.8
Discussion: The findings demonstrated that the torque-ratio-adjustable exoskeleton could support human resistance to perturbations coming from forward directions within a fan-shaped region in the pelvis horizontal plane and indicated that the exoskeleton’s torque ratio should be carefully modulated to match the ratio of the human under various environmental conditions for better assistive performance.
1 Introduction
It has been demonstrated that using an ankle-foot exoskeleton improves user forward balance in the sagittal plane (Asbeck et al., 2015; Emmens et al., 2018; Beck et al., 2023). Nonetheless, most perturbations do not happen entirely in the sagittal plane, usually along with coronal components. It is still unknown how to assist humans in accounting for perturbation in forward direction within fan-shaped region of pelvis horizontal plane with an ankle-foot exoskeleton.
There have been studies on human responses to multi-directional perturbations, showing that human responses differ depending on the direction of perturbation (Henry et al., 1998; Torres-Oviedo and Ting, 2007; Jones et al., 2008; Chvatal and Ting, 2013). The perturbation was delivered by the treadmill translation, and the direction of perturbation was determined by the position of the human standing on the treadmill. At the joint level, it was shown that the postural responses in the sagittal and coronal planes were not independent. Instead, the relative contribution of hip/trunk versus ankle strategies was redistributed due to the direction-specific biomechanical constraints at the ankle joint (Jones et al., 2008). At the muscle level, Horak’s team found that the medial gastrocnemius, soleus, and peroneus muscles of the left leg showed their maximum activation responding to the treadmill translation directions between the back and right (Henry et al., 1998). Using nonnegative matrix factorization, Ting’s team extracted muscle synergies characterizing human postural responses. The ankle strategy was consistent with the muscle synergy that activated the gastrocnemius, soleus, and peroneus. Symmetry to the work of Horak’s team, this synergy of the right leg was activated to respond to the treadmill translation directions between the back and left (Torres-Oviedo and Ting, 2007). In a subsequent study by Ting’s team, the muscle synergy corresponding to the ankle strategy was found to contribute to the backward ground reaction force and back-medial acceleration of the center of mass (Chvatal and Ting, 2013). To focus on the “ankle” strategy, the perturbation should be delivered by horizontal forward pulling on the pelvis (Robert et al., 2018). In this paper, the pulling direction was set to be standard forward and a non-standard forward instance: left-forward. Decomposing the horizontal perturbation into the sagittal and coronal planes, the forward component was mainly resisted by the plantar flexion torque of the talocrural joint, while the left component was mainly counteracted by the inversion torque of the left subtalar joint. Therefore, we inferred that if the perturbation direction changed, the needed torque ratio of inversion to plantar flexion would change, owing to the change in the ankle-foot muscle activation pattern.
The assistive torques of current ankle-foot exoskeletons were usually designed to mimic human torque profiles to minimize interference with the user’s normal movements (Sawicki and Ferris, 2008; Emmens et al., 2018; Nuckols et al., 2021; Pridham and Stirling, 2023). However, they only considered the assistance delivered to the talocrural joint, because the plantar flexion torque contributed most to the ambulation they focused on. Recently, a simulation study investigated how exoskeleton torques applied to the talocrural and subtalar joints altered the center of mass kinematics during walking and found that the type of exoskeleton could change the center of mass kinematics (Bianco et al., 2023). Although the torque magnitudes applied to the talocrural and subtalar joints for simulation were the same, the author argued that different combinations of torque magnitudes at these joints could facilitate precise control over the direction of velocity changes. Therefore, we supposed that the exoskeleton torque ratio of inversion to plantar flexion should be controlled to mimic the human ratio varying across perturbed conditions.
Most current ankle-foot exoskeleton structures pulled the back bottom of shoes across talocrural and subtalar joints to supply the assistive forces, mimicking the soleus muscle, which meant that these exoskeletons could deliver torques to both joints simultaneously (Bryan et al., 2021; Nuckols et al., 2021; Zhang and Collins, 2021; Chen et al., 2022; Schmitz et al., 2022; Wu et al., 2024). However, the positions of exoskeleton attachment points relative to the human body were fixed, leading to an uncontrollable exoskeleton torque ratio, which may hinder the exoskeleton from being more effective. Instead, exoskeleton structures that could actively assist two joints separately have the potential to realize the modulation of torque-ratio. Baek’s team proposed a two-degree-of-freedom ankle-foot exoskeleton (Choi et al., 2020; Choi et al., 2022). The axes of rotation of two hinge joints were designed by calculating the spatial formula of the talocrural joint and subtalar joint based on anatomical data. The talocrural joint and subtalar joint were actively controlled to rotate by two pneumatic artificial muscles, mimicking the soleus and peroneus longus. However, the above exoskeleton had a hinge joint. When providing active support, it can be challenging to maintain dynamic alignment between the exoskeleton’s hinge joint and the wearer’s talocrural joint due to the floating axis of the wearer’s joint. Soft exoskeletons can overcome this feedback. Park et al. have developed a bio-inspired tendon-ligament-skin architecture that can assist ankle-foot movement with a low profile (Park et al., 2014). The eversion was achieved by the artificial peroneus tertius, while the inversion was realized by the artificial tibialis anterior. By co-activating the agonist-antagonist artificial muscles, the combined architecture not only provided physical support by increasing the stiffness of the ankle joint but also created desired ankle motions. The proposed scheme provided a flexible combination of actuators to satisfy various requirements of ankle rehabilitation. However, two artificial muscles were attached to both sides of the midfoot to actively assist with inversion/eversion. These muscles also functioned as dorsiflexors, which could counteract part of the force from the plantar flexors and reduce the efficiency of plantar flexion. Humans have a more efficient muscle layout for movement. Some plantar flexors can also function as invertors and evertors (Neumann, 2016). Thus, it was still needed to develop a soft exoskeleton that could support not only the plantar flexion torque but also the inversion torque and modulate the torque ratio of inversion to plantar flexion.
In this paper, we first validated the hypothesis that the human torque ratio would change according to the perturbation direction. Then, we developed a torque-ratio-adjustable ankle-foot exoskeleton for resisting perturbation in forward direction within fan-shaped region of pelvis horizontal plane. Finally, we compared the torque-ratio difference between the exoskeleton and human among three assistive modes to validate the hypothesis that the smaller the difference, the better the assistive performance.
2 Materials and methods
2.1 Ankle-foot exoskeleton
Ankle-foot muscles are fixed on the bone and function uniquely because of their different attachments. The soleus (SOL), lateral gastrocnemius (LGAS), and medial gastrocnemius (MGAS) are the primary plantar flexors but also offer a small number of inversion torque. On the contrary, the tibialis posterior (TP) is the primary invertor but can only provide small plantar flexion torques. In addition, the peroneus longus (PERL) is the main evertor that can antagonize excessive inversion torque, while the tibialis anterior (TA) is the primary dorsiflexor that can counteract excessive plantar flexion torque. Although each of the muscles produces a fixed biological torque ratio of inversion to plantar flexion, the muscle group can change the torque ratio by activating different patterns.
Most current exoskeletons have a structure with only one Bowden cable attached between the heel and tibia parallel to the triceps surae, thus they cannot modulate their torque ratios of inversion to plantar flexion torque. Inspired by the torque-ratio adaptation mechanism of the muscle group, if the exoskeleton has a group of cables with different orientations relative to the ankle-foot segment, it would be able to provide different torque functions. According to the orientations of ankle-foot muscles, we divided the muscles into two groups (Figure 1A). One containing SOL, LGAS, and TP leans to the lateral side of the body or is inserted into the medial side of the heel, while the other containing MGAS and PERL leans to the medial side of the body or insert into the lateral side of the heel. Our previous exoskeleton has two cables for each leg (Liu et al., 2023). Thus, we modified the directions of the two ropes behind the shank from parallel to decussate layout (Figure 1B).
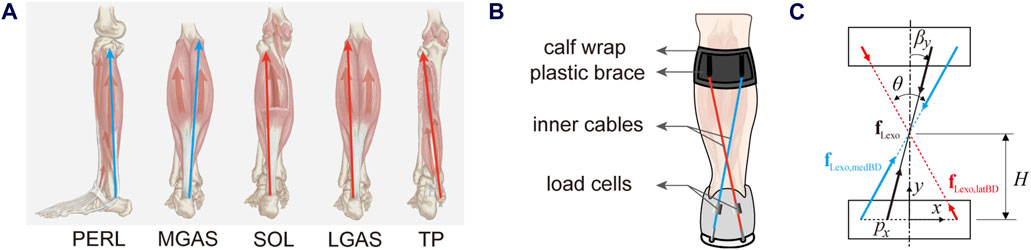
Figure 1. (A) The orientation of main ankle-foot plantar flexors, including the peroneus longus (PERL), the medial gastrocnemius (MGAS), the soleus (SOL), the lateral gastrocnemius (LGAS) and the tibialis posterior (TP). (B) The scheme of the torque-ratio-adjustable ankle-foot exoskeleton on the left leg. (C) The force orientation regulation mechanism of the left exoskeleton. The red represents muscles that lean to the lateral side of the body or insert into the medial side of the heel, while the blue represents muscles that lean to the medial side of the body or insert into the lateral side of the heel.
If a coordinate system was attached to the heel in the exoskeleton plane (Figure 1C), the total force vector
where, each component was the combined effect of the forces on the two cables (Equations 2, 3):
where,
where,
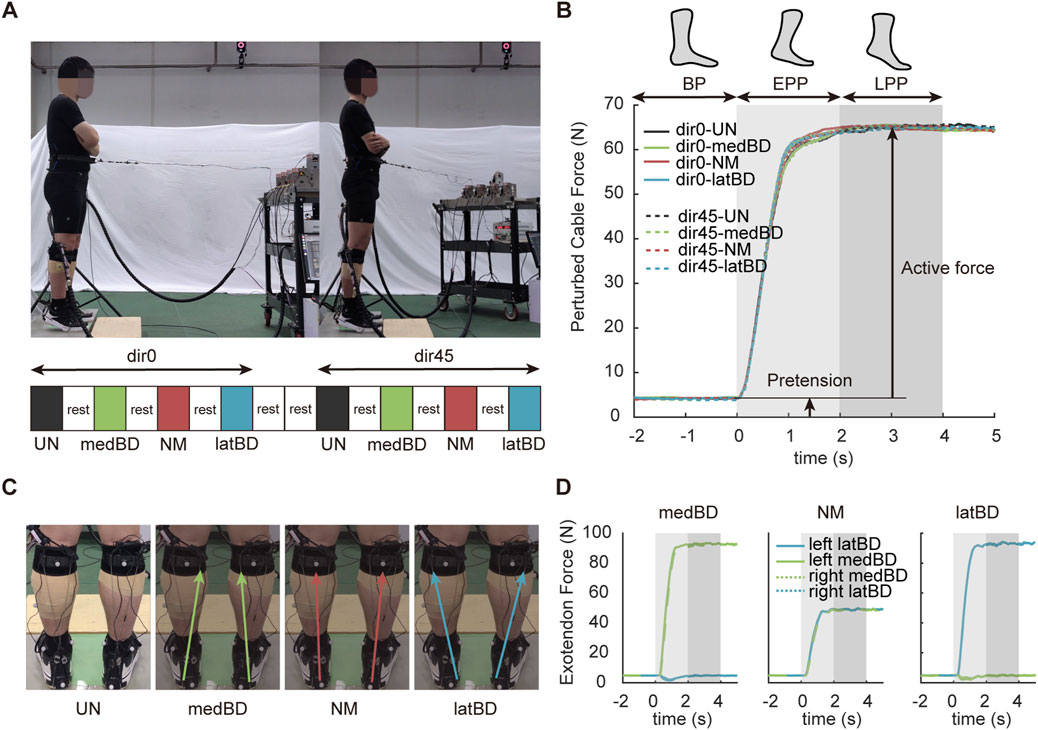
Figure 2. Experimental protocol. (A) The trial conditions of two perturbed directions and four assistive modes and their sequence. The standard forward direction is represented by dir0, while the left-forward direction is represented by dir45. The black, yellow, red, and blue represent the unpowered (UN), medial boundary (medBD), normal (NM) and lateral boundary (latBD) modes, respectively. (B) The measured perturbed force trajectories under eight conditions for a typical subject. The solid lines represent dir0 condition, while the dash lines represent dir45 condition. Light gray shaded region indicates the EPP period while the dark gray indicated the LPP period. (C) The total force vectors of four assistive modes. (D) The measured assistive force trajectories of three powered assistive modes for a typical subject under dir0 condition. The yellow and blue represent lateral and medial boundary cable forces, respectively. The solid lines represent the left exoskeleton, while the dash lines represent the right.
2.2 Experimental protocol
Seven healthy subjects took part in the experiment. The experimental protocol was approved by the Huazhong University of Science and Technology Committee, and informed consent was obtained from all participants. In this study, subjects were asked to try to maintain their balance without stepping while receiving horizontal pulling perturbations on the pelvis.
We set two pulling directions (Figure 2A): one is standard forward (dir0), and another is left-forward (dir45) deviating from standard forward with an angle of 45°. Subjects using our ankle-foot exoskeleton with four assistive modes (Figure 2C): unpowered mode (UN), boundary mode biased to the medial side of the body (medBD), normal mode that current exoskeleton mostly used (NM), boundary mode biased to the lateral side of the body (latBD). Thus, each subject was tested with eight conditions (Figure 2A): dir0-UN, dir0-medBD, dir0-NM, dir0-latBD, dir45-UN, dir45-medBD, dir45-NM, and dir45-latBD in sequence. To avoid fatigue, the subject was asked to have a 5-min break after each trial and an additional 5-min break after each pulling directions The equipment to apply perturbation force and cable force was a customized cable-driven off-board emulator. The hardware and force tracking control method in ROS Noetic were described in detail in our prior study (Liu et al., 2023). The control capacity of the cable-driven exoskeleton has been verified in our another prior research (Li et al., 2024).
Before all the trials, the participants were familiarized with the perturbation and assistance to adapt to their most comfortable and repeatable balance strategy. Each trial condition consisted of 12 successive pelvis perturbations. Before each trial, the subject was instructed to stand along the same foot card and with their comfortable center of pressure to replicate the initial position and center of pressure between trials as much as possible. During the trial, subjects were instructed to “try not to step” in response to the perturbations and hold their arms across the chest, while other segmental movements were not constrained, except for a tight waist suit around the pelvis.
Once the trial started, a pretension
Humans can adopt various muscle activation patterns under the same experimental condition, which may increase the difficulty of analysis. To reduce the randomness of human performance under the unpowered condition, the maximum desired active force
where
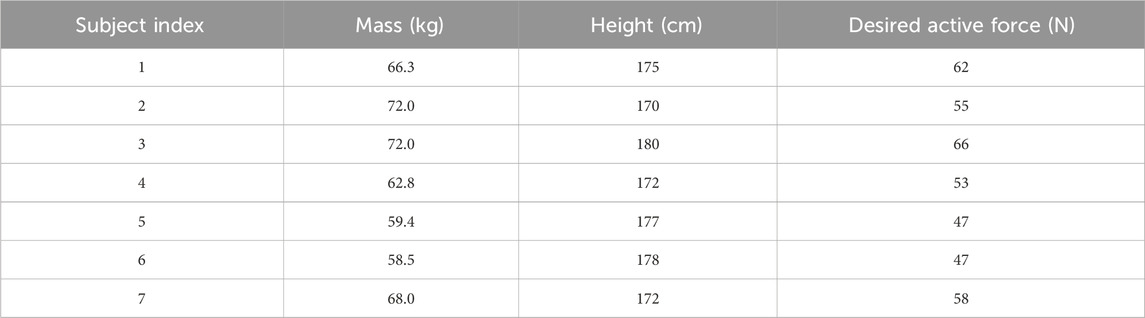
Table 1. The mass, height, and desired active force of the perturbation for each subject.
During the pre-tests, the ankle moment showed the same profile shape as the perturbation, thus the assistive force profile applied by each Bowden cable was designed to be the same shape as the perturbation profile. The exoskeleton’s ability to withstand certain forces was validated by another pre-test. The scalar sum of two cable forces per leg was gradually increased in 10N steps starting at 10N until the strap slipping down from the shank. The maximum value was about 100N, and was then used as a constraint when designing three assistive modes. We controlled the scalar sum of two cable forces of the left exoskeleton to be 100 N for all subjects and each rope has a pretension of 5 N. The pair of desired assistive forces were different for each assistive mode were shown in Table 2. The right exoskeleton was controlled the same as the left (Figure 2D). Detection and triggering methods were employed, where the cable applying the perturbation was in series with a force sensor. Perturbation detection occurred when the cable force exceeded 10N with a time interval longer than 5 s since the stop time of the last perturbation. Upon detection, an assistive force profile was triggered.
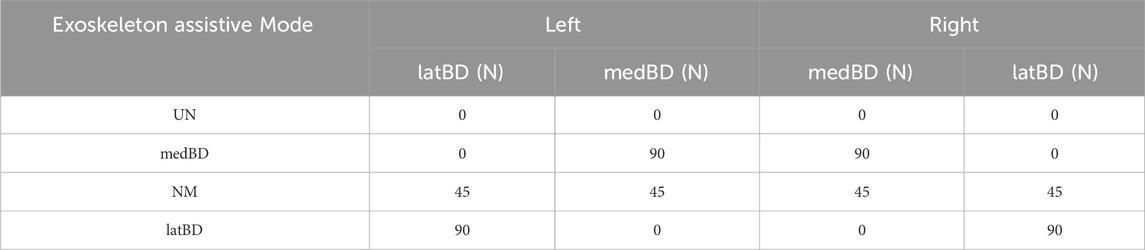
Table 2. Assistive modes and desired active force pairs of the exoskeleton cables.
2.3 Measurement
There were 32 bony landmarks on the human body: 22 on the lower limbs and pelvis, 5 on the trunk, 3 along the perturbation rope, and 2 on the exoskeleton brace. All the marker trajectories were collected at 100 Hz using a video motion capture system with eight cameras (Vicon, Oxford Metrics Ltd., United Kingdom) and customized software (Nexus, Oxford Metrics Ltd., United Kingdom).
Five surface electromyographic electrodes (SX230, Biometrics Ltd., United Kingdom) were used to record surface electromyographic signals (EMG) on PERL, TA, LGAS, MGAS and SOL of the left leg. The electrodes were attached to the human body according to SENIAM guidelines (Hermens et al., 1999). Two force platforms (BMS400600, AMTI Inc., United States) were used to collect the ground reaction force and the center of pressure under each foot. These force platforms and electrodes were connected to the Vicon Nexus and the signals were captured at 1,000 Hz.
The ROS system collected five load cell data at 100 Hz, one for the perturbation force and the other for the assistive forces. To achieve synchronous data acquisition, Vicon Nexus was triggered to start and stop data capture via the UDP protocol in the ROS system. In addition, the accurate delay can be obtained by comparing the ground reaction force measured by ROS to that recorded by Vicon Nexus.
2.4 Data processing
Before conducting data analysis, we calculated the root mean squared error (RMSE) of the measured perturbation and assistive forces relative to the desired profile. This step was taken to ensure that force tracking errors have minimal impact on human performance. The left leg was used as a representative in this study because one of the directions of perturbation was left-forward. We used OpenSim 4.4 (Delp et al., 2007) and a musculoskeletal model described by Scott et al. (Uhlrich et al., 2022). The model had 23 degrees of freedom and 40 musculotendon actuators on the lower extremity. The talocrural and subtalar joints each have one degree of rotational freedom. The generic model was scaled using the OpenSim Scale tool to match bony landmark measurements from a 5 s static trial, and the virtual markers on the model were moved to match experimental marker locations from this trial (Figure 3). To ensure the following process accuracy, the overall RMS marker error should be less than 1 cm, with maximum marker errors typically less than 2 cm after scaling. Additionally, the static pose should be typical, with an ankle angle of less than 5
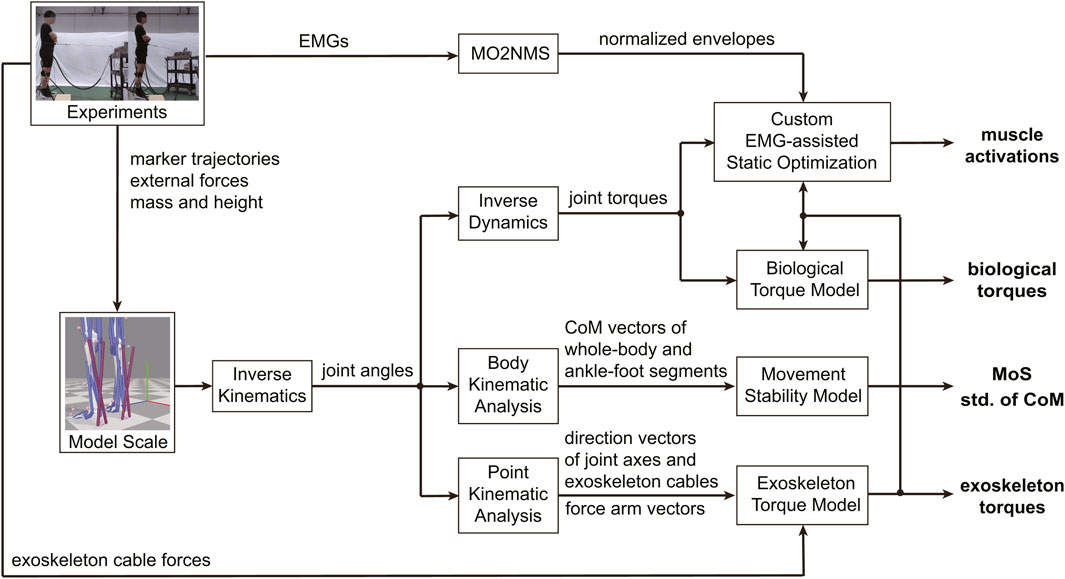
Figure 3. Workflow of modeling and data processing. The variables used for statistical analyses were highlighted in bold. The MoS represents the margin of stability, the CoM represents the center of mass, and the std. Represents the standard deviation. The ankle-foot segments were divided into three parts: the talus, calcaneus, and toes, according to the subtalar and metatarsophalangeal joints.
Joint torques were calculated using the Inverse Dynamics tool in OpenSim, with low-pass-filtered kinematics (6 Hz,
The exoskeleton’s talocrural torque was calculated by multiplying two cable force vectors with corresponding force arm vectors (Equations 9, 10), and then projecting the sum of those on the joint axis (Equation 11):
It was the same with the subtalar joint (Equations 12–14):
Then, the exoskeleton torque ratio can be obtained (Equation 15):
The biological torques (Equations 16, 17) and corresponding torque ratio (Equation 18) were estimated by subtracting the exoskeleton torques from the resultant torques calculated from the Inverse Dynamics (Collins et al., 2015):
The recorded EMG signals were processed by MOtoNMS v2.2 (Mantoan et al., 2015) to get the normalized envelope of the EMG. The raw data were first band-pass-filtered (30–300 Hz,
We implemented a custom EMG-assisted Static Optimization provided by Scott et al. (Uhlrich et al., 2022) in MATLAB (R2022a, MathWorks, United States) for estimating activations of the unmeasured muscles, such as TP. We modified the optimization by adding exoskeleton assistance in torque tracking and adding constraints to ensure control of the measured muscles tracking the normalized EMG. The right leg muscles were ignored to complete the simulation quickly. The optimization problem was formulated as Equations 19–23:
subject to:
where
To evaluate how the exoskeleton enhance human resistance to perturbation in forward direction within fan-shaped region of pelvis horizontal plane, the margin of stability (MoS) (Hof et al., 2005), the minimum distance from the extrapolated centre of mass (XcoM) to the boundaries of the base of support (BoS), was modified to two dimension in horizontal plane and used as a measure of body stability (Equations 24, 25):
where p was the vector in the horizontal plane. The anterior BoS was defined by the connecting line of the anterior medial (AM) and anterior lateral (AL) points of the BoS. The g was the gravity acceleration, and l represented the distance between the center of mass and the posterior medial (PM) point of BoS projected into the saggital plane. In addition, the standard deviation of the center of pressure (CoP) was also used as a body stability metric.
To evaluate foot-ankle stability, the ankle-foot segments were divided into three parts: the talus, calcaneus, and toes, according to the subtalar and metatarsophalangeal joints. The standard deviation of center of mass of each segmental part was used as the metric for preliminary analysis. The kinematics of the points of BoS can be obtained using the Point Kinematic Analysis tool, while the kinematics of the center of mass of the whole body and ankle-foot segments can be obtained using the Body Kinematic Analysis tool (Figure 3).
2.5 Statistical analyses
We extracted the average values during the LPP to characterize each measured variable, including exoskeleton torques, biological torques, and the corresponding torque ratio. The normalized EMG and optimized muscle activations were also analyzed. The two-sided Jarque-Bera test was used to confirm the normal distribution for various metrics. The two-sided paired
3 Results
3.1 Force tracking performance
The mean values of RMSE between desired and measured forces during LPP are shown in Table 3. The RMSE values of all perturbed forces were less than 3
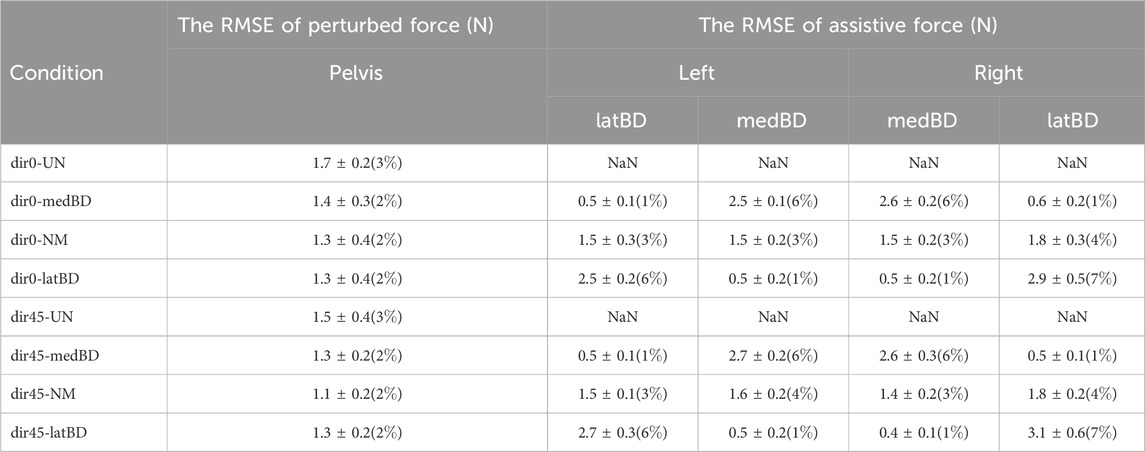
Table 3. The mean and standard deviation of the root-mean-squared-error (RMSE) values between measured and desired forces during LPP, including perturbed forces and four assistive forces, The percentage represents the mean value relative to the desired perturbed force (59N) and the distance (45N) between the three desired assistive forces, respectively.
3.2 Biological torques and muscle activations without assistance
The human natural ankle-foot strategy at joint level is shown in the left two columns of Figure 4. When resisting dir45 perturbation, subjects increased the average ankle-foot torque during LPP compared with dir0. The increase for plantar flexion torque was 44.9
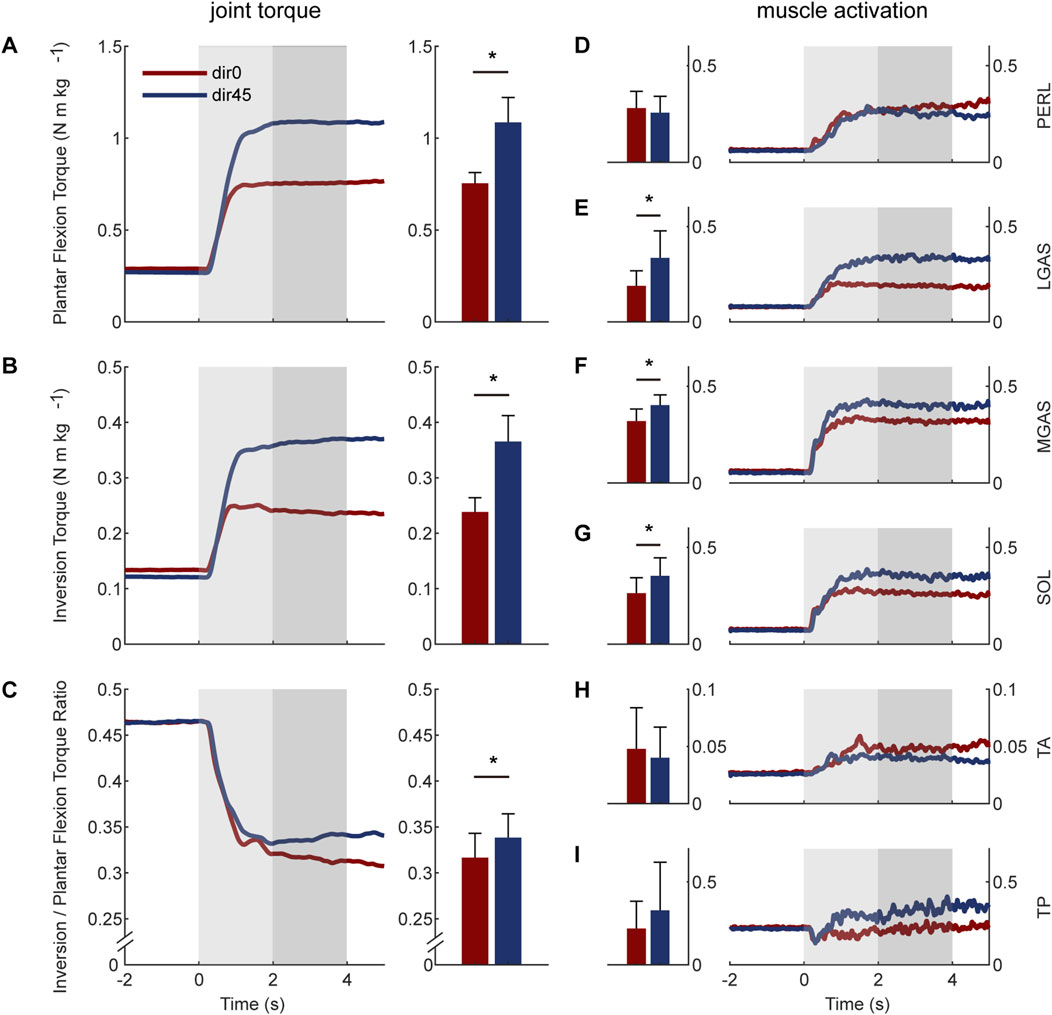
Figure 4. The natural torques and muscle activations of the human ankle-foot under dir0 and dir45 perturbations on the pelvis: (A) plantar flexion torque; (B) inversion torque; (C) the torque ratio of inversion to plantar flexion; (D) PERL; (E) LGAS; (F) MGAS; (G) SOL; (H) tibialis anterior (TA); (I) TP. The average values during the LPP period are shown in the middle two columns. The error bars indicate the standard deviation. Asterisks indicate statistically significant differences (
The human natural ankle-foot strategy at muscle level is shown in the right two columns of Figure 4. Compared with dir0, the LGAS and MGAS activations under dir45 were increased by 77.9
3.3 Exoskeleton-assisted torques
The assistive torques generated by NM, medBD and latBD modes of the exoskeleton are shown in Figure 5. Compared with NM mode, the plantar flexion torque decreased by 4.1
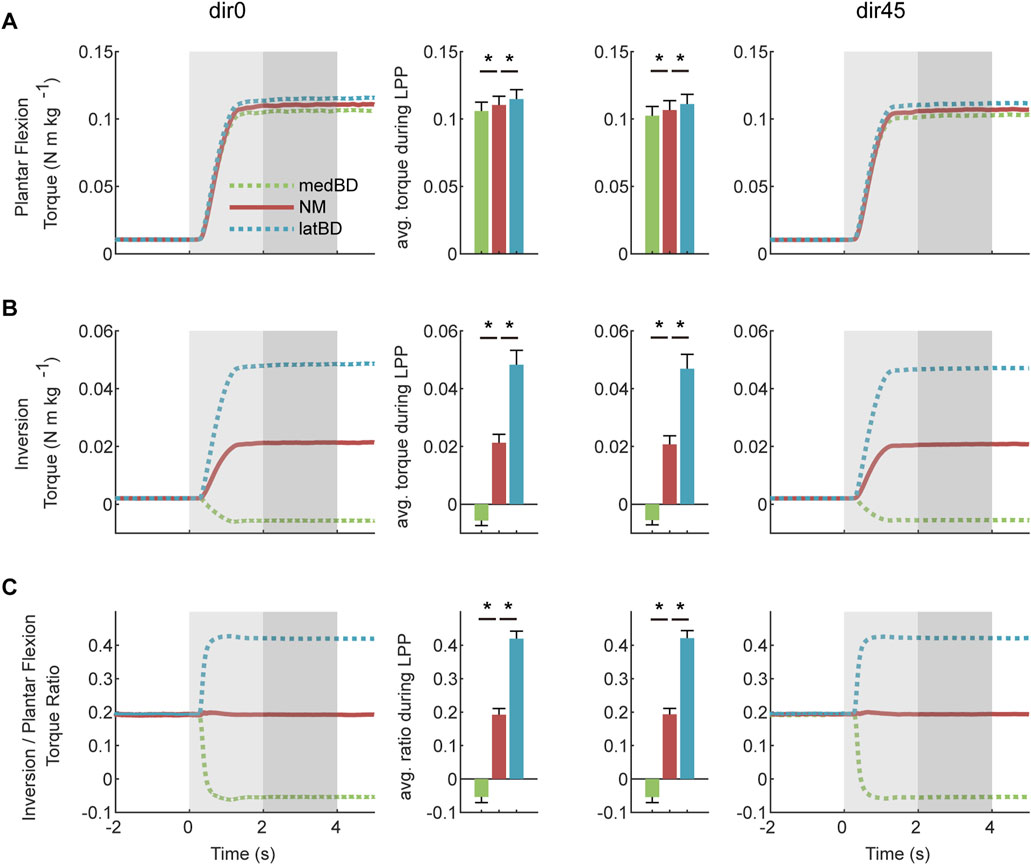
Figure 5. The exoskeleton-assisted torques under dir0 and dir45 conditions: (A) plantar flexion torque; (B) inversion torque; (C) torque ratio of inversion to plantar flexion. The left two columns indicate dir0 condition, while the right two indicate dir45. The red, green, and blue represent NM, medBD, and latBD, respectively. The error bars indicate the standard deviation. Asterisks indicate statistically significant differences (
The NM mode could offer about 0.110 N
The assistive modes between the medBD and latBD could offer plantar flexion torque ranging from 0.106 to 0.115 N
3.4 Changes of body stability with assistance
The average value of MoS is shown in Figure 9A. Compared to the UN mode, the powered assistive modes significantly increased MoS by 6.9
For the standard deviation of COP, Figure 9B shows the component in the anterior/posterior direction, and Figure 9C shows the medial/lateral component. Compared to the UN mode, the powered assistive modes significantly decreased the standard deviation of COP by about 40
The standard deviation of the COM of talus, calcaneus, and toes segments are shown in Figure 10A–C, respectively. Compared to the UN mode, the powered assistive modes significantly decreased the standard deviation by 42
3.5 Biological torques and muscle activations across assistive modes
3.5.1 Biological torques
The biological torques assisted with exoskeleton of UN, medBD, NM, and latBD modes are shown in Figure 6. Compared with UN mode, the powered assistive modes decreased the biological plantar flexion torque by 17.9
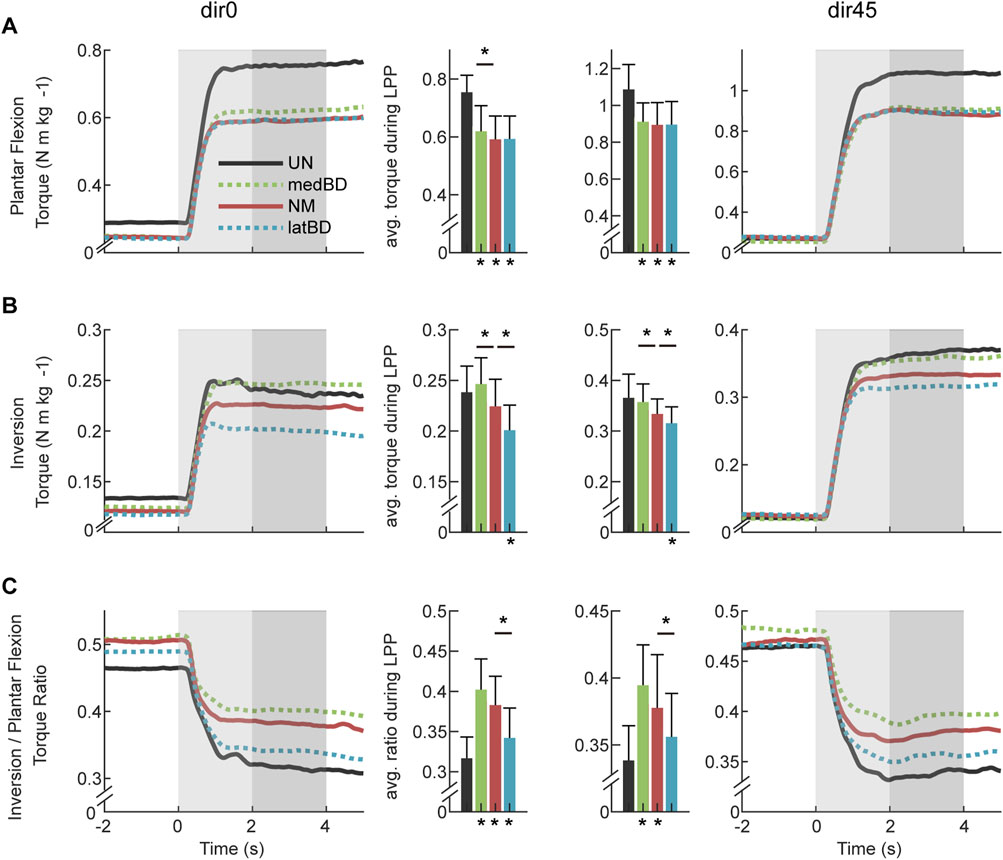
Figure 6. The biological torques with assistance under dir0 and dir45 conditions: (A) plantar flexion torque; (B) inversion torque; (C) torque ratio of inversion to plantar flexion. The black, red, green, and blue represent UN, NM, medBD, and latBD, respectively. The average values during the LPP period are shown in the bars. The error bars indicate the standard deviation. Asterisks below the bars indicate a statistically significant difference compared with UN mode (
For the biological inversion torque, the changes from UN to powered assistive modes was 3.4
There was significant increase in the torque ratio of powered assistive modes compared with UN mode (dir0: medBD 27.0
3.5.2 Muscle activations
The normalized EMG envelops and optimized TP activation are shown in Figure 7. Compared with the UN, the normalized EMG envelops were significant reduced with the medBD, NM and latBD assistance (
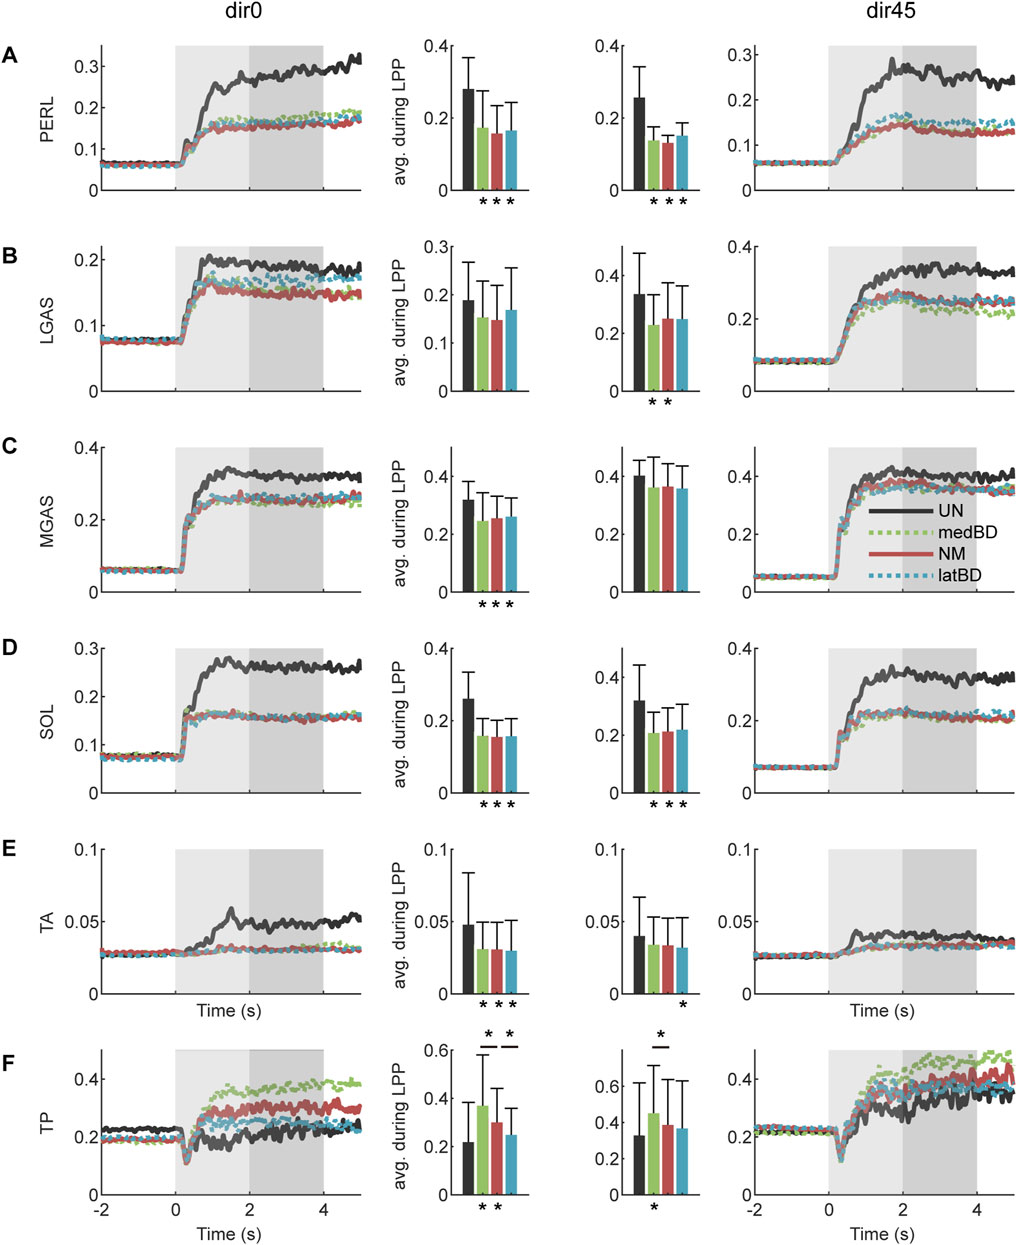
Figure 7. The muslce activations with assistance under dir0 and dir45 conditions: (A) PERL; (B) LGAS; (C) MGAS; (D) SOL; (E) TA; (F) TP. The black, red, green and blue represent the UN, NM, medBD, and latBD modes, respectively. The average values during LPP period are shown in the bars. The error bars indicate the standard deviation. Asterisks below the bars indicate a statistically significant difference compared with UN mode (
Compared with the UN, the optimized TP activation remained no significant change for the latBD (
3.5.3 Influencing factors of biological torque reduction
The absolute differences between the biological torque ratio under the UN mode and the exoskeleton torque ratio under powered modes are shown in Figure 8A. Meanwhile, the increase percentage of TP activation relative to the UN mode is shown in Figure 8B. The latBD mode showed the minimum torque ratio absolute difference, the minimum increase percentage of TP activation, and the maximum biological inversion torque reduction among the three powered assistive modes. On the contrary, the medBD mode showed the maximum torque ratio absolute difference, the maximum increase percentage of TP activation, and the minimum biological inversion torque reduction among the three powered modes.
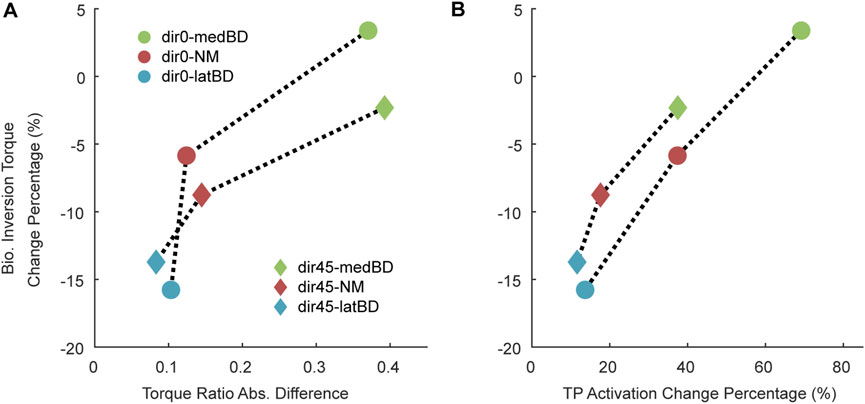
Figure 8. The factors influencing the biological inversion torque reduction compared with the UN mode: (A) the absolute differences between the biological torque ratio with the UN mode and the exoskeleton torque ratio with the powered modes; (B) the increased percentage of TP activation relative to the UN mode. The circle point represents the dir0 condition, while the diamond represents the dir45. The red, green and blue represent the NM, medBD, and latBD modes, respectively.
4 Discussion
To figure out how to assist humans in resisting perturbation, it is useful to find out the human natural ankle-foot strategy. Our result showed that the human torque ratio was significantly increased from 0.32 under forward pelvis perturbation to 0.34 under left-forward perturbation. At the joint level, the increase in human inversion torque was larger than that in human plantar flexion torque, which accounted for the changes in ratio. The increased left ankle-foot torque was caused by the increased gravity bearing on the left leg. At the muscle level, the SOL, LGAS, and MGAS, which are main plantar flexors but also can provide little inversion torque, were activated more when the direction of perturbation changed to the left forward, while the main evertor PERL with little plantar flexors showed no significant changes. These changes in muscle activation patterns resulted in a larger percentage increase in human inversion torque than plantar flexion torque. The result suggests that the exoskeleton may need to have the ability to adjust its torque ratio according to the direction of perturbation for better assistance.
4.1 Effect of the perturbation direction on human natural ankle-foot strategy
To figure out how to assist humans in resisting perturbation, it is useful to find out the human natural ankle-foot strategy. Our result showed that the human torque ratio was significantly increased from 0.32 under forward pelvis perturbation to 0.34 under left-forward perturbation (Figure 4C). At the joint level, the increase in human inversion torque was larger than that in human plantar flexion torque, which accounted for the changes in ratio. The increased left ankle-foot torque was caused by the increased gravity bearing on the left leg. At the muscle level, the SOL, LGAS, and MGAS, which are main plantar flexors but also can provide little inversion torque, were activated more when the direction of perturbation changed to the left forward, while the main evertor PERL with little plantar flexors showed no significant changes. These changes in muscle activation patterns resulted in a larger percentage increase in human inversion torque than plantar flexion torque. The result suggests that the exoskeleton may need to have the ability to adjust its torque ratio according to the direction of perturbation for better assistance.
4.2 Torque-ratio-adjustable range of the exoskeleton
This study set two boundary assistive modes to validate the torque direction adjustment ability. There was a significant difference in the plantar flexion torque and the inversion torque, as well as the torque ratio between the two boundary modes. The range of plantar flexion torque was 0.106–0.115 N
4.3 Changes of body stability and human ankle-foot strategy with exoskeleton assistance
This study validated that the ankle-foot exoskeleton can assist humans in resisting both forward and left-forward perturbations. For body stability, the MoS increased by about 6.5
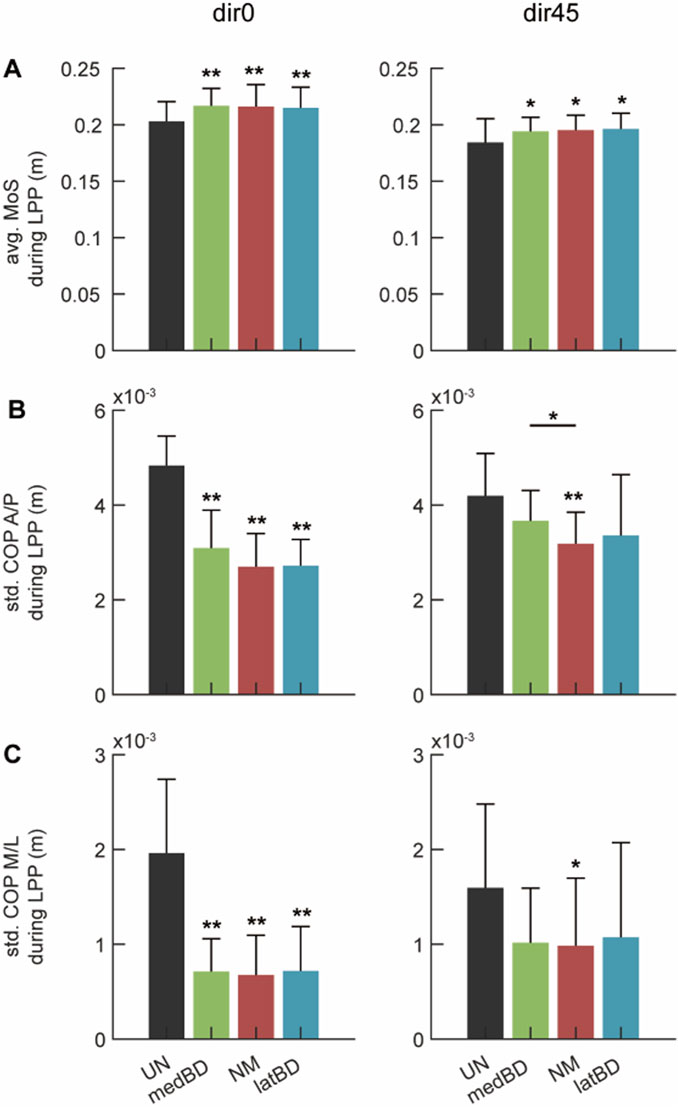
Figure 9. The whole-body stability under dir0 and dir45 conditions: (A) the average (avg.) of the Margin of Stability (MoS) during LPP; (B) the standard deviation (std.) of the Center of Pressure (CoP) in Anterior/Posterior direction (A/P) during LPP; (C) the std. of CoP in Medial/Lateral direction (M/L) during LPP. The black, red, green, and blue represent the UN, NM, medBD, and latBD modes, respectively. The error bars indicate the standard deviation of 7 subjects. The double asterisks above each bar indicate a statistically significant difference compared with UN mode (
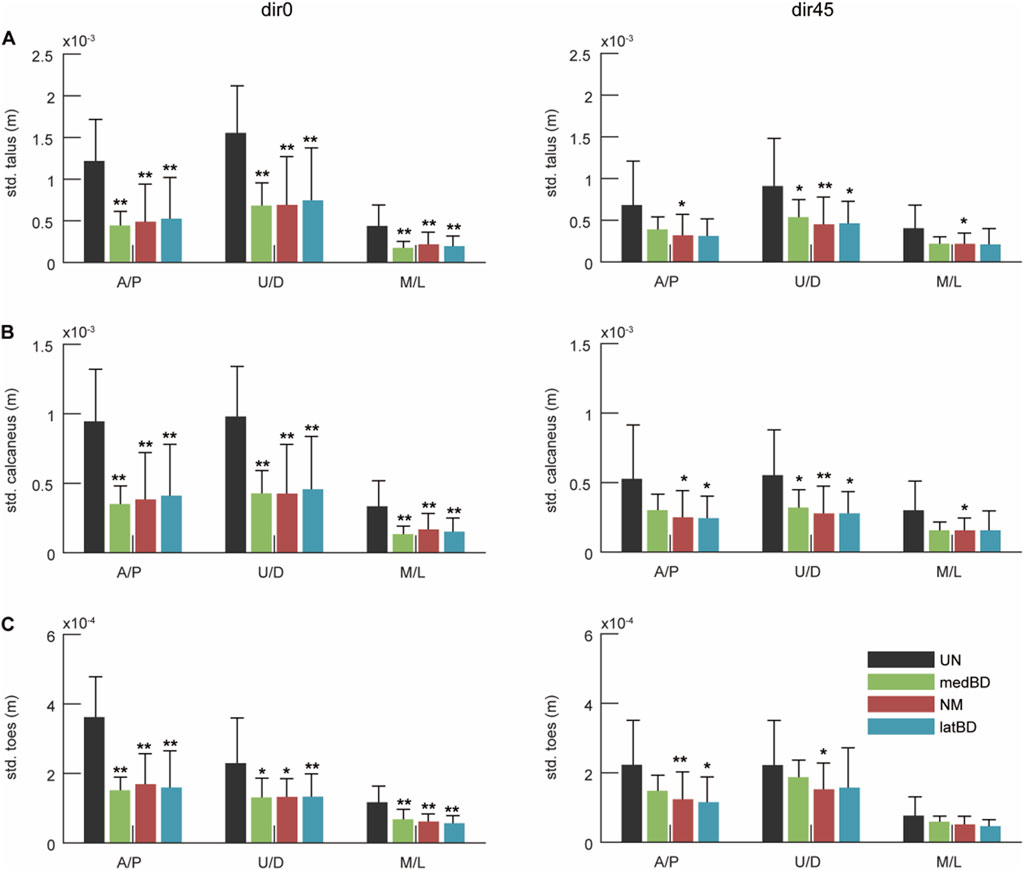
Figure 10. The ankle-foot stability under dir0 and dir45 conditions: the standard deviation (std.) of the Center of Mass (CoM) of (A) talus; (B) calcaneus; (C) toes in A/P, up/down (U/D), and M/L directions during LPP. The black, red, green, and blue represent the UN, NM, medBD, and latBD modes, respectively. The error bars indicate the standard deviation of 7 subjects. The double asterisks above each bar indicate a statistically significant difference compared with UN mode (
With similar movement stability, the torque-ratio-adjustable exoskeleton can decrease biological torque of the ankle-foot strategy more effectively than the traditional one. Compared to the unpowered condition, the exoskeleton in NM mode reduced biological plantar flexion torque by 21.6
From a muscle perspective, the decrease in biological torque mainly resulted from the reduction in muscle activations of PERL, SOL, and GAS (Figure 7A–D), which formed the muscle synergy related to the “ankle strategy” and was maximally activated from the dir0 to dir45 perturbed direction (Henry et al., 1998; Torres-Oviedo and Ting, 2007). Besides, TA, which contributed to the co-activation of plantar/dorsi flexion, was decreased under dir0 while remaining unchanged under dir45 (Figure 7E). Surprisingly, TP, the main invertor, was increased under dir0 while remaining unchanged under dir45 (Figure 7F). This may be because the activation of the plantar flexor, accompanied by the inversion function, was sharply decreased, leading to inadequate inversion torque under dir0. To compensate for the loss, TP was increased instead, with little plantar flexion function. Furthermore, among the three powered modes, there was no significant difference in the activation of each ankle-foot muscle, except for the TP (Figure 7). The TP activation with latBD was significantly smaller than that of NM, while the medBD was significantly larger. Such a difference was consistent with that of biological inversion torque (Figure 8B).
It was found that the torque ratio absolute difference between the exoskeleton in latBD mode and humans was 0.1 under standard forward perturbation and 0.08 for the left-forward, while the differences for the NM and medBD modes were larger. The absolute differences in torque ratio were relative to the reduction of inversion torque (Figure 8A). The reason was that a similar torque ratio led to less TP compensatory (Figure 8B). The result showed that the latBD had the best performance among the three assistive modes, with a minimum torque ratio absolute difference and a minimum TP activation compensatory. Thus, the hypothesis that the exoskeleton torque ratio should be adjusted to be close to the human torque ratio to get better assistive performance was validated.
5 Conclusion
This study proved that the human natural torque ratio of inversion to plantar flexion was modulated according to the perturbation direction. Based on the regulation demand, we developed an ankle-foot exoskeleton that can adjust the torque ratio delivered to the human body by controlling the forces on two cross-arranged cables. The adjustable range can cover the human ratio under current structural size constraints. The assistive performance validation experiment demonstrated that the torque-ratio-adjustable exoskeleton can support humans in resisting forward-type perturbations. As far as we know, this study was the first to investigate the performance of the exoskeleton under perturbations outside the sagittal plane. Furthermore, it was found that the biological inversion torque was reduced more with the smaller torque-ratio difference between the exoskeleton and humans, which indicated that the torque ratio of the exoskeleton should be carefully modulated according to that of humans under diverse environmental conditions for better assistive performance.
Data availability statement
The raw data supporting the conclusions of this article will be made available by the authors, without undue reservation.
Ethics statement
The studies involving humans were approved by Huazhong University of Science and Technology Committee. The studies were conducted in accordance with the local legislation and institutional requirements. The participants provided their written informed consent to participate in this study. Written informed consent was obtained from the individual(s) for the publication of any potentially identifiable images or data included in this article.
Author contributions
YL: Writing–original draft, Writing–review and editing, Conceptualization, Data curation, Formal Analysis, Investigation, Methodology, Software, Validation, Visualization. RS: Funding acquisition, Resources, Supervision, Writing–review and editing. KZ: Software, Writing–review and editing. YL: Data curation, Writing–review and editing. PX: Data curation, Writing–review and editing.
Funding
The author(s) declare that financial support was received for the research, authorship, and/or publication of this article. This work was supported by the National Natural Science Foundation of China (Grant No. U21A20121, Grant No. 52027806).
Acknowledgments
The authors would like to thank the participating volunteers for their valuable time and effort. Especially, the authors would like to thank Miao Zhang for his valuable time and effort in preliminary the experiment.
Conflict of interest
The authors declare that the research was conducted in the absence of any commercial or financial relationships that could be construed as a potential conflict of interest.
Publisher’s note
All claims expressed in this article are solely those of the authors and do not necessarily represent those of their affiliated organizations, or those of the publisher, the editors and the reviewers. Any product that may be evaluated in this article, or claim that may be made by its manufacturer, is not guaranteed or endorsed by the publisher.
References
Asbeck, A. T., De Rossi, S. M. M., Holt, K. G., and Walsh, C. J. (2015). A biologically inspired soft exosuit for walking assistance. Int. J. Robotics Res. 34, 744–762. doi:10.1177/0278364914562476
Beck, O. N., Shepherd, M. K., Rastogi, R., Martino, G., Ting, L. H., and Sawicki, G. S. (2023). Exoskeletons need to react faster than physiological responses to improve standing balance. Sci. Robotics 8, eadf1080. doi:10.1126/scirobotics.adf1080
Bianco, N. A., Collins, S. H., Liu, K., and Delp, S. L. (2023). Simulating the effect of ankle plantarflexion and inversion-eversion exoskeleton torques on center of mass kinematics during walking. PLOS Comput. Biol. 19, e1010712. doi:10.1371/journal.pcbi.1010712
Bryan, G. M., Franks, P. W., Klein, S. C., Peuchen, R. J., and Collins, S. H. (2021). A hip-knee-ankle exoskeleton emulator for studying gait assistance. Int. J. Robotics Res. 40, 722–746. doi:10.1177/0278364920961452
Chen, J., Han, J., and Zhang, J. (2022). Design and evaluation of a mobile ankle exoskeleton with switchable actuation configurations. Ieee-Asme Trans. Mechatronics 27, 1846–1853. doi:10.1109/tmech.2022.3175731
Choi, H. S., Baek, Y. S., and In, H. (2022). Ankle strategy assistance to improve gait stability using controllers based on in-shoe center of pressure in 2 degree-of-freedom powered ankle-foot orthoses: a clinical study. J. Neuroengineering Rehabilitation 19, 114. doi:10.1186/s12984-022-01092-6
Choi, H. S., Lee, C. H., and Baek, Y. S. (2020). Design and validation of a two-degree-of-freedom powered ankle-foot orthosis with two pneumatic artificial muscles. Mechatronics 72, 102469. doi:10.1016/j.mechatronics.2020.102469
Chvatal, S., and Ting, L. (2013). Common muscle synergies for balance and walking. Front. Comput. Neurosci. 7, 48. doi:10.3389/fncom.2013.00048
Collins, S. H., Wiggin, M. B., and Sawicki, G. S. (2015). Reducing the energy cost of human walking using an unpowered exoskeleton. Nature 522, 212. 215. doi:10.1038/nature14288
Delp, S. L., Anderson, F. C., Arnold, A. S., Loan, P., Habib, A., John, C. T., et al. (2007). Opensim: open-source software to create and analyze dynamic simulations of movement. IEEE Trans. Biomed. Eng. 54, 1940–1950. doi:10.1109/tbme.2007.901024
Emmens, A. R., van Asseldonk, E. H. F., and van der Kooij, H. (2018). Effects of a powered ankle-foot orthosis on perturbed standing balance. J. Neuroengineering Rehabilitation 15, 50. doi:10.1186/s12984-018-0393-8
Henry, S. M., Fung, J., and Horak, F. B. (1998). Emg responses to maintain stance during multidirectional surface translations. J. Neurophysiology 80, 1939–1950. doi:10.1152/jn.1998.80.4.1939
Hermens, H. J., Freriks, B., Merletti, R., Stegeman, D., Blok, J., Rau, G., et al. (1999). European recommendations for surface electromyography. Roessingh Res. Dev. 8, 13–54.
Hof, A. L., Gazendam, M. G. J., and Sinke, W. E. (2005). The condition for dynamic stability. J. Biomechanics 38, 1–8. doi:10.1016/j.jbiomech.2004.03.025
Jones, S. L., Henry, S. M., Raasch, C. C., Hitt, J. R., and Bunn, J. Y. (2008). Responses to multi-directional surface translations involve redistribution of proximal versus distal strategies to maintain upright posture. Exp. Brain Res. 187, 407–417. doi:10.1007/s00221-008-1312-1
Li, Y., Sun, R., and Zhang, X. (2024). Force-controller design based on adaptively switched iterative learning for cable-driven ankle exoskeleton. Mech. Electron.
Liu, Y., Sun, R., Li, Y., Zhang, M., and Zou, K. (2023). A biologically inspired cross-type ankle–foot exotendon: assisting plantarflexion moment and movement stability. J. Bionic Eng. 20, 2633–2645. doi:10.1007/s42235-023-00398-y
Mantoan, A., Pizzolato, C., Sartori, M., Sawacha, Z., Cobelli, C., and Reggiani, M. (2015). Motonms: a matlab toolbox to process motion data for neuromusculoskeletal modeling and simulation. Source Code Biol. Med. 10, 12. doi:10.1186/s13029-015-0044-4
Molinaro, D. D., Kang, I., and Young, A. J. (2024). Estimating human joint moments unifies exoskeleton control, reducing user effort. Sci. Robotics 9, eadi8852. doi:10.1126/scirobotics.adi8852
Neumann, D. A. (2016). Kinesiology of the musculoskeletal system-e-book: foundations for rehabilitation. Germany: Elsevier Health Sciences.
Nuckols, R. W., Lee, S., Swaminathan, K., Orzel, D., Howe, R. D., and Walsh, C. J. (2021). Individualization of exosuit assistance based on measured muscle dynamics during versatile walking. Sci. Robotics 6, eabj1362. doi:10.1126/scirobotics.abj1362
Park, Y.-L., Chen, B.-r., Perez-Arancibia, N. O., Young, D., Stirling, L., Wood, R. J., et al. (2014). Design and control of a bio-inspired soft wearable robotic device for ankle-foot rehabilitation. Bioinspiration Biomimetics 9, 016007. doi:10.1088/1748-3182/9/1/016007
Pridham, P. S., and Stirling, L. (2023). Ankle exoskeleton torque controllers based on soleus muscle models. PLOS ONE 18, e0281944. doi:10.1371/journal.pone.0281944
Robert, T., Vallee, P., Tisserand, R., Buloup, F., Bariatinsky, D., Vercher, J. L., et al. (2018). Stepping boundary of external force-controlled perturbations of varying durations: comparison of experimental data and model simulations. J. Biomechanics 75, 89–95. doi:10.1016/j.jbiomech.2018.05.010
Sawicki, G. S., and Ferris, D. P. (2008). Mechanics and energetics of level walking with powered ankle exoskeletons. J. Exp. Biol. 211, 1402–1413. doi:10.1242/jeb.009241
Schmitz, D. G., Nuckols, R. W., Lee, S., Akbas, T., Swaminathan, K., Walsh, C. J., et al. (2022). Modulation of achilles tendon force with load carriage and exosuit assistance. Sci. Robotics 7, eabq1514. doi:10.1126/scirobotics.abq1514
Slade, P., Kochenderfer, M. J., Delp, S. L., and Collins, S. H. (2022). Personalizing exoskeleton assistance while walking in the real world. Nature 610, 277–282. doi:10.1038/s41586-022-05191-1
Torres-Oviedo, G., and Ting, L. H. (2007). Muscle synergies characterizing human postural responses. J. Neurophysiology 98, 2144–2156. doi:10.1152/jn.01360.2006
Uhlrich, S. D., Jackson, R. W., Seth, A., Kolesar, J. A., and Delp, S. L. (2022). Muscle coordination retraining inspired by musculoskeletal simulations reduces knee contact force. Sci. Rep. 12, 9842. doi:10.1038/s41598-022-13386-9
Wu, X., Zhu, A., Dang, D., and Shi, L. (2024). Novel lightweight lower limb exoskeleton design for single-motor sequential assistance of knee & ankle joints in real world. IEEE Robotics Automation Lett. 9, 2391–2398. doi:10.1109/LRA.2024.3354618
Keywords: ankle-foot exoskeleton, perturbed standing, perturbation direction, torque ratio, adjusting strategy, bioinspired design, subtalar joint, inversion
Citation: Liu Y, Sun R, Zou K, Li Y and Xu P (2024) Torque-ratio-adjustable ankle-foot exoskeleton for resisting perturbation in forward direction within fan-shaped region of pelvis horizontal plane. Front. Bioeng. Biotechnol. 12:1429605. doi: 10.3389/fbioe.2024.1429605
Received: 08 May 2024; Accepted: 23 July 2024;
Published: 05 August 2024.
Edited by:
Yang Liu, Hong Kong Polytechnic University, Hong Kong, SAR ChinaReviewed by:
Ho Seon Choi, Agency for Defense Development, Republic of KoreaBi Zhang, Chinese Academy of Sciences (CAS), China
Copyright © 2024 Liu, Sun, Zou, Li and Xu. This is an open-access article distributed under the terms of the Creative Commons Attribution License (CC BY). The use, distribution or reproduction in other forums is permitted, provided the original author(s) and the copyright owner(s) are credited and that the original publication in this journal is cited, in accordance with accepted academic practice. No use, distribution or reproduction is permitted which does not comply with these terms.
*Correspondence: Ronglei Sun, cm9uZ2xlaUBodXN0LmVkdS5jbg==