 Punit Kumar Pandey
 S. G. Ganpule
- 1Department of Mechanical and Industrial Engineering, Indian Institute of Technology Roorkee, Roorkee, India
- 2Department of Design, Indian Institute of Technology Roorkee, Roorkee, India
Perforation of the skin by fragment impact is a key determinant of the severity of an injury and incapacitation during modern asymmetric warfare. Computational models validated against experimental data are thus desired for simulating the responses of a skin simulant against fragment impact. Toward this end, experiments and concurrent computational modeling were used to investigate the dynamic responses of the skin simulant against fragment impact. Fragment simulating projectiles (FSPs) of masses 1.10 g and 2.79 g were considered herein, and the responses of the skin simulant were investigated in terms of the threshold velocity, energy density, peak displacement, and failure mechanisms. The results illustrate numerous salient aspects. The skin simulant failure involved cavity shearing followed by elastic hole enlargement, and these results were sensitive to the strain rate. The best agreement between the simulated and experimental results was achieved when the input stress–strain curves to the simulation were based on the full spectrum of strain rates. When a single stress–strain curve corresponding to a specific strain rate was used as the input, the threshold velocity and peak displacement of the skin simulant were either underpredicted or overpredicted depending on the strain rate considered. The threshold velocity was also sensitive to the input failure strain; here, the best agreement was obtained when the failure strain was based on the theoretical limiting strain. When the FSP materials were changed to plastics, the threshold velocities increased by up to 33%; however, the energy densities and generated stresses exceeded the contusion and laceration thresholds of the skin.
1 Introduction
The skin is the outermost part of the human body and acts as an initial barrier against any external loading (Limbert, 2017; Chanda, 2018; Wahlsten et al., 2019). Perforation of the skin by high-velocity projectiles, such as bullets and fragments, is considered sufficient for human incapacitation on the battlefield (Allen and Sperrazza, 1956; Henderson, 2010; Breeze and Clasper, 2013; Zecevic et al., 2015). The majority of skin-penetrating combat injuries are caused by fragments generated from ammunition such as improvised explosive devices, grenades, antipersonnel warheads, and explosive mines (Bowyer et al., 1995; Champion et al., 2003; Breeze and Clasper, 2013; Carr et al., 2017; Regasa et al., 2018). Thus, skin or skin simulant response against fragment impact is a topic of considerable interest.
The ballistic responses of skin or skin simulants against fragment impact are typically evaluated experimentally by launching fragments on skin or skin simulants at high velocities (Sperrazza and Kokinakis, 1968; Breeze and Clasper, 2013; Breeze et al., 2013; Hazell, 2022). Conducting large numbers of such ballistic experiments is challenging and costly. Thus, robust computational models benchmarked against experiments are desired as alternatives (Breeze and Clasper, 2013; Breeze et al., 2014). Accordingly, existing constitutive models of soft materials can be calibrated using the ballistic experiment data; these calibrated constitutive models and their material parameters or stress–strain response curves may be used in higher-order computational models, such as 3D head and 3D anatomically accurate computational models. Higher-order models have greater utility in simulating real-life scenarios, such as penetrating ballistic impact.
There are several challenges in simulating the responses of skin or skin simulants under high loading rates. First, the available experimental stress–strain responses of the skin or skin simulants at high strain rates (>101 s-1) are sparse. Most of the available data are acquired at quasi-static strain rates (Joodaki and Panzer, 2018; Jor et al., 2013; Kalra et al., 2016; Sachs et al., 2021). A few investigations provide stress–strain response at high strain rates under compression (Shergold et al., 2006; Joodaki and Panzer, 2018); such data are not readily available for skin under tension, and only one study (Khodadadi et al., 2019b) provides the simulant data under tension (albeit not up to failure).
Obtaining data under skin tension is more challenging than compression owing to several technical challenges in the tensile testing of such soft materials on the split Hopkinson pressure bar (SHPB). The specimen geometries, such as dog-bone shape, and critical connections between the specimen and input/output bars pose significant technical difficulties during tensile loading (Chen, 2016; Guo and Wang, 2020; Upadhyay et al., 2021). Designing and attaching grips to the tensile specimens to effectively transfer uniaxial loads to their gage sections (i.e., measurement zones) are particularly tricky. Achieving appropriate load transfer without inducing any damage to the specimen edges and minimizing the edge effects thus becomes critical. Improper gripping techniques can also lead to the development of a triaxial stress state within the specimen (Upadhyay et al., 2021). Moreover, fully characterizing the tensile properties of soft materials (up to the failure point) often requires large tensile deformations, which are challenging to achieve within the limitations of the SHPB system (Siviour and Jordan, 2016).
First, high-strain-rate experimental data of skin or skin simulants required for constitutive modeling are lacking, and most of the computational modeling of skin or skin simulant responses in literature use either quasi-static data or data obtained at a single strain rate (see Joodaki and Panzer (2018) and the references therein). Second, the experimental data for relevant loading scenarios (e.g., fragment or bullet impact) desired for model calibration and validation are scant. Toward this end, to bridge the aforementioned gaps, we simulated the responses of a skin simulant under fragment impact. The high-strain-rate stress–strain responses of the skin simulant under tension were retrieved from literature, and the data were extrapolated adequately up to the failure strains (estimated theoretically). The sensitivity of the model to the material parameters (i.e., input stress–strain curves and failure strain), thickness of the skin simulant, as well as shape, size, and material of the fragment were investigated.
2 Method
2.1 Experiments
Experiments were conducted to investigate the responses of the skin simulant to fragment impact. These data were used to validate the numerical model. A two-part silicone substance (Smooth-On, Inc., Macungie, PA) with a shore hardness of 30A was used as the skin simulant; this material exhibits a stress–strain response similar to human skin (Chanda et al., 2017; Chanda and Upchurch, 2018; Marechal et al., 2021). The skin simulant was prepared in the form of a rectangular plate of size 100 mm × 100 mm × 3 mm, where the 3 mm thickness was selected based on the average thickness documented for human skin in literature (Sperrazza and Kokinakis, 1968; Yoganandan and Pintar, 1997; Chanda, 2018). Mild-steel chisel-nosed fragment simulating projectiles (FSPs) of masses 1.10 g and 2.79 g (Figure 1) were manufactured according to the standard sizes specified in NATO STANAG 2920 (NATO, 2003; Bolduc and Jager, 2016).
Figure 1. Skin simulant and chisel-nosed FSPs: (A) schematics depicting dimensions and (B) actual photographs.
A pneumatic gas gun setup (Figure 2) was used to conduct the experiments. The setup comprised an air compressor, a pressure vessel, a pressure gage, an electric actuator, and a seamless barrel. To accommodate FSPs of different sizes in a fixed-diameter barrel, a split sabot having an outer diameter equal to the diameter of the barrel with a cavity tailored to the specific FSP size was used. The sabots were accelerated by the sudden release of compressed air from the pressure vessel. After exiting the barrel, the sabot opened due to air drag, and the FSP moved faster than the sabot owing to its lower mass and lower air drag. Upon traveling further, the sabot was arrested by the sabot arrester plate, allowing the FSP to pass through an aperture and impact the skin simulant.
Figure 2. Front-view schematic illustration of the pneumatic gas gun setup.
The required velocities of the FSPs were attained by adjusting the effective barrel length (i.e., distance between the sabot and open end of the barrel) and compressed air pressure in the pressure vessel. The FSPs were launched onto the skin simulant in the velocity range of 49−170 m s–1, with a variation of ±5 m s–1 for a given effective barrel length and air pressure. A high-speed camera (Phantom v411, Vision Research, Inc., Wayne, NJ) was installed to capture the ballistic test events; the captured high-speed images were used to obtain the velocities of the FSPs. The frame rate of the high-speed camera was 16,000 frames per second. A total of 46 impact experiments were performed. Table 1 presents the impact velocities (Vi) and corresponding results of the impact events (i.e., perforation or non-perforation) for the two FSPs. Each sample was impacted once to avoid the response effects from previous loading.
Table 1. Observed results (perforation or non-perforation) at various impact velocities (Vi) for the two FSPs.
2.2 Finite-element model
2.2.1 Finite-element discretization
A finite-element model was considered to simulate the responses of the skin simulant against fragment impact. The model was built to mimic the experiments described in Section 2.1. The skin simulant and FSPs were discretized using linear hexahedral elements with reduced integration (ELFORM 1 of LS-DYNA) (Figure 3). The central part (i.e., impact zone) of the skin simulant having dimensions of 10 mm × 10 mm × 3 mm was finely meshed with elements of size 0.4 mm × 0.4 mm × 0.4 mm. The mesh converged (<5% difference in the residual velocity) at this mesh resolution (Supplementary Figure S1). To optimize the computational efficiency, the mesh size was increased gradually toward the outer boundaries of the skin simulant plate up to a mesh size of 1.6 mm × 2.0 mm × 0.4 mm. This resulted in 60,000 elements for the skin simulant. All four edges of the skin simulant were fully constrained to replicate the experimental boundary conditions. The 1.10 g and 2.79 g FSPs were meshed with elements of size 0.25 mm × 0.25 mm × 0.25 mm, resulting in 24,288 and 50,880 hexahedral elements, respectively.

Figure 3. Finite-element discretization of the skin simulant and FSP.
A two-way, surface-to-surface eroding contact was used to model the interactions between the skin simulant and FSPs. The eroding contact is useful when there is a probability of element deletion upon meeting the failure criterion. The contact surfaces in the eroding contact were continuously updated to account for the element deletions (LSTC, 2021). Simulations were performed using a non-linear, transient, explicit dynamic scheme in which the initial velocity of the FSPs was set according to the experimental impact velocity (Vi). The simulations were then performed with 32 processors (Intel® Xeon® Gold 6,134, processor speed 3.00 GHz) and a massively parallel processing (MPP) solver in LS-DYNA V971 R4.7 (LSTC, 2021). Time steps of the order of 10−9 s were used in the simulations to ensure stability; each simulation iteration required ∼22 min of CPU time for a total simulation time of 1.5 ms.
2.2.2 Constitutive model of the skin simulant
The skin simulant was modeled using a phenomenological material; this material model is based on the Ogden hyperelasticity (Ogden, 1972), whose energy function is given by
where μ (shear modulus), α (strain hardening exponent), and K (bulk modulus) are the material constants;
The principal stresses can be computed as
The subscripts p and q in Equation 2 refer to the two coordinate directions perpendicular to i. Substituting Equation 1 into Equation 2, we have
Kolling et al. (2007) proposed the equivalent forms of Equations 1, 3 as follows
Equations 4, 5 facilitate the calculation of
Equation 1 can be evaluated for the uniaxial test. For a nearly incompressible material,
and hence
Equation 10 represents an infinite series. However, the terms of the series can be truncated upon meeting a desired tolerance. For
Next,
where the terms of the series in Equation 13 can be truncated upon meeting a desired tolerance. For
Equation 5 provides an exact fit to the experimental uniaxial stress–strain curves. Kolling et al. (2007) showed that although this model needs only the uniaxial stress–strain response, it yields satisfactory results for various types of loading and is not limited to only uniaxial loading.
Equation 5 considers the strain rate effect by permitting the users to input several uniaxial engineering stress–strain curves (in tabulated form), each corresponding to a different strain rate. When the strain rate in the simulation differs from the input strain rate (and associated stress–strain response), the model determines the constitutive behavior by interpolating between the input stress–strain curves. The model described above was implemented as MAT-181 in LS-DYNA (LSTC, 2021). The rate-dependent stress–strain response under uniaxial tension was adopted from literature (Khodadadi et al., 2019a; Khodadadi et al., 2019b), and a similar response was assumed for compression. At the quasi-static strain rate (Figure 4A), the experimental stress response was available up to failure strain. However, at higher strain rates (i.e., 1,000 s-1, 2,800 s-1, and 4,200 s-1), the experimental stress response (Figure 4B) was available up to a strain of ∼0.40. We extended each stress–strain curve (Figure 4C) corresponding to the higher strain rates up to the limiting failure strain by fitting the experimental data using Equation 3. The limiting or maximum possible failure strain at each strain rate was estimated by fitting the experimental data using a Gent model (details below). These extended stress–strain data were used as the inputs to the simulation. The stress–strain data at each strain rate were input in tabular form. The strain energy and principal stresses at each time step were calculated using Equations 4, 5.
Figure 4. Engineering stress–strain responses of the skin simulant at different strain rates: (A) quasi-static response; (B) high-strain-rate responses fitted with stress–strain curves using experimental data (Khodadadi et al., 2019b); (C) extended stress–strain curves up to failure strain.
Since the experimental data up to failure strain were not available at high strain rates, we estimated the limiting strains by fitting the experimental stress–strain curve at each strain rate using the Gent (Gent, 1996; Rashid et al., 2014) hyperelastic strain energy function (Equation 15). Note that we used the same experimental stress–strain curves at each strain rate for both the Ogden and Gent models. The Gent model facilitates estimation of the limiting chain extensibility (Horgan and Saccomandi, 2003; Upadhyay et al., 2021):
where the shear modulus
For the uniaxial case,
where

Table 2. Estimated failure strains from the Gent model.
In addition to the aforementioned stress–strain data, density and bulk modulus values of 1,080 kg m–3 and 2.5 GPa, respectively, were used (Muhr, 2005; Smooth-on). The FSPs were modeled as linear and elastic components, and mild steel was used as the FSP material unless stated otherwise.
2.3 Ballistic response estimation
The ballistic responses of the skin simulant were estimated through both experiments and simulations by evaluation the key metrics, namely, threshold velocity (Vth), threshold energy (Eth), energy density (Eth/A), residual velocity (Vr), and peak deformation of the skin simulant.
2.3.1 Threshold velocity (Vth)
Vth is defined as the minimum FSP velocity required to induce perforation. In the simulation, Vth was obtained through an iterative process, where the FSP velocity was incremented by 1 m s–1 until perforation was observed. In the experiments, the FSPs were launched with a range of impact velocities, resulting in both perforation and non-perforation of the skin simulant. Vth was subsequently determined based on these experimental conditions using a statistical approach in accordance with the NATO STANAG 2920 standard (NATO, 2003). Vth was calculated from the arithmetic mean of six impact velocities to account for the experimental scatter. These six velocities comprised three minimum velocities that caused perforation and three maximum velocities that did not cause perforation.
2.3.2 Threshold energy (Eth) and energy density (Eth/A)
Here, Eth is the kinetic energy corresponding to Vth of the respective FSP. Then, Eth/A is the ratio of Eth to the cross-sectional area of the FSP (A). Thus, Eth/A normalizes the threshold energy of the FSP by its cross-sectional area. The energy density is a particularly useful metric for comparing the threshold energies across multiple projectiles.
2.3.3 Residual velocity (Vr)
Vr is the velocity of the FSP after complete perforation of the skin simulant. A comparative analysis of Vr was conducted across a range of Vi values in both the experiments and simulations.
2.3.4 Peak deformation of the skin simulant
The peak deformation of the skin simulant was quantified by the maximum deformation until the onset of failure for the perforation cases and until unloading for the non-perforation cases. To visually represent the peak deformation in the experiment images, the stretched part of the skin simulant was highlighted with red shading. This technique was employed for better visualization due to blurring of the high-speed images after magnification. A detailed description of the shading protocol is provided in Supplementary Figure S2.
2.4 Parametric studies
The sensitivity of the strain rate to the response of the skin simulant was studied using a full spectrum (i.e., quasi-static, 1,000 s-1, 2,800 s-1, and 4,200 s-1) of stress–strain curves and a single stress–strain curve (corresponding to the specific strain rate) as the inputs. To investigate the effects of the FSP material, two other types of FSPs made of ball bearing (BB) and polyvinyl chloride (PVC) plastics were considered. These FSPs are used as less lethal projectiles during law enforcement operations (Pavier et al., 2015; Jin et al., 2019). The material properties of the various FSPs are tabulated in Table 3. Furthermore, to investigate the influence of skin thickness, we varied the thickness of the simulant in the range of 1–5 mm (Laurent et al., 2007; Joodaki and Panzer, 2018; Chen et al., 2020; Fenton et al., 2020) in increments of 1 mm. For these parametric studies, the FSP of mass 1.10 g was used.
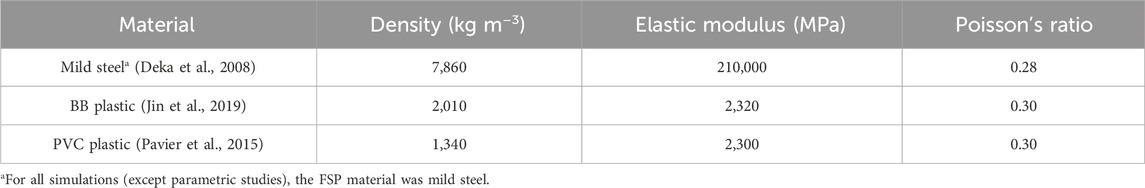
Table 3. Material properties of the FSPs.
3 Results
3.1 Ballistic responses of the skin simulant
The ballistic responses of the skin simulant were investigated in terms of the Vth, Eth/A, Vr, deformation, and failure pattern. For each of the aforementioned parameters, the experimental and numerical results are depicted and compared.
3.1.1 Threshold velocity (Vth), energy density (Eth/A), and residual velocity (Vr)
Table 4 shows the Vth and Eth/A values for the 1.10 g and 2.79 g FSPs. The Vth and Eth/A decreased by ∼29% and ∼33%, respectively, as the mass of the FSP increased from 1.10 g to 2.79 g. The differences in Vth and Eth/A between the experiments and simulations were within ∼10%. Interestingly, in absolute terms, the Eth/A value was within a narrow range of 0.12–0.18 J mm–2. A reasonable agreement (within ∼15%) between the experimental and simulated values was obtained for Vr as well (Figure 5). Note that at all velocities below Vth, the FSPs did not perforate the target, resulting in Vr = 0. Therefore, only velocities that caused perforation of the skin simulant are included in Figure 5.
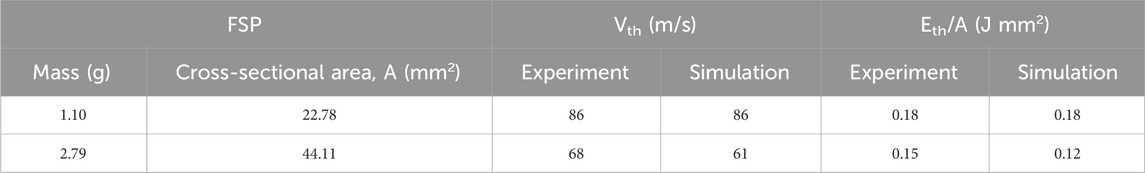
Table 4. Threshold velocities (Vth) and energy densities (Eth/A) of the skin simulant for the 1.10 g and 2.79 g FSPs.
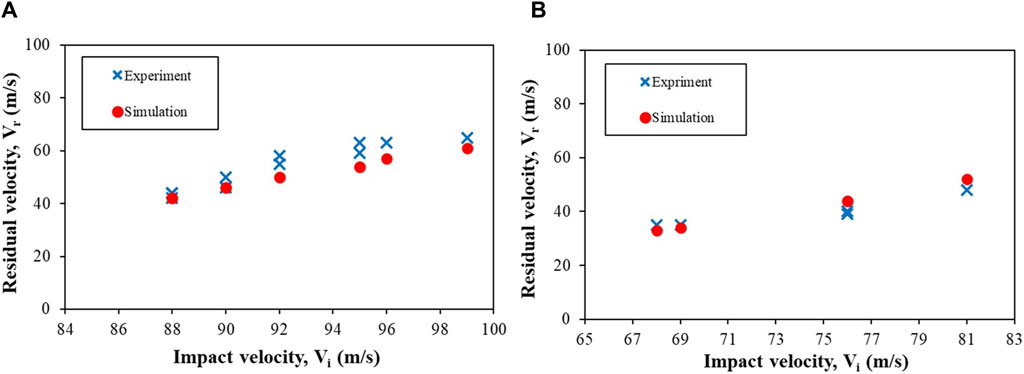
Figure 5. Plots depicting the impact velocity (Vi) vs. residual velocity (Vr) of the FSPs having masses (A) 1.10 g and (B) 2.79 g.
3.1.2 Deformation of the skin simulant
Figure 6 shows the peak displacements (deformations) of the skin simulant in the direction of impact for various Vi values. Results corresponding to representative Vi values below (column i), similar to (column ii), and above (column iii) Vth are depicted. The simulation and experimental results are shown in the upper and lower halves of each panel, respectively. A reasonable qualitative and quantitative agreement was obtained between the experiment and simulation for each case, with the differences in peak displacements between the experiments and simulations being <1.5 mm (i.e., <5%) for the 1.10 g FSP and <4 mm (i.e., <15%) for the 2.79 g FSP. Moreover, the peak displacements in the experiments and simulations occurred at reasonably similar time points. The peak displacement of the skin simulant was a function of Vi. Interestingly, the peak displacement of the skin simulant during perforation (higher impact velocities, column iii) of the FSP was lower than that during non-perforation (lower impact velocities, column i).
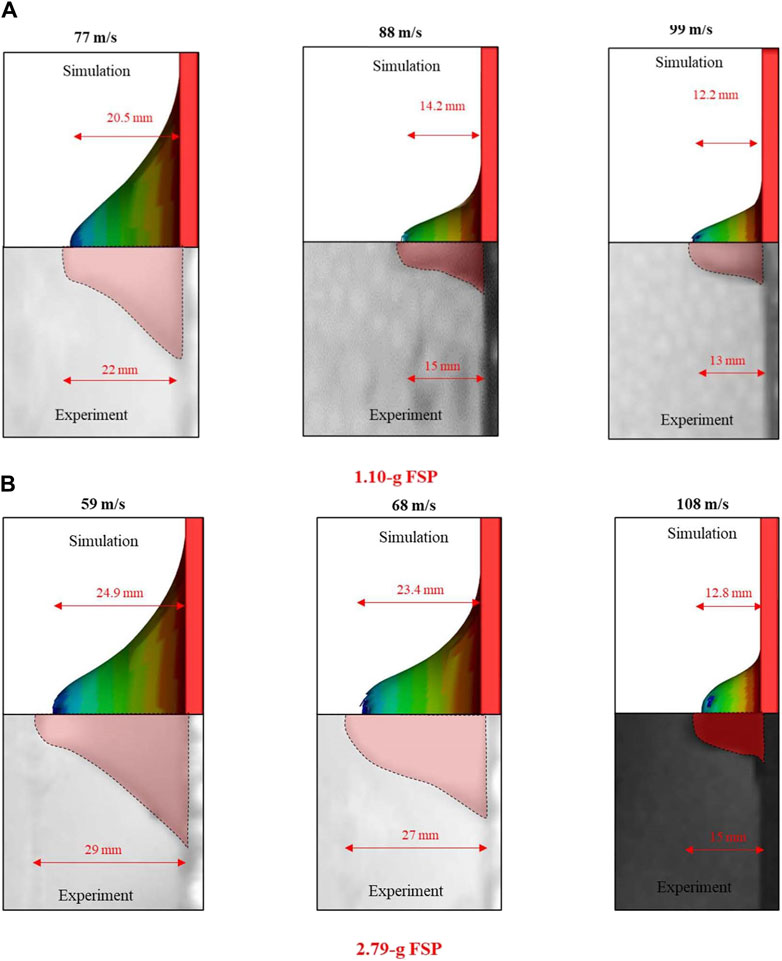
Figure 6. Peak displacements of the skin simulant in the direction of impact for different impact velocities (Vi): (A) 1.10 g and (B) 2.79 g FSPs. The first, second, and third columns of each sub-part correspond to impact velocities below, similar to, and above the threshold velocity (Vth), respectively. The direction of travel of the FSP is from right to left in the images. In the experiment images, the red area is the stretched skin simulant, black and dark gray areas are parts of the metal fixture, and light gray area is the background of the experimental setup.
3.1.3 Failure mechanism
Figure 7 shows the typical failure mechanism during the interaction of the FSP with the skin simulant. In each panel, the simulation image (upper half) is presented along with the corresponding experimental image (lower half). The skin simulant failed under the combination of shearing and elastic hole enlargement. Upon initial impact, the FSP stretched the skin simulant to a certain extent (Figure 7ii). Thereafter, the FSP sheared the skin simulant, resulting in the creation of a cavity (Figure 7iii); this was followed by lateral stretching of the skin simulant (Figure 7iv), a phenomenon typically known as elastic hole enlargement (Rosenberg et al., 2012). After complete perforation of the FSP, the laterally stretched skin simulant retracted elastically (Figure 7v). The combination of cavity creation in the stretched state followed by elastic retraction resulted in the final cavity size being smaller than the FSP size (Figure 7vi). The failure patterns between the experiments and simulations were similar.

Figure 7. Failure process during the interaction of the FSP with the skin simulant.
The mechanism of skin simulant failure is further illustrated using the von Mises stress distribution on the skin simulant’s rear surface (Figure 8). The stress concentration was pronounced in the vicinity of the impact zone. As the FSP made initial contact with the skin simulant, its rectangular nose engaged with the skin simulant, generating an elliptical stress contour (Figure 8A). Subsequently, as the skin simulant continued to stretch, the circular section of the FSP came into contact with the simulant, resulting in a circular stress contour (Figures 8B,C). The elements of the skin simulant beneath the impacting face of the FSP experienced extensive stretching, causing them to reach the failure strain. This marked the initiation and propagation of failure (Figure 8D). Once the element failed in the direction of the thickness, the skin simulant started unloading, resulting in elastic recovery (Figure 8E). The localized failure of the skin simulant (Figure 8D) followed by elastic recovery (Figure 8E) produced the final cavity, whose size was smaller than that of the FSP (Figure 8F).
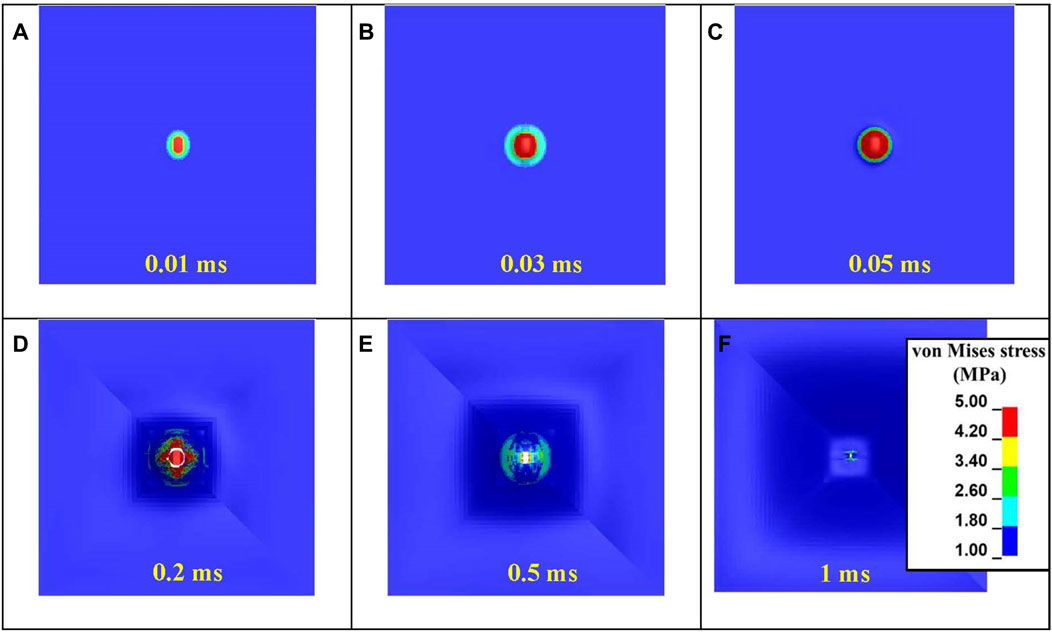
Figure 8. Evolution of the von Mises stress during various stages of the interaction of the FSP with the skin simulant: (A) initial contact; (B, C) stretching of the skin simulant; (D) cavity generation; (E) elastic recovery after complete perforation; (F) final cavity generated after complete unloading.
3.2 Parametric studies
3.2.1 Sensitivity of the skin simulant response to the input stress–strain curve
We investigated the sensitivity of the skin simulant response (i.e., Vth and peak displacement) to the input stress–strain curve. By default, the stress–stain curves corresponding to four strain rates (i.e., quasi-static, 1,000 s-1, 2,800 s-1, and 4,200 s-1) were used as inputs. In subsequent simulations, the stress–strain curve corresponding to a single strain rate was used as the input (i.e., 1,000 s-1, 2,800 s-1, or 4,200 s-1).
Figure 9 shows the Vth values corresponding to the aforementioned cases, which were sensitive to the input stress–strain curves and were hence rate dependent. The maximum value of Vth was obtained when the stress–strain curve corresponding to the highest strain rate was used. The Vth values from the simulations best matched with the experimentally obtained Vth when multiple stress–strain curves corresponding to the full spectrum of strain rates (i.e., quasi-static, 1,000 s-1, 2,800 s-1, and 4,200 s-1) were used.
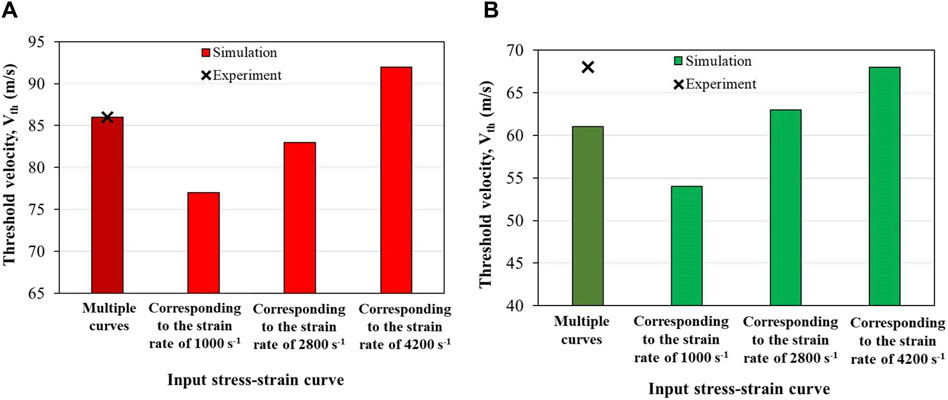
Figure 9. Sensitivity of the threshold velocity (Vth) to the input stress–strain curve with (A) 1.10 g and (B) 2.79 g FSPs.
Strain-rate-dependent behavior was also observed in the peak displacement of the skin simulant. The peak displacements (Figure 10) of the skin simulant at various Vi values were in reasonable agreement with the experimental findings when multiple stress–strain curves corresponding to the full spectrum of strain rates were used. When a single stress–strain curve corresponding to a strain rate of 1,000 s-1 was used, the peak displacements corresponding to velocities of 88 m s–1 and 99 m s–1 were overpredicted. On the contrary, when a single stress–strain curve corresponding to the strain rate of either 2,800 s-1 or 4,200 s-1 was used, the peak displacement corresponding to the velocity of 77 m s–1 was underpredicted.
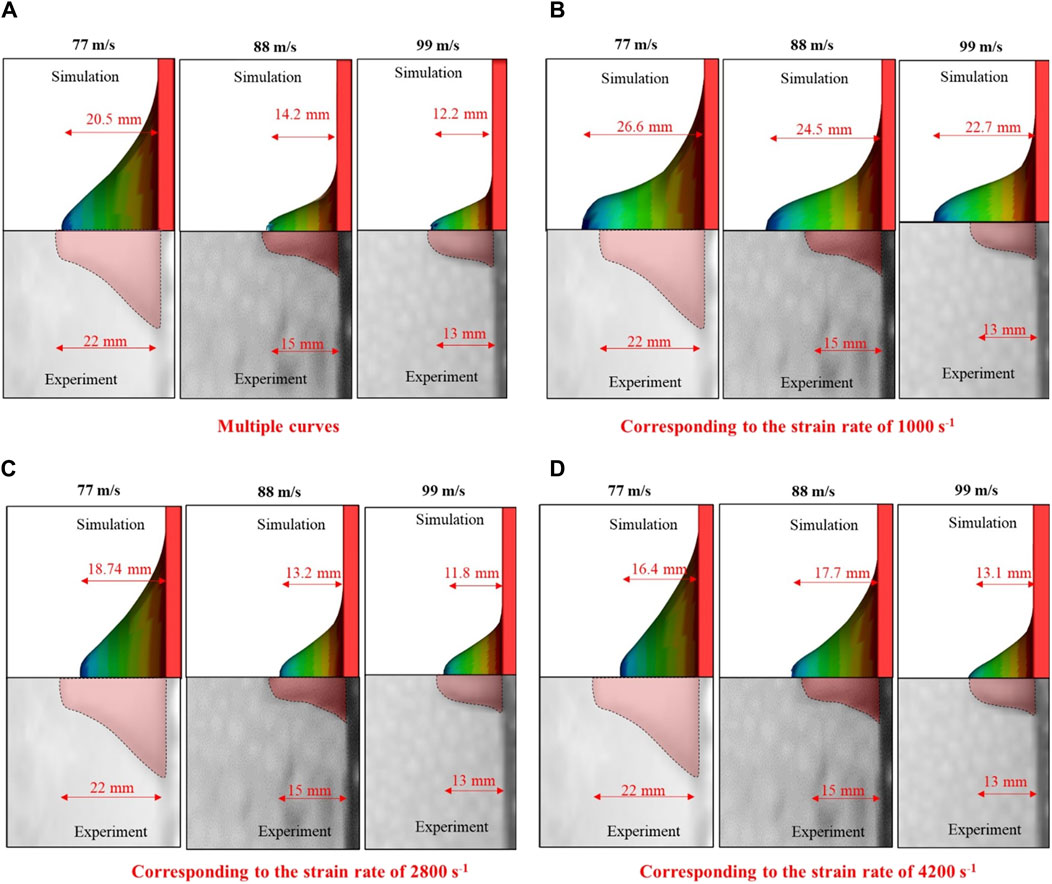
Figure 10. Peak displacement of the skin simulant with respect to input stress-strain curve (A) multiple curves (B) corresponding to the strain rate of 1000 s−1 (C) corresponding to the strain rate of 2800 s−1 (D) corresponding to the strain rate of 4200 s−1. Representative results for 1.10-g FSP are depicted. Similar trends are observed for 2.79-g FSP.
3.2.2 Sensitivity of the skin simulant response to the input failure strain
Figure 11 shows the sensitivity of Vth to the input failure strain. Note that the developed strain rates in the simulations at the investigated Vi values were in the range of 2,500–4,500 s-1. The limiting strain corresponding to input strain rates of 2,800 s-1 and 4,200 s-1 was ∼1 mm mm–1. Hence, the failure strain of ∼1 mm mm–1 at these strain rates varied for the parametric studies. When the input failure strain was based on the limiting strain estimated by the Gent model, the difference in Vth between the simulation and the experiment was not significant (<10%). However, when the failure strain was less than the limiting strain, the difference in Vth between the simulation and experiment was pronounced. For example, for input failure strains of 0.8, 0.6, and 0.4, the Vth from the simulations were underpredicted by ∼20%, ∼33%, and ∼52%, respectively, as compared to the Vth obtained experimentally. A near-plateau trend in the Vth was observed when the input failure strain exceeded the limiting strain.
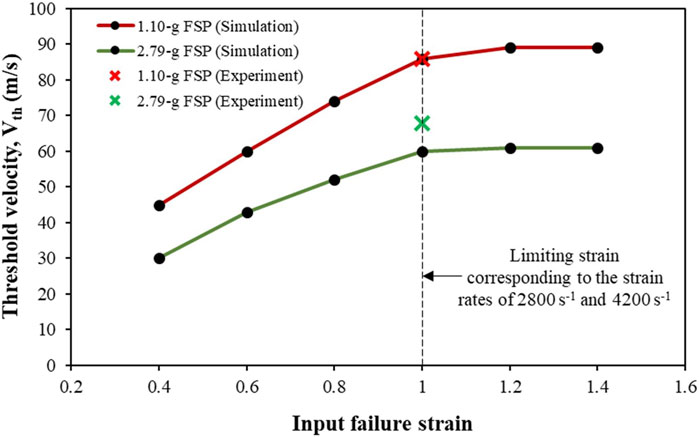
Figure 11. Sensitivity of the threshold velocity (Vth) to the input failure strain values.
3.2.3 Effects of FSP velocity (constant mass) and FSP mass (constant impact energy)
Figure 12 shows the displacements of the skin simulant in the direction of impact (Figure 12A), maximum principal strain (Figure 12B), and maximum principal stress (Figure 12C) within a cross section (c/s) on the rear face. Representative results along the x-axis are shown for the 1.10 g FSP. Results for Vi = 86 m s–1 (low value corresponding to the Vth of the 1.10 g FSP) and Vi = 300 m s–1 (relatively high value) are presented, showing notable distinctions between the low and high Vi cases. The FSP with high Vi induced relatively smaller amplitude deformations (solid lines in Figure 12A) and higher stresses (solid lines in Figure 12C) over a localized area, facilitating relatively easier penetration of the skin simulant over a shorter time (∼0.03 ms). For the low Vi case, relatively larger amplitude deformations (dotted lines in Figure 12A) and lower stresses (dotted lines in Figure 12C) were developed. Interestingly, the penetration process for low velocity required approximately one order of magnitude more time (∼0.3 ms) than the high-velocity impact. Hence, the deformation and stress encompassed a relatively larger c/s area. Similar trends were observed along the y-axis and for the 2.79 g FSP.
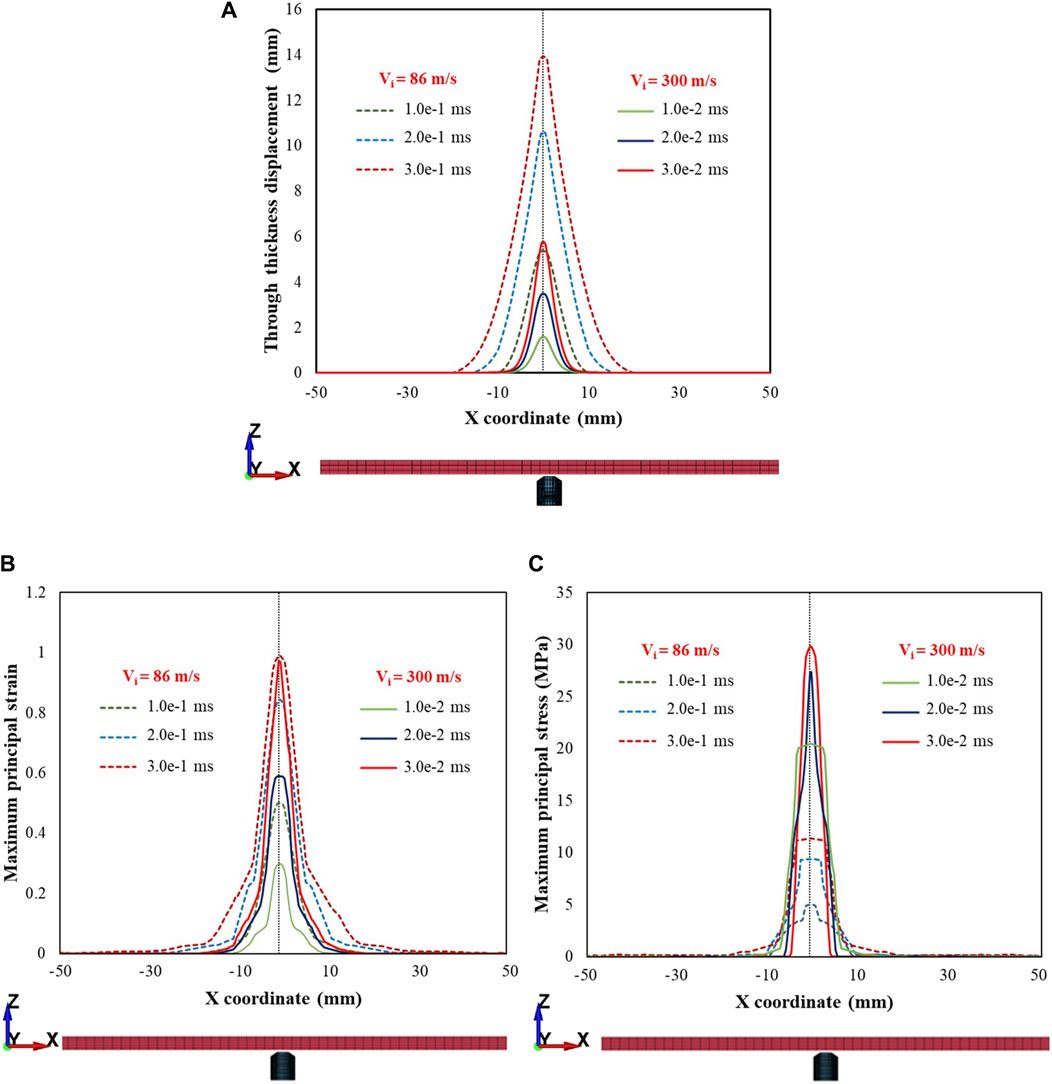
Figure 12. Plots depicting (A) displacement in the direction of impact (i.e., through thickness displacement), (B) maximum principal strain, (C) maximum principal stress within a cross section of the rear face for impact velocities (Vi) of 86 and 300 m s–1. Note that z represents the thickness direction and x, y are the in-plane directions representing the cross section. Plots are depicted for the various time points during penetration. Note that there is a time scale separation between the impact velocities at 86 and 300 m s–1. Representative results along the x-axis for the 1.10 g FSP are presented. Similar trends were observed along the y-axis and for 2.79 g FSP.
When the mass of the FSP was changed (Figure 13) while maintaining the same impact energy (i.e., 5 J), the FSP with a smaller mass induced relatively smaller amplitude deformations (dotted lines in Figure 13A) and higher stresses (dotted lines in Figure 13C) over a localized area. Thus, for the same impact energy, the FSP with the smaller mass achieved relatively easier perforation due to the higher Vi.
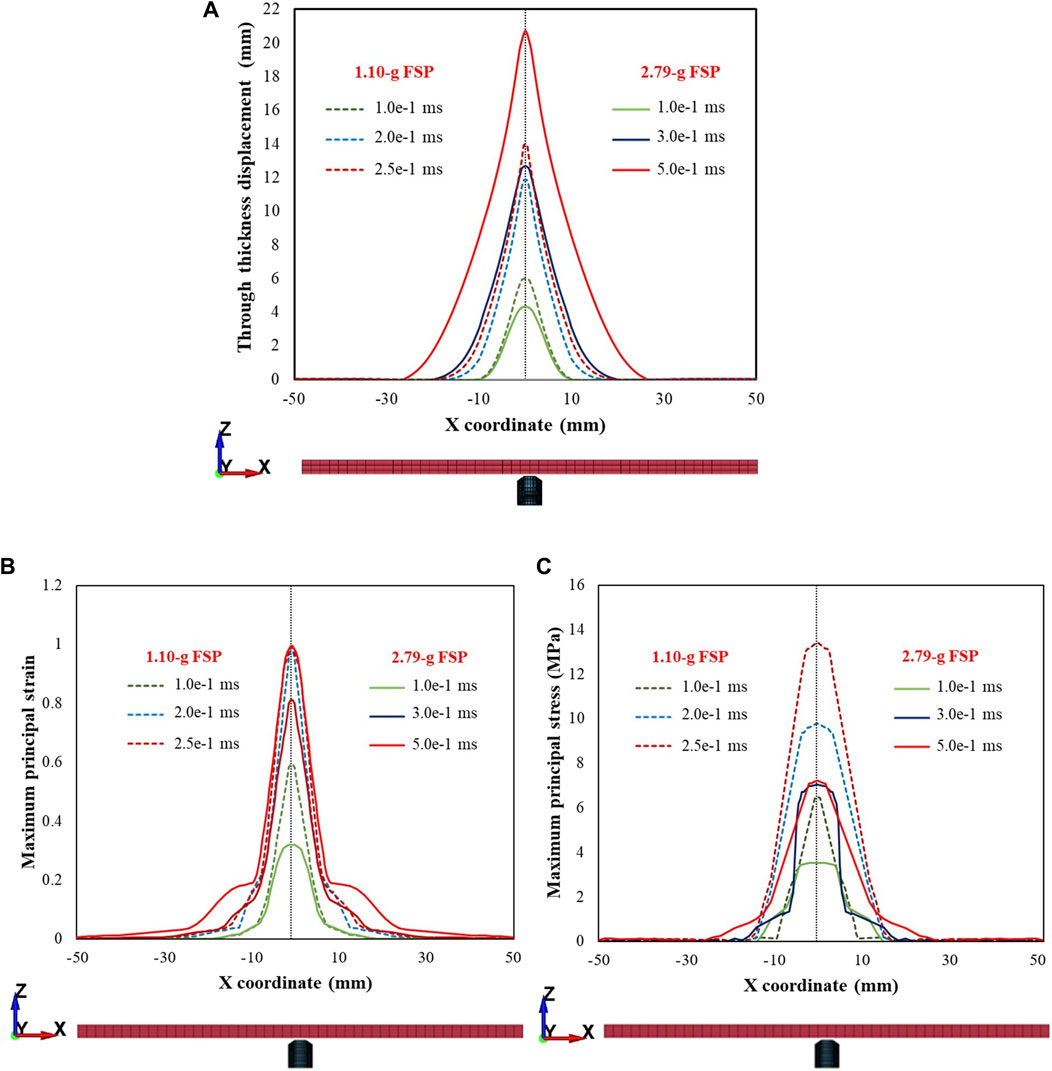
Figure 13. Plots depicting (A) displacement in the direction of impact (i.e., through thickness displacement), (B) maximum principal strain, (C) maximum principal stress within a cross section of the rear face for the same impact energy level (5 J) for the 1.10 g and 2.79 g FSPs. Note that z represents the thickness direction and x,y are the in-plane directions representing the cross section. Plots are depicted for the various time points during penetration.
3.2.4 Effect of the FSP material
Table 5 shows the Vth and Eth/A values when the FSP material was changed from mild steel to BB and PVC plastics. The mass of the FSP was maintained constant (i.e., 1.1 g). Owing to the differences in the densities of BB and PVC plastics with respect to mild steel, the sizes of the BB and PVC FSPs increased proportionally even as the same shape of the FSP was maintained. Compared to the Vth of the mild steel FSP, the Vth values of BB and PVC FSPs were higher by ∼22% and ∼33%, respectively. These increases in Vth are attributed to the larger cross-sectional areas (Table 5), which result in load distributions over wider areas.
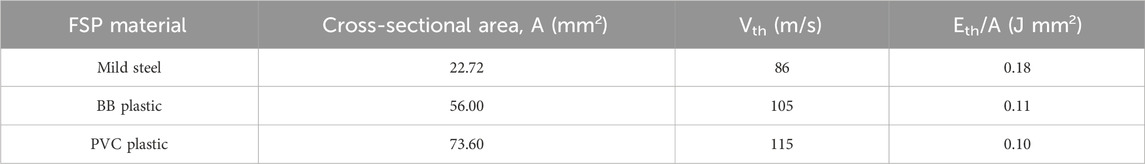
Table 5. Effects of the FSP materials on the threshold velocities (Vth). Results are presented for the 1.10 g FSPs.
Compared to the Eth/A of the mild steel FSP, the Eth/A of BB and PVC FSPs were lower by ∼39% and ∼44%, respectively. Despite the reductions in Eth/A with respect to mild steel, the Eth/A values of BB (0.11 J mm–2) and PVC (0.10 J mm–2) exceeded the proposed contusion threshold of 0.0252 J mm–2 (Park et al., 2011). Furthermore, considerable stresses were generated (e.g., above the laceration threshold of 1 MPa (Park et al., 2011)) over a larger area (Figure 14).
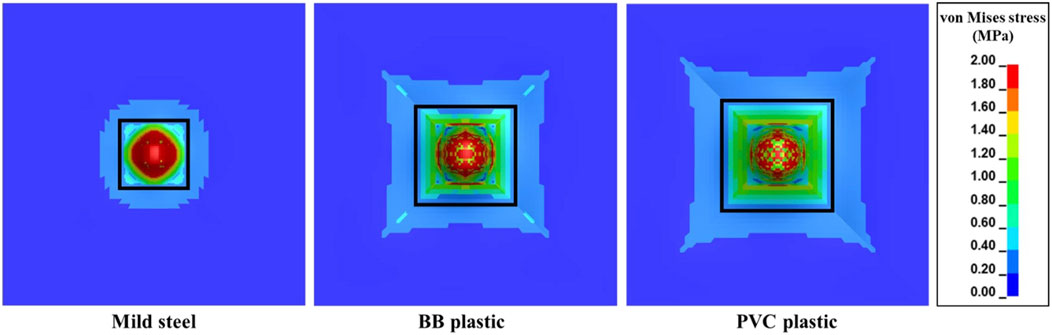
Figure 14. von Mises stress contours of the skin simulant during interaction with FSPs made of different materials for an impact velocity (Vi) of 86 m s–1. The von Mises stress in the region bounded by the black rectangle is above the laceration threshold of 1 MPa, indicating increases in the affected area for FSPs made of BB and PVC plastics.
3.2.5 Effect of the skin simulant thickness
Figure 15 shows Vth as a function of the skin simulant thickness, which exhibits a linear relationship (R2 = 0.99).
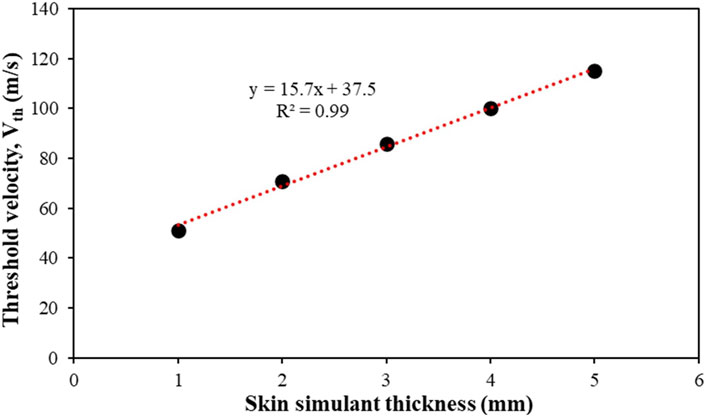
Figure 15. Effect of skin simulant thickness on the threshold velocity (Vth). Results are presented for the 1.10 g FSP.
4 Discussion
In this work, the responses of the skin simulant to ballistic impact were investigated using experiments and concurrent simulations. Simulations were further used to conduct parametric studies by incorporating the rate-dependent material responses at different strain rates (i.e., quasi-static, 1,000 s-1, 2,800 s-1, and 4,200 s-1). Note that the developed strain rates in the simulations at the investigated impact velocities were in the range of 2,500–4,500 s-1. Hence, the stress–strain curves at the chosen strain rates (i.e., 1,000–4,200 s-1) were found to be suitable and related to the experimental velocity ranges. The full spectrum of stress–strain responses at the aforementioned strain rates were used as the inputs unless stated otherwise.
The Vth and Eth/A values decreased as the FSP size increased (Table 4). This trend is consistent with observations in literature. For instance, Breeze et al. (2013) estimated V50 values (i.e., velocity corresponding to 50% probability of perforation) of chisel-nosed FSPs weighing 0.16 g, 0.49 g, and 1.10 g for perforation of goat skin and noted that the 0.16 g and 1.10 g FSPs offered the highest and lowest V50 values, respectively. Breeze and Clasper (2013) also compiled data from various experiments involving fragment impact on either skin or skin simulant, and their comparative analysis revealed a consistent inverse relationship between the fragment size and V50 value. Furthermore, the range of Eth/A (i.e., 0.12–0.18 J mm–2) obtained in this work is commensurate with that reported in literature for skin or skin simulant perforation (Kneubuehl, 2011; Bir et al., 2012; Jin et al., 2019).
We observed that the Vth, Eth/A, and peak displacement values of the skin simulant were sensitive to the strain rate (Figures 9, 10). These results demonstrate an interesting paradigm based on the input stress–strain curve. The aforementioned values from the simulations matched reasonably well with those from the experiments (Figures 5, 6; Table 4) when a full spectrum of stress–strain responses at different strain rates were used as the inputs. This is because the material model appropriately interpolates the data at the strain rates realized in the simulations based on the input stress–strain curves. When a single curve was applied, the results did not match with those from experiments. The Vth was underpredicted and overpredicted when stress–strain curves corresponding to strain rates of 1,000 s-1 and 4,200 s-1 were used as inputs, respectively (Figure 9). When a single stress–strain curve corresponding to a strain rate of 1,000 s-1 was used, the peak displacements at higher impact velocities (i.e., 88 and 99 m s–1) were overpredicted. On the contrary, when a single stress–strain curve corresponding to a strain rate of either 2,800 s-1 or 4,200 s-1 was used, the peak displacement at a lower Vi (i.e., 77 m s–1) was underpredicted (Figure 10). These responses are attributed to stiffening of the material with increase in the strain rate. Upadhyay et al. (2020, 2021) also reported a similar rate-dependent stiffening response in a similar silicone-based soft material. Similar rate-dependent behaviors were also observed in polymers (Li and Lambros, 2001; Chen et al., 2024). Our results underscore that the strain-rate-dependent material response should be incorporated when modeling skin and skin surrogates under ballistic impact. Currently, very few models incorporate strain-rate-dependent behaviors (see Joodaki and Panzer (2018) and the references therein; Liu et al., 2014).
The failure mechanism of the skin simulant involved shearing followed by elastic hole enlargement (Figures 7, 8). The skin simulant stretched in the direction of impact of the FSP until it reached the failure strain (Figure 7i–iii). The subsequent unloading phase involved lateral stretching by the FSP as the skin simulant attempted to undergo elastic recovery but was constrained by the presence of the FSP (Figure 7iv), a phenomenon known as elastic hole enlargement. After complete perforation (Figure 7v), the final size of the generated cavity induced by shearing remained smaller than the diameter of the FSP (Figure 7vi). This occurrence of a smaller cavity in the skin simulant compared to the FSP size due to elastic retraction is consistent with findings documented in existing literature (Inchingolo et al., 2011; Kneubuehl et al., 2011; Baptista et al., 2014; Carr et al., 2014; Serraino et al., 2020).
Interestingly, we observed that the peak displacements of the skin simulant at impact velocities corresponding to perforation were lower than those corresponding to non-perforation (Figures 6, 10). As the velocity of the FSP increases, the rate of loading increases and failure strain decreases (Li and Lambros, 2001; Shergold et al., 2006; Lim et al., 2011; Khatam et al., 2014; Ottenio et al., 2015; Joodaki and Panzer, 2018; Chen et al., 2024). Hence, the deformation becomes more localized with a relatively smaller amplitude (Figures 12A, 13A) and generates high stresses (Figures 12C, 13C) over a small area in a short time. This suggests that failure is stress driven (for additional details, see Supplementary Material), facilitating relatively easier perforation of the skin simulant at velocities corresponding to perforation (Figures 12, 13). The shorter times required for perforation at higher velocities result in relatively smaller peak displacements of the skin simulant compared to those at lower velocities (Figures 6, 10).
The Vth values were sensitive to the input failure strain (Figure 11). Owing to the absence of experimental data on failure strain, we estimated the failure strains using the Gent model, which gives the limiting or maximum extensibility. The Vth from the simulation matched the experimental Vth (Figure 11) when the input failure strain was based on the estimate from the Gent model (or within 10% of the estimates from the Gent model). For input failure strain values lower than those estimated by the Gent model, the Vth values were underpredicted. The Vth exhibited a near-plateau trend when the input failure strain was above the limiting strain estimated by the Gent model. This underscores the importance of the input failure strain value. Our results suggest that the limiting strain obtained from the Gent model is a reasonable estimate of the failure strain. This is especially noteworthy considering the typical lack of high-strain-rate experimental data up to failure strain in literature (Joodaki and Panzer, 2018).
We investigated the influence of the FSP material on the ballistic responses of the skin simulant (Table 5). FSPs made of three different materials (mild steel, BB plastic, and PVC plastic) and having the same mass (1.10 g) were studied. Even though Vth increased by 22%–33% with the plastic FSPs, these increases may not be sufficient to qualify plastic FSPs as non-lethal. A few investigations suggest that projectiles made of BB plastic can penetrate the skin (Grocock et al., 2006; Tsui et al., 2010; Jin et al., 2019) when expelled with considerable velocity (90–160 m s–1). Furthermore, the energy densities (Table 5) of the plastic FSPs exceeded the contusion threshold of 0.0252 J mm–2 (Park et al., 2011) and generated stresses in the skin simulant by exceeding the laceration threshold of 1 MPa (Park et al., 2011) (Figure 14). Considerable stresses were also generated over larger areas. These observations are critical as plastic projectiles are generally used as non-lethal projectiles to control or disperse crowds during law enforcement (Bir et al., 2005; Rezende-Neto et al., 2009; Bir et al., 2012).
We also found a linear relation between Vth and skin simulant thickness (Figure 15). In this work, we used narrow ranges of velocities (60–100 m s–1) and masses (1.10 g; 2.79 g) of chisel-nosed FSPs. Hence, in this work, the linear relationship between Vth and skin simulant thickness is independent of the FSP velocity and mass. In the future, it would be interesting to investigate whether the linear relation between Vth and skin simulant thickness is applicable for wider ranges of velocities, masses, and shapes of the FSPs.
5 Limitations
The present work has a few limitations. In this work, similar stress–strain responses were assumed under compression and tension; this is mainly due to the lack of compression data on the skin simulant used in this work. It should be noted that soft polymeric materials of this class often behave asymmetrically under tension and compression (Donato and Bianchi, 2012; Pellegrino et al., 2015; Siviour and Jordan, 2016; Chen et al., 2024). Efforts will therefore be made in the future to obtain and utilize compression stress–strain data for the skin simulant.
6 Conclusion
In this study, we investigated the rate-dependent ballistic responses of the skin simulant under fragment impact. A finite-element model was developed alongside experimental testing, and reasonable agreement was observed between the numerical simulation and experimental results. The following key conclusions are drawn from this study.
• The threshold velocity (Vth) and energy density (Eth/A) decrease with increasing size of the FSP.
• The energy density (Eth/A) was in a narrow range (0.12–0.18 J mm–2) for investigated FSPs.
• The Vth and peak displacement of the skin simulant exhibited sensitivity to the strain rate. Vth was underpredicted when using a single stress–strain curve corresponding to a strain rate of 1,000 s-1 and overpredicted when using a single stress–strain curve at a strain rate of 4,200 s-1. The closest match between the simulated and experimental Vth was achieved when the stress–strain curves were considered across the full spectrum of strain rates (quasi-static, 1,000 s-1, 2,800 s-1, and 4,200 s-1). Similar trends were observed for the peak displacement of the skin simulant.
• The peak displacement of the skin simulant was a function of the impact velocity. The peak displacements of the skin simulant at lower impact velocities (during non-perforation) were higher compared to those at higher velocities (during perforation). This was attributable to the stress-driven failure.
• The failure mechanism of the skin simulant primarily entailed cavity shearing followed by elastic hole enlargement. The final size of the resulting cavity remained smaller than the size of the corresponding FSP.
• The Vth from simulation best matched the experimental Vth when the input failure strain was close to the limiting strain estimated from the Gent model.
• Although 1.10 g FSPs made of BB and PVC plastics demonstrated higher Vth than mild steel FSPs of the same size, they exhibited significant threats of contusion and laceration.
• A linear relationship was noted between Vth and skin simulant thickness.
Data availability statement
The original contributions presented in the study are included in the article/Supplementary Material, and any further inquiries may be directed to the corresponding author.
Author contributions
PP: conceptualization, data curation, formal analysis, investigation, methodology, software, validation, and writing–original draft. SG: conceptualization, funding acquisition, supervision, and writing–review and editing.
Funding
The authors declare that financial support was received for the research, authorship, and/or publication of this article. This work was supported by the Armaments Research Board (grant number ARMREB-ASE-2018-198).
Acknowledgments
SG acknowledges financial support from the Armaments Research Board under grant number ARMREB-ASE-2018-198.
Conflict of interest
The authors declare that the research was conducted in the absence of any commercial or financial relationships that could be construed as a potential conflict of interest.
Publisher’s note
All claims expressed in this article are solely those of the authors and do not necessarily represent those of their affiliated organizations or those of the publisher, editors, and reviewers. Any product that may be evaluated in this article or claim that may be made by its manufacturer is not guaranteed or endorsed by the publisher.
Supplementary material
The Supplementary Material for this article can be found online at: https://www.frontiersin.org/articles/10.3389/fbioe.2024.1422685/full#supplementary-material
Abbreviations
FSP, fragment simulating projectile; Vi, impact velocity; Vr, residual velocity; Vth, threshold velocity; Eth, threshold energy; A, cross-sectional (c/s) area; Eth/A, energy density; BB, ball bearing; PVC, polyvinyl chloride; SHPB, split Hopkinson pressure bar.
References
Allen, F., and Sperrazza, J. (1956). New casualty criteria for wounding by fragments ballistic research laboratories, aberdeen proving ground. Maryland Report.
Baptista, M. V., d'Ávila, S. C., and d'Ávila, A. M. M. (2014). Histopathological detection of entry and exit holes in human skin wounds caused by firearms. J. forensic Leg. Med. 25, 49–52. doi:10.1016/j.jflm.2014.04.017
Bir, C. A., Resslar, M., and Stewart, S. (2012). Skin penetration surrogate for the evaluation of less lethal kinetic energy munitions. Forensic Sci. Int. 220, 126–129. doi:10.1016/j.forsciint.2012.02.008
Bir, C. A., Stewart, S. J., and Wilhelm, M. (2005). Skin penetration assessment of less lethal kinetic energy munitions. J. Forensic Sci. 50, JFS2004551–4. doi:10.1520/jfs2004551
Bolduc, M., and Jager, H. (2016). “Summary of newly ratified NATO standard AEP 2920, ed. A, V1,” in Personal armour systems symposium PASS 2016 proceeding book, 25–40.
Bowyer, G., Cooper, G., and Rice, P. (1995). Management of small fragment wounds in war: current research. Ann. R. Coll. Surg. Engl. 77, 131–134. doi:10.1097/00005373-199603001-00037
Breeze, J., and Clasper, J. C. (2013). Determining the velocity required for skin perforation by fragment simulating projectiles: a systematic review. a Syst. Rev. BMJ Mil. Health 159, 265–270. doi:10.1136/jramc-2013-000070
Breeze, J., James, G., and Hepper, A. (2013). Perforation of fragment simulating projectiles into goat skin and muscle. BMJ Mil. Health 159, 84–89. doi:10.1136/jramc-2013-000065
Breeze, J., Sedman, A., James, G., Newbery, T., and Hepper, A. (2014). Determining the wounding effects of ballistic projectiles to inform future injury models: a systematic review. a Syst. Rev. BMJ Mil. Health 160, 273–278. doi:10.1136/jramc-2013-000099
Carr, D., Kieser, J., Mabbott, A., Mott, C., Champion, S., and Girvan, E. (2014). Damage to apparel layers and underlying tissue due to hand-gun bullets. Int. J. Leg. Med. 128, 83–93. doi:10.1007/s00414-013-0856-1
Carr, D. J., Lewis, E., and Horsfall, I. (2017). A systematic review of military head injuries. BMJ Mil. Health 163, 13–19. doi:10.1136/jramc-2015-000600
Champion, H. R., Bellamy, R. F., Roberts, C. P., and Leppaniemi, A. (2003). A profile of combat injury. J. Trauma Acute Care Surg. 54, S13–S19. doi:10.1097/01.ta.0000057151.02906.27
Chanda, A. (2018). Biomechanical modeling of human skin tissue surrogates. Biomimetics 3, 18. doi:10.3390/biomimetics3030018
Chanda, A., Unnikrishnan, V., Flynn, Z., and Lackey, K. (2017). Experimental study on tissue phantoms to understand the effect of injury and suturing on human skin mechanical properties. Proc. Institution Mech. Eng. Part H J. Eng. Med. 231, 80–91. doi:10.1177/0954411916679438
Chanda, A., and Upchurch, W. (2018). Biomechanical modeling of wounded skin. J. Compos. Sci. 2, 69. doi:10.3390/jcs2040069
Chen, C., Cheng, Y., Zhu, X., Cai, Y., Xue, Y., Kong, N., et al. (2020). Ultrasound assessment of skin thickness and stiffness: the correlation with histology and clinical score in systemic sclerosis. Arthritis Res. & Ther. 22, 197–198. doi:10.1186/s13075-020-02285-x
Chen, W. W. (2016). Experimental methods for characterizing dynamic response of soft materials. J. Dyn. Behav. Mater. 2, 2–14. doi:10.1007/s40870-016-0047-5
Chen, Y., Quino, G., and Pellegrino, A. (2024). A comprehensive investigation on the temperature and strain rate dependent mechanical response of three polymeric syntactic foams for thermoforming and energy absorption applications. Polym. Test. 130, 108287. doi:10.1016/j.polymertesting.2023.108287
Deka, L., Bartus, S., and Vaidya, U. (2008). Damage evolution and energy absorption of E-glass/polypropylene laminates subjected to ballistic impact. J. Mater. Sci. 43, 4399–4410. doi:10.1007/s10853-008-2595-0
Donato, G. H. B., and Bianchi, M. (2012). Pressure dependent yield criteria applied for improving design practices and integrity assessments against yielding of engineering polymers. Eng. Polym. J. Mater. Res. Technol. 1, 2–7. doi:10.1016/s2238-7854(12)70002-9
Fenton, L., Horsfall, I., and Carr, D. (2020). Skin and skin simulants. J. Forensic Sci. 52, 96–106. doi:10.1080/00450618.2018.1450896
Gent, A. N. (1996). A new constitutive relation for rubber. Rubber Chem. Technol. 69, 59–61. doi:10.5254/1.3538357
Grocock, C., McCarthy, R., and Williams, D. J. (2006). Ball Bearing (BB) guns, ease of purchase and potential for significant injury. Ann. R. Coll. Surg. Engl. 88, 402–404. doi:10.1308/003588406x98630
Guo, L., and Wang, Y. (2020). High-rate tensile behavior of silicone rubber at various temperatures Rubber. Chem. Technol. 93, 183–194. doi:10.5254/rct.19.81562
Henderson, J. (2010). ALethality criteria for debris generated from accidental explosions. Ministry Def. Lond.
Horgan, C., and Saccomandi, G. (2022). A description of arterial wall mechanics using limiting chain extensibility constitutive models. Biomechanics Model. Mechanobiol. 1, 251–266. doi:10.1007/s10237-002-0022-z
Inchingolo, F., Tatullo, M., Marrelli, M., Inchingolo, A. D., Pinto, G., Inchingolo, A. M., et al. (2011). Short report of an unusual ballistic trauma. Int. J. Surg. case Rep. 2, 272–274. doi:10.1016/j.ijscr.2011.08.009
Jin, Y., Haitao, L., Cheng, W., Wang, X., Han, R., Li, R., et al. (2019). The experimental and numerical investigation on the ballistic limit of BB—gun pellet versus skin simulant. Forensic Sci. Int. 298, 393–397. doi:10.1016/j.forsciint.2019.02.033
Joodaki, H., and Panzer, M. B. (2018). Skin mechanical properties and modeling: a review. A Rev. Proc. Institution Mech. Eng. Part H J. Eng. Med. 232, 323–343. doi:10.1177/0954411918759801
Jor, J. W., Parker, M. D., Taberner, A. J., Nash, M. P., and Nielsen, P. M. (2013). Computational and experimental characterization of skin mechanics: identifying current challenges and future directions. Syst. Biol. Med. 5, 539–556. doi:10.1002/wsbm.1228
Kalra, A., Lowe, A., and Al-Jumaily, A. (2016). Mechanical behaviour of skin: a review. J. Mater Sci. Eng. 5, 1000254. doi:10.4172/2169-0022.1000254
Khatam, H., Liu, Q., and Ravi-Chandar, K. (2014). Dynamic tensile characterization of pig skin. Acta Mech. Sin. 30, 125–132. doi:10.1007/s10409-014-0042-9
Khodadadi, A., Liaghat, G., Ahmadi, H., Bahramian, A. R., Anani, Y., Razmkhah, O., et al. (2019a). Numerical and experimental study of impact on hyperelastic rubber panels. Iran. Polym. J. 28, 113–122. doi:10.1007/s13726-018-0682-x
Khodadadi, A., Liaghat, G., Ahmadi, H., Bahramian, A. R., and Razmkhah, O. (2019b). Impact response of Kevlar/rubber composite. Compos. Sci. Technol. 184, 107880. doi:10.1016/j.compscitech.2019.107880
Kneubuehl, B. P. (2011). Wound ballistics: basics and applications. Springer science & business media.
Kneubuehl, B. P., Coupland, R. M., Rothschild, M. A., and Thali, M. J. (2011). “Wound ballistics and forensic medicine,” in Wound ballistics (Springer), 253–303.
Kolling, S., Du Bois, P., Benson, D., and Feng, W. (2007). A tabulated formulation of hyperelasticity with rate effects and damage. Comput. Mech. 40, 885–899. doi:10.1007/s00466-006-0150-x
Laurent, A., Mistretta, F., Bottigioli, D., Dahel, K., Goujon, C., Nicolas, J. F., et al. (2007). Echographic measurement of skin thickness in adults by high frequency ultrasound to assess the appropriate microneedle length for intradermal delivery of vaccines. Natl. Libr. Med. 25, 6423–6430. doi:10.1016/j.vaccine.2007.05.046
Li, Z., and Lambros, J. (2001). Strain rate effects on the thermomechanical behavior of polymers. Int. J. solids Struct. 38, 3549–3562. doi:10.1016/s0020-7683(00)00223-7
Lim, J., Hong, J., Chen, W. W., and Weerasooriya, T. (2011). Mechanical response of pig skin under dynamic tensile loading. Int. J. Impact Eng. 38, 130–135. doi:10.1016/j.ijimpeng.2010.09.003
Limbert, G. (2017). Mathematical and computational modelling of skin biophysics: a review. a Rev. Proc. R. Soc. A Math. Phys. Eng. Sci. 473, 20170257. doi:10.1098/rspa.2017.0257
Liu, H., Chen, J., Kang, J.-y., Li, X.-x., and Azhari, I. (2014). Finite element analysis of the dynamic response of the cardiovascular system to the blunt ballistic impact Computer Modelling and new. Technologies 18, 44–49.
LSTC (2021). “LS-DYNA keyword user's manual,”. California, United States: Livermore Software Technology Corporation.
Marechal, L., Balland, P., Lindenroth, L., Petrou, F., Kontovounisios, C., and Bello, F. (2021). Toward a common framework and database of materials for soft robotics. Soft Robot. 8, 284–297. doi:10.1089/soro.2019.0115
Muhr, A. (2005). Modeling the stress-strain behavior of rubber. Rubber Chem. Technol. 78, 391–425. doi:10.5254/1.3547890
NATO (2003). “NATO standardization agreement (STANAG 2920): ballistic test method for personal armour materials and combat clothing,” in NATO standardization agency. 2nd ed.
Ogden, R. W. (1972). Large deformation isotropic elasticity–on the correlation of theory and experiment for incompressible rubberlike solids Proceedings of the Royal Society of London. A Math. Phys. Sci., 565–584. doi:10.1098/rspa.1972.0026
Ottenio, M., Tran, D., Annaidh, A. N., Gilchrist, M. D., and Bruyère, K. (2015). Strain rate and anisotropy effects on the tensile failure characteristics of human skin. J. Mech. Behav. Biomed. Mater. 41, 241–250. doi:10.1016/j.jmbbm.2014.10.006
Park, J.-J., Haddadin, S., and Song, J.-B. (2011). “Albu-Schäffer A Designing optimally safe robot surface properties for minimizing the stress characteristics of human-robot collisions,” in 2011 IEEE international conference on robotics and automation (IEEE), 5413–5420.
Pavier, J., Langlet, A., Eches, N., and Jacquet, J.-F. (2015). On ballistic parameters of less lethal projectiles influencing the severity of thoracic blunt impacts. Engineering 18, 192–200. doi:10.1080/10255842.2013.789101
Pellegrino, A., Tagarielli, V., Gerlach, R., and Petrinic, N. (2015). The mechanical response of a syntactic polyurethane foam at low and high rates of strain. Int. J. Impact Eng. 75, 214–221. doi:10.1016/j.ijimpeng.2014.08.005
Rashid, B., Destrade, M., and Gilchrist, M. D. (2014). Mechanical characterization of brain tissue in tension at dynamic strain rates. J. Mech. Behav. Biomed. Mater. 33, 43–54. doi:10.1016/j.jmbbm.2012.07.015
Regasa, L. E., Kaplan, D. A., Martin, E. M. M., Langbein, J., Johnson, F., and Chase, L. C. (2018). Mortality following hospital admission for US active duty service members diagnosed with penetrating traumatic brain injury. J. Head Trauma Rehabilitation 33, 123–132. doi:10.1097/htr.0000000000000380
Rezende-Neto, J., Silva, F. D., Porto, L. B., Teixeira, L. C., Tien, H., and Rizoli, S. B. (2009). Penetrating injury to the chest by an attenuated energy projectile: a case report and literature review of thoracic injuries caused by" less-lethal. munitions World J. Emerg. Surg. 4, 1–5. doi:10.1186/1749-7922-4-26
Sachs, D., Wahlsten, A., Kozerke, S., Restivo, G., and Mazza, E. (2021). A biphasic multilayer computational model of human skin. Biomechanics Model. Mechanobiol. 20, 969–982. doi:10.1007/s10237-021-01424-w
Serraino, S., Milone, L., Picone, D., Argo, A., Salerno, S., and Midiri, M. (2020). “Imaging for ballistic trauma: other applications of forensic imaging in the living,” in Radiology in forensic medicine (Springer), 169–180.
Shergold, O. A., Fleck, N. A., and Radford, D. (2006). The uniaxial stress versus strain response of pig skin and silicone rubber at low and high strain rates. Int. J. impact Eng. 32, 1384–1402. doi:10.1016/j.ijimpeng.2004.11.010
Siviour, C. R., and Jordan, J. L. (2016). High strain rate mechanics of polymers: a review. J. Dyn. Behav. Mater. 2, 15–32. doi:10.1007/s40870-016-0052-8
Smooth-on. Smooth-on Dragon Skin™ Series Addition Cure Silicone Rubber Compounds. Technical Bulletin. Available at: https://www.smooth-on.com/tb/files/DRAGON_SKIN_SERIES_TB.pdf
Sperrazza, J., and Kokinakis, W. (1968). Ballistic limits of tissue and clothing. Ann. N. Y. Acad. Sci. 152, 163–167. doi:10.1111/j.1749-6632.1968.tb11973.x
Tsui, C., Tsui, K., and Tang, Y. (2010). Ball bearing (BB) gun injuries. J. Emerg. Med. 17, 488–491. doi:10.1177/102490791001700510
Upadhyay, K., Spearot, D., and Subhash, G. (2021). Validated tensile characterization of the strain rate dependence in soft materials. Soft Mater. Int. J. Impact Eng. 156, 103949. doi:10.1016/j.ijimpeng.2021.103949
Upadhyay, K., Subhash, G., and Spearot, D. (2020). Visco-hyperelastic constitutive modeling of strain rate sensitive soft materials. J. Mech. Phys. Solids 135, 103777. doi:10.1016/j.jmps.2019.103777
Wahlsten, A., Pensalfini, M., Stracuzzi, A., Restivo, G., Hopf, R., and Mazza, E. (2019). On the compressibility and poroelasticity of human and murine skin. skin Biomechanics Model. Mechanobiol. 18, 1079–1093. doi:10.1007/s10237-019-01129-1
Yoganandan, N., and Pintar, F. A. (1997). Biomechanics of penetrating trauma. Engineering 25, 485–501. doi:10.1615/critrevbiomedeng.v25.i6.10
Keywords: skin simulant, fragment, impact, threshold velocity, failure, strain rate sensitivity
Citation: Pandey PK and Ganpule SG (2024) Investigation of dynamic responses of skin simulant against fragment impact through experiments and concurrent computational modeling. Front. Bioeng. Biotechnol. 12:1422685. doi: 10.3389/fbioe.2024.1422685
Received: 17 May 2024; Accepted: 02 August 2024;
Published: 27 August 2024.
Edited by:
Zhen (Jeff) Luo, University of Technology Sydney, AustraliaReviewed by:
Ahmed Alshareef, University of South Carolina, United StatesAntonio Pellegrino, University of Bath, United Kingdom
Copyright © 2024 Pandey and Ganpule. This is an open-access article distributed under the terms of the Creative Commons Attribution License (CC BY). The use, distribution or reproduction in other forums is permitted, provided the original author(s) and the copyright owner(s) are credited and that the original publication in this journal is cited, in accordance with accepted academic practice. No use, distribution or reproduction is permitted which does not comply with these terms.
*Correspondence: S. G. Ganpule, Z2FucHVsZUBtZS5paXRyLmFjLmlu