 Jan Tobias Weggen
 Ryan Bean2
 Jürgen Hubbuch
- 1Institute of Process Engineering in Life Sciences, Section IV: Biomolecular Separation Engineering, Karlsruhe Institute of Technology (KIT), Karlsruhe, Germany
- 2Purification Process Sciences, BioPharmaceuticals Development, R&D, AstraZeneca, Gaithersburg, MD, United States
The conjugation reaction is the central step in the manufacturing process of antibody-drug conjugates (ADCs). This reaction generates a heterogeneous and complex mixture of differently conjugated sub-species depending on the chosen conjugation chemistry. The parametrization of the conjugation reaction through mechanistic kinetic models offers a chance to enhance valuable reaction knowledge and ensure process robustness. This study introduces a versatile modeling framework for the conjugation reaction of cysteine-conjugated ADC modalities—site-specific and interchain disulfide conjugation. Various conjugation kinetics involving different maleimide-functionalized payloads were performed, while controlled gradual payload feeding was employed to decelerate the conjugation, facilitating a more detailed investigation of the reaction mechanism. The kinetic data were analyzed with a reducing reversed phase (RP) chromatography method, that can readily be implemented for the accurate characterization of ADCs with diverse drug-to-antibody ratios, providing the conjugation trajectories of the single chains of the monoclonal antibody (mAb). Possible kinetic models for the conjugation mechanism were then developed and selected based on multiple criteria. When calibrating the established model to kinetics involving different payloads, conjugation rates were determined to be payload-specific. Further conclusions regarding the kinetic comparability across the two modalities could also be derived. One calibrated model was used for an exemplary in silico screening of the initial concentrations offering valuable insights for profound understanding of the conjugation process in ADC development.
1 Introduction
Targeted anticancer therapeutics are becoming increasingly prevalent in the field of biopharmaceuticals. One important class in this toolbox are antibody-drug conjugates (ADCs), which consist of a conventional monoclonal antibody (mAb) chemically coupled with a highly potent small-molecule (so called “drug” or “payload”). The success of an ADC depends on conjugating a specific number, typically between two to eight, of cytotoxic payload onto a mAb, determining the final ADC potency and toxicity (Chau et al., 2019). Related to this, one facet is the choice of the conjugation strategy which controls critical quality attributes (CQA) of the final product, such as the drug-to-antibody ratio (DAR) and drug load distribution (DLD) (Ponziani et al., 2020; Dean et al., 2021). To overcome problems associated with unfavorable DAR heterogeneities and to improve the overall potency, site-specific conjugation or more hydrophilic linkers have been developed (Panowski et al., 2014; Joubert et al., 2020). On the downside, these continuous advances hinder the development of a standardized platform process, and thus increase the time and effort to develop a scalable and robust manufacturing process (Hutchinson et al., 2018; Matsuda and Mendelsohn, 2021).
Quality by Design (QbD) is increasingly expected by regulatory agencies, aiming to ensure consistent product quality and improve process understanding (Anurag and Winkle, 2009). One major aspect in QbD is the utilization of modeling techniques which has been proven to be an invaluable tool for gaining insights into complex systems and optimizing manufacturing operations (Roush et al., 2020; Babi et al., 2022). Process modeling enables parametrization of (bio)chemical effects dominating bioprocesses and hence, understanding the impact of such effects in silico. In essence, process models serve as a basis for digital and automation technologies that can accelerate the development of efficient and robust manufacturing processes (Narayanan et al., 2020).
For biochemical reactions, one particularly important aspect of process modeling is kinetic modeling, which focuses on characterizing the rates and complex mechanisms of reactions involved. In contrast to statistical approaches, such as Design of Experiment (DoE) which purely rely on the statistical relationship between input and output variables, kinetic models provide a quantitative description of the underlying reaction kinetics, elucidating the impact of various factors such as temperature, pH, reactant concentrations (Taylor et al., 2022). Previous work has demonstrated the successful establishment of kinetic models in the area of bioprocessing, e.g., for biomass conversion (Vollmer et al., 2022), fermentation (Kyriakopoulos et al., 2018) or small-molecule synthesis (Ashworth et al., 2019), and with a special focus on protein modification, e.g., for protein PEGylation (Pfister et al., 2016), antibody oxidation (Tang et al., 2020) or antibody reduction for ADCs (Nayak and Richter, 2023). The challenge of creating a kinetic model usually centers around finding the correct rate laws for each individual reaction step and their corresponding rate constants. This can be cumbersome due to the presence of multiple interacting species or complex reaction networks. To find the most reliable process model among possible model candidates, different techniques have been proposed in the literature to assess the quality of the estimated parameters (e.g., parameter identifiability analysis or Fisher Information Matrix) and quantifying the output uncertainty (Sin et al., 2009; Anane et al., 2019; Rodman and Gerogiorgis, 2020).
In ADC manufacturing, the conjugation reaction represents a key step as it generates the ADC molecule (Abdollahpour-Alitappeh et al., 2019). Comprehensive understanding of the kinetics of this reaction step is vital for process developers, as it enables the minimization of payload usage, thereby reducing the cost-of-goods. Consequently, employing less payload also facilitates the removal of free unconjugated payload, which is crucial to minimize toxicity of the final product (Fernandez-Cerezo et al., 2023). The currently available literature guiding process development for ADCs is scarce (Matsuda et al., 2020). Typically, DoE methodologies are utilized to gain knowledge about reaction parameters, such as reactant concentrations, temperature, time or pH, affecting the conjugation process (Stump and Steinmann, 2013), which can be augmented when high-throughput screenings (Andris et al., 2018) or continuous flow reactors (Nakahara et al., 2022) are used to automatize experimental work. However, DoEs cannot provide a deep understanding of the molecular or chemical mechanisms that drive the reaction. Andris et al. (2019) developed a mechanistic kinetic model for a site-specific conjugation reaction using a pseudo payload. The study showcases the benefit of the kinetic model as a versatile in silico decision tool for the investigation and development of the conjugation reaction. In subsequent studies, we could show that conjugation kinetic models realize their full potential by coupling a kinetic model with computational fluid dynamics (CFD) to study large-scale conjugation reactions (Weggen et al., 2023), and enable real-time monitoring of non-observable ADC species during the reaction through combination with UV/Vis spectroscopy via an extended Kalman Filter (Schiemer et al., 2023). However, applications of this kinetic model are still limited due to various reasons: 1) The reliance on an analytical technique that is performed under native (non-denaturing) conditions which is usually limited to ADCs with low DAR values; 2) a relatively small concentration range up to 2.5 g/L, whereas actual operational conditions may be higher, typically around 20 g/L; 3) the unproven transferability of the kinetic model to other payloads; and 4) the unverified application to alternative conjugation modalities such as interchain cysteine conjugation.
This study focuses on mechanistic modeling of the conjugation kinetic for two prominent cysteine-based modalities, site-specific (DAR 2) and interchain disulfide (DAR 8) conjugation, which represent a main part of current conjugation chemistries. Both modalities rely on the conjugation to reactive cysteines, but differ in the number and location of the reactive cysteines on the mAb. Batch and fed-batch conjugation kinetics are generated across a broad range of initial mAb concentrations and drug excess. Time-course samples are analyzed using a widely employed and easily implemented reducing reversed phase ultrahigh performance liquid chromatography (RP-UHPLC) method that separates the conjugated mAb into its respective subunits prior to analysis, thereby producing well-resolved chromatograms that illustrate conjugation state of heavy and light chains. Consequently, the kinetic data represents the conjugation trajectories of heavy and light chains. Due to the different quantities of reacting species in the two modalities, multiple kinetic model candidates are proposed and the optimal number of kinetic rates for each model type is chosen based on multiple criteria: parameter identifiability, parameter uncertainty and prediction errors. In addition, absorbance measurements are conducted to determine the stability of each payload in conjugation buffer. Ultimately, an in silico screening is performed accounting for the effects of reactant concentration and exemplifying the usage for process optimization.
2 Materials and methods
2.1 Experimental conjugation kinetic studies
The kinetic datasets encompass two distinct ADC modalities. The datasets 1 and 2 use an engineered IgG1 mAb—ADC1—with two inserted cysteines in the hinge region for a site-specific “DAR 2” conjugation to engineered cysteines. The datasets 3 and 4 use two different IgG1 mAbs—ADC2 and ADC3—for a “DAR 8” conjugation to reduced cysteines that are usually engaged in interchain disulfide bonds. Table 1 summarizes molecules and conjugation conditions. Datasets 1, 2 and 4 were generated at AstraZeneca and dataset 3 at Karlsruhe Institute of Technology (KIT). Minor differences due to different raw materials in chemicals and analytical devices are expected.
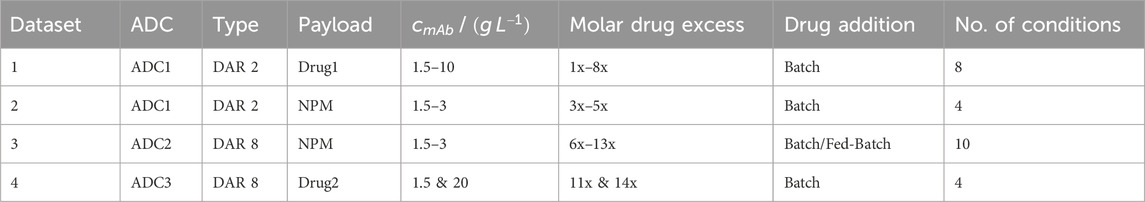
Table 1. Summary of experimental conditions of all conjugation runs using different ADC modalities and payloads. A detailed overview for the individual experiments is given in the Supplementary Material.
2.1.1 Chemicals, ADCs and functionalization steps
For DAR 2 conjugation of ADC1, the antibody was initially fully reduced through treatment with tris (2-carboxyethyl) phosphine hydrochloride (TCEP, EMD Millipore), followed by a buffer exchange using Vivaspin 20 (30 kDa MWCO, Cytiva) and a re-oxidation of the interchain disulfides with (L)-dehydroascorbic acid (DHAA, Sigma-Aldrich). Conjugation was performed using a maleimide-functionalized payload. Two payloads were compared for ADC1, a cytotoxic payload (“Drug1”) and a nontoxic surrogate N-(1-pyrenyl)-maleimide (NPM, Merck KGaA). For DAR 8 conjugation of ADC2 and ADC3, a full reduction of the interchain disulfides with TCEP was performed. Conjugation for ADC2 was carried out with NPM, while for ADC3 another cytotoxic payload (“Drug2”) was used. For reaction quenching, N-acetyl cysteine (NAC, Merck KGaA) was used. All payloads were dissolved in DMSO (Sigma-Aldrich). All other solutions were prepared with 20 mM sodium phosphate buffer (J.T. Baker), 1 mM EDTA (EMD Millipore), pH 7.0. For sample pretreatment for DAR analysis, samples were diluted with denaturing buffer containing guanidine HCl (Thermo Fisher), Tris (Thermo Fisher), EDTA (EMD Millipore) at pH 7.6 and reduced with dithiothreitol (DTT, Thermo Fisher). For the sample analysis, a RP-UHPLC (Agilent Technologies) with acetonitrile (VWR) and HPLC water (VWR) with 0.1% (v/v) trifluoroacetic acid (Thermo Scientific) as mobile phases were used.
2.1.2 Conjugation kinetics
For site-specific DAR 2 conjugation (ADC1), the antibody was initially treated with the reducing agent TCEP, which reduces both the engineered inserted cysteine residues, as well as cysteines engaged in interchain disulfide bonds. The reducing agent was subsequently removed and the buffer was exchanged, before the antibody was mildly re-oxidized with DHAA which allows re-formation of interchain disulfide bonds, leaving only the two inserted cysteines available for conjugation. DAR 2 conjugation were performed by adding either Drug1 or NPM solution to the re-oxidized mAb solution in a microcentrifuge tube at 1 mL scale. Selected conditions were performed in duplicates. For conjugation to reduced interchain disulfides, the native mAb was completely reduced. In the DAR 8 conjugations of ADC2 ten out of thirteen kinetics were performed in fed-batch mode, where drug solution was continuously added to resolve the fast time-course of the individual reacting species. These reactions were performed in centrifuge tubes at a liquid volume of 4 mL and the required volume of payload solution was constantly added with a syringe pump (Nemesys S, Cetoni GmbH) over a defined period of time (10, 20 or 30 min) to the stirred reaction solution. The remaining batch conjugations were performed at 1 mL scale. For ADC3, batch conjugation and another payload (Drug2) were used. An overview of the experimental conditions for the conjugation kinetics is given in Table 1. A detailed overview of all experimental conditions is given in Supplementary Table S1. To acquire conjugation kinetics, samples were taken at discrete time points over the course of 1 h, transferred to a microcentrifuge tube and immediately quenched by adding a 12x molar excess over payload of NAC solution to terminate the conjugation reaction.
2.1.3 Sample treatment and reference analytics
To determine the DAR and the DLD of each sample a reducing RP method was used. A sample treatment was conducted to reduce the conjugated ADC molecule into heavy and light chains. Sample concentrations were adjusted to 1 mg/mL using ultrapure water. Samples were then mixed with denaturing buffer and DTT solution before incubating over 30 min at 37°C on an orbital shaker (650 rpm). For the RP-UHPLC analysis, 10 µL of sample were injected onto a BioResolve RP mAb polyphenyl column (2.1*150 mm, 2.7 µm, Waters Corporation). An identical method, including flow rate, gradient combination and buffer compositions, was used at AZ and KIT, as described previously (Cao et al., 2019). The peak areas in the resulting chromatograms were manually determined. The molar concentrations of the corresponding conjugated and unconjugated heavy or light chains were calculated by normalizing the peak area of light/heavy chain to the respective concentration in the reaction.
2.1.4 Payload depletion study
As the inactivation of the used surrogate NPM was reported in a previous study (Andris et al., 2019), a depletion study for each of the tested payloads was conducted in order to determine the individual stability in conjugation buffer. For that purpose, DMSO-dissolved payload solution was added to conjugation buffer reaching a payload concentration of 0.1 mM and 10% DMSO in a 1.5 mL microcentrifuge tube. The solution was allowed to mix on a tube rotator. Samples were taken over the course of 1 h and the absorbance was measured using the UV/Vis function on the Stunner light scattering instrument (Unchained Labs). For NPM, the course of the absorbance was directly measured in a cuvette using a spectrophotometer (Spectrostar Nano, BMG Labtech). To verify the model assumption that depleted payload becomes unreactive for conjugation, the payloads NPM and Drug1 were separately dissolved in conjugation buffer (10% DMSO, 0.1 mM) and mixed for 1 h on a tube rotator instead of using it immediately for conjugation.
2.2 Conjugation kinetic model development
2.2.1 Modeling reduced conjugation kinetics and reaction schemes
Due to the sample treatment, which reduces the mAb in each sample and consequently eliminates information about the intact ADC species, the kinetic models employed in this study describe the conjugation reaction to the individual mAb chains. For the DAR 2 mAb, only conjugation to heavy chain was observed. This is expected, as the inserted cysteine residues are located in the hinge region of the heavy chain. In contrast, for DAR 8, conjugation to both heavy and light chain was observed as expected for stochastic conjugation. Given the absence of analytical data to resolve positional isomers, iso-reactivity for different binding locations on the heavy chain was assumed. These constraints narrow the possible rate equations down to consecutive reactions schemes describing the heavy chain as a “black box” with a certain number of available binding sites and exclude parallel schemes. The primary conjugation sites for the two ADC types with an overview of the assumed kinetic models are illustrated in Figure 1.
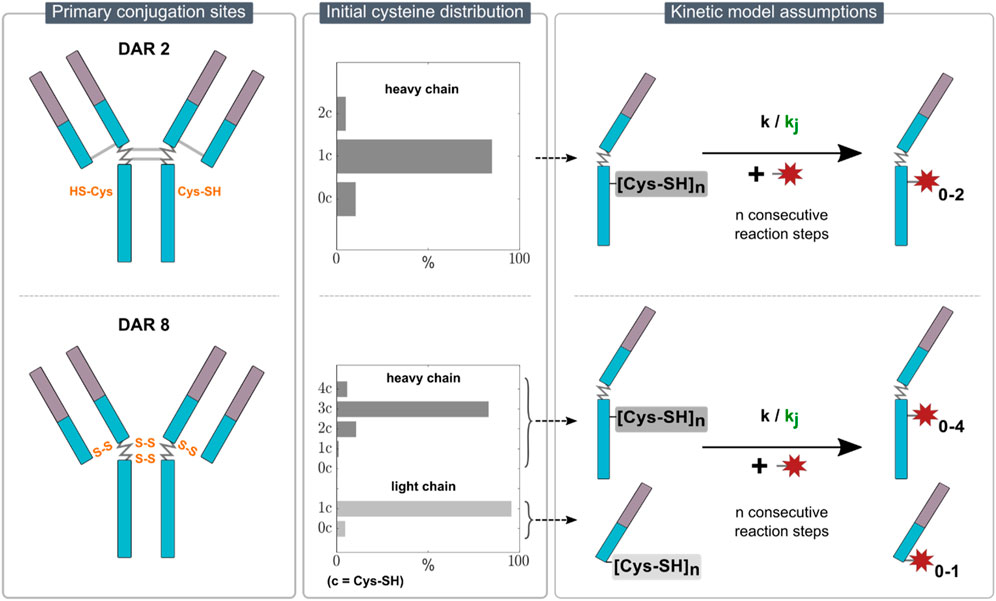
Figure 1. Overview of the kinetic model assumptions for DAR 2 (top row) and DAR 8 (bottom row) conjugation. The left panel illustrates the primary conjugation sites for each ADC in orange. The middle panel indicates the initial cysteine distribution for each ADC. The right panel presents the proposed stepwise conjugation reaction schemes of the payload to n reactive thiols on either light/heavy chain with either one kinetic rate (simple model) or j kinetic rates (detailed model) for each ADC.
2.2.1.1 Initial cysteine distribution
To align with the observed DLD at the end of the reaction, i.e., the ratio of differently conjugated heavy and light chains, an ADC-specific initial reactive cysteine distribution of the starting mAb material was set prior parameter estimation. With regards to the DAR 2 conjugation, the main product in the final DLD is H1 (heavy chain +1 drug). To model the amounts of unconjugated and over-conjugated heavy chains, H0 and H2, respectively, we assumed an initial cysteine distribution of heavy chains with zero, one and two reactive cysteines, namely,
2.2.1.2 Rate equations
For the conjugation reaction in a perfectly mixed system with continuous drug addition over a fixed period, the dilution rate due to added drug solution has to be considered. Therefore, the rate equation for a reaction species i can be expressed as:
where
To account for the sampling at discrete time points, the equation is integrated until each sampling time point and the volume is subtracted by the sample volume. In case of a batch conjugation reaction, Eq. 1 simplifies to Eq. 3:
To describe the reaction rates, some assumptions were made: conjugation refers to the second-order reaction of the maleimide of a functionalized payload with the sulfhydryl residue (SH-group) of a reactive cysteine. The reaction was assumed to be irreversible as no de-conjugation was observed and temperature effects on the conjugation kinetic were neglected as the temperature did not show noticeable effects on the kinetics. Moreover, a payload-specific depletion rate
Here,
2.2.1.3 Payload depletion rate
Initially, the estimation of the model parameter
2.2.2 Data handling
All runs for one mAb and one payload were summarized as a kinetic dataset resulting in four distinct datasets as outlined in Table 1. All replicate kinetics were averaged. The dataset involving Drug1 was used as the basis for DAR 2 model candidate selection. A manual split in six training and two test runs was done. The dataset with NPM was used for external model re-calibration to compare the conjugation kinetic rates of the payloads.
In the case of DAR 8, two individual datasets were available: The first one comprised fed-batch and batch kinetics of ADC2 with the surrogate drug NPM and was utilized for DAR 8 model candidate selection. Similarly, a manual split in ten training and three test runs was performed. The second external dataset, containing batch kinetics of ADC3 and Drug2, was later used for the in silico screening. A detailed overview of all runs and the train/test split is provided in the Supplementary Table S1.
As explained above, a sufficient drug excess, such as 3x for DAR 2 and 11x for DAR 8, resulted in a saturation of both the DAR and the DLD at the steady state of the conjugation reaction. Lowering the drug excess led to lower DAR value and changing DLD. The saturated DAR and DLD is assumed as being unique to every mAb and payload. With regards to the modeling assumptions, the average DLD of kinetics with sufficiently large drug excesses was considered to compute the initial cysteine distribution for each individual kinetic subset.
2.2.3 Parameter estimation
All simulations were performed in Matlab R2023a (The MathWorks Inc.). Maximum likelihood estimation of the kinetic rates in each model was conducted by minimizing the squared error between model predicted and experimental concentrations using the in-built lsqnonlin function. To account evenly for the entire concentration range, each run was normalized using a scaling factor corresponding to the maximum concentration in the respective run. Model predictions were performed based on the initial concentrations of the starting mAb, the initial cysteine distribution and payload concentration. The ODE system is numerically solved using the ode15s solver.
2.2.4 Model candidate selection criteria
The selection of the most appropriate kinetic model candidate was conducted based on various metrics, namely, the quality of the estimated parameters, parameter identifiability ranking and model errors regarding the cross-validation of the training data and the test set.
2.2.4.1 Uncertainty of the estimated parameters
The uncertainty of the estimated parameters was evaluated based on their statistical uncertainty. First, the parameter covariance matrix
with Eq. 12
where
Typically, parameter estimates can be considered reasonable, when the parameter standard deviations values is below 25% relative to the parameter estimate (Sin et al., 2016). The confidence intervals of the parameters were estimated using nlparci in Matlab.
2.2.4.2 Parameter identifiability analysis
Local sensitivity analysis employing the one factor at a time (OAT) method was conducted in accordance to Sin et al. (2009). In this method, each model parameter, i.e., the kinetic rates, is systematically varied holding others constant, and the resulting impact on the model’s output is observed. In practice, sensitivities for each model parameter are calculated using the first-order derivative of the model output with respect to the parameter. For each parameter, the derivatives are determined numerically by perturbing the parameter of interest by 10% of its nominal value. The sensitivities are then averaged over time and relative sensitivities
By computing the square root of the mean of all sensitivities over all runs, the parameter significance values were calculated according to Eq. 15:
Summing up all significance values returns the
2.2.4.3 Model error
The estimated kinetic rates were then used to predict the kinetic and the resulting model error regarding the species i was evaluated using the root mean squared error
where
2.2.5 In-silico screening for influence of initial mAb and payload concentrations
An in silico screening was conducted for the calibrated DAR 8 kinetic model (ADC3 + Drug2) in order to observe the model output at variable initial concentrations of mAb and payload. The model outputs were the final DAR and the concentration of unreacted payload after a reaction time of 30 min as well as the necessary reaction time to reach the final DAR below a threshold of 1%. A systematic screening with regards to the three model outputs was done by independently varying the initial mAb concentration between 1.5 and 10 g/L and the drug excess between 5 and 14 M excess while keeping the other constant.
3 Results
First, the UV/Vis measurements for the different payloads and the determination of the payload depletion rates are presented. Second, the bulk of this work demonstrates the selection of suitable conjugation kinetics models. Additionally, the established kinetic models are assessed regarding their ability to predict experimental kinetics for DAR 2 and 8 with high accuracy. An additional test study was conducted to evaluate the model’s capability for in silico screening using the DAR 8 model as example.
3.1 Payload depletion
The course of the normalized absorbance for the three payloads is shown in Figure 2. For NPM, a rapid decrease in absorbance is visible within 1 h, accompanied by larger error bars, whereas Drug1 exhibits only a minor decrease, and no remarkable change is visible for Drug2. The conjugation experiments using either NPM or Drug1 which was previously hold in conjugation buffer for 1 h, showed that for NPM the achieved DAR is strongly reduced as opposed to Drug1 which still reaches a typical DAR value in the range of 1.8–1.9 (see Supplementary Figure S1). Since the exact mechanism of the payload depletion is unknown, a first-order reaction was assumed to describe the depletion of NPM and Drug1, similar to Pfister et al. (2015). The depletion rate for NPM could be approximated by plotting the natural logarithm of the absorbance over time (cf. Supplementary Figure S2). Hereby, a depletion rate of
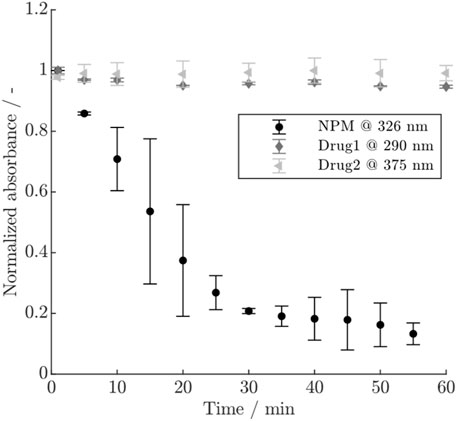
Figure 2. Normalized absorbance for the three payloads NPM, Drug1 and Drug2 at different wavelengths over time. The error bars indicate the standard deviation of the duplicate measurements.
3.2 Model complexity evaluation
Two types of kinetic models with varying complexity, namely, simple and detailed, for either DAR 2 or DAR 8 conjugation kinetics were evaluated with regards to the parameter importance (assessed through the parameter identifiability analysis), parameter confidence and model error. The entire set of estimated parameters including their standard deviation and confidence intervals as well as model error are listed in Table 2.
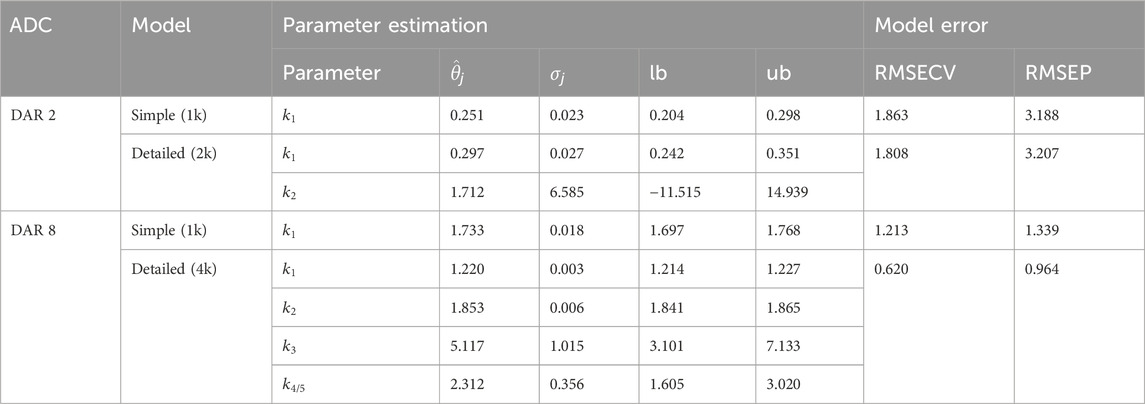
Table 2. Results of the parameter estimation for the kinetic model candidates for either DAR 2 or DAR 8 conjugation. Parameter estimation include parameter estimate
For DAR 2, the difference between the two models is the addition of a second rate to account for an independent second conjugation step. The rate
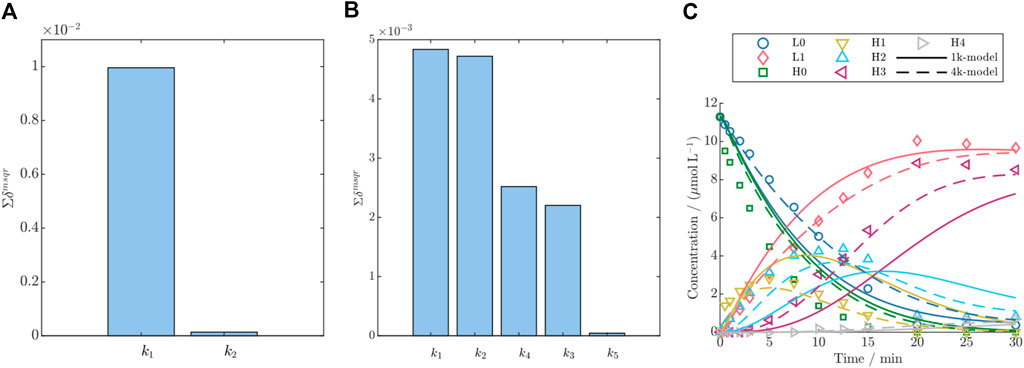
Figure 3. Parameter importance ranking according to the summed significance
With respect to the DAR 8 model, initially a model with five conjugation rates accounting for each conjugation step were used. The parameter importance ranking demonstrated that the last conjugation rate
3.3 Modeling site-specific DAR 2 conjugation kinetics
3.3.1 Batch conjugation kinetic
The dynamic behavior of the DAR 2 kinetics under various starting conditions in comparison with the predictions from the established kinetic model is depicted for the six training runs in Figure 4 (test runs are given in the Supplementary Figure S3). The experimental kinetics show a decrease in the concentration of H0 over time concurrent with the formation of H1 and H2. This trend intensifies with increasing drug excess and mAb concentration. The species H2 generally exhibits very low concentrations. Notably, the distribution of the final species depends on the drug excess. Below a drug excess of 3x, the final concentration of H0 diminishes, while H1 increases proportionally with increasing drug excess, as can be observed for the kinetics in the top row (Figures 4A–C). For a drug excess of 3x or higher (Figures 4C–F), the final composition remains consistent, which is also characterized by reaching a constant DAR plateau (see Supplementary Figure S4). This final DLD contains mainly 84% H1 on average and lower quantities of H0 and H2 at 11% and 5%, respectively. In general, the model accurately predicts the course of the reacting species, exhibiting a minor deviation only during the initial dynamic stage of the reaction. In contrast, the model precisely captures the steady state of each reaction. Overall, the averaged R2 values over both the training and test set for H0, H1, and H2 were 95.6%, 98.4%, and 71.1%, respectively.
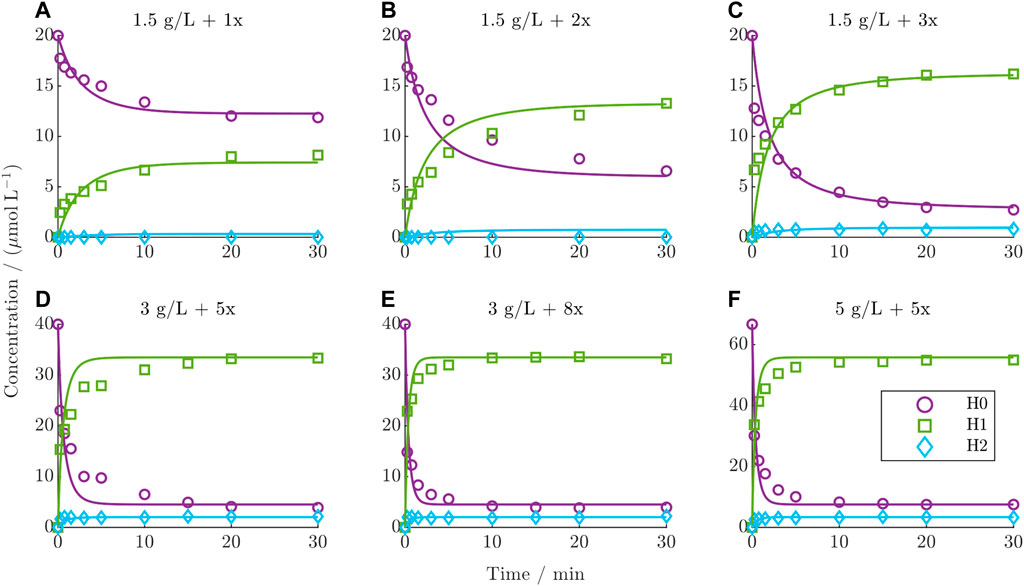
Figure 4. Comparison of DAR 2 model predictions vs experimental data for the six training runs using ADC1 + Drug1. (A–F) The mAb concentration and drug excess is shown in each title.
3.3.2 Influence of different payloads
A model re-calibration on the NPM dataset yielded comparable model accuracy with averaged R2 values of 93.1%, 94.4% and 86.1% for H0, H1, and H2, respectively. Despite the higher depletion rate of NPM, the kinetics revealed a faster conjugation compared to Drug1 under identical initial conditions, as demonstrated for one condition in Figure 5 (all NPM kinetics are provided in Supplementary Figure S5). This comparison shows that NPM reaches the steady-state more rapidly compared to the other payload, while the distribution of the final species is comparable. The observation was quantified through a comparison of the estimated conjugation rate of the two payloads with
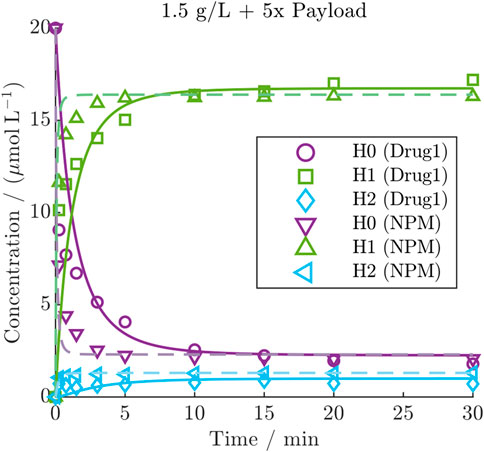
Figure 5. Comparison of DAR 2 kinetic with Drug1 or NPM under the same initial condition including the model predictions of the calibrated kinetic models as lines (solid line: Drug1, dashed line: NPM).
3.4 Modeling interchain-cysteine conjugation kinetics
3.4.1 DAR 8 batch and fed-batch conjugation
The ability of the established model to predict both DAR 8 fed-batch and batch conjugation reactions for the identical ADC was investigated in more detail. The results of three representative kinetics are presented in Figure 6 (all kinetics are given in the Supplementary Figures S6 and S7). Compared to experimental batch runs, the data from the fed-batch demonstrates that this drug addition mode results in remarkably slower reaction rates for the individual species within the initial time period of 15 min. This helps resolve the trajectories of each of the reacting species. In contrast, the samples from the batch kinetic exhibit complete conjugation already for the first time point. Furthermore, the comparison of the final steady states of all runs with a drug excess greater than 8x, suggests that a constant final species distribution is reached, as also characterized by reaching a DAR plateau (shown in Supplementary Figure S8). This distribution is characterized by L1 and H3 as the main species, with an average of 96% L1 (from total light chain) and 84% H3 (from total heavy chain). The minor species were L0, H0, H1, H2 and H4 with an average of 4% L0 and 0.01% H0, 0.5% H1, 9% H2 and 6% H4. The utilization of lower drug excesses, such as 6x, does not lead to full conjugation as can be seen in Figure 6C. Generally, the kinetic model is able to predict the kinetics of L0, L1, H0, and H3 with high run-averaged R2 values of 0.97, 0.96, 0.98, and 0.93, respectively. However, it exhibits slightly lower run-averaged R2 values of 0.86, 0.76, and 0.86 for predicting the kinetics of H1, H2, and H4, respectively, across all runs. This indicates a minor discrepancy between model predictions and experimental data for the species H1, H2, and H4. The predictions for all runs are provided in the Supplementary Figures S5 and S6. The estimated kinetic rates for the DAR 8 conjugation of NPM range from approx. 1.2 to 5.1
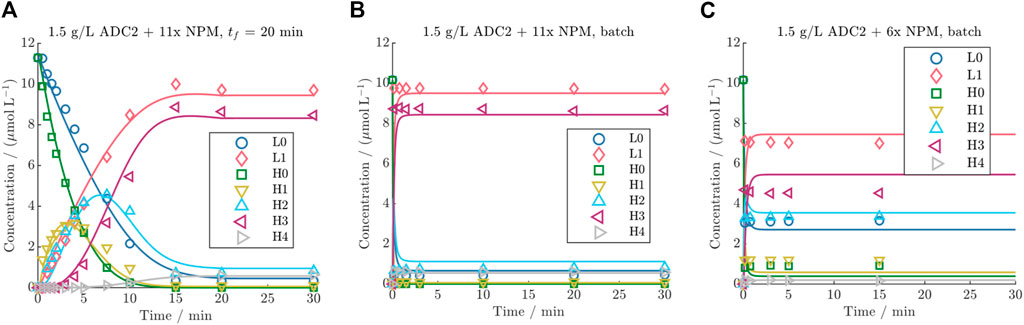
Figure 6. Comparison of DAR 8 model predictions vs experimental data for ADC2 at a mAb concentration of 1.5 g/L for (A) a fed-batch run with 20 min drug feeding time and 11x NPM, and two batch runs with (B) 11x NPM and (C) 6x NPM.
3.4.2 In-silico screening for influence of initial mAb and payload concentrations
The selected DAR 8 model was first calibrated to the dataset for ADC3 + Drug2 resulting in similar kinetic rates and model fit with an R2 of 0.99 averaged for all species (cf. Supplementary Figure S9). Afterwards, this model was employed for the in silico screening for DAR, free unconjugated payload, and reaction time. The results of this screening are depicted in Figure 7 for the three outputs. Figure 7A illustrates a rapid increase in DAR with escalating drug excess, independent of the mAb concentration, reaching a saturated DAR plateau at approximately 7.7x drug excess. The concentration of unconjugated payload (Figure 7B) remains at zero during the concentration range at which the DAR was found to increase, and exhibits a linear rise dependent on both variables as soon as the DAR saturation is reached. The required reaction time to achieve the final DAR (Figure 7C) begins with short reaction time of approximately 50 s, increasing with higher drug excess and decreasing mAb concentration to a maximum reaction time of 350 s. Subsequently, it decreases depending on both variables to reaction times at around 50 s.
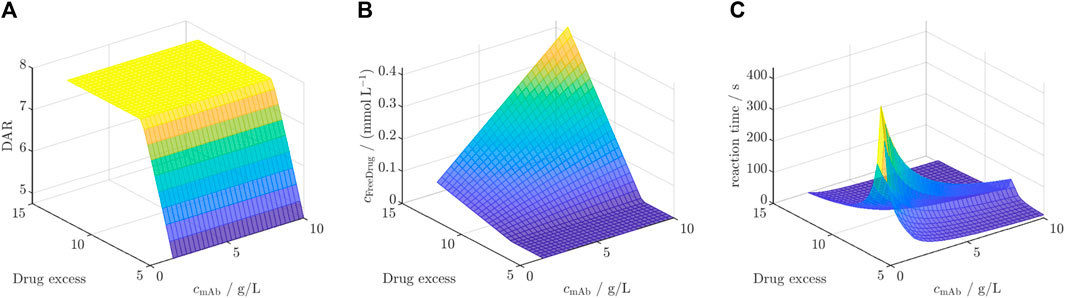
Figure 7. Results of the in silico screening for (A) DAR, (B) free unconjugated payload and (C) reaction time for varying initial mAb concentration
4 Discussion
4.1 Kinetic model development
4.1.1 Importance of payload depletion rate
Additional measurements to determine the payload depletion rates were necessary due to relatively high parameter uncertainties and strong correlation coefficients with the kinetic rates in models with the depletion rate as parameter to be estimated. The difference in the decrease of the UV/Vis signal for the three payloads, as observed in Figure 2, suggests that Drug1 and Drug2 are stable in conjugation buffer over the time studied here, whereas NPM becomes rapidly unavailable for participation in the reaction. Conjugations using pre-mixed NPM or Drug1 in conjugation buffer proved that NPM becomes largely unreactive within typical reaction time (1 h) as opposed to Drug1. This observation is in agreement with Andris et al. (2019), who postulate that the depletion of NPM is due to unspecific adsorption to the vessels walls or chemical inactivation. In other studies, it has been similarly proven that polycyclic aromatic hydrocarbons, such as pyrene, show high affinity to plastic in water due to chemisorption and hydrophobic interactions (Fung et al., 2023). NPM may also slowly precipitate due to its low water solubility. The involvement of multiple possible phenomena may result in the larger error bars as observed for the duplicates. For Drug1, a minor inactivation was apparent from a slight decrease of the UV/Vis signal and since the model performance was improved by the addition of a slow depletion rate. In summary, this demonstrates the need for investigating the payload behavior and stability as well as highlights the difference in depletion between the two real drugs, Drug1 and Drug2, and NPM.
4.1.2 Model complexity evaluation for DAR 2 and DAR 8
For both conjugation model groups, DAR 2 and DAR 8, the parameter that exclusively accounts for the last conjugation step, had almost zero effect on the model output as shown by low parameter importance values (cf. Figure 3). This can be attributed to the consecutive reaction pathway coupled with the fact that the highest conjugated species are a low-concentrated product formed as the last species during the reaction. For instance, for DAR 2 the rate
Especially when applied to model DAR 8 fed-batch conjugation, the detailed model demonstrates enhanced accuracy compared to the simple model, as depicted in Figure 3C, and supported by the reduction in
4.2 Insights from DAR 2 conjugationmodeling
4.2.1 Modeling accuracy and analytical challenges
As shown in Figure 4, the DAR 2 model was able to model the trajectories of the heavy chains accurately, especially for H0 and H1 with R2 values above 93%. Only the species H2 is not precisely modeled, which can be attributed to its high analytical variance owing to poor HPLC resolution of this species. It was reported that this over-conjugation is located at non-reformed disulfide bond between heavy and light chain (Cao et al., 2019). The herein established model, however, does not enable derivation of additional information about this phenomenon as this species makes up a low percentage of the total mixture, thus causing a small impact on the model predictions. Notably, the transient behavior of the distribution of the final species for varying drug excess is also captured by the model. The observation that a consistent composition is reached with around 3x drug excess, despite a stoichiometric requirement of 2x drug excess for the number of binding sites, further exemplifies the occurring payload depletion for Drug1. Additionally, the model showed a systematic discrepancy in the initial stage of the reaction. According to Andris et al. (2019), the sequential conjugation in the hinge region results in a step-wise increase in the conjugation rate due to an increase in hydrophobicity in this region. In contrast, the herein established heavy chain model lumps this phenomenon in one single rate (
4.2.2 Conjugation rates difference for the utilized payloads
Calibrating the model on the two datasets using either Drug1 or NPM could show that the conjugation kinetic rate for NPM is approximately 20 times higher than for Drug1 (see Figure 5). This difference may be rather related to molecular size than hydrophobicity, as NPM has a molecular mass that is approximately five times lower than Drug1 and both drugs exhibited a similar elution time in the RP (data not shown). Pfister et al. (2015) demonstrated differences in conjugation rate depending on the size of the conjugated molecule, in the case of conjugation of PEG to lysozyme which was described using a core-shell model. In our case, the finding highlights the inequality of two payloads with regards to their conjugation kinetic rate in addition to the said difference in their depletion.
4.3 Insights from DAR 8 conjugationmodeling
4.3.1 Modeling accuracy and exploring drug excess thresholds
The experimental data revealed that there is a drug excess threshold between 8–11x in which a consistent DLD is achieved. Using a drug excess larger than 8x did not alter the percentages in the final DLD or led to higher DAR values (cf. Supplementary Figure S8), which suggest that a critical point is reached beyond which further increases in the drug excess does not result in a higher DAR. Drug excesses below this point (e.g., 6x, see Figure 6C), lead to not reaching full conjugation which is exemplified in the lower percentages of L1 and H3 in the steady-state. Because NPM was found to simultaneously deplete in the solution, this suggests that some payloads require a drug excess higher than the stoichiometric molar quantity of binding sites to achieve full conjugation. Furthermore, the species distribution in the final steady states remained relatively constant, primarily related to the constant reduction conditions within this kinetic subset. The lower percentages of L0, H0, H1, and H2 likely originate from partially reduced species, with fewer interchain disulfides. In the literature, comparable DLDs were reported with these low levels of under-conjugated species (Källsten et al., 2018; Jones et al., 2020), and it was noted that achieving full conjugation is challenging due to the relatively low concentration of reactants (Li et al., 2020). The presence of low percentages of H4 is unique to the herein utilized IgG1 and is likely to be attributed to the said “mis-alkylation” of the payload (Paulech et al., 2013).
4.3.2 Feeding mode comparison
The utilization of fed-batch runs lowered the conjugation rates enabling the elucidation of the reaction mechanism (see Figures 6A,B). Feeding times of 10 min or longer yielded satisfactory analytical resolution of the individual species. The model exhibited slightly lower accuracy for the species H0, H1, H2, and H4, which can be primarily associated to their higher analytical error due to lower concentration ranges. The batch runs emphasized that DAR 8 conjugation reactions are notably faster than DAR 2, with a time-scale of only a few minutes, compared to 5–10 min for DAR 2 reaction. Hereby it became also evident that the utilization of the complex (4k) model and the precise determination of the conjugation rates are only required when modeling fed-batch conjugation reaction. As expected, the model’s performance is primarily affected by the initial cysteine distribution when being applied for the batch reaction, as this defines the steady state of the reaction. Using the simple (1k) DAR 8 model for the prediction of the ADC3 batch kinetics yielded an identical average R2 of 0.99 as the detailed (4k) model. This highlights the importance of accurately determining the initial cysteine distribution for the model precision, when applying the model to batch kinetics.
4.3.3 Model adaptability
Moreover, it was demonstrated that the estimated kinetic rates for the same payload molecule are comparable among different ADC types in our study. This suggests the potential adaptability of the utilized modeling approach across different modalities and its potential for transfer to diverse conjugation kinetics without the necessity of prior calibration.
4.3.4 In-silico screening for enhanced reaction understanding
The observed behavior in the screening for ADC3 + Drug2 reveals significant insights into the interplay of initial mAb concentration and drug excess on the studied key model outputs, as shown in Figure 7. The rapid increase in DAR until a plateau with increasing drug excess, independent of mAb concentration, aligns with the already observed saturation effect. The saturation is independent from the initial mAb concentration as the initial mAb concentration only defines the time point at which the DAR is reached. Notably, the achieved saturated DAR is achieved once the stoichiometric molar drug ratio to mAb is utilized, as Drug2 did not show to deplete and, thus, being complete available for conjugation. Similar results were reported for the DAR 2 reaction for the DAR saturation (Andris et al., 2019). The linear increase in unconjugated payload concentration beyond the DAR plateau phase suggests that, once the saturation point is reached, excess drug molecules remain unbound and contribute to the free payload concentration. Regarding the reaction time, the initial rapid increase is due to the increasing saturation DAR value below the critical drug excess of 7.7x, which requires prolonged reaction times. The maximum reaction times, aligning with DAR saturation, is achieved at low mAb concentration due to slower conjugation rates. After the DAR is saturated, both initial mAb concentration and drug excess lead to faster conjugation rates which corresponds to shorter reaction times. Overall, these findings highlight the benefit of being able to forecast the reaction behavior for various process parameters. Overall, this screening showcases the benefit of a kinetic model due to additional insights into the reaction kinetics and the reaction time-scales which is crucial for optimization of operating conditions. Especially, the knowledge of the optimal drug excess is highly useful since payloads are costly and free payload requires subsequent filtration steps in order to ensure product safety (Fernandez-Cerezo et al., 2023).
5 Conclusion
In this study, we developed a kinetic modeling methodology that can accurately predict both site-specific conjugations (DAR 2), and conjugations to reduced interchain disulfide bonds (DAR 8) of various payloads. A readily available RP-UHPLC method was used to acquire the kinetic data. For the kinetic model development, we covered multiple facets: First, UV/Vis measurements were performed to determine the payload stability in conjugation buffer alone. Secondly, different kinetic model candidates for the two modalities were formulated and selected. Fed-batch experiments proved to be crucial in resolving the rapid conjugation kinetics in the case of interchain disulfide conjugation. Thirdly, the kinetic model was applied to external datasets containing other payloads. A key outcome was the confirmation of major differences in both the conjugation rates and the stability of the tested pseudo and real payloads. Modeling DAR 2 and DAR 8 conjugation with the same payload demonstrated comparable rates, while for DAR 8 conjugation varying conjugation rates became apparent for the sequential conjugation steps. Following this, the calibrated DAR 8 kinetic model was used for an exemplary in silico screening to study the reaction behavior across a range of initial conditions. Overall, these results emphasize that this kinetic model framework is highly valuable for augmenting experimental studies, providing enhanced process understanding and optimizing the conjugation process. This approach not only complements traditional DoE methodologies but also addresses the inherent gap in DoE by offering mechanistic insights of the conjugation process, thereby accelerating process development. In future, it could be extended with other relevant influencing factors, such as pH or salt effects, or tested on other conjugation chemistries.
Data availability statement
The raw data supporting the conclusion of this article will be made available by the authors, without undue reservation.
Author contributions
JW: Conceptualization, Data curation, Formal Analysis, Investigation, Methodology, Software, Visualization, Writing–original draft, Writing–review and editing. RB: Data curation, Investigation, Writing–review and editing, Formal Analysis. KH: Data curation, Formal Analysis, Investigation, Writing–review and editing. MW: Conceptualization, Funding acquisition, Project administration, Supervision, Writing–review and editing. JH: Conceptualization, Funding acquisition, Supervision, Writing–review and editing.
Funding
The author(s) declare that financial support was received for the research, authorship, and/or publication of this article. We acknowledge support by the KIT-publication fund of the Karlsruhe Institute of Technology.
Acknowledgments
The authors would like to thank Johanna Ossmann for performing the experimental work at KIT. Furthermore, we would like to thank Annabelle Dietrich and Robin Schiemer for careful proofreading of the manuscript.
Conflict of interest
Authors MW, RB and KH are employed by AstraZeneca and report stock ownership and/or stock options or interest in AstraZeneca.
The remaining authors declare that the research was conducted in the absence of any commercial or financial relationships that could be construed as a potential conflict of interest.
Publisher’s note
All claims expressed in this article are solely those of the authors and do not necessarily represent those of their affiliated organizations, or those of the publisher, the editors and the reviewers. Any product that may be evaluated in this article, or claim that may be made by its manufacturer, is not guaranteed or endorsed by the publisher.
Supplementary material
The Supplementary Material for this article can be found online at: https://www.frontiersin.org/articles/10.3389/fbioe.2024.1403644/full#supplementary-material
References
Abdollahpour-Alitappeh, M., Lotfinia, M., Gharibi, T., Mardaneh, J., Farhadihosseinabadi, B., Larki, P., et al. (2019). Antibody–drug conjugates (ADCs) for cancer therapy: strategies, challenges, and successes. J. Cell. Physiology 234 (5), 5628–5642. doi:10.1002/jcp.27419
Anane, E., López C, D. C., Barz, T., Sin, G., Gernaey, K. V., Neubauer, P., et al. (2019). Output uncertainty of dynamic growth models: effect of uncertain parameter estimates on model reliability. Biochem. Eng. J. Elsevier 150 (February), 107247. doi:10.1016/j.bej.2019.107247
Andris, S., Seidel, J., and Hubbuch, J. (2019). Kinetic reaction modeling for antibody-drug conjugate process development. J. Biotechnol. 306 (September), 71–80. doi:10.1016/j.jbiotec.2019.09.013
Andris, S., Wendeler, M., Wang, X., and Hubbuch, J. (2018). Multi-step high-throughput conjugation platform for the development of antibody-drug conjugates. J. Biotechnol. 278 (May), 48–55. doi:10.1016/j.jbiotec.2018.05.004
Anurag, S. R., and Winkle, H. (2009). Quality by design for biopharmaceuticals. Nat. Biotechnol. 27 (1), 26–34. doi:10.1038/nbt0109-26
Ashworth, I. W., Chan, L. C., Cox, B. G., McFarlane, I. M., and Phillips, A. R. (2019). Understanding the alkylation of a phenol by 1-(3-chloropropyl)pyrrolidine: evidence for the intermediacy of an azetidinium ion. J. Org. Chem. 84 (8), 4754–4762. doi:10.1021/acs.joc.8b02458
Babi, D. K., Griesbach, J., Hunt, S., Insaidoo, F., Roush, D., Todd, R., et al. (2022). Opportunities and challenges for model utilization in the biopharmaceutical industry: current versus future state. Curr. Opin. Chem. Eng. 36, 100813. doi:10.1016/j.coche.2022.100813
Cao, M., De Mel, N., Jiao, Y., Howard, J., Parthemore, C., Korman, S., et al. (2019). Site-specific antibody-drug conjugate heterogeneity characterization and heterogeneity root cause analysis. mAbs 11 (6), 1064–1076. doi:10.1080/19420862.2019.1624127
Chau, C. H., Steeg, P. S., and Figg, W. D. (2019). Antibody–drug conjugates for cancer. Lancet 394 (10200), 793–804. doi:10.1016/S0140-6736(19)31774-X
Dean, A. Q., Luo, S., Twomey, J. D., and Zhang, B. (2021). Targeting cancer with antibody-drug conjugates: promises and challenges. MAbs 13 (1), 1951427. doi:10.1080/19420862.2021.1951427
Fernandez-Cerezo, L., Holstein, M., Thirumalairajan, S., Romanini, D., Kos, P., Raglione, T., et al. (2023). Strategies for UF/DF-Based impurity removal in the post-conjugation purification of antibody-drug conjugates. Org. Process Res. Dev. 27 (7), 1258–1268. doi:10.1021/acs.oprd.3c00137
Fung, Y. H., Han, J., Tam, N. F. Y., Chen, J., Chan, S. M. N., Cheung, S. G., et al. (2023). Different sorption behaviours of pyrene onto polyethylene microplastics in a binary system with water and a ternary system with water and sediment. Environ. Technol. Innovation 30, 103086. doi:10.1016/j.eti.2023.103086
Hutchinson, M. H., Hendricks, R. S., Lin, X. X., and Olson, D. A. (2018). Process development and manufacturing of antibody-drug conjugates. Biopharm. Process. Dev. Des. Implement. Manuf. Process., 813–836. doi:10.1016/B978-0-08-100623-8.00041-4
Janin-Bussat, M.-C., Dillenbourg, M., Corvaia, N., Beck, A., and Klinguer-Hamour, C. (2015). Characterization of antibody drug conjugate positional isomers at cysteine residues by peptide mapping LC–MS analysis. J. Chromatogr. B 981–982, 9–13. doi:10.1016/j.jchromb.2014.12.017
Jones, J., Pack, L., Hunter, J. H., and Valliere-Douglass, J. F. (2020). Native size-exclusion chromatography-mass spectrometry: suitability for antibody–drug conjugate drug-to-antibody ratio quantitation across a range of chemotypes and drug-loading levels. mAbs 12 (1), 1682895. doi:10.1080/19420862.2019.1682895
Joubert, N., Beck, A., Dumontet, C., and Denevault-Sabourin, C. (2020). Antibody – drug conjugates: the last decade. Pharm. (Basel) 13, 245–331. doi:10.3390/ph13090245
Källsten, M., Hartmann, R., Artemenko, K., Lind, S. B., Lehmann, F., and Bergquist, J. (2018). Qualitative analysis of antibody-drug conjugates (ADCs): an experimental comparison of analytical techniques of cysteine-linked ADCs. Analyst. R. Soc. Chem. 143 (22), 5487–5496. doi:10.1039/c8an01178h
Kyriakopoulos, S., Ang, K. S., Lakshmanan, M., Huang, Z., Yoon, S., Gunawan, R., et al. (2018). Kinetic modeling of mammalian cell culture bioprocessing: the quest to advance biomanufacturing. Biotechnol. J. 13 (3), 1–11. doi:10.1002/biot.201700229
Li, K., Zhang, Z., Lin, Z., Shi, H., and Ma, Y. (2020). Accurate determination of drug-to-antibody ratio of interchain cysteine-linked antibody–drug conjugates by LC-HRMS. Anal. Bioanal. Chem. 412 (4), 833–840. doi:10.1007/s00216-019-02280-5
Mao, L., Russell, A. J., and Carmali, S. (2022). Moving protein PEGylation from an art to a data science. Bioconjugate Chem. 33 (9), 1643–1653. doi:10.1021/acs.bioconjchem.2c00262
Matsuda, Y., and Mendelsohn, B. A. (2021). An overview of process development for antibody-drug conjugates produced by chemical conjugation technology. Expert Opin. Biol. Ther. 21 (7), 963–975. doi:10.1080/14712598.2021.1846714
Matsuda, Y., Tawfiq, Z., Leung, M., and Mendelsohn, B. A. (2020). Insight into temperature dependency and design of experiments towards process development for cysteine-based antibody-drug conjugates. ChemistrySelect 5 (28), 8435–8439. doi:10.1002/slct.202001822
Montes, F. C. C., Gernaey, K., and Sin, G. (2018). Dynamic plantwide modeling, uncertainty, and sensitivity analysis of a pharmaceutical upstream synthesis: ibuprofen case study. Industrial Eng. Chem. Res. 57 (30), 10026–10037. doi:10.1021/acs.iecr.8b00465
Nakahara, Y., Mendelsohn, B. A., and Matsuda, Y. (2022). Antibody-drug conjugate synthesis using continuous flow microreactor technology. Org. Process Res. Dev. 26 (9), 2766–2770. doi:10.1021/acs.oprd.2c00217
Narayanan, H., Luna, M. F., von Stosch, M., Cruz Bournazou, M. N., Polotti, G., Morbidelli, M., et al. (2020). Bioprocessing in the digital age: the role of process models. Biotechnol. J. 15 (1), 1–10. doi:10.1002/biot.201900172
Nayak, S., and Richter, S. M. (2023). Kinetic studies of the partial reduction and conjugation reactions in an antibody-drug conjugate (ADC) synthesis. Org. Process Res. Devdoi 27 (11), 2091–2099. doi:10.1021/acs.oprd.3c00264
Panowski, S., Bhakta, S., Raab, H., Polakis, P., and Junutula, J. R. (2014). Site-specific antibody drug conjugates for cancer therapy. mAbs 6 (1), 34–45. doi:10.4161/mabs.27022
Paulech, J., Solis, N., and Cordwell, S. J. (2013). Characterization of reaction conditions providing rapid and specific cysteine alkylation for peptide-based mass spectrometry. Biochimica Biophysica Acta - Proteins Proteomics. Elsevier B.V. 1834 (1), 372–379. doi:10.1016/j.bbapap.2012.08.002
Pfister, D., Bourgeaux, E., and Morbidelli, M. (2015). Kinetic modeling of protein PEGylation. Chem. Eng. Sci. 137, 816–827. doi:10.1016/j.ces.2015.07.031
Pfister, D., Ulmer, N., Klaue, A., Ingold, O., and Morbidelli, M. (2016). Modeling the kinetics of protein conjugation reactions. Chemie-Ingenieur-Technik 88 (11), 1598–1608. doi:10.1002/cite.201600046
Ponziani, S., Di Vittorio, G., Pitari, G., Cimini, A. M., Ardini, M., Gentile, R., et al. (2020). Antibody-drug conjugates: the new frontier of chemotherapy. Int. J. Mol. Sci. 21 (15), 5510–5528. doi:10.3390/ijms21155510
Rodman, A. D., and Gerogiorgis, D. I. (2020). Parameter estimation and sensitivity analysis for dynamic modelling and simulation of beer fermentation. Comput. Chem. Eng. 136, 106665. doi:10.1016/j.compchemeng.2019.106665
Roush, D., Asthagiri, D., Babi, D. K., Benner, S., Bilodeau, C., Carta, G., et al. (2020). Toward in silico CMC: an industrial collaborative approach to model-based process development. Biotechnol. Bioeng. 117, 3986–4000. doi:10.1002/bit.27520
Schiemer, R., Weggen, J. T., Schmitt, K. M., and Hubbuch, J. (2023). An adaptive soft-sensor for advanced real-time monitoring of an antibody-drug conjugation reaction. Biotechnol. Bioeng. 120 (7), 1914–1928. doi:10.1002/bit.28428
Sin, G., and Gernaey, K. (2016). “Data handling and parameter estimation,” in Experimental methods in wastewater treatment. Editor C. M. van Loosdrecht (United Kingdom: IWA Publishing), 201–234.
Sin, G., Gernaey, K. V., and Lantz, A. E. (2009). Good modeling practice for PAT applications: propagation of input uncertainty and sensitivity analysis. Biotechnol. Prog. 25 (4), 1043–1053. doi:10.1002/btpr.166
Smith, N. J., Rohlfing, K., Sawicki, L. A., Kharkar, P. M., Boyd, S. J., Kloxin, A. M., et al. (2018). Fast, irreversible modification of cysteines through strain releasing conjugate additions of cyclopropenyl ketones. Org. Biomol. Chem. 16 (12), 2164–2169. doi:10.1039/c8ob00166a
Stump, B., and Steinmann, J. (2013). Conjugation process development and scale-up. Methods Mol. Biol. 1045, 235–248. doi:10.1007/978-1-62703-541-5_14
Tang, P., Tan, Z., Ehamparanathan, V., Ren, T., Hoffman, L., Du, C., et al. (2020). Optimization and kinetic modeling of interchain disulfide bond reoxidation of monoclonal antibodies in bioprocesses. mAbs 12 (1), 1829336. doi:10.1080/19420862.2020.1829336
Taylor, C. J., Pomberger, A., Felton, K. C., Grainger, R., Barecka, M., Chamberlain, T. W., et al. (2022). A brief introduction to chemical reaction optimization. Chem. Rev. 123, 3089–3126. doi:10.1021/acs.chemrev.2c00798
Vollmer, N. I., Driessen, J. L., Yamakawa, C. K., Gernaey, K. V., Mussatto, S. I., and Sin, G. (2022). Model development for the optimization of operational conditions of the pretreatment of wheat straw. Chem. Eng. J. Elsevier B.V. 430 (P4), 133106. doi:10.1016/j.cej.2021.133106
Keywords: antibody-drug conjugate (ADC), conjugation reaction, kinetic model, site-specific conjugation, interchain disulfide, cysteine-conjugates, payload
Citation: Weggen JT, Bean R, Hui K, Wendeler M and Hubbuch J (2024) Kinetic models towards an enhanced understanding of diverse ADC conjugation reactions. Front. Bioeng. Biotechnol. 12:1403644. doi: 10.3389/fbioe.2024.1403644
Received: 19 March 2024; Accepted: 07 June 2024;
Published: 11 July 2024.
Edited by:
Michel Eppink, Wageningen University and Research, NetherlandsReviewed by:
Angelica Meneses Acosta, Autonomous University of the State of Morelos, MexicoIris Luz Batalha, Institute for Bioengineering of Catalonia (IBEC), Spain
Copyright © 2024 Weggen, Bean, Hui, Wendeler and Hubbuch. This is an open-access article distributed under the terms of the Creative Commons Attribution License (CC BY). The use, distribution or reproduction in other forums is permitted, provided the original author(s) and the copyright owner(s) are credited and that the original publication in this journal is cited, in accordance with accepted academic practice. No use, distribution or reproduction is permitted which does not comply with these terms.
*Correspondence: Jürgen Hubbuch, anVlcmdlbi5odWJidWNoQGtpdC5lZHU=