 Xusheng Tang1,2
 Kunxiang Liu
 Bei Li
95% of researchers rate our articles as excellent or good
Learn more about the work of our research integrity team to safeguard the quality of each article we publish.
Find out more
REVIEW article
Front. Bioeng. Biotechnol. , 20 May 2024
Sec. Biosensors and Biomolecular Electronics
Volume 12 - 2024 | https://doi.org/10.3389/fbioe.2024.1389143
This article is part of the Research Topic Next Generation Bioanalysis by Microfluidics-Integrated Methods, Devices, and Systems View all 6 articles
Cells constitute the fundamental units of living organisms. Investigating individual differences at the single-cell level facilitates an understanding of cell differentiation, development, gene expression, and cellular characteristics, unveiling the underlying laws governing life activities in depth. In recent years, the integration of single-cell manipulation and recognition technologies into detection and sorting systems has emerged as a powerful tool for advancing single-cell research. Raman cell sorting technology has garnered attention owing to its non-labeling, non-destructive detection features and the capability to analyze samples containing water. In addition, this technology can provide live cells for subsequent genomics analysis and gene sequencing. This paper emphasizes the importance of single-cell research, describes the single-cell research methods that currently exist, including single-cell manipulation and single-cell identification techniques, and highlights the advantages of Raman spectroscopy in the field of single-cell analysis by comparing it with the fluorescence-activated cell sorting (FACS) technique. It describes various existing Raman cell sorting techniques and introduces their respective advantages and disadvantages. The above techniques were compared and analyzed, considering a variety of factors. The current bottlenecks include weak single-cell spontaneous Raman signals and the requirement for a prolonged total cell exposure time, significantly constraining Raman cell sorting technology’s detection speed, efficiency, and throughput. This paper provides an overview of current methods for enhancing weak spontaneous Raman signals and their associated advantages and disadvantages. Finally, the paper outlines the detailed information related to the Raman cell sorting technology mentioned in this paper and discusses the development trends and direction of Raman cell sorting.
A cell is the fundamental functional unit of life on earth, and the traditional study of cell populations often ignores the uniqueness of single cells (Eldar and Elowitz, 2010; Spiller et al., 2010). In cell populations, even among different single cells with identical genomic information, there is remarkable phenotypic divergence, termed “cellular functional heterogeneity.” This cellular heterogeneity emerges as a significant feature of cell populations (Ocasio et al., 2019; Mermans et al., 2023). Investigating the mechanisms at the single-cell level contributes to our understanding of cell differentiation and development (Lo Celso et al., 2009; Sun et al., 2021), gene expression characteristics, and cellular features (Cai et al., 2006; Zenobi, 2013). In addition, research at the single-cell level holds substantial significance for cancer treatment (Baslan and Hicks, 2017) and contributes to the progress of bioenergy development (Chattopadhyay and Maiti, 2021; Liu et al., 2021; Li et al., 2022).
In recent years, single-cell manipulation and single-cell recognition techniques have gradually become powerful tools for single-cell research. As shown in Figure 1, common single-cell manipulation techniques encompass micromanipulation (Fröhlich and König, 2000), laser capture microdissection (LCM) (Civita et al., 2019), microfluidics (Niculescu et al., 2021), laser-induced forward transfer (LIFT) (Serra and Piqué, 2019; Liang et al., 2022), and optical tweezers (Favre-Bulle et al., 2017; Blázquez-Castro, 2019). These techniques often necessitate a combination of recognition methods like fluorescence (Adan et al., 2017), magnetic beads (Surendran et al., 2021), and the Raman spectrum (Wagner, 2009; da Costa et al., 2019) to effectively realize the identification and sorting of single cells.
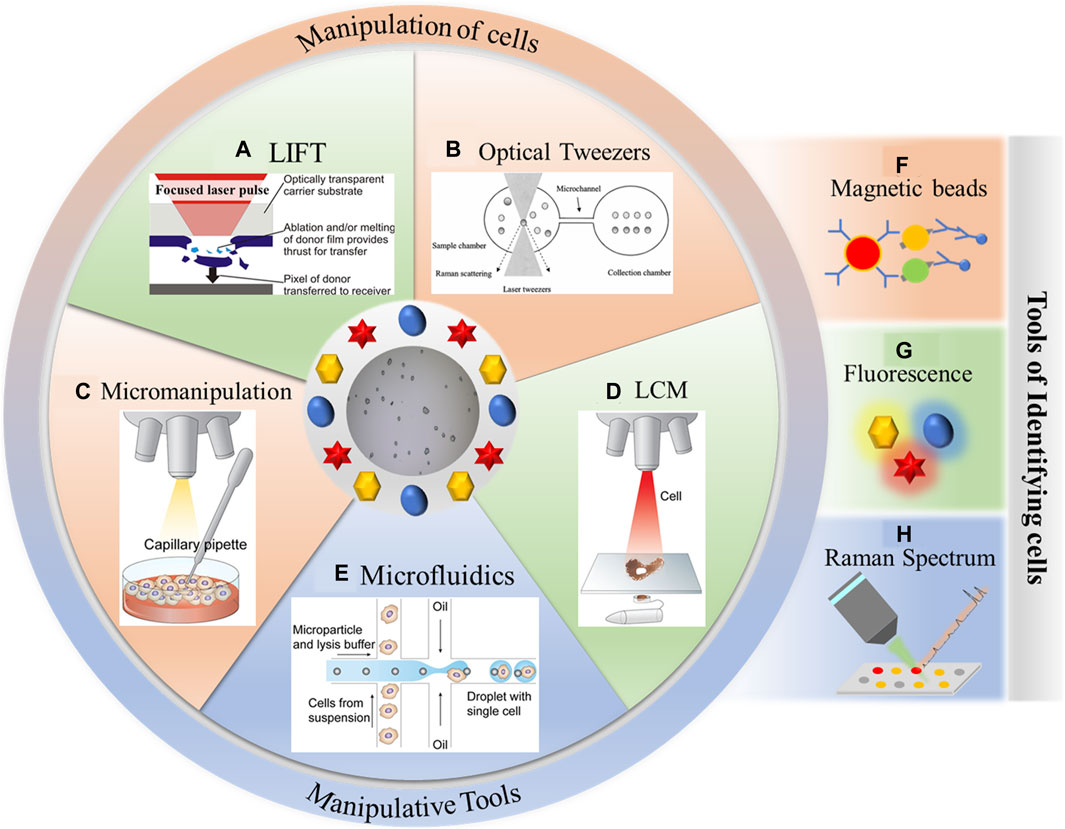
Figure 1. Single-cell manipulation and single-cell recognition techniques. (A) Laser-induced forward transfer, reproduced from Banks et al. (2009). (B) Optical tweezers, reproduced from Xie et al. (2005a). (C) Micromanipulation, reproduced from Hwang et al. (2018). (D) Laser capture microdissection, reproduced from Hwang et al. (2018). (E) Microfluidics, reproduced from Hwang et al. (2018). (F) Magnetic beads. (G) Fluorescence. (H) Raman spectrum.
Single-cell analysis has extensively relied on optical technologies. The 20th century witnessed the emergence of new techniques, such as flow cytometry and Raman spectroscopy, which opened up novel avenues for single-cell analysis (Laerum and Farsund, 1981; Puppels et al., 1990). Optical techniques, including flow cytometry and Raman spectroscopy, play crucial roles in single-cell identification and analysis methods. The integration of these methods with single-cell sorting techniques now constitutes one of the prevailing systems for single-cell detection and sorting.
Microbial flow cytometry boasts a rich history, with its initial application dating back to the late 1970s (Paau et al., 1977), focusing on the examination of physiological properties within individual cultures (Paau et al., 1977; Hutter and Eipel, 1979). This technique serves not only for cell counting but also for an extensive array of studies delving into the extraction of biological information through single-cell data. High-throughput detection of properties such as cell size, intracellular complexity, and macromolecular composition is feasible (Sieracki et al., 1999; Hatzenpichler et al., 2020; Singh and Barnard, 2021). The measurement of these phenotypic properties relies on the cell labeling technique used (Müller and Nebe-von-Caron, 2010; Hatzenpichler et al., 2020; Rubbens and Props, 2021). The technique also furnishes an optical description of individual cells based on scattered light or fluorescence signals. Figure 2 provides a fundamental overview of flow cytometry analysis, wherein suspended particles are meticulously aligned one by one through hydrodynamic focusing, followed by their detection using one or more lasers (Rubbens and Props, 2021).
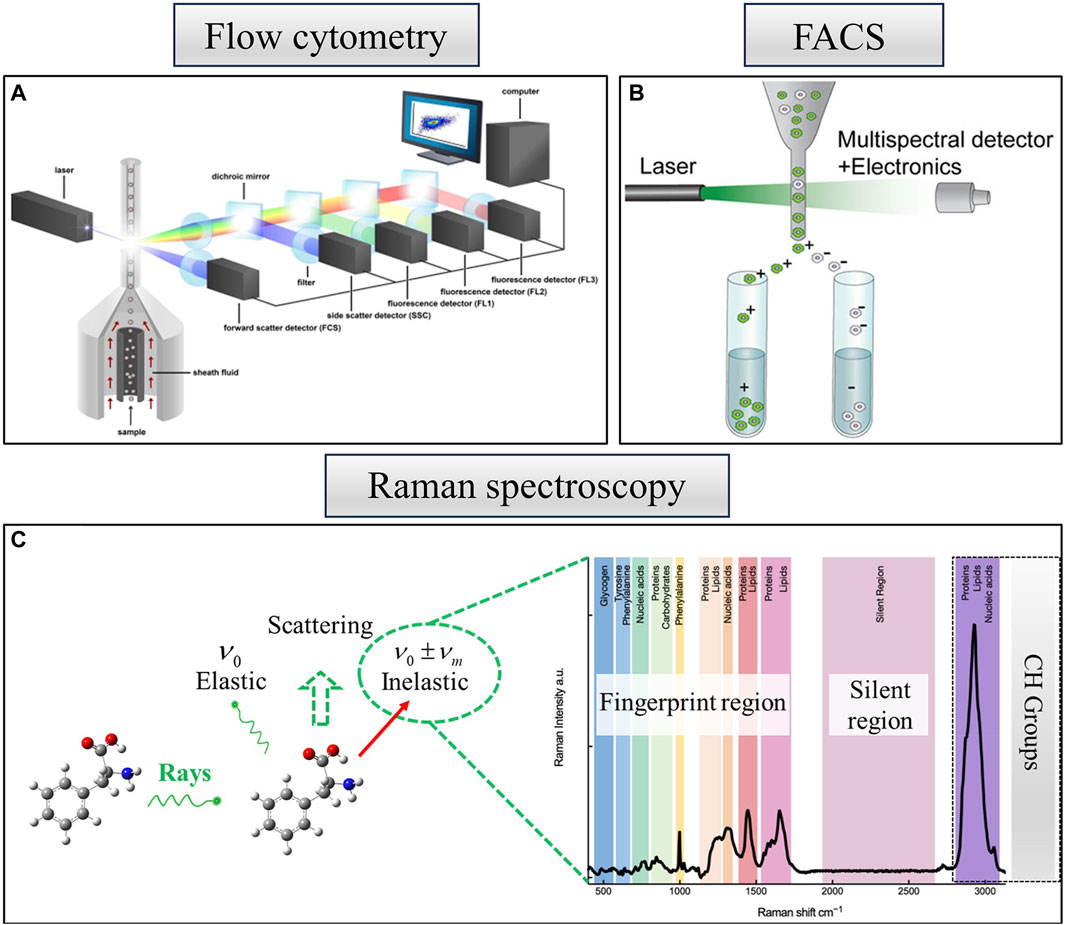
Figure 2. Optical techniques of single-cell identification and analysis methods. (A) Schematic overview of a flow cytometry analysis. Reproduced from Rubbens and Props (2021). (B) FACS for the identification and sorting of cells—a derivative of flow cytometry, reproduced from Hwang et al. (2018). (C) Raman spectroscopy—a single cell demonstrating various bands representative of cellular constituents, reproduced from Xu et al. (2021).
As shown in Figure 2B, traditional fluorescence-activated cell sorting (FACS) can be considered a derivative of flow cytometry and stands out as a robust method for the identification and sorting of cells. The FACS technique uses a laser beam to excite a single row of flowing cells, capturing their fluorescence information through a detector. Subsequently, a differently charged liquid is ejected through a piezoelectric crystal to envelop each cell. When the charged liquid encapsulating the cells traverses an electric field, it undergoes deflection toward various receiving devices, accomplishing the sorting of cells. Although flow cytometric sorting is highly rapid, it necessitates fluorescent labeling of the sample, potentially leading to sample damage (Adan et al., 2017; Hwang et al., 2018). FACS demands a substantial quantity of samples, exhibits low recovery rates, and incurs significant costs.
Fluorescent probes commonly exhibit issues such as cytotoxicity, nonspecific binding, and interference with natural cellular functions (Jensen, 2012). Many fluorescence-based methods may disrupt natural biological processes and induce damage to cells. Additionally, these probes are not universally applicable to all cell types and molecules (Jensen, 2012). Notably, fluorescent labeling faces limitations, particularly with cells like circulating tumor cells, whose surface antigens undergo frequent changes (Yu et al., 2011; Mitra et al., 2012).
Raman spectroscopy exhibits unique advantages over traditional FACS (Bonner et al., 1972). In order to avoid the drawbacks associated with fluorescent labeling, such as interference with natural cellular functions, cellular damage, and nonspecific binding with many cell types that are difficult or impossible to label, we used Raman spectroscopy, which overcomes the drawbacks. Raman spectroscopy is a biological fingerprinting technique that can reveal molecularly intrinsic information about single cells. As shown in Figure 2C, Raman scattering, a form of non-elastic scattering with a frequency different from that of incident light (Raman and Krishnan, 1928; Høgset et al., 2020; Liu et al., 2022), is gradually becoming widely utilized in biology. The figure offers a comprehensive molecular vibrational profile that encompasses the Raman bands of key cellular constituents (e.g., proteins, nucleic acids, lipids, and carbohydrates). The Raman spectra of organisms can be classified into three distinct regions (Xu et al., 2021).
1) Fingerprint region: encompassing fundamental information about biological cells (400–1800 cm-1). 2) Silent region: typically not involving vibration modes generated by naturally occurring isotopes in biological molecules and may include energy bands arising from stable isotopes or triple bonds (1800–2,700 cm−1). 3) High-wavenumber region: primarily associated with the vibration of C-H groups from lipids and proteins (2,700–3,200 cm−1).
The primary advantages of applying Raman spectroscopy to biological research can be succinctly outlined as the capability to analyze samples containing water, intrinsic and label-free characterization, and non-invasive, non-destructive analysis (da Costa et al., 2019). Among these, the ability to examine water-containing samples sets Raman spectroscopy apart from other vibrational spectroscopy techniques (e.g., infrared spectroscopy). In Raman spectroscopy, the low polarization rate of water molecules minimally interferes with the sample signal, and water molecules can be easily subtracted during pre-processing. This feature is particularly beneficial for the study of living cells and organisms as it eliminates the need for laborious sample manipulation, unlike the drying preparation that may potentially alter the chemical properties of the organisms themselves (Wang et al., 2016; Xu et al., 2021). Raman spectroscopy, functioning as a label-free technique, eliminates the need for a priori knowledge of specific substrates, and these substrates are selectively labeled. Raman spectroscopy has the capacity to display the vibrational modes of all macromolecules in a biological sample within a single spectrum, a crucial aspect for studying individual living cells.
Raman spectroscopy stands as a crucial tool for biologists, chemists, and physicists. Single-cell Raman spectra (SCRS) typically encompass more than 1,000 Raman bands corresponding to different vibrational modes of almost all chemical components, such as nucleic acids, proteins, carbohydrates, and lipids. This comprehensive profile mirrors the complex intrinsic nature of single-cell gene expression, biosynthesis of specific compounds, cellular composition, characteristic structures, and metabolic states. Consequently, Raman cell sorting has become a widely embraced analytical method for rapid, non-destructive, and non-labeled single-cell characterization (Wagner, 2009). Raman cell sorting technology will generate suitable live cells for subsequent single-cell genomics, metagenomics, and gene sequencing, and this technology will link the phenotype and genotype of live cells (Song et al., 2017; Jing et al., 2018; Li et al., 2022; Li et al., 2023).
In recent years, Raman cell sorting has gradually become a research hot spot in the field of single-cell sorting. As an emerging cell sorting method, single-cell Raman spectroscopy is usually coupled with cell manipulation and separation techniques to construct an integrated detection and sorting system (Song et al., 2016; Mermans et al., 2023). This paper introduces various existing Raman cell sorting techniques, such as Raman-activated microfluidic sorting (RAMS) (McIlvenna et al., 2016), Raman-tweezer cell sorting (RTCS) (Lee et al., 2019), Raman-activated droplet cell sorting (RADS) (Wang et al., 2017), and Raman-activated cell ejection (RACE) (Jing et al., 2018), and describes their respective advantages and disadvantages. An in-depth comparative analysis is conducted considering factors such as the probability of cell damage, the need for labeling, individual cell sorting, and high detection accuracy.
The challenge of very weak spontaneous Raman signals is predominant in Raman cell sorting techniques, and enhancement of Raman signals can help obtain Raman spectra with high signal-to-noise ratios and improve the detection efficiency and overall throughput of the system.
This paper emphasizes the importance of single-cell research and describes the currently used single-cell research methods (single-cell manipulation and single-cell identification techniques). This paper compares the traditional fluorescence-activated cell sorting technique with Raman spectroscopy and finds that Raman spectroscopy overcomes the drawbacks of fluorescent labeling, thus making Raman cell sorting a powerful tool for single-cell research due to its label-free, non-destructive detection and the capability to analyze samples containing water. In addition, Raman cell sorting technology can provide live single cells for subsequent genomics analysis and gene sequencing. By addressing the challenges encountered in Raman cell sorting, this paper provides an overview of current methods to enhance weak spontaneous Raman signals and their associated pros and cons. Ultimately, this paper outlines the detailed information related to the Raman cell sorting techniques mentioned in this paper, giving the trends and future directions of Raman cell sorting.
Raman spectroscopy, based on the inelastic scattering of light, is a well-recognized, label-free, and non-destructive technique that reveals the intrinsic biochemical characteristics of cells (Butler et al., 2016) and has been utilized in the examination of single-cell phenotypes (Brauchle et al., 2016; Suhito et al., 2018; He et al., 2019; Hsu et al., 2020). In addition, after Raman detection of single cells, individual cells can still maintain their integrity and can be utilized further (Yuan et al., 2018; Lee et al., 2019). In recent years, Raman spectroscopy has been widely used by virtue of its non-labeling and non-destructive detection, which has led to the development of many Raman cell sorting techniques (Yan et al., 2021). Figure 3 depicts various techniques, including RAMS, RTCS, RADS, and RACE.
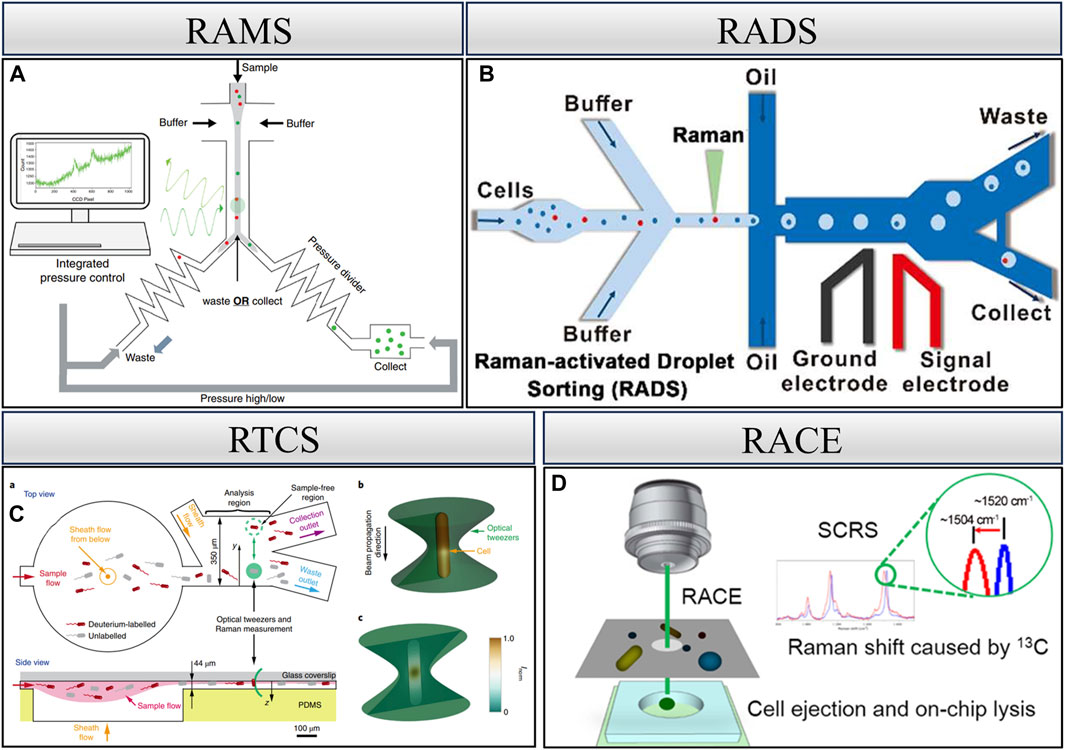
Figure 3. Raman single-cell sorting cytometry—systems for detecting and sorting cells based on Raman spectroscopy. (A) RAMS, reproduced from McIlvenna et al. (2016). (B) RADS, reproduced from Wang et al. (2017). (C) RTCS, reproduced from Lee et al. (2019). (D) RACE, reproduced from Jing et al. (2018).
Raman microfluidic cell sorting technology controls the flow of cells within the flow channel, and the cells remain active in the microfluidic environment. As these cells traverse the Raman excitation spot, Raman signals are generated, facilitating sample dichotomies based on the signal (Wang and Yu, 2015; McIlvenna et al., 2016). Specifically, this entails determining whether the cells belong to the target cells. As shown in Figure 3A, McIlvenna et al. developed an automated RACS system that achieves reliable synchronization of continuous Raman signal acquisition, real-time identification, and cell sorting with a sorting accuracy of 96.3%. Central to the implementation of continuous flow sorting is the use of “pressure dividers” to eliminate flow fluctuations in the inspection area. During the sorting process, Raman spectra are continuously collected. If the spectrum meets the sorting criteria, the program triggers the pump to switch output pressures and direct the flow into the collection channel. The collection channel then opens within a preset delay time before the flow is directed back to the waste outlet. Utilizing a simple hydrodynamic focusing and switching mechanism, this system eliminates the dependence on cell size, medium conductivity, and refractive index in the “capture” approach and provides a significant advantage in separating cells from complex populations (McIlvenna et al., 2016).
The optical trap generated by optical tweezers plays a dual role in manipulating target cells within the microfluidic channel. First, it restricts the flow of target cells in the channel, facilitating prolonged spectral acquisition for improved spectra. Second, it allows for the manipulation of cell movement to a specified area post-spectral acquisition. Leveraging these features, Raman optical tweezers are effective in manipulating and isolating a single cell. However, it is crucial to note that the process of isolating a single cell is very time-consuming. Previous studies have reported obtaining only a single cell using this technique within a 15-min duration (Huang et al., 2009). Subsequent research endeavors have aimed at improving the throughput of this technique. Notably, specific model microbial cells have achieved sorting throughputs ranging from 3.3 to 8.3 cells/min. However, it is only for one type of cell and does not result in only one single cell (Lee et al., 2019).
The integration of droplet microfluidics with Raman cell sorting, using mutually incompatible two-phase flow to envelop cells and thereby preventing cross-contamination, represents the most efficient system for single-cell identification, sorting, and culture at present (Huys and Raes, 2018). In the RADS system, dielectrophoresis (DEP)-based droplet sorting was applied to isolate those containing target droplet cells. Notably, SCRS acquisition and DEP-based droplet sorting are controlled by multi-threading, i.e., SCRS acquisition is performed simultaneously during droplet sorting. This design further improves sorting efficiency. RADS significantly enhances the sorting throughput to over 100 cells/min (Wang et al., 2017). However, it is specific to a certain pattern of cells characterized by strong Raman signals and is not universally applicable. For instance, non-labeled Escherichia coli necessitates 3–5 s for the excitation of a more desirable spectrum.
The integration of laser-induced forward transfer technology with Raman sorting technology allows for the analysis of single-cell Raman spectra, followed by the use of laser technology for the ejection and collection of individual cells. This method measures and receives Raman spectra from single cells and enables the ejection sorting of target cells. Through subsequent single-cell whole-genome sequencing, it becomes possible to construct the relationship between single-cell genotypes and phenotypes. However, the use of laser technology poses a challenge as it can damage the cells, resulting in low genome coverage when dealing with a single cell. This technique proves highly suitable for microbial samples in complex environments like soil and sludge because there are no problems like clogging of microfluidic tubes. Additionally, it is well-suited for low-abundance samples. Despite its advantages, realizing the culture of the received single cells remains a challenging aspect of this approach (Song et al., 2017; Jing et al., 2018; Wang et al., 2020).
This paper considers factors such as cell damage probability, the need for labeling, and single-cell sorting with high detection accuracy. Considering these factors, this paper compares the traditional FACS technique with several of the most representative Raman cell sorting techniques, as shown in Table 1.
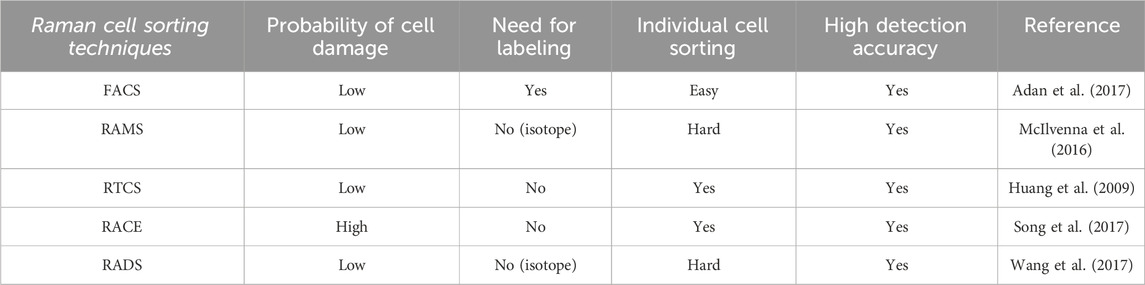
Table 1. Comparison of FACS and several of the most representative Raman cell sorting techniques.
Metagenomic sequencing and sorting are increasingly powerful tools that enable direct analysis of microbiota at the genotype level (Albertsen et al., 2013; Nielsen et al., 2014; Jing et al., 2018). However, phenotypic information on microorganisms is inevitably missed. Raman spectroscopy has proven to be a useful method to provide comprehensive phenotypic information on single cells in a non-destructive manner. Metagenomics is a culture-independent approach to microbial research. It provides a comprehensive understanding of the diversity and potential functions of microorganisms in a sample. Single-cell genomics serves as a complementary strategy to metagenomics, enabling the establishment of genetic links among DNA sequences within single cells (Swan et al., 2011; Lasken, 2012). Raman cell sorting, combined with single-cell genomics, represents a potent approach for circumventing microbial culture and revealing the microbial “dark matter.” Although fluorescence-activated cell sorting has successfully sorted single cells for subsequent single-cell genomics studies (Rinke et al., 2013), Raman cell sorting presents a valuable alternative. This method sorts cells based on SCRS, where the spectra reflect the cell’s phenotype and label-free biochemical “fingerprint” information (Huang et al., 2015). Such information can link sorted cells to their phenotypic traits and ecological functions (Song et al., 2017).
The potential of Raman cell sorting combined with single-cell genomics has been demonstrated. Song et al. used a novel RACE method to sort single bacterial cells from Red Sea water samples based on SCRS. They showed the isolation of single cells containing carotenoids from Red Sea samples based on SCRS characterization. RACE-based single-cell genomics revealed putative new functional genes associated with carotenoid and isoprenoid biosynthesis, as well as previously unknown phototrophic microorganisms, including non-culturable Cyanobacteria spp. (Song et al., 2017). Jing et al. utilized SCRS as a biochemical map, and RACE was able to link cellular phenotypes to genotypes. Mini-metagenomic sequences from RACE can be used as a reference to de-construct a near-complete genome of key functional bacteria by binning shotgun metagenomic sequencing data. This novel approach reveals the role of marine “microbial dark matter” in global carbon cycling by linking uncultured Synechococcus spp. and Pelagibacter spp. to carbon fixation and in situ flux activities (Jing et al., 2018).
Raman cell sorting has been applied to single-cell genome sequencing. Li et al. developed a new method combining RACS, stable isotope probing (SIP), and genome-directed cultivation (GDC). For the identification, sorting, and culture of active toluene degraders from complex microbial communities in petroleum-contaminated soil, the single cells therein were sorted and isolated using RACS. They successfully assembled the genome of Pigmentiphaga based on the metagenomic sequencing of 13C-DNA and genomic sequencing of sorted cells. Additionally, the genotypes and phenotypes of this degrader were directly correlated at the single-cell level (Li et al., 2023). Li et al. used 13C-labeled phenanthrene as the target and developed a new method coupling MMI−SIP and RACS. This method is designed to identify active bacterial cells that degrade phenanthrene from wastewater contaminated with polycyclic aromatic hydrocarbons (PAHs). Moreover, this approach significantly enriched active phenanthrene degraders and successfully isolated representative single cells. Novosphingobium was confirmed to be the active phenanthrene degrader by amplicon sequencing analysis by SIP, the 13C shift of the single cell in Raman spectra, and the 16S rRNA gene from single-cell sequencing by RACS (Li et al., 2022).
At present, the challenges of slow detection speed and low sorting throughput, attributed to the weak intensity of spontaneous Raman signals, severely limit the application of spontaneous Raman in the field of single-cell in vivo sorting. The signal from spontaneous Raman scattering is remarkably weak, with only 1 photon out of every 106–108 scattered photons in the sample transitioning to a Raman-scattered photon (Petry et al., 2003; Huang et al., 2010). Consequently, an extended total cell exposure time is typically necessary to acquire high signal-to-noise SCRS. Generally, the signal photon level in spontaneous Raman spectra is very low, and recording Raman spectra takes a few milliseconds to a few seconds (Zhang C. et al., 2015; Cheng and Xie, 2015). This limitation significantly hinders the detection speed and sorting throughput of Raman cell sorting systems.
As shown in Figure 4, to address the above issues, not only can improvements and optimizations in Raman technology be pursued but also research at the cellular level. Several solutions are currently available, including stimulated Raman scattering (SRS) (Cheng and Xie, 2015), coherent Raman scattering (CRS) (Cheng and Xie, 2015), surface-enhanced Raman spectroscopy (SERS) (Chrimes et al., 2013), biomarkers (Song et al., 2017; Lee et al., 2019), and stable isotope labeling (Wang et al., 2016).
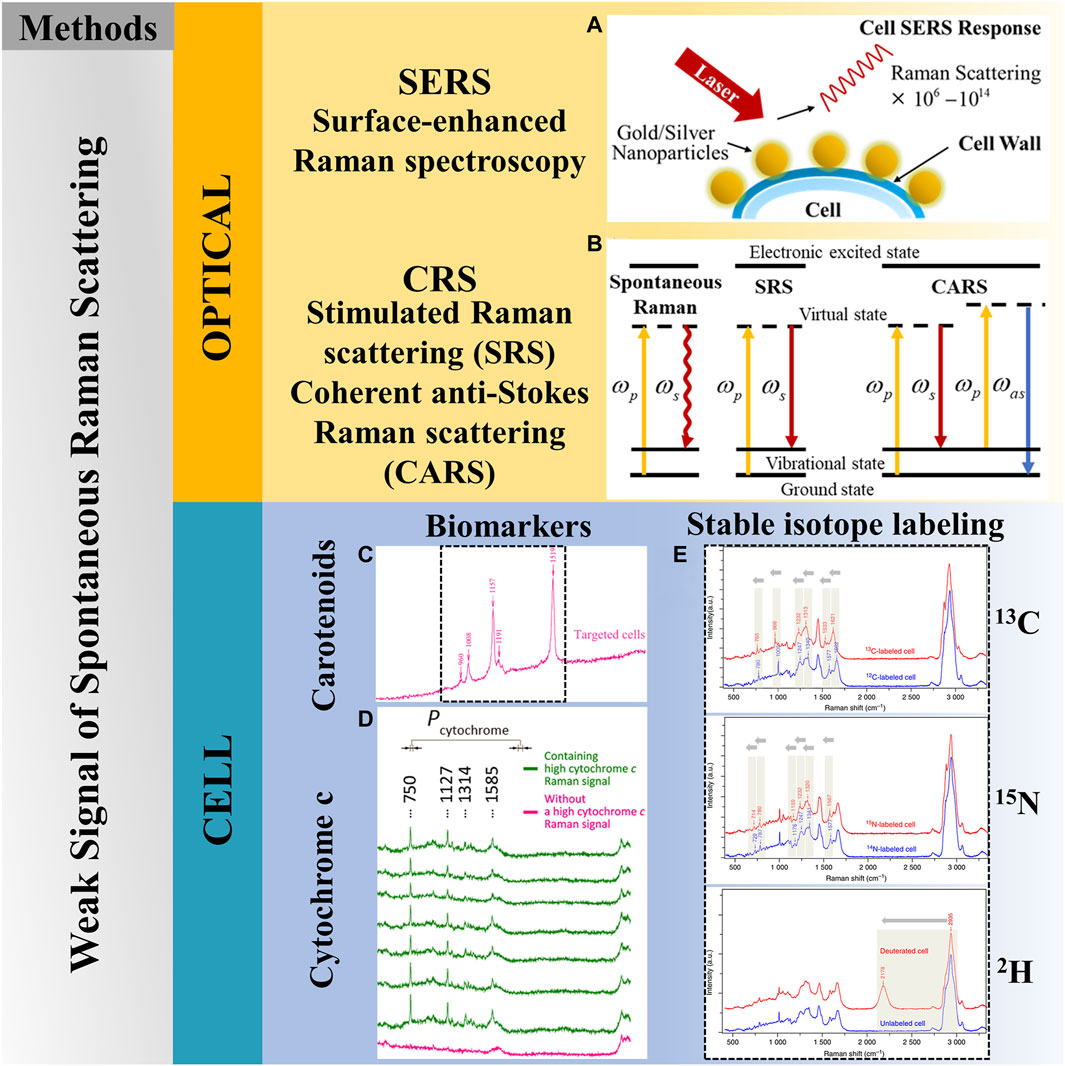
Figure 4. Solutions to weak signal of spontaneous Raman scattering. (A) SERS, reproduced from Chrimes et al. (2013). (B) Coherent Raman scattering. (C) Biomarkers—carotenoids, reproduced from Song et al. (2017). (D) Biomarkers-cytochrome c, reproduced from Lee et al. (2019). (E) Stable isotope labeling, reproduced from Wang et al. (2016).
Optimized Raman microscopy can overcome the weak signal of spontaneous Raman scattering and significantly reduce the acquisition time of spontaneous SCRS. The CRS technique, a nonlinear Raman approach, involves spatially overlapping two light beams with frequencies wp and ws, which are then converged on the sample through the objective lens. As a nonlinear optical process, it encompasses both coherent anti-Stokes Raman scattering (CARS) and SRS. These techniques arise from the nonlinear coherent Raman phenomenon, occurring when the frequency difference between the pump beam (wp) and the Stokes beam (ws) matches the Raman-active vibrational modes. They can achieve Raman signal enhancement in the 3rd–5th order (Folick et al., 2011; Zhang et al., 2014; Zhang et al., 2015c). Specifically, the CARS technique increases the velocity through a coherent radiation field, which makes the signal increased and highly directional (Evans et al., 2005; Cheng and Xie, 2015), and the SRS technique amplifies the signal through the presence of a local oscillator at the detection wavelength (Saar et al., 2010; Cheng and Xie, 2015).
Nevertheless, the application of both SRS and CAR entails the use of femtosecond lasers. Although this method drastically increases the number of photons interacting with a cell in a short duration, resulting in Raman signal amplification, it concurrently raises the likelihood of photodamage to the cell. This increased risk complicates the execution of experiments on living cells (Zhang et al., 2017; Suzuki et al., 2019). Compared to spontaneous Raman spectroscopy, which encompasses a wider range of vibrational spectra, the CRS technique covers a relatively small window of molecular vibrations (Song et al., 2016). The main limitation faced by the CRS technique is its narrow range of wave numbers.
As shown in Figure 5A, Nitta et al. demonstrated Raman image-activated cell sorting technology by directly detecting chemically specific intracellular molecular vibrations for cellular phenotyping via ultrafast multicolor SRS microscopy. The system utilizes hydrodynamic focusing with acoustic focusing to converge cells into a single stream, an ultrafast multicolor SRS microscope with line-focusing geometry for continuous molecular vibration imaging of flowing cells, and an on-chip dual-membrane push–pull cell sorter for the rapid isolation of target cells from the cell stream. Specifically, the technology enables real-time sorting of individual live cells based on SRS images with a sorting throughput of up to ∼100 events per second without the need for fluorescent labeling. SRS-based Raman microscopy acquires Raman signals that are orders of magnitude faster than the signals of spontaneous Raman scattering microscopy. As a result, Raman image-activated cell sorting (RIACS) can increase sorting throughput (∼100 times higher sorting throughput) and spatial resolution by providing Raman images compared to non-imaging Raman-activated cell sorting, which can provide only one-dimensional (1D) Raman signal intensities with a moderate throughput of ∼1 eps (Nitta et al., 2020).
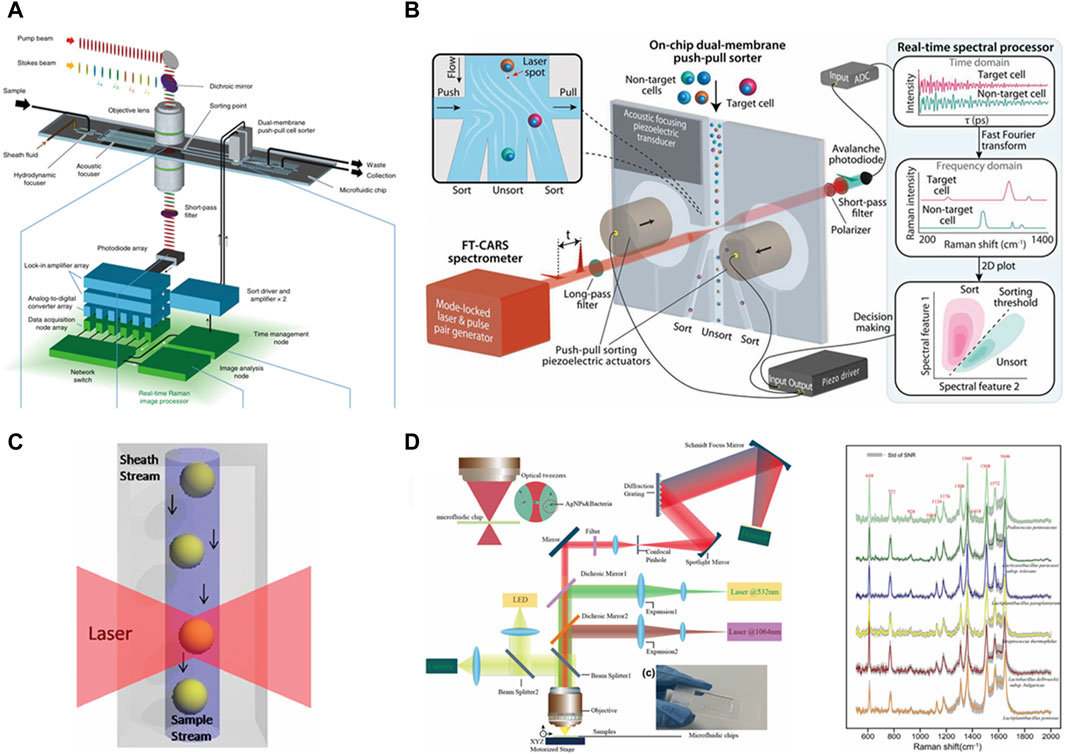
Figure 5. Different Raman techniques applied to Raman cell sorting. (A) RIACS based on SRS technology, reproduced from Nitta et al. (2020). (B) Raman-activated cell sorting (RACS) based on CARS technology, reproduced from Lindley et al. (2022). (C) SERS-based flow cytometry, reproduced from Sebba et al. (2009). (D) SERS technology combined with optical tweezers in a microfluidic environment, reproduced from Shang et al. (2023).
As shown in Figure 5B, Lindley et al. reported a coherent RACS machine utilized for cell sorting in the fingerprint region at speeds up to ≈50 eps. Fingerprint regions contain molecular backbone vibrations that typically contain richer information, and for cellular measurements, signals in the fingerprint region tend to be weaker than in the C-H region, requiring longer acquisition times. The system combines a fast-scanning Fourier-transform coherent anti-Stokes Raman scattering (FT-CARS) broadband (300–1,600 cm−1) spectrometer, an on-chip dual-membrane push–pull cell sorter, and a real-time spectral processor based on a field-programmable gate array (FPGA). Here, coherent Raman spectroscopy is utilized to enable Raman signal enhancement to greatly reduce the spectral acquisition time and thus increase the throughput. The acoustic-focusing piezoelectric transducer is utilized to focus the cells into a single stream, and the on-chip dual-membrane push–pull cell sorter is utilized for cell sorting. At the same time, this technique overcomes the trade-off problem of throughput versus measurement bandwidth and demonstrates broadband RACS in the fingerprint region (300–1,600 cm−1) with a record-high throughput of ≈50 cells per second (Lindley et al., 2022).
The signal of Raman spectroscopy can be enhanced using SERS technology. Using surface plasmon resonance generated by nanoscale metal structures, such as metal nanoparticles, designing metal coatings with microstructures and nanostructures inside micro-orifices, the Raman spectral signal can be enhanced by 106–1014 orders of magnitude, and a new Raman spectrum can be obtained (Chauvet et al., 2017). However, it is important to note that SERS is confined to a short range, which only has an extremely strong signal enhancement effect on chemicals within tens of nanometers close to the metal surface. In contrast, there is no significant enhancement effect on chemicals located far away from the metal surface, potentially introducing signal acquisition bias and a loss of representativeness of the Raman signal.
SERS exists for the rapid acquisition of SCRS in combination with flow cytometry (Watson et al., 2008; Sebba et al., 2009; Zhang et al., 2015c). As shown in Figure 5C, in SERS-based flow cytometry, it is possible to detect Raman scattering from individual tags within sub-millisecond interrogation times (Sebba et al., 2009). It can detect leukemia and lymphoma cells (MacLaughlin et al., 2013).
For rapid SERS combined with Raman cell sorting, it is important to generate more reproducible and stronger SERS signals. As shown in Figure 5D, Shang et al. combined label-free SERS and optical tweezers to construct a test platform in a microfluidic environment and performed SERS spectroscopy on six lactic acid bacteria in a microfluidic environment, verifying that the stability of the SERS spectra was improved. This technique can be used for the rapid identification of lactic acid bacteria. The peaks of each lactic acid bacterium were significantly enhanced after SERS enhancement. This study revealed that the immobilization of bacteria using optical tweezers can significantly improve the stability of SERS spectra, expanding the practical application of SERS in bacterial detection (Shang et al., 2023).
Research on the production of unlabeled compounds featuring strong Raman signals, known as biomarkers, is widespread. This method involves utilizing cell-intrinsic substances that are sensitive to Raman excitation and exhibit significant enhancement in a specific region of the Raman spectrum, aiming to achieve single-cell recognition and differentiation. Carotenoids (Jehlička et al., 2014; Song et al., 2017) and cytochrome c (Pätzold et al., 2008; Lee et al., 2019) are currently commonly used biomarkers. However, it is crucial to recognize that this technique can only work for specific organisms.
Carotenoids represent a group of different chemicals with a conjugated polyene skeletal backbone. The presence of this polyene backbone enhances the Raman signal, allowing for the detection of very small amounts of carotenoids (Vítek et al., 2009; Dartnell et al., 2012). The application of Raman resonance spectroscopy to investigate natural pigments, particularly carotenoids and chlorophylls (Jehlička et al., 2014), commenced in the 1980s (Merlin, 1985), building upon the seminal work of Euler and Hellström (1932). Their research was done a few years after the discovery of the Raman effect, and the Raman spectra of carotenoids were subsequently published in 1970 (Gill et al., 1970). In 1986, the literature revealed the ability to readily detect trace amounts of carotenoids in complex substances and even in single living cells, albeit within a short timeframe (Wagner, 1986).
Carotenoids are among the most structurally diverse pigments in bacteria and are capable of generating strong resonance Raman signals (McIlvenna et al., 2016). Carotenoids are present in virtually all photosynthetic cells and have been used as intrinsic biomarkers indicative of cellular physiological function (Li et al., 2012a).
In 1972, the resonance Raman effect of cytochrome c (Cyt c) was discovered and meticulously analyzed (Spiro and Strekas, 1972). The amplification of its Raman scattering resonance was ascribed to the electronic absorption of Cyt c in the visible spectrum (Q0 or Q1 bands) and near-ultraviolet range (B or Soret bands), corresponding to the in-plane (
Hamada et al. demonstrated the dynamic imaging of molecular distributions in unstained living cells using Raman scattering, revealing that a 532 nm excitation wavelength produced a robust Raman scattering signal. As shown in Figure 6, strong Raman peaks emerged at 753, 1,127, 1,314, and 1,583 cm in the spectra acquired with 514.5 nm and 532 nm excitation wavelengths. These peaks can be assigned to the vibrational modes of cytochrome c. Since cytochrome c contains heme proteins that absorb light from 510 nm to 550 nm, strong resonance Raman scattering is observed when irradiated in this wavelength range (Hamada et al., 2008).
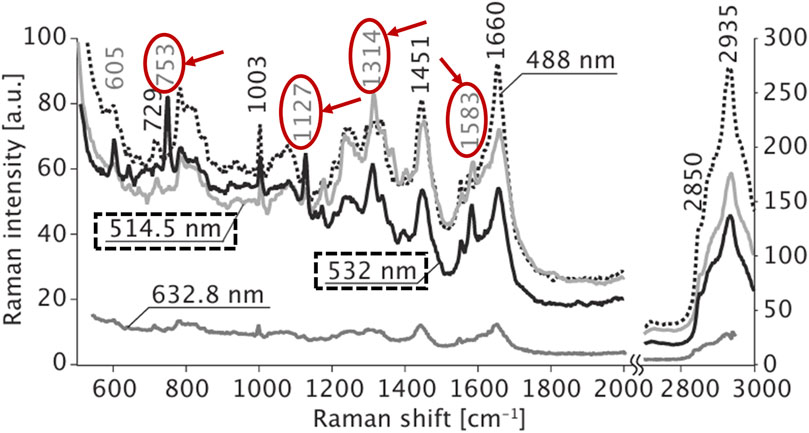
Figure 6. Raman spectra obtained from the cytosol of a living HeLa cell. The cells were irradiated with laser light of 488-, 514.5-, 532-, and 632.8-nm wavelengths, reproduced from Hamada et al. (2008).
Due to its high sensitivity to minute alterations in the vibrational frequencies of chemical bonds, Raman spectroscopy can be effectively coupled with stable isotopes (SIPs). The combination of SIPs and Raman spectroscopy is sufficiently sensitive to allow for the semi-quantitative detection of 13C doping at the single-cell level (Li et al., 2012b).
Stable isotope labeling (SIL) involves introducing isotope-labeled nutrients into the cell culture medium. After the cells metabolize these nutrients, the molecular structure remains stable, but the corresponding Raman spectra produce a “red shift phenomenon.” This phenomenon serves not only as an indicator of functional microorganisms but also as an indicator of microbial activity (Li et al., 2019). When combined with sequencing technology, SIL enables an in-depth analysis of the metabolism and functions of single cells within complex samples. The isotopes commonly used for single-cell Raman spectroscopic characterization include 13C, 15N, and 2H (Wang et al., 2016).
Investigations using isotope-labeled substrates for the functional analysis of microbial communities have two significant limitations. Initially, isotope-labeled derivatives of numerous substrates of interest are prohibitively expensive and often not commercially accessible. Second, the introduction of labeled substrates modifies the composition of the natural substrate pool, potentially leading to alterations in the activities of community members (Wang et al., 2016).
In Raman cell sorting technology, the Raman assay method for cells in the flow state, when used in combination with the cell separation method, improves the sorting throughput, and the cells can be kept active in the liquid environment, which can be used to sort and provide live cells for subsequent genomics analysis and sequencing. Due to the inherently weak signals of spontaneous Raman spectroscopy, achieving high signal-to-noise Raman spectra from a single cell in microfluidic devices often requires maintaining and precisely localizing the cell in the Raman detection region. This ensures sufficient total cell exposure time for Raman signal acquisition. Cells in the flow state should be more accurately focused on the excitation spot position to prevent cells from missing or skipping Raman detection, which, in combination with the sorting section, can increase throughput. This approach also gives the cells sufficient exposure time to enhance the Raman signal, which in turn improves the detection speed. Methods to precisely localize flowing cells can enhance Raman signals and improve Raman detection speed and efficiency. This paper reviews current methods that enable precise localization and focusing of live flowing cells to the excitation spot position with the Raman detection region in a flow state with precision.
Laser tweezer Raman spectroscopy (LTRS) stands out as a powerful, label-free technique for manipulating and analyzing individual cells or particles in aqueous solutions. As shown in Figure 7A, Lau et al. developed an optical tweezer-based Raman cell sorting system in a flowing state, where the laser serves as an excitation source, a trapping force, and a sorting switch concurrently. This system captures cells into the Raman acquisition region, effectively extending the Raman acquisition time and prolonging the total exposure time of the cells. Subsequently, optical tweezers are used to guide cells of interest into the collection channel (Lau et al., 2008).
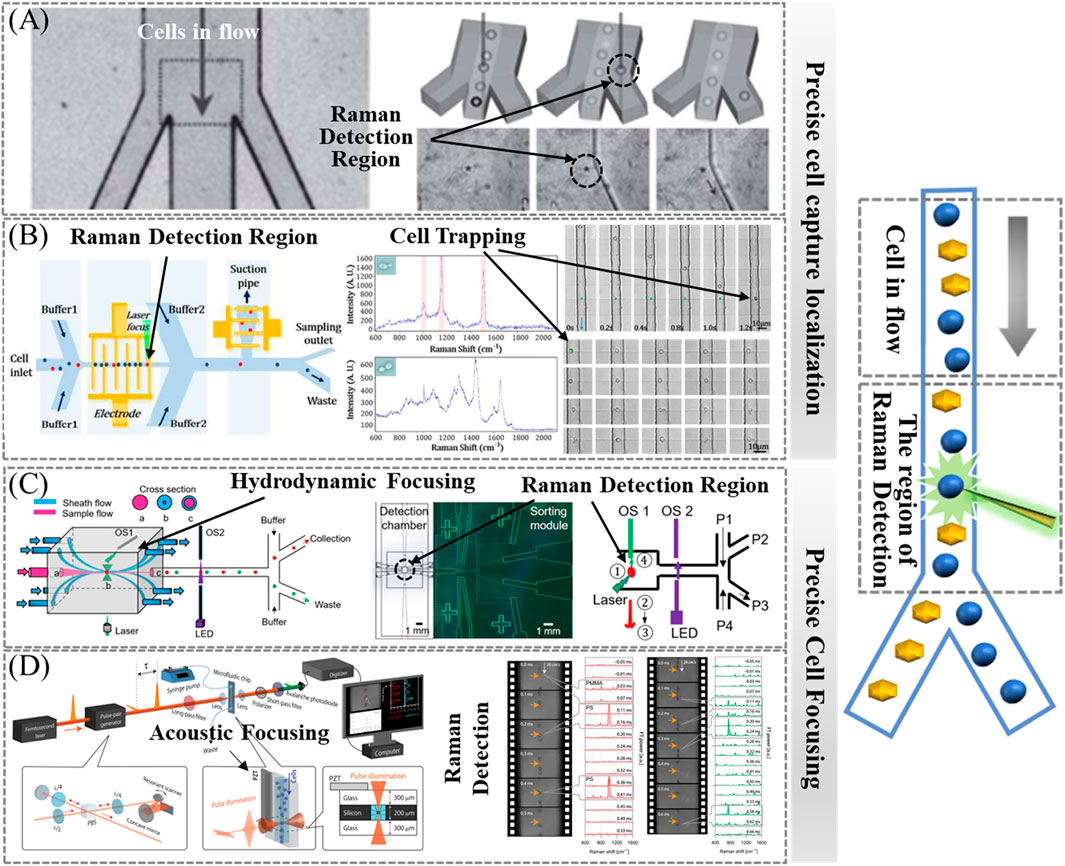
Figure 7. Raman signal enhancement method for cells in the flow state. (A) Optical-based cell capture—optical tweezers, reproduced from Lau et al. (2008). (B) Electric-based cell capture—DEP, reproduced from Zhang et al. (2015b). (C) Precise cellular localization—hydrodynamic focusing, reproduced from Lyu et al. (2020). (D) Precise cellular localization—acoustofluidic focusing, reproduced from Hiramatsu et al. (2019).
Despite the slow capture speed and low throughput of the optical capture method known as optical tweezers, optical tweezers have been a method used to hold the position of cells during Raman detection (Xie et al., 2005b; McIlvenna et al., 2016). There is a high risk of photodamage to cells when using laser tweezers (Pilat et al., 2013). Currently, there are faster cell-trapping methods, such as DEP, which operates through electrical means. DEP can exert forces in the range of 0.1 nN–1 nN for particle manipulation, making it robust enough to capture single cells at high flow rates. Combining DEP with Raman spectroscopy facilitates label-free manipulation and cell identification, thereby contributing to an improvement in sorting throughput (Zhang et al., 2015b; Li and Anand, 2018). However, this method is based on low-conductivity, non-physiological buffers, the use of which may affect cell viability (Schroder et al., 2013).
As shown in Figure 7B, Zhang et al. developed a pioneering Raman cell sorting platform that merges positive dielectrophoresis (pDEP) with RACS. By periodically applying and turning off the pDEP field on the electrode array, the platform achieves precise capture, sorting, and delivery of single cells to the Raman detection region. Raman spectra are subsequently measured one by one. In addition, the capture time of this platform is adjustable. As a proof of concept, the platform successfully sorted carotenoid-producing and non-carotenoid-producing yeast cells. The characteristic peaks in the Raman spectra of carotenoid-producing yeast cells were markedly distinct from those of their non-carotenoid-producing counterparts, resulting in an 8-fold enrichment. This outcome serves as further evidence that the method effectively addresses the issue of weak spontaneous Raman signals. Additionally, the method exhibited notable high-throughput capabilities, capturing and characterizing at least 577 cells within a 540-s timeframe (Zhang et al., 2015b; Li and Anand, 2018).
In the absence of “cell capture,” achieving precise focusing of flowing cells onto the excitation spot becomes challenging, especially in wide channels. Hydrodynamic focusing offers a solution that is independent of the physical properties of the cells and the medium, making it universally applicable to a broad spectrum of biological systems. As shown in Figure 7C, Lyu et al. developed a 3D hydrodynamically focused microfluidic system for fully automated, continuously Raman-activated cell sorting (3D-RACS). This system incorporates a 3D-printed detection chamber (1 mm3) integrating a PDMS-based sorting unit, optical sensors, and an in-line collection module. It is able to precisely localize cells in the detection chamber and perform Raman measurements, effectively eliminating spectral interferences from the device material. As a proof-of-concept, Raman-activated sorting of a mixture of Chlorella vulgaris and E. coli was performed with a purity of 92.0% and a throughput of 310 cells/min. This capture-free system exhibits significant potential for high throughput (Lyu et al., 2020).
As shown in Figure 7D, Hiramatsu et al. used an acoustofluidic focusing microfluidic chip to tightly focus each cell in a high-speed flow, ensuring stable and efficient acquisition of Raman spectra. An acoustic standing wave, generated by a piezoelectric transducer (PZT), plays a crucial role in achieving accurate and consistent measurements in the context of a high-speed flow. This standing wave focuses cells onto a standing wave node positioned at the center of the microchannel. In this manner, all cells are tightly focused in a single stream, facilitating optical interrogation at the center of the microchannel (Hiramatsu et al., 2019).
Capturing and localizing cells precisely within the Raman detection area facilitates prolonged signal acquisition. This capability extends the total exposure time of the cells, consequently enhancing the signal-to-noise ratio of the Raman spectra. Historically, many microfluidic systems have predominantly used optical or electrical techniques, such as optical tweezers and dielectrophoresis (Zhang et al., 2015c), for accomplishing “cell capture.” Typically, Raman cell sorting techniques based on cell capture and localization methods are very common. However, the capture rate used by the above methods may have imposed a limitation on the detection throughput. In addition, capture efficiency depends on variables such as cell size, medium conductivity, and refractive index (Lyu et al., 2020).
Some methods can similarly focus cells precisely at the excitation spot position, allowing the cells to receive sufficient total cell exposure time in the Raman detection region, enhancing the spontaneous Raman signal, and improving the signal-to-noise ratio of the spectrum. Hydrodynamic focusing and acoustic focusing are common ways of precisely focusing cells in the flow state at the excitation spot position and detecting Raman spectra (flow Raman). Moreover, the integration of acoustic focusing and flow focusing is a common practice, further enhancing the precision of cell localization in the Raman detection region (Nitta et al., 2020).
Meanwhile, optical tweezers or dielectrophoresis methods often utilize hydrodynamic focusing or acoustic focusing to pre-focus flowing cells before cell capture and localization in order to capture and localize the cells in the Raman detection region more accurately, for example, by pre-focusing cells to generate a narrow stream before their capture (utilizing optical tweezers) (Lau et al., 2008). Hydrodynamic focusing typically yields elevated cell velocities, diminishing the efficiency of cell capture. In contrast, acoustofluidic focusing focuses cells at velocities conducive to effective capture (Wang et al., 2023).
As shown in Table 2, this paper lists the relevant details of Raman cell sorting techniques related to this paper, such as RAMS, RTCS, RACE, RADS, RADS (DEP), RIACS, and RACS (CARS). The details include the Raman methods used, spectral ranges, capture modes, cell types, species or cell lines, whether or not resonance-enhanced, Raman analyte and throughput, etc. (Lindley et al., 2022). It can be found that the cell types or species to be sorted by the different techniques may vary, the Raman analyte may vary from cell to cell, the way to enhance the weak spontaneous Raman signal may vary, and the throughput may vary. For cellular measurements, the signal in the fingerprint region is usually weaker than the signal in the C-H region, but the fingerprint region is more informative. The fingerprint regions require longer acquisition times, and detecting larger spectral bandwidths requires longer measurement times (Lindley et al., 2022). When Raman cell sorting techniques move to a high-throughput state, the trade-off between the throughput and Raman spectral bandwidth (similar to cellular information) also needs to be de-considered.

Table 2. Detailed information on Raman cell sorting technology.
By enhancing the Raman signal and achieving faster detection with higher sorting throughput in the cell flow state, Raman cell sorting technology is expected to make significant progress in the future. In the state of cell flow, the common spontaneous Raman acquisition methods usually use a point excitation spot to achieve precise control of flowing cells by precise cell capture localization and precise cell focusing, accurately locating the cell in the Raman detection area, focusing the cell to the position of the excitation spot, and maintaining sufficient Raman acquisition time. However, these methods often require ensuring sufficient total cell exposure time in the Raman detection region to obtain spectra with good signal-to-noise ratios, which may compromise throughput. Incorporating a line-focusing strategy to detect multiple cells for SCRS in parallel (Watanabe et al., 2015; Wang et al., 2023) stands as a promising approach for the future. This process may enhance the Raman signal and improve the signal-to-noise ratio. In addition, it may enhance the speed and efficiency of detection, thus increasing the throughput. Raman cell sorting technology is capable of identifying and separating individual cells from complex cell populations in a label-free and non-invasive manner, while live cells can be obtained for subsequent genomics analysis and gene sequencing, providing a powerful means to advance the field of cell biology.
XT: conceptualization, investigation, and writing–original draft. QW: conceptualization and writing–review and editing. LS: conceptualization and writing–review and editing. KL: conceptualization and writing–review and editing. YG: conceptualization and writing–review and editing. PL: investigation, writing–review and editing, and conceptualization. BL: writing–review and editing, supervision, and visualization.
The author(s) declare that financial support was received for the research, authorship, and/or publication of this article. This study was financially supported by the National Natural Science Foundation of China (grant no. 62304222).
Authors PL and BL were employed by Hooke Instruments Ltd.
The remaining authors declare that the research was conducted in the absence of any commercial or financial relationships that could be construed as a potential conflict of interest.
All claims expressed in this article are solely those of the authors and do not necessarily represent those of their affiliated organizations, or those of the publisher, the editors, and the reviewers. Any product that may be evaluated in this article, or claim that may be made by its manufacturer, is not guaranteed or endorsed by the publisher.
Adan, A., Alizada, G., Kiraz, Y., Baran, Y., and Nalbant, A. (2017). Flow cytometry: basic principles and applications. Crit. Rev. Biotechnol. 37 (2), 163–176. doi:10.3109/07388551.2015.1128876
Albertsen, M., Hugenholtz, P., Skarshewski, A., Nielsen, K. L., Tyson, G. W., and Nielsen, P. H. (2013). Genome sequences of rare, uncultured bacteria obtained by differential coverage binning of multiple metagenomes. Nat. Biotechnol. 31 (6), 533–538. doi:10.1038/nbt.2579
Banks, D. P., Kaur, K., Grivas, C., Sones, C., Gangopadhyay, P., Ying, C., et al. (2009). Femtosecond laser-induced forward transfer for the deposition of nanoscale transparent and solid-phase materials. Proc. LAMP2009 - 5th Int. Congr. Laser Adv. Mater. Process.
Baslan, T., and Hicks, J. (2017). Unravelling biology and shifting paradigms in cancer with single-cell sequencing. Nat. Rev. Cancer 17 (9), 557–569. doi:10.1038/nrc.2017.58
Blázquez-Castro, A. (2019). Optical tweezers: phototoxicity and thermal stress in cells and biomolecules. Micromachines 10 (8), 507. doi:10.3390/mi10080507
Bonner, W., Hulett, H., Sweet, R., and Herzenberg, L. (1972). Fluorescence activated cell sorting. Rev. Sci. Instrum. 43 (3), 404–409. doi:10.1063/1.1685647
Brauchle, E., Knopf, A., Bauer, H., Shen, N., Linder, S., Monaghan, M. G., et al. (2016). Non-invasive chamber-specific identification of cardiomyocytes in differentiating pluripotent stem cells. Stem Cell. Rep. 6 (2), 188–199. doi:10.1016/j.stemcr.2015.12.007
Butler, H. J., Ashton, L., Bird, B., Cinque, G., Curtis, K., Dorney, J., et al. (2016). Using Raman spectroscopy to characterize biological materials. Nat. Protoc. 11 (4), 664–687. doi:10.1038/nprot.2016.036
Cai, L., Friedman, N., and Xie, X. S. (2006). Stochastic protein expression in individual cells at the single molecule level. Nature 440 (7082), 358–362. doi:10.1038/nature04599
Chattopadhyay, A., and Maiti, M. K. (2021). Lipid production by oleaginous yeasts. Adv. Appl. Microbiol. 116, 1–98. doi:10.1016/bs.aambs.2021.03.003
Chauvet, R., Lagarde, F., Charrier, T., Assaf, A., Thouand, G., and Daniel, P. (2017). Microbiological identification by surface-enhanced Raman spectroscopy. Appl. Spectrosc. Rev. 52 (2), 123–144. doi:10.1080/05704928.2016.1209760
Cheng, J.-X., and Xie, X. S. (2015). Vibrational spectroscopic imaging of living systems: an emerging platform for biology and medicine. Science 350 (6264), aaa8870. doi:10.1126/science.aaa8870
Chrimes, A. F., Khoshmanesh, K., Tang, S.-Y., Wood, B. R., Stoddart, P. R., Collins, S. S., et al. (2013). In situ SERS probing of nano-silver coated individual yeast cells. Biosens. Bioelectron. 49, 536–541. doi:10.1016/j.bios.2013.05.053
Civita, P., Franceschi, S., Aretini, P., Ortenzi, V., Menicagli, M., Lessi, F., et al. (2019). Laser capture microdissection and RNA-seq analysis: high sensitivity approaches to explain histopathological heterogeneity in human glioblastoma FFPE archived tissues. Front. Oncol. 9, 482. doi:10.3389/fonc.2019.00482
da Costa, S. G., Richter, A., Schmidt, U., Breuninger, S., and Hollricher, O. (2019). Confocal Raman microscopy in life sciences. Morphologie 103 (341), 11–16. doi:10.1016/j.morpho.2018.12.003
Dartnell, L. R., Page, K., Jorge-Villar, S. E., Wright, G., Munshi, T., Scowen, I. J., et al. (2012). Destruction of Raman biosignatures by ionising radiation and the implications for life detection on Mars. Anal. Bioanal. Chem. 403, 131–144. doi:10.1007/s00216-012-5829-6
Eldar, A., and Elowitz, M. B. (2010). Functional roles for noise in genetic circuits. Nature 467 (7312), 167–173. doi:10.1038/nature09326
Euler, H. v., and Hellström, H. (1932). Raman-spektren von carotinoiden. Z Phys. Chem. (N F) 15 (1), 342–346. doi:10.1515/zpch-1932-1527
Evans, C. L., Potma, E. O., Puoris' haag, M., Côté, D., Lin, C. P., and Xie, X. S. (2005). Chemical imaging of tissue in vivo with video-rate coherent anti-Stokes Raman scattering microscopy. Proc. Natl. Acad. Sci. U.S.A. 102 (46), 16807–16812. doi:10.1073/pnas.0508282102
Favre-Bulle, I. A., Stilgoe, A. B., Rubinsztein-Dunlop, H., and Scott, E. K. (2017). Optical trapping of otoliths drives vestibular behaviours in larval zebrafish. Nat. Commun. 8 (1), 630. doi:10.1038/s41467-017-00713-2
Folick, A., Min, W., and Wang, M. C. (2011). Label-free imaging of lipid dynamics using coherent anti-Stokes Raman scattering (CARS) and stimulated Raman scattering (SRS) microscopy. Curr. Opin. Genet. Dev. 21 (5), 585–590. doi:10.1016/j.gde.2011.09.003
Fröhlich, J., and König, H. (2000). New techniques for isolation of single prokaryotic cells. FEMS Microbiol. Rev. 24 (5), 567–572. doi:10.1111/j.1574-6976.2000.tb00558.x
Gill, D., Kilponen, R., and Rimai, L. (1970). Resonance Raman scattering of laser radiation by vibrational modes of carotenoid pigment molecules in intact plant tissues. Nature 227 (5259), 743–744. doi:10.1038/227743a0
Hamada, K., Fujita, K., Smith, N. I., Kobayashi, M., Inouye, Y., and Kawata, S. (2008). Raman microscopy for dynamic molecular imaging of living cells. J. Biomed. Opt. 13 (4), 1. 044027-044027-044024. doi:10.1117/1.2952192
Hatzenpichler, R., Krukenberg, V., Spietz, R. L., and Jay, Z. J. (2020). Next-generation physiology approaches to study microbiome function at single cell level. Nat. Rev. Microbiol. 18 (4), 241–256. doi:10.1038/s41579-020-0323-1
He, Y., Wang, X., Ma, B., and Xu, J. (2019). Ramanome technology platform for label-free screening and sorting of microbial cell factories at single-cell resolution. Biotechnol. Adv. 37 (6), 107388. doi:10.1016/j.biotechadv.2019.04.010
Hiramatsu, K., Ideguchi, T., Yonamine, Y., Lee, S., Luo, Y., Hashimoto, K., et al. (2019). High-throughput label-free molecular fingerprinting flow cytometry. Sci. Adv. 5 (1), eaau0241. doi:10.1126/sciadv.aau0241
Høgset, H., Horgan, C. C., Armstrong, J. P., Bergholt, M. S., Torraca, V., Chen, Q., et al. (2020). In vivo biomolecular imaging of zebrafish embryos using confocal Raman spectroscopy. Nat. Commun. 11 (1), 6172. doi:10.1038/s41467-020-19827-1
Hsu, C.-C., Xu, J., Brinkhof, B., Wang, H., Cui, Z., Huang, W. E., et al. (2020). A single-cell Raman-based platform to identify developmental stages of human pluripotent stem cell-derived neurons. Proc. Natl. Acad. Sci. U.S.A. 117 (31), 18412–18423. doi:10.1073/pnas.2001906117
Huang, W. E., Li, M., Jarvis, R. M., Goodacre, R., and Banwart, S. A. (2010). Shining light on the microbial world: the application of Raman microspectroscopy. Adv. Appl. Microbiol. 70, 153–186. doi:10.1016/S0065-2164(10)70005-8
Huang, W. E., Song, Y., and Xu, J. (2015). Single cell biotechnology to shed a light on biological ‘dark matter’in nature. Microb. Biotechnol. 8 (1), 15–16. doi:10.1111/1751-7915.12249
Huang, W. E., Ward, A. D., and Whiteley, A. S. (2009). Raman tweezers sorting of single microbial cells. Environ. Microbiol. Rep. 1 (1), 44–49. doi:10.1111/j.1758-2229.2008.00002.x
Hutter, K.-J., and Eipel, H. (1979). Microbial determinations by flow cytometry. Microbiology 113 (2), 369–375. doi:10.1099/00221287-113-2-369
Huys, G. R., and Raes, J. (2018). Go with the flow or solitary confinement: a look inside the single-cell toolbox for isolation of rare and uncultured microbes. Curr. Opin. Microbiol. 44, 1–8. doi:10.1016/j.mib.2018.05.002
Hwang, B., Lee, J. H., and Bang, D. (2018). Single-cell RNA sequencing technologies and bioinformatics pipelines. Exp. Mol. Med. 50 (8), 1–14. doi:10.1038/s12276-018-0071-8
Jehlička, J., Edwards, H. G., and Oren, A. (2014). Raman spectroscopy of microbial pigments. Appl. Environ. Microbiol. 80 (11), 3286–3295. doi:10.1128/AEM.00699-14
Jensen, E. C. (2012). Use of fluorescent probes: their effect on cell biology and limitations. Anat. Rec. 295 (12), 2031–2036. doi:10.1002/ar.22602
Jing, X., Gou, H., Gong, Y., Su, X., Xu, L., Ji, Y., et al. (2018). Raman-activated cell sorting and metagenomic sequencing revealing carbon-fixing bacteria in the ocean. Environ. Microbiol. 20 (6), 2241–2255. doi:10.1111/1462-2920.14268
Laerum, O. D., and Farsund, T. (1981). Clinical application of flow cytometry: a review. Cytometry 2 (1), 1–13. doi:10.1002/cyto.990020102
Lasken, R. S. (2012). Genomic sequencing of uncultured microorganisms from single cells. Nat. Rev. Microbiol. 10 (9), 631–640. doi:10.1038/nrmicro2857
Lau, A. Y., Lee, L. P., and Chan, J. W. (2008). An integrated optofluidic platform for Raman-activated cell sorting. Lab. Chip 8 (7), 1116–1120. doi:10.1039/b803598a
Lee, K. S., Palatinszky, M., Pereira, F. C., Nguyen, J., Fernandez, V. I., Mueller, A. J., et al. (2019). An automated Raman-based platform for the sorting of live cells by functional properties. Nat. Microbiol. 4 (6), 1035–1048. doi:10.1038/s41564-019-0394-9
Li, H.-Z., Bi, Q.-f., Yang, K., Zheng, B.-X., Pu, Q., and Cui, L. (2019). D2O-isotope-labeling approach to probing phosphate-solubilizing bacteria in complex soil communities by single-cell Raman spectroscopy. Anal. Chem. 91 (3), 2239–2246. doi:10.1021/acs.analchem.8b04820
Li, J., Zhang, D., Li, B., Luo, C., and Zhang, G. (2022). Identifying the active phenanthrene degraders and characterizing their metabolic activities at the single-cell level by the combination of magnetic-nanoparticle-mediated isolation, stable-isotope probing, and Raman-activated cell sorting (MMI–SIP–RACS). Environ. Sci. Technol. 56 (4), 2289–2299. doi:10.1021/acs.est.1c04952
Li, J., Zhang, D., Luo, C., Li, B., and Zhang, G. (2023). In situ discrimination and cultivation of active degraders in soils by genome-directed cultivation assisted by SIP-Raman-activated cell sorting. Environ. Sci. Technol. 57 (44), 17087–17098. doi:10.1021/acs.est.3c04247
Li, M., and Anand, R. K. (2018). Cellular dielectrophoresis coupled with single-cell analysis. Anal. Bioanal. Chem. 410, 2499–2515. doi:10.1007/s00216-018-0896-y
Li, M., Canniffe, D. P., Jackson, P. J., Davison, P. A., FitzGerald, S., Dickman, M. J., et al. (2012a). Rapid resonance Raman microspectroscopy to probe carbon dioxide fixation by single cells in microbial communities. ISME J. 6 (4), 875–885. doi:10.1038/ismej.2011.150
Li, M., Xu, J., Romero-Gonzalez, M., Banwart, S. A., and Huang, W. E. (2012b). Single cell Raman spectroscopy for cell sorting and imaging. Curr. Opin. Biotechnol. 23 (1), 56–63. doi:10.1016/j.copbio.2011.11.019
Liang, P., Liu, B., Wang, Y., Liu, K., Zhao, Y., Huang, W. E., et al. (2022). Isolation and culture of single microbial cells by laser ejection sorting technology. Appl. Environ. Microbiol. 88 (3), 01165211–e201121. doi:10.1128/aem.01165-21
Lindley, M., Gala de Pablo, J., Peterson, W., Isozaki, A., Hiramatsu, K., and Goda, K. (2022). High-throughput Raman-activated cell sorting in the fingerprint region. Adv. Mat. Technol. 7 (10), 2101567. doi:10.1002/admt.202101567
Liu, K., Zhao, Q., Li, B., and Zhao, X. (2022). Raman spectroscopy: a novel technology for gastric cancer diagnosis. Front. Bioeng. Biotechnol. 10, 856591. doi:10.3389/fbioe.2022.856591
Liu, Y., Cruz-Morales, P., Zargar, A., Belcher, M. S., Pang, B., Englund, E., et al. (2021). Biofuels for a sustainable future. Cell. 184 (6), 1636–1647. doi:10.1016/j.cell.2021.01.052
Lo Celso, C., Fleming, H. E., Wu, J. W., Zhao, C. X., Miake-Lye, S., Fujisaki, J., et al. (2009). Live-animal tracking of individual haematopoietic stem/progenitor cells in their niche. Nature 457 (7225), 92–96. doi:10.1038/nature07434
Lyu, Y., Yuan, X., Glidle, A., Fu, Y., Furusho, H., Yang, T., et al. (2020). Automated Raman based cell sorting with 3D microfluidics. Lab. Chip 20 (22), 4235–4245. doi:10.1039/D0LC00679C
MacLaughlin, C. M., Mullaithilaga, N., Yang, G., Ip, S. Y., Wang, C., and Walker, G. C. (2013). Surface-enhanced Raman scattering dye-labeled Au nanoparticles for triplexed detection of leukemia and lymphoma cells and SERS flow cytometry. Langmuir 29 (6), 1908–1919. doi:10.1021/la303931c
McIlvenna, D., Huang, W. E., Davison, P., Glidle, A., Cooper, J., and Yin, H. (2016). Continuous cell sorting in a flow based on single cell resonance Raman spectra. Lab. Chip 16 (8), 1420–1429. doi:10.1039/C6LC00251J
Merlin, J. C. (1985). Resonance Raman spectroscopy of carotenoids and carotenoid-containing systems. Pure Appl. Chem. 57 (5), 785–792. doi:10.1351/pac198557050785
Mermans, F., Mattelin, V., Van den Eeckhoudt, R., García-Timermans, C., Van Landuyt, J., Guo, Y., et al. (2023). Opportunities in optical and electrical single-cell technologies to study microbial ecosystems. Front. Microbiol. 14, 1233705. doi:10.3389/fmicb.2023.1233705
Mitra, R., Chao, O., Urasaki, Y., Goodman, O. B., and Le, T. T. (2012). Detection of lipid-rich prostate circulating tumour cells with coherent anti-Stokes Raman scattering microscopy. BMC Cancer 12, 540–549. doi:10.1186/1471-2407-12-540
Müller, S., and Nebe-von-Caron, G. (2010). Functional single-cell analyses: flow cytometry and cell sorting of microbial populations and communities. FEMS Microbiol. Rev. 34 (4), 554–587. doi:10.1111/j.1574-6976.2010.00214.x
Niculescu, A.-G., Chircov, C., Bîrcă, A. C., and Grumezescu, A. M. (2021). Fabrication and applications of microfluidic devices: a review. Int. J. Mol. Sci. 22 (4), 2011. doi:10.3390/ijms22042011
Nielsen, H. B., Almeida, M., Juncker, A. S., Rasmussen, S., Li, J., Sunagawa, S., et al. (2014). Identification and assembly of genomes and genetic elements in complex metagenomic samples without using reference genomes. Nat. Biotechnol. 32 (8), 822–828. doi:10.1038/nbt.2939
Nitta, N., Iino, T., Isozaki, A., Yamagishi, M., Kitahama, Y., Sakuma, S., et al. (2020). Raman image-activated cell sorting. Nat. Commun. 11 (1), 3452. doi:10.1038/s41467-020-17285-3
Ocasio, J. K., Babcock, B., Malawsky, D., Weir, S. J., Loo, L., Simon, J. M., et al. (2019). scRNA-seq in medulloblastoma shows cellular heterogeneity and lineage expansion support resistance to SHH inhibitor therapy. Nat. Commun. 10 (1), 5829. doi:10.1038/s41467-019-13657-6
Paau, A. S., Cowles, J. R., and Oro, J. (1977). Flow-microfluorometric analysis of Escherichia coli, Rhizobium meliloti, and Rhizobium japonicum at different stages of the growth cycle. Can. J. Microbiol. 23 (9), 1165–1169. doi:10.1139/m77-175
Pätzold, R., Keuntje, M., Theophile, K., Müller, J., Mielcarek, E., Ngezahayo, A., et al. (2008). In situ mapping of nitrifiers and anammox bacteria in microbial aggregates by means of confocal resonance Raman microscopy. J. Microbiol. Methods 72 (3), 241–248. doi:10.1016/j.mimet.2007.12.003
Petry, R., Schmitt, M., and Popp, J. (2003). Raman spectroscopy—a prospective tool in the life sciences. Chemphyschem 4 (1), 14–30. doi:10.1002/cphc.200390004
Pilat, Z., Ježek, J., Šerý, M., Trtilek, M., Nedbal, L., and Zemanek, P. (2013). Optical trapping of microalgae at 735–1064 nm: photodamage assessment. J. Photochem. Photobiol. B, Biol. 121, 27–31. doi:10.1016/j.jphotobiol.2013.02.006
Puppels, G., De Mul, F., Otto, C., Greve, J., Robert-Nicoud, M., Arndt-Jovin, D., et al. (1990). Studying single living cells and chromosomes by confocal Raman microspectroscopy. Nature 347 (6290), 301–303. doi:10.1038/347301a0
Raman, C. V., and Krishnan, K. S. (1928). A new type of secondary radiation. Nature 121 (3048), 501–502. doi:10.1038/121501c0
Rinke, C., Schwientek, P., Sczyrba, A., Ivanova, N. N., Anderson, I. J., Cheng, J.-F., et al. (2013). Insights into the phylogeny and coding potential of microbial dark matter. Nature 499 (7459), 431–437. doi:10.1038/nature12352
Rubbens, P., and Props, R. (2021). Computational analysis of microbial flow cytometry data. mSystems 6 (1), e00895-20–e00820. doi:10.1128/msystems.00895-20
Saar, B. G., Freudiger, C. W., Reichman, J., Stanley, C. M., Holtom, G. R., and Xie, X. S. (2010). Video-rate molecular imaging in vivo with stimulated Raman scattering. science 330 (6009), 1368–1370. doi:10.1126/science.1197236
Schroder, U.-C., Ramoji, A., Glaser, U., Sachse, S., Leiterer, C., Csaki, A., et al. (2013). Combined dielectrophoresis–Raman setup for the classification of pathogens recovered from the urinary tract. Anal. Chem. 85 (22), 10717–10724. doi:10.1021/ac4021616
Sebba, D. S., Watson, D. A., and Nolan, J. P. (2009). High throughput single nanoparticle spectroscopy. ACS Nano 3 (6), 1477–1484. doi:10.1021/nn9003346
Serra, P., and Piqué, A. (2019). Laser-induced forward transfer: fundamentals and applications. Adv. Mat. Technol. 4 (1), 1800099. doi:10.1002/admt.201800099
Shang, L., Liang, P., Xu, L., Xue, Y., Liu, K., Wang, Y., et al. (2023). Stable SERS detection of lactobacillus fermentum using optical tweezers in a microfluidic environment. Anal. Chem. 96 (1), 248–255. doi:10.1021/acs.analchem.3c03852
Sieracki, M. E., Cucci, T. L., and Nicinski, J. (1999). Flow cytometric analysis of 5-cyano-2, 3-ditolyl tetrazolium chloride activity of marine bacterioplankton in dilution cultures. Appl. Environ. Microbiol. 65 (6), 2409–2417. doi:10.1128/AEM.65.6.2409-2417.1999
Singh, A., and Barnard, T. G. (2021). A possible flow cytometry-based viability and vitality assessment protocol for pathogenic Vibrio cholerae O1 and O139 postexposure to simulated gastric fluid. Biomed. Res. Int. 2021, 1–11. doi:10.1155/2021/5551845
Song, Y., Kaster, A. K., Vollmers, J., Song, Y., Davison, P. A., Frentrup, M., et al. (2017). Single-cell genomics based on Raman sorting reveals novel carotenoid-containing bacteria in the Red Sea. Microb. Biotechnol. 10 (1), 125–137. doi:10.1111/1751-7915.12420
Song, Y., Yin, H., and Huang, W. E. (2016). Raman activated cell sorting. Curr. Opin. Chem. Biol. 33, 1–8. doi:10.1016/j.cbpa.2016.04.002
Spiller, D. G., Wood, C. D., Rand, D. A., and White, M. R. (2010). Measurement of single-cell dynamics. Nature 465 (7299), 736–745. doi:10.1038/nature09232
Spiro, T. G., and Strekas, T. C. (1972). Resonance Raman spectra of hemoglobin and cytochrome c: inverse polarization and vibronic scattering. Proc. Natl. Acad. Sci. U.S.A. 69 (9), 2622–2626. doi:10.1073/pnas.69.9.2622
Suhito, I. R., Han, Y., Min, J., Son, H., and Kim, T.-H. (2018). In situ label-free monitoring of human adipose-derived mesenchymal stem cell differentiation into multiple lineages. Biomaterials 154, 223–233. doi:10.1016/j.biomaterials.2017.11.005
Sun, C., Wang, H., Ma, Q., Chen, C., Yue, J., Li, B., et al. (2021). Time-course single-cell RNA sequencing reveals transcriptional dynamics and heterogeneity of limbal stem cells derived from human pluripotent stem cells. Cell. Biosci. 11 (1), 24–12. doi:10.1186/s13578-021-00541-4
Surendran, A. N., Zhou, R., and Lin, Y. (2021). Microfluidic devices for magnetic separation of biological particles: a review. J. Med. Device 15 (2), 024001. doi:10.1115/1.4048912
Suzuki, Y., Kobayashi, K., Wakisaka, Y., Deng, D., Tanaka, S., Huang, C.-J., et al. (2019). Label-free chemical imaging flow cytometry by high-speed multicolor stimulated Raman scattering. Proc. Natl. Acad. Sci. U.S.A. 116 (32), 15842–15848. doi:10.1073/pnas.1902322116
Swan, B. K., Martinez-Garcia, M., Preston, C. M., Sczyrba, A., Woyke, T., Lamy, D., et al. (2011). Potential for chemolithoautotrophy among ubiquitous bacteria lineages in the dark ocean. Science 333 (6047), 1296–1300. doi:10.1126/science.1203690
Vítek, P., Osterrothová, K., and Jehlička, J. (2009). Beta-carotene—a possible biomarker in the Martian evaporitic environment: Raman micro-spectroscopic study. Planet. Space Sci. 57 (4), 454–459. doi:10.1016/j.pss.2008.06.001
Wagner, M. (2009). Single-cell ecophysiology of microbes as revealed by Raman microspectroscopy or secondary ion mass spectrometry imaging. Annu. Rev. Microbiol. 63, 411–429. doi:10.1146/annurev.micro.091208.073233
Wagner, W. D. (1986). Raman excitation profiles from pigments in vivo. J. Raman Spectrosc. 17 (1), 51–53. doi:10.1002/jrs.1250170111
Wang, C., and Yu, C. (2015). Analytical characterization using surface-enhanced Raman scattering (SERS) and microfluidic sampling. Nanotechnology 26 (9), 092001. doi:10.1088/0957-4484/26/9/092001
Wang, X., Ren, L., Diao, Z., He, Y., Zhang, J., Liu, M., et al. (2023). Robust spontaneous Raman flow cytometry for single-cell metabolic phenome profiling via pDEP-DLD-RFC. Adv. Sci. 10, 2207497. doi:10.1002/advs.202207497
Wang, X., Ren, L., Su, Y., Ji, Y., Liu, Y., Li, C., et al. (2017). Raman-activated droplet sorting (RADS) for label-free high-throughput screening of microalgal single-cells. Anal. Chem. 89 (22), 12569–12577. doi:10.1021/acs.analchem.7b03884
Wang, Y., Huang, W. E., Cui, L., and Wagner, M. (2016). Single cell stable isotope probing in microbiology using Raman microspectroscopy. Curr. Opin. Biotechnol. 41, 34–42. doi:10.1016/j.copbio.2016.04.018
Wang, Y., Xu, J., Kong, L., Li, B., Li, H., Huang, W. E., et al. (2020). Raman-activated sorting of antibiotic-resistant bacteria in human gut microbiota. Environ. Microbiol. 22 (7), 2613–2624. doi:10.1111/1462-2920.14962
Watanabe, K., Palonpon, A. F., Smith, N. I., Chiu, L.-d., Kasai, A., Hashimoto, H., et al. (2015). Structured line illumination Raman microscopy. Nat. Commun. 6 (1), 10095. doi:10.1038/ncomms10095
Watson, D. A., Brown, L. O., Gaskill, D. F., Naivar, M., Graves, S. W., Doorn, S. K., et al. (2008). A flow cytometer for the measurement of Raman spectra. Cytom. A 73 (2), 119–128. doi:10.1002/cyto.a.20520
Xie, C., Chen, D., and Li, Y.-q. (2005a). Raman sorting and identification of single living micro-organisms with optical tweezers. Opt. Lett. 30 (14), 1800–1802. doi:10.1364/OL.30.001800
Xie, C., Mace, J., Dinno, M., Li, Y., Tang, W., Newton, R., et al. (2005b). Identification of single bacterial cells in aqueous solution using confocal laser tweezers Raman spectroscopy. Anal. Chem. 77 (14), 4390–4397. doi:10.1021/ac0504971
Xu, J., Yu, T., Zois, C. E., Cheng, J.-X., Tang, Y., Harris, A. L., et al. (2021). Unveiling cancer metabolism through spontaneous and coherent Raman spectroscopy and stable isotope probing. Cancers 13 (7), 1718. doi:10.3390/cancers13071718
Yan, S., Qiu, J., Guo, L., Li, D., Xu, D., and Liu, Q. (2021). Development overview of Raman-activated cell sorting devoted to bacterial detection at single-cell level. Appl. Microbiol. Biotechnol. 105, 1315–1331. doi:10.1007/s00253-020-11081-1
Yu, M., Stott, S., Toner, M., Maheswaran, S., and Haber, D. A. (2011). Circulating tumor cells: approaches to isolation and characterization. J. Cell. Biol. 192 (3), 373–382. doi:10.1083/jcb.201010021
Yuan, X., Song, Y., Song, Y., Xu, J., Wu, Y., Glidle, A., et al. (2018). Effect of laser irradiation on cell function and its implications in Raman spectroscopy. Appl. Environ. Microbiol. 84 (8), e02508-17–e02517. doi:10.1128/AEM.02508-17
Zenobi, R. (2013). Single-cell metabolomics: analytical and biological perspectives. Science 342 (6163), 1243259. doi:10.1126/science.1243259
Zhang, C., Huang, K.-C., Rajwa, B., Li, J., Yang, S., Lin, H., et al. (2017). Stimulated Raman scattering flow cytometry for label-free single-particle analysis. Optica 4 (1), 103–109. doi:10.1364/OPTICA.4.000103
Zhang, C., Zhang, D., and Cheng, J.-X. (2015a). Coherent Raman scattering microscopy in biology and medicine. Annu. Rev. Biomed. Eng. 17, 415–445. doi:10.1146/annurev-bioeng-071114-040554
Zhang, D., Wang, P., Slipchenko, M. N., and Cheng, J.-X. (2014). Fast vibrational imaging of single cells and tissues by stimulated Raman scattering microscopy. Acc. Chem. Res. 47 (8), 2282–2290. doi:10.1021/ar400331q
Zhang, P., Ren, L., Zhang, X., Shan, Y., Wang, Y., Ji, Y., et al. (2015b). Raman-activated cell sorting based on dielectrophoretic single-cell trap and release. Anal. Chem. 87 (4), 2282–2289. doi:10.1021/ac503974e
Keywords: single-cell research, Raman spectroscopy, Raman cell sorting, Raman signal enhancement, genomics analysis, gene sequencing
Citation: Tang X, Wu Q, Shang L, Liu K, Ge Y, Liang P and Li B (2024) Raman cell sorting for single-cell research. Front. Bioeng. Biotechnol. 12:1389143. doi: 10.3389/fbioe.2024.1389143
Received: 21 February 2024; Accepted: 08 April 2024;
Published: 20 May 2024.
Edited by:
J. Jayne Wu, The University of Tennessee, Knoxville, United StatesReviewed by:
Yaxiaer Yalikun, Nara Institute of Science and Technology (NAIST), JapanCopyright © 2024 Tang, Wu, Shang, Liu, Ge, Liang and Li. This is an open-access article distributed under the terms of the Creative Commons Attribution License (CC BY). The use, distribution or reproduction in other forums is permitted, provided the original author(s) and the copyright owner(s) are credited and that the original publication in this journal is cited, in accordance with accepted academic practice. No use, distribution or reproduction is permitted which does not comply with these terms.
*Correspondence: Peng Liang, bGlhbmdwZW5nMUBjaW9tcC5hYy5jbg==; Bei Li, YmVpbGlAY2lvbXAuYWMuY24=
Disclaimer: All claims expressed in this article are solely those of the authors and do not necessarily represent those of their affiliated organizations, or those of the publisher, the editors and the reviewers. Any product that may be evaluated in this article or claim that may be made by its manufacturer is not guaranteed or endorsed by the publisher.
Research integrity at Frontiers
Learn more about the work of our research integrity team to safeguard the quality of each article we publish.